This article was automatically generated by the NFC Market Live AI analysis system. (Updated: 2026-11-13 22:48 JST)
📄 Primary Source
Statistics Canada
https://www150.statcan.gc.ca/n1/daily-quotidien/261113/dq261113b-eng.htm
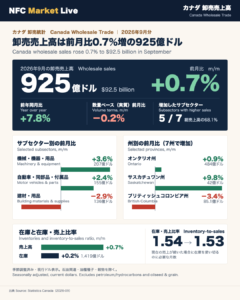
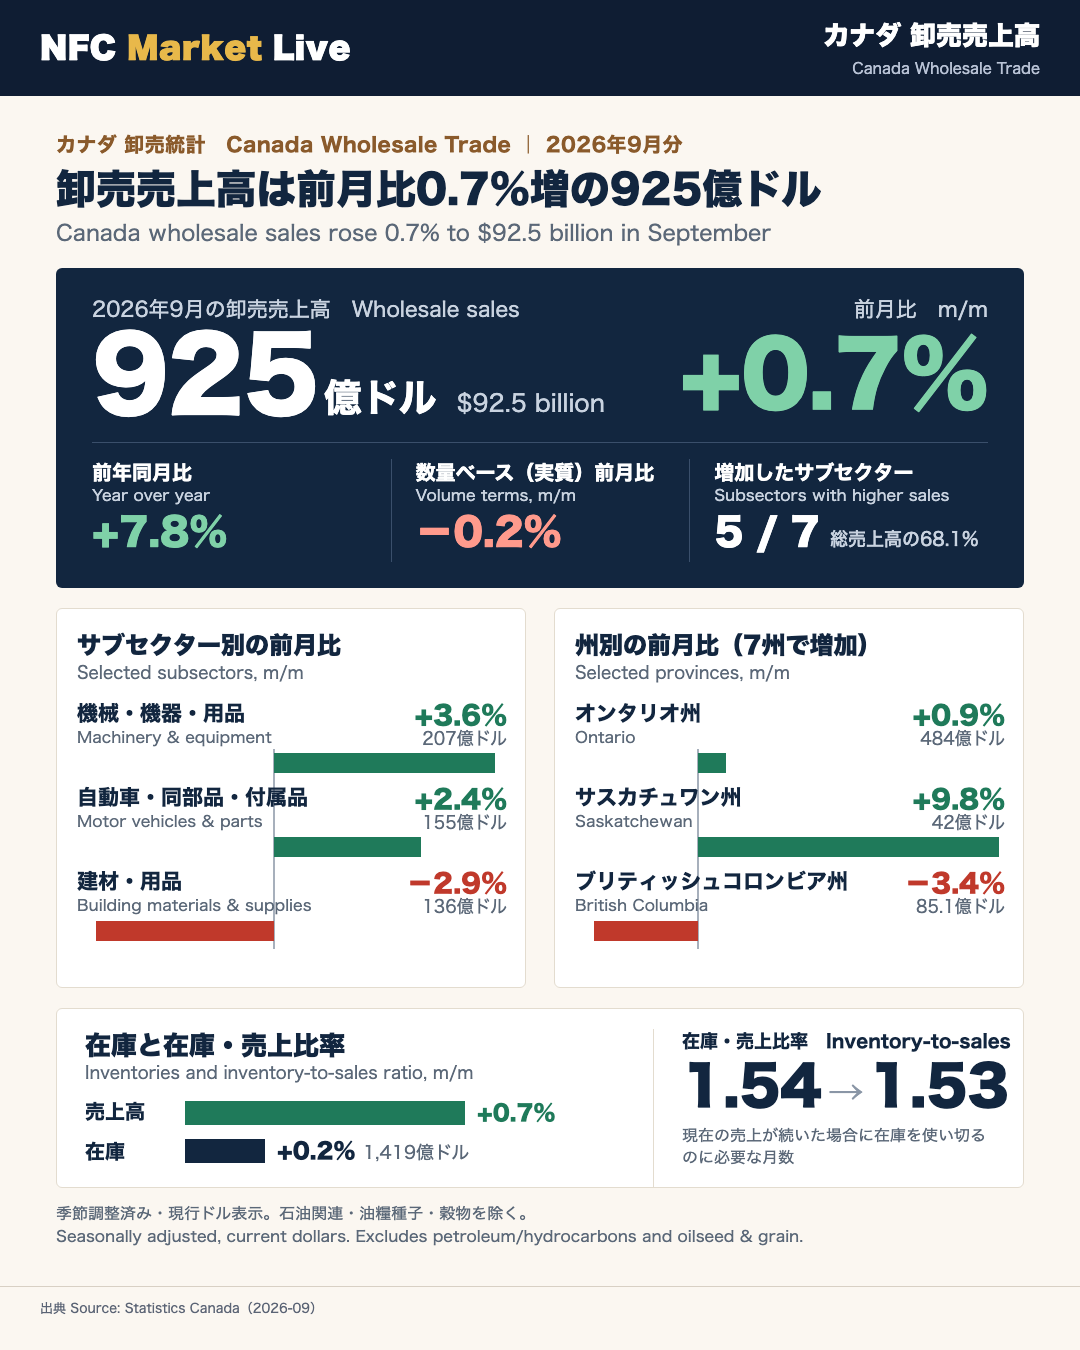
📊 Statistics Canada released its September 2026 wholesale trade data on November 13. Wholesale sales, excluding petroleum, petroleum products and other hydrocarbons and excluding oilseed and grain, rose 0.7% to $92.5 billion.
📈 Sales increased in five of the seven subsectors, which together account for 68.1% of total wholesale sales. The largest gain came from machinery, equipment and supplies (+3.6% to $20.7 billion), led by computer and communications equipment (+10.0% to $6.5 billion), the largest increase for that group since March, which StatCan attributes to new product releases. Motor vehicles and parts rose 2.4% to $15.5 billion. Building material and supplies fell 2.9% to $13.6 billion after eight straight monthly gains. Sales were 7.8% higher than a year earlier.
📉 In volume terms, wholesale sales declined 0.2%.
🗺️ Seven provinces reported higher sales, led by Ontario (+0.9% to $48.4 billion) and Saskatchewan (+9.8% to $4.2 billion).
📦 Inventories rose 0.2% to $141.9 billion, and the inventory-to-sales ratio edged down from 1.54 to 1.53.
🗓️ Third-quarter sales rose 1.5% to $277.5 billion. Next: the October advance estimate on November 25 and the October release on December 15. All figures are seasonally adjusted.
総括:9月の卸売売上高は0.7%増の925億ドル
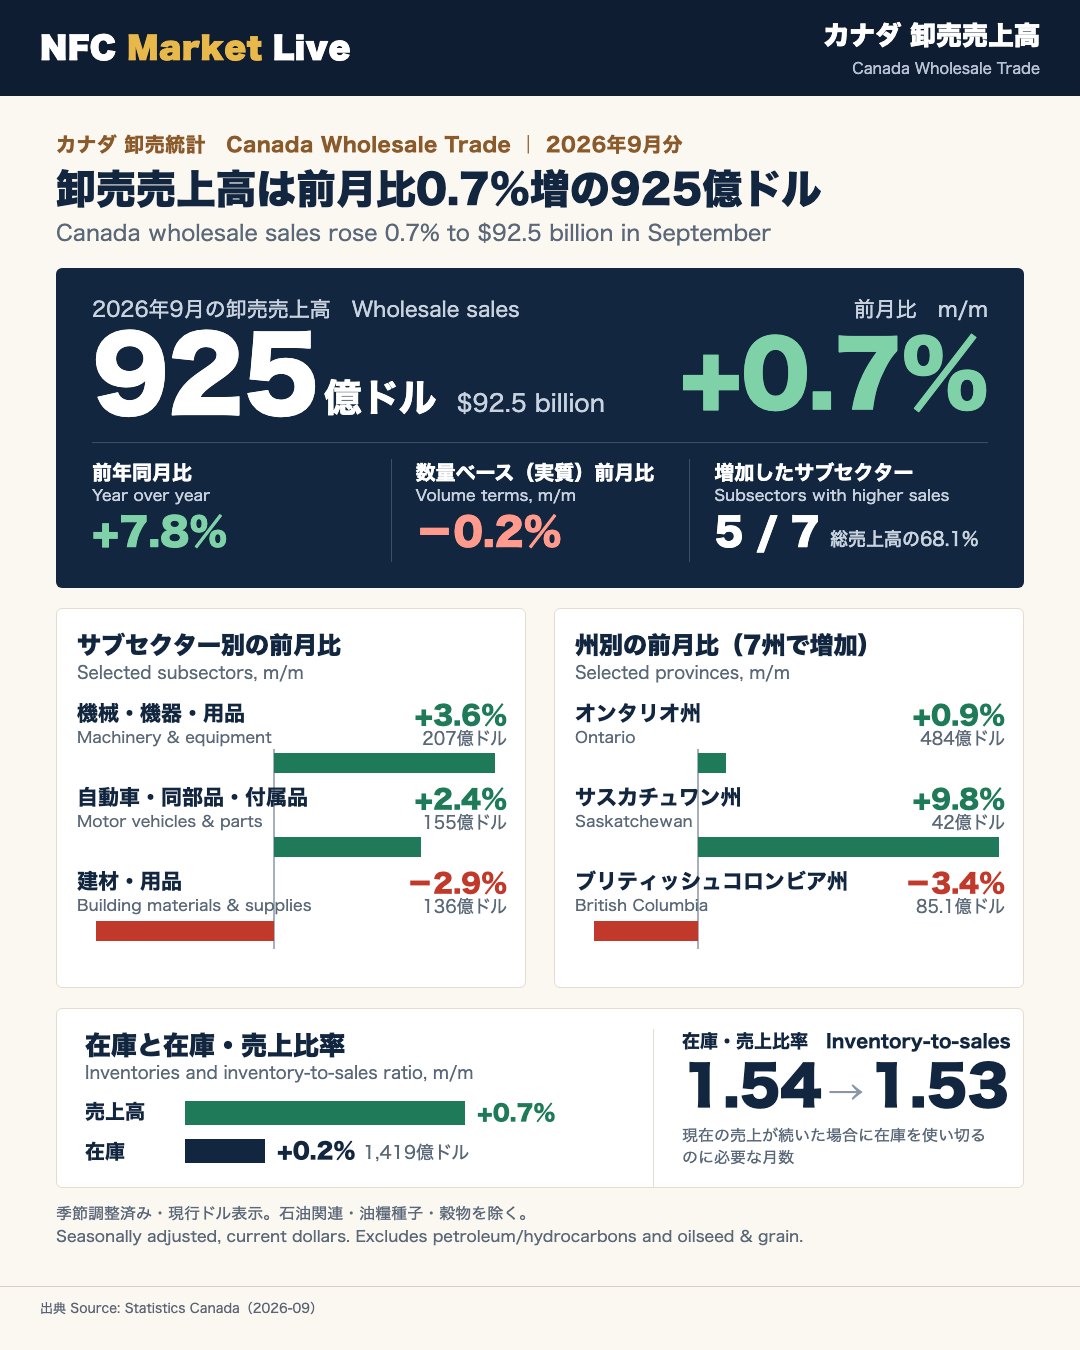
Wholesale sales up 0.7% to $92.5 billion in September
Statistics Canada, the national statistical agency, published its September 2026 wholesale trade results on November 13. The headline series excludes petroleum, petroleum products and other hydrocarbons, and excludes oilseed and grain.
- Monthly change: +0.7% to $92.5 billion
- Breadth: sales rose in five of seven subsectors, which together represent 68.1% of total wholesale sales
- Year over year: +7.8%
- Volume: -0.2%
“Wholesale sales … rose 0.7% to $92.5 billion in September.”
Why the nominal-versus-volume gap matters
The headline figure is in current dollars. The volume measure deflates those dollars with relevant price indexes, using a chained (2012) Fisher volume index. The release does not explain why nominal sales rose while volume slipped. Price effects may be part of the picture, but the release gives no price-index figures, so this is only a possibility. Third-quarter volume was also down 0.2%.
Context for non-Canadian readers
Wholesale trade measures sales by firms that buy goods from producers and sell them to retailers and other businesses. It sits between manufacturing and retail. The US Census Bureau publishes a comparable wholesale series. The Canadian survey covers the NAICS wholesale sector but excludes business-to-business electronic markets and agents and brokers (NAICS 419).
Caveats
All data are seasonally adjusted and may be revised, sometimes substantially for the most recent months. The release makes no statement on monetary policy or the Canadian dollar.
Next
An advance estimate for October is due November 25, followed by the full October release on December 15.
サブセクター別:機械・自動車が増加、建材は減少
Machinery and autos lead; building materials pull back
Machinery, equipment and supplies: +3.6% to $20.7 billion
This was the largest subsector gain. It was driven by the computer and communications equipment and supplies industry group, up 10.0% to $6.5 billion, the biggest increase for that group since March. Statistics Canada says this reflects new product releases.
Motor vehicles and parts: +2.4% to $15.5 billion
Sales rose in all three industry groups. The motor vehicle group gained 2.7% to $12.5 billion, its seventh increase since the start of the year.
Building material and supplies: -2.9% to $13.6 billion
This ended eight consecutive monthly gains. The drop was concentrated in lumber, millwork, hardware and other building supplies (-6.6% to $6.2 billion).
| Subsector | MoM | Level |
|---|---|---|
| Machinery, equipment & supplies | +3.6% | $20.7B |
| Motor vehicles & parts | +2.4% | $15.5B |
| Building materials & supplies | -2.9% | $13.6B |
Reading the numbers
The two leading gains each lean on one large industry group. The computer and communications jump is a single-month move that the agency ties to product launches, so it may not represent a lasting trend. Building materials, despite September’s decline, were still up 5.8% in the third quarter as a whole.
Context
Wholesale subsector data help show where demand is moving along the chain from producers to retailers. The release itself draws no conclusion about policy or the currency.
Next
The October advance estimate (November 25) and full release (December 15) will show whether these patterns continue.
州別:オンタリオとサスカチュワンが増加を主導
Seven provinces report higher sales; Ontario leads
The release states that seven provinces reported higher wholesale sales in September, led by Ontario and followed by Saskatchewan.
Ontario: +0.9% to $48.4 billion
Sales rose in four of seven subsectors. Machinery, equipment and supplies (+4.1% to $11.0 billion) drove the gain.
Saskatchewan: +9.8% to $4.2 billion
This was the second-largest provincial increase, with four of seven subsectors higher.
Other regional figures (from the release’s indicator tiles)
| Region | MoM | Level |
|---|---|---|
| Manitoba | +2.3% | $2.2B |
| Prince Edward Island | +2.5% | $0.14B |
| Alberta | +0.6% | $10.5B |
| Quebec | 0.0% | $15.6B |
| British Columbia | -3.4% | $8.5B |
| Nova Scotia | -1.6% | $1.35B |
| Newfoundland and Labrador | -2.2% | $0.53B |
Interpretation
Ontario is by far the largest wholesale market, so its +0.9% carries heavy weight in the national result. Saskatchewan’s percentage jump is large, but its level remains small relative to Ontario or Quebec. British Columbia’s -3.4% is the steepest decline among the larger provinces. The release does not explain the regional declines, so a one-month move should not be read as a trend.
Territorial figures are very small in dollar terms, so percentage changes swing widely (Nunavut +29.9%, Northwest Territories -15.8%).
Context
Canadian provincial data matter because the economy’s wholesale activity is concentrated in Ontario, Quebec, Alberta and British Columbia.
在庫と在庫・売上比率:在庫は小幅増、比率は1.53
Inventories up 0.2%; inventory-to-sales ratio edges down to 1.53
Wholesale inventories (excluding petroleum and hydrocarbons, oilseed and grain) rose 0.2% to $141.9 billion in September.
Where inventories rose
Inventories increased in three of the seven subsectors:
– Miscellaneous: +2.8% to $16.5 billion (largest)
– Motor vehicles and parts: +2.0% to $18.3 billion
The inventory-to-sales ratio
The ratio edged down from 1.54 to 1.53. Statistics Canada defines it as the time, in months, required to exhaust inventories if sales were to remain at their current levels.
| Item | MoM |
|---|---|
| Sales | +0.7% |
| Inventories | +0.2% |
| Inventory-to-sales ratio | 1.54 to 1.53 |
Interpretation
Because sales (+0.7%) grew faster than inventories (+0.2%), the ratio mechanically declined. This suggests stock build-up was not rapid in September. But the move is only 0.01, so on its own it says little about the direction of demand. Motor vehicles show both higher sales and higher inventories.
Context
Analysts watch this ratio because rising inventories relative to sales can indicate slower demand, while a falling ratio can indicate leaner stocks. US wholesale reports track a similar measure. The release does not link the ratio to monetary policy.
Next
The October data, due December 15, will show whether the ratio holds near 1.53. All series are seasonally adjusted and subject to revision.
7〜9月期のまとめと次回の公表予定
Third-quarter wholesale sales up 1.5% to $277.5 billion
According to the release, wholesale sales (excluding petroleum and hydrocarbons, oilseed and grain) rose 1.5% to $277.5 billion in the third quarter of 2026. Sales increased in four of the seven subsectors.
Biggest quarterly gains
- Building material and supplies: +5.8% to $41.5 billion
- Machinery, equipment and supplies: +3.1% to $60.8 billion
Year-over-year and volume
- Year over year: +7.8%, the same rate as in September alone
- Volume: -0.2%, also the same as September
| Period | Nominal change | Volume | YoY |
|---|---|---|---|
| September | +0.7% (MoM) | -0.2% | +7.8% |
| Q3 2026 | +1.5% (QoQ) | -0.2% | +7.8% |
Monthly versus quarterly picture
Building materials fell 2.9% in September but rose 5.8% across the quarter, among the strongest subsector gains. That shows why monthly moves are best read alongside the broader period. One pattern holds for both horizons: nominal sales are higher while volume is slightly lower. The release gives no explanation, so the reasons cannot be stated with confidence.
Context
Quarterly figures smooth out single-month swings and are useful when judging the underlying pace of wholesale activity. The release does not discuss monetary policy.
Upcoming releases
- October advance estimate: November 25
- October full data: December 15
All figures are seasonally adjusted and may be revised.
Disclaimer: This article is for informational purposes only. All investment decisions are made solely at your own risk.