This article was automatically generated by the NFC Market Live AI analysis system. (Updated: 2026-11-13 09:33 JST)
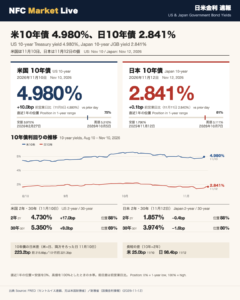
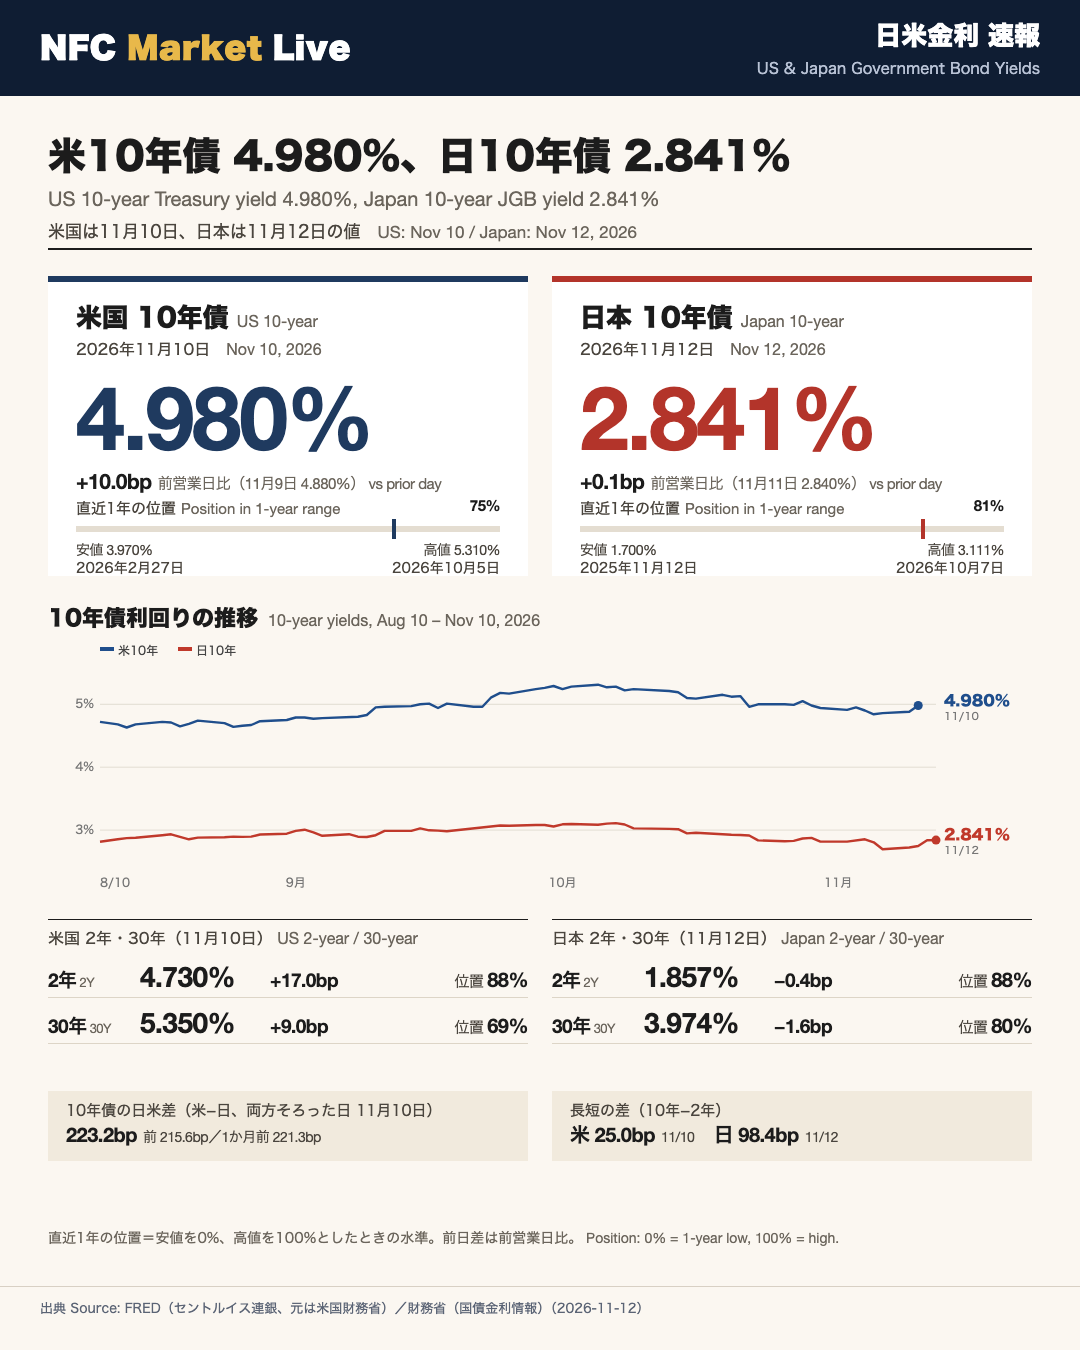
US and Japan government bond yields, latest readings. US Treasury data are as of November 10, 2026; Japanese government bond (JGB) data are as of November 12, 2026.
10-year yields (the focus):
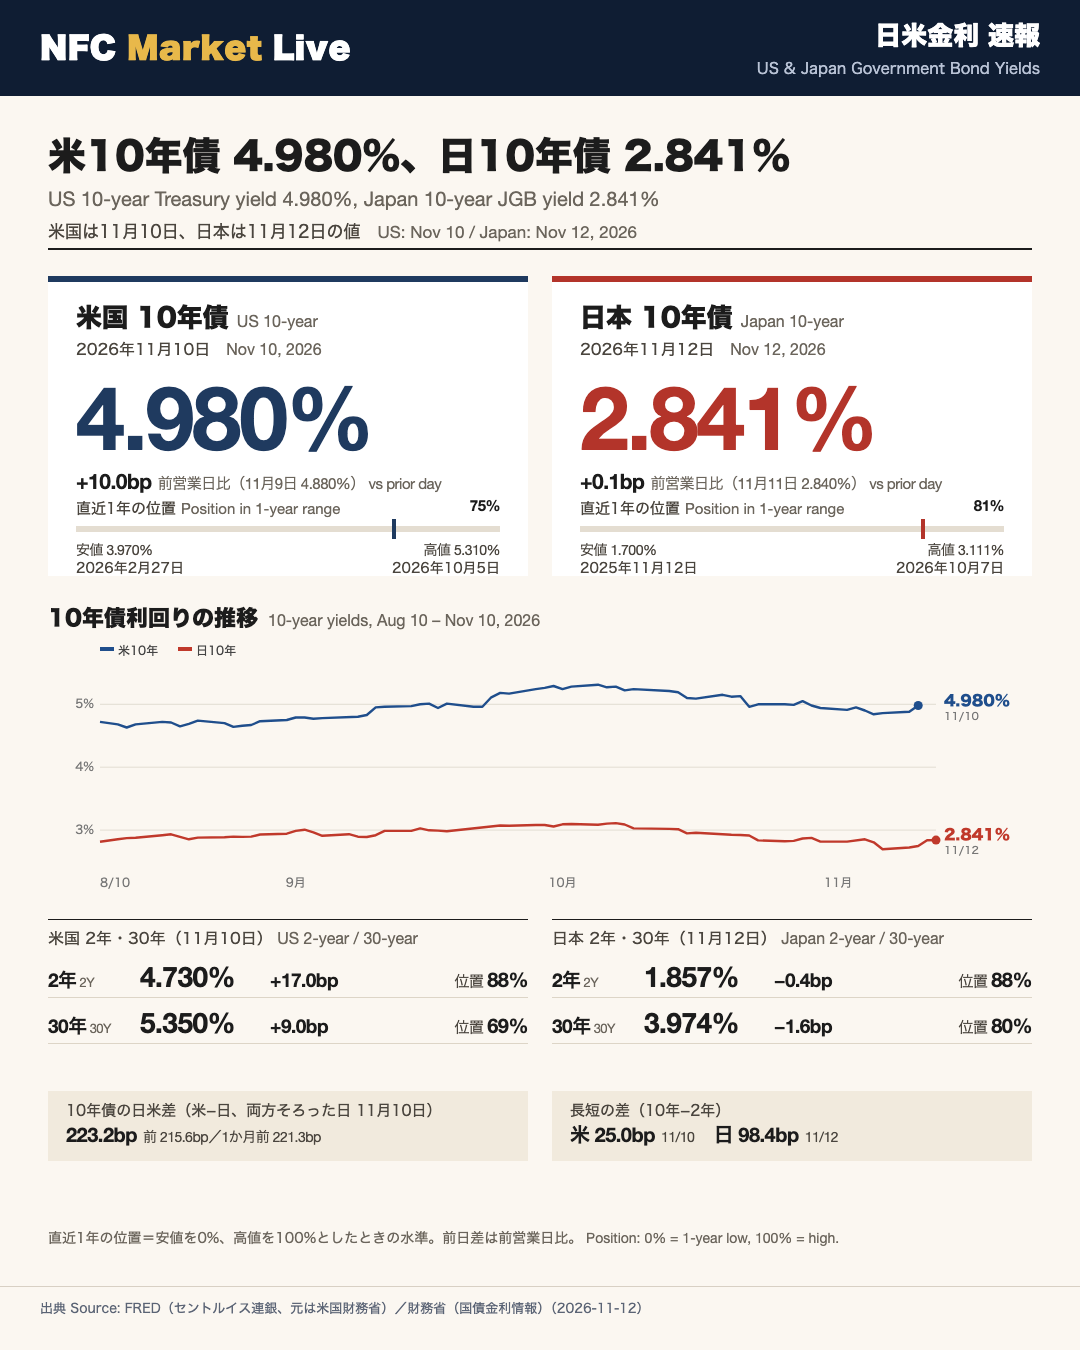
US 10-year: 4.980% on Nov 10, up 10.0bp from 4.880% on Nov 9. One month earlier: 5.240%. Position within the past year’s range: 75% (high 5.310% on Oct 5, 2026; low 3.970% on Feb 27, 2026).
Japan 10-year: 2.841% on Nov 12, up 0.1bp from 2.840% on Nov 11. One month earlier: 3.019%. Position within the past year’s range: 81% (high 3.111% on Oct 7, 2026; low 1.700% on Nov 12, 2025).
2-year and 30-year:
US 2-year 4.730% (+17.0bp, position 88%); US 30-year 5.350% (+9.0bp, position 69%), both Nov 10.
Japan 2-year 1.857% (-0.4bp, position 88%); Japan 30-year 3.974% (-1.6bp, position 80%), both Nov 12.
Side notes: the US-Japan 10-year gap (US minus Japan, on the latest day with both) was 223.2bp on Nov 10, versus 215.6bp on Nov 9. The 10-year minus 2-year spread was 25.0bp in the US (Nov 10; prior 32.0bp) and 98.4bp in Japan (Nov 12; prior 97.9bp).
Sources: FRED (St. Louis Fed, originally US Treasury), Ministry of Finance Japan.
米国債:10年債は4.980%(11月10日)
US Treasuries: 10-year at 4.980% (Nov 10, 2026)
The latest US Treasury readings are for November 10, 2026. The data come from FRED, the database of the Federal Reserve Bank of St. Louis; the underlying figures are published by the US Treasury. The 10-year yield, the focus of this bulletin, stood at 4.980%, up 10.0bp from 4.880% on November 9. A basis point (bp) is one hundredth of a percentage point.
| Maturity | Nov 10 | Prior day (Nov 9) | Daily change | One month earlier | Position in 1-yr range |
|---|---|---|---|---|---|
| 2-year | 4.730% | 4.560% | +17.0bp | 4.800% | 88% |
| 10-year | 4.980% | 4.880% | +10.0bp | 5.240% | 75% |
| 30-year | 5.350% | 5.260% | +9.0bp | 5.600% | 69% |
Position in range: 0% = the one-year low, 100% = the one-year high.
10-year in context
- One-year high: 5.310% (Oct 5, 2026)
- One-year low: 3.970% (Feb 27, 2026)
- The Nov 10 reading sits at 75% of that range.
Recent daily closes for the 10-year: 4.90% (Nov 4), 4.84% (Nov 5), 4.86% (Nov 6), 4.88% (Nov 9), 4.98% (Nov 10).
2-year and 30-year
The 2-year yield (4.730%) is at 88% of its one-year range (high 4.920% on Sep 28, 2026; low 3.380% on Feb 27, 2026). The 30-year (5.350%) is at 69% (high 5.670% on Oct 7, 2026; low 4.640% on Nov 26, 2025).
Note that US data run through Nov 10, while Japanese data in this bulletin run through Nov 12, so the dates differ.
日本国債:10年債は2.841%(11月12日)
Japanese Government Bonds: 10-year at 2.841% (Nov 12, 2026)
The latest JGB readings are for November 12, 2026, taken from the Japanese Ministry of Finance’s published government bond yield data. The 10-year yield, the focus of this bulletin, was 2.841%, up 0.1bp from 2.840% on November 11, essentially unchanged.
| Maturity | Nov 12 | Prior day (Nov 11) | Daily change | One month earlier | Position in 1-yr range |
|---|---|---|---|---|---|
| 2-year | 1.857% | 1.861% | -0.4bp | 1.928% | 88% |
| 10-year | 2.841% | 2.840% | +0.1bp | 3.019% | 81% |
| 30-year | 3.974% | 3.990% | -1.6bp | 4.064% | 80% |
Position in range: 0% = the one-year low, 100% = the one-year high.
10-year in context
- One-year high: 3.111% (Oct 7, 2026)
- One-year low: 1.700% (Nov 12, 2025)
- The Nov 12 reading sits at 81% of that range.
Recent daily readings for the 10-year: 2.806% (Nov 5), 2.696% (Nov 6), 2.724% (Nov 9), 2.748% (Nov 10), 2.840% (Nov 11), 2.841% (Nov 12).
2-year and 30-year
The 2-year yield’s one-year range runs from 0.928% (Nov 18, 2025) to 1.981% (Sep 28, 2026). The 30-year’s range runs from 3.188% (Nov 13, 2025) to 4.168% (Oct 6, 2026), and its current position is 80%.
Japanese figures are dated Nov 12 and US figures Nov 10, so please check the date attached to each number.
補足:10年債の日米差と長短の差
Side notes: US-Japan 10-year gap and yield-curve spreads
The focus of this bulletin is the level of each country’s 10-year yield. The figures below are supplementary and limited to the spread numbers provided in the source data.
US-Japan 10-year gap (US minus Japan, on days when both are available)
| Date | Gap |
|---|---|
| Nov 10, 2026 | 223.2bp |
| Nov 9, 2026 (prior) | 215.6bp (+7.6bp on Nov 10) |
| One month earlier | 221.3bp |
The gap is measured on days when both US and Japanese readings exist. The latest such day is November 10; US readings for Nov 11 and Nov 12 are not in the data.
Curve spread (10-year minus 2-year)
| Date | Spread | Prior | |
|---|---|---|---|
| US | Nov 10, 2026 | 25.0bp | 32.0bp |
| Japan | Nov 12, 2026 | 98.4bp | 97.9bp |
Reading the numbers with care
- The latest dates differ by country (US: Nov 10; Japan: Nov 12).
- The gap uses Nov 10 for both countries, so it is not matched to Japan’s Nov 12 10-year yield of 2.841%.
- Yield differentials are not the only factor behind currency moves, so this bulletin treats the spread figures as side notes only.
Sources: FRED (St. Louis Fed, originally US Treasury) and the Ministry of Finance Japan.
Disclaimer: This article is for informational purposes only. All investment decisions are made solely at your own risk.