This article was automatically generated by the NFC Market Live AI analysis system. (Updated: 2026-11-04 19:33 JST)
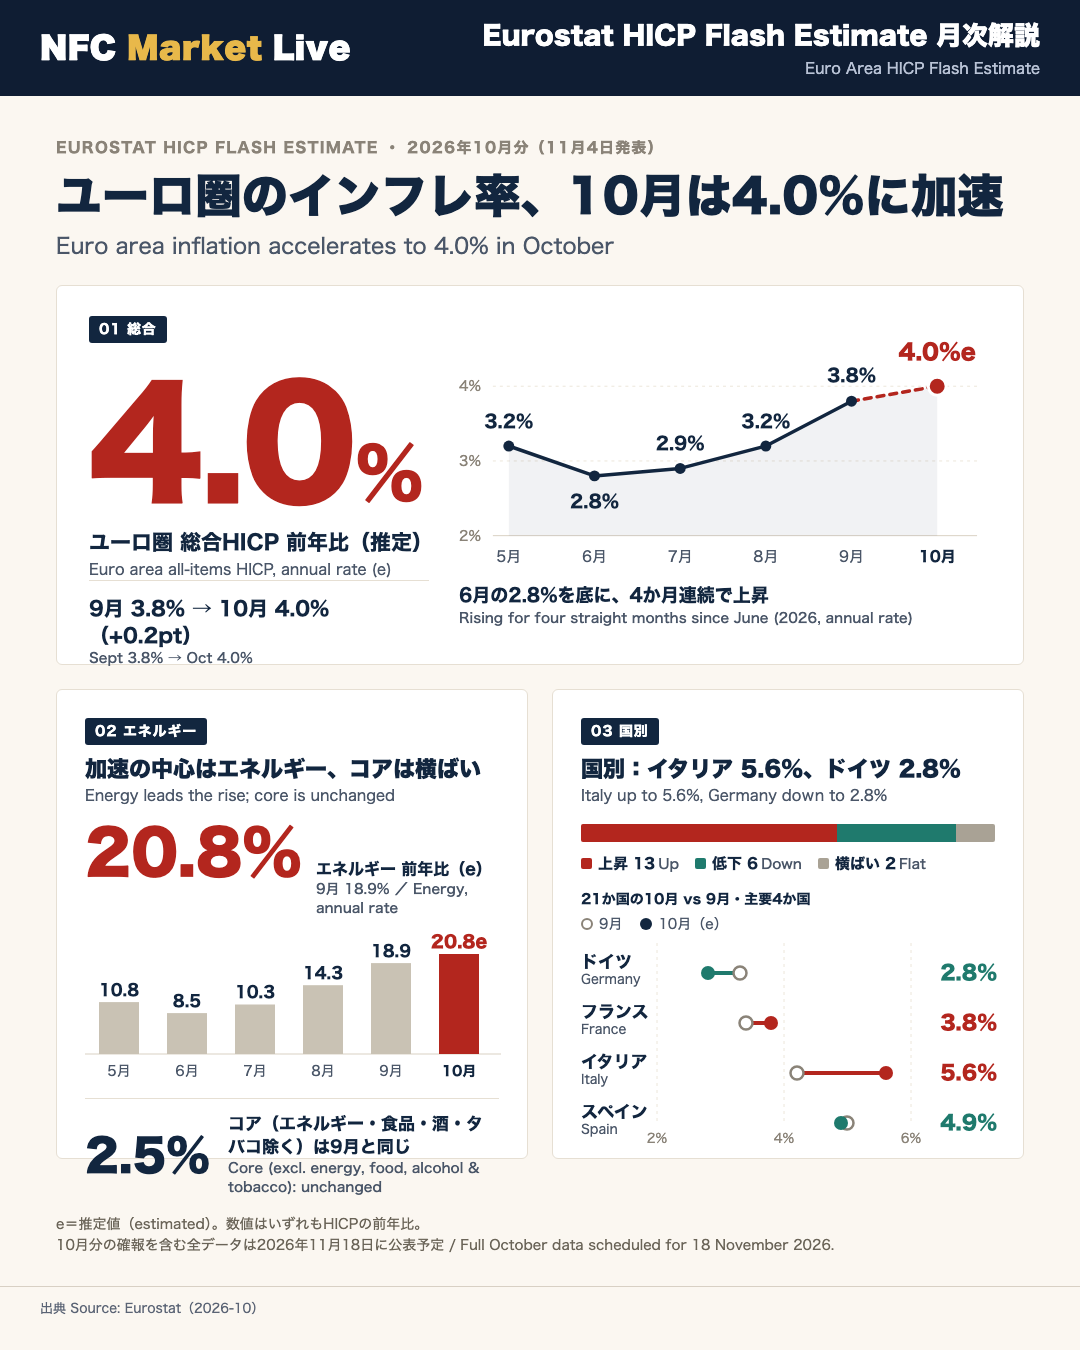
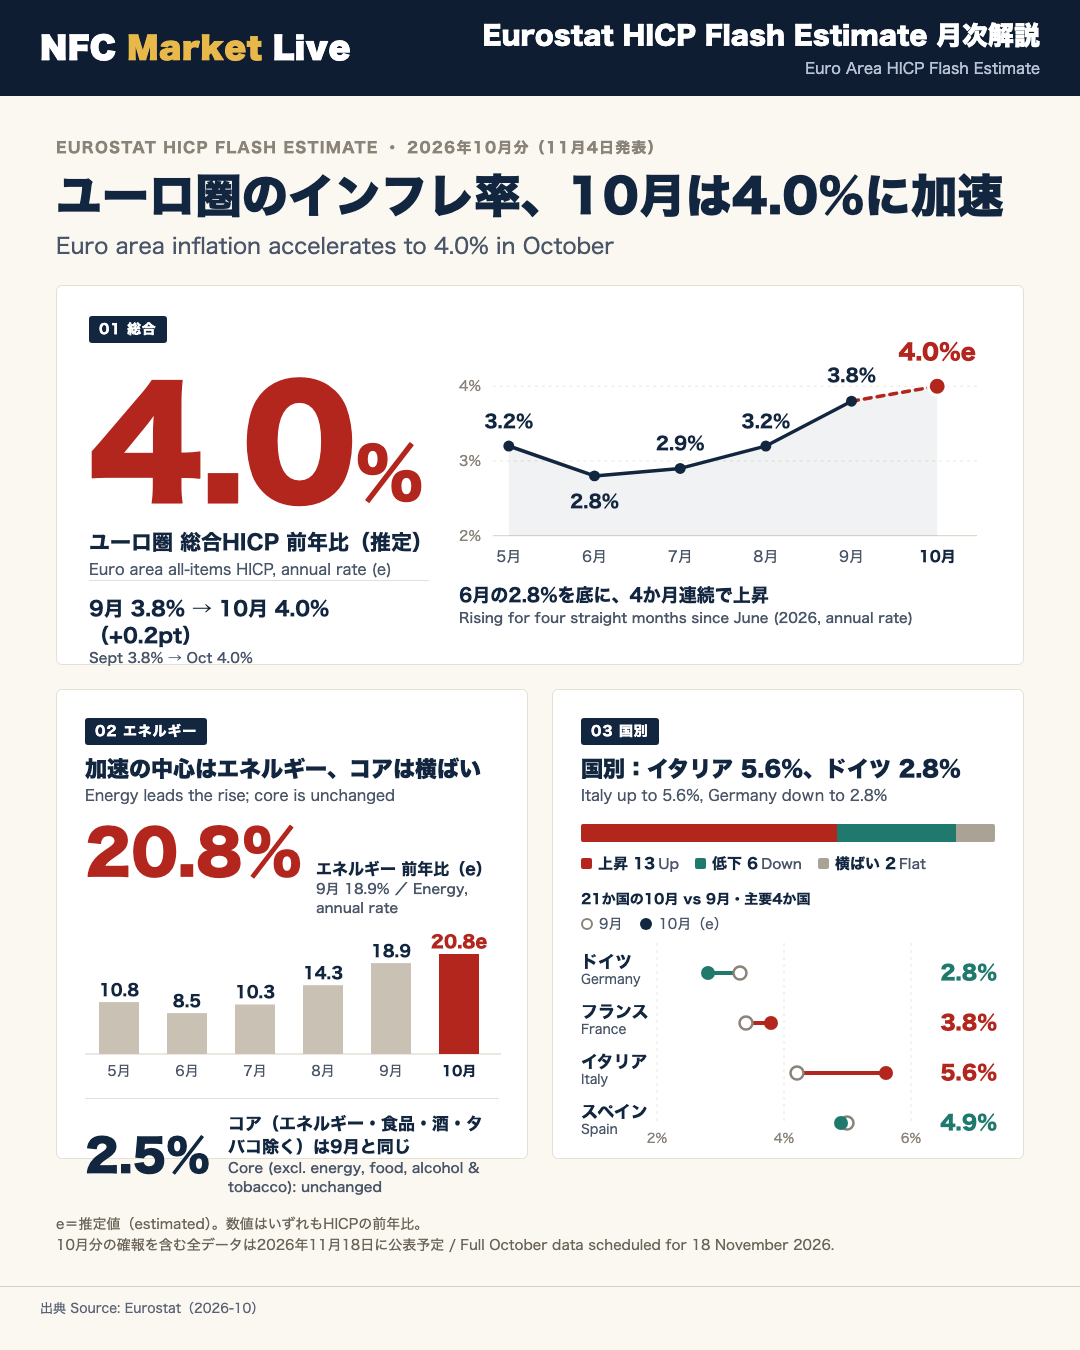
📊 Eurostat’s flash estimate shows euro area annual inflation at 4.0% in October 2026, up from 3.8% in September. The monthly rate is 0.4% (estimated).
🔎 Main components (annual rate, September in brackets):
・Energy: 20.8% (18.9%), the highest rate
・Services: 3.3% (3.2%)
・Food, alcohol & tobacco: 1.6% (1.3%)
・Non-energy industrial goods: 1.2% (1.1%)
💡 Inflation excluding energy, food, alcohol & tobacco was 2.5%, unchanged from September. All-items excluding energy was also unchanged at 2.3%.
🌍 By country, Italy rose to 5.6% from 4.2% and Belgium to 5.2% from 4.5%, while Germany eased to 2.8% from 3.3%. Lithuania (6.1%) and Bulgaria (6.0%) posted the highest rates in the table.
⚠️ The ‘e’ marks estimated figures.
📅 The full October data set is scheduled for release on 18 November 2026.
Source: Eurostat, Euro Indicators, HICP Flash Estimate
10月HICP速報:ユーロ圏インフレ率は4.0%へ加速
Euro area inflation reaches 4.0% in October (estimated)
Eurostat, the statistical office of the European Union, published its HICP flash estimate on 4 November 2026. Euro area annual inflation is expected to be 4.0% in October, up from 3.8% in September. The monthly rate is 0.4% (estimated). A year earlier, in October 2025, annual inflation was 2.1%.
What is HICP, and what is a flash estimate?
The Harmonised Index of Consumer Prices (HICP) is the measure Eurostat uses so that consumer price inflation can be compared across EU countries. It differs in scope and methodology from national CPIs, including Japan’s CPI and the US CPI, so levels should not be compared across them directly. The flash estimate is released at the end of each reference month. The complete data set follows around the middle of the next month, and an ‘e’ marks estimated figures.
Six-month path (all-items, annual rate)
| Month | May | Jun | Jul | Aug | Sep | Oct |
|---|---|---|---|---|---|---|
| HICP | 3.2% | 2.8% | 2.9% | 3.2% | 3.8% | 4.0% (e) |
Reading the numbers
- The rate has risen for four consecutive months since the June low of 2.8%. October is the highest reading in the periods shown in the release tables.
- The size of the increase has narrowed: +0.6 points from August to September, +0.2 points from September to October. This is a single-month observation, so it should not be read as a settled trend.
- The September all-items rate stays at 3.8% in the new table, so the headline figure was not revised.
This article summarizes the release only and does not forecast market moves.
Source: Eurostat, Euro Indicators, HICP Flash Estimate
エネルギーが20.8%、コアは2.5%で横ばい
Energy leads the rise while the core rate stays flat
The all-items increase in October is concentrated in one component. Energy inflation is estimated at 20.8% (September: 18.9%), the highest rate among the four main components, with a monthly rate of 1.4% (estimated). Inflation excluding energy, food, alcohol & tobacco (the core measure) was 2.5%, unchanged from September.
Energy path (annual rate)
| Month | Oct 25 | May | Jun | Jul | Aug | Sep | Oct |
|---|---|---|---|---|---|---|---|
| Energy | -0.9% | 10.8% | 8.5% | 10.3% | 14.3% | 18.9% | 20.8% (e) |
A year ago energy prices were falling at -0.9%. Energy carries a weight of 90.3 per mille (about 9.0%) in the basket, so it is a small component by size, but its very high annual rate keeps it prominent in the all-items figure.
Measures that did not move
- All-items excluding energy: 2.3% (September 2.3%)
- Excluding energy and unprocessed food: 2.2% (September 2.2%)
- Core (excluding energy, food, alcohol & tobacco): 2.5% (September 2.5%); it has stayed within 2.4%-2.6% since May.
Two sides of the picture
- Risk side: Energy’s annual rate has climbed from 14.3% in August to 20.8% in October, so the all-items rate is sensitive to this one component.
- Resilience side: Measures that strip out energy are flat, and the October flash tables do not show the price increase broadening across the basket.
In the previous flash, September energy was 18.8%; the current table shows 18.9%, a small revision.
This article describes the release and does not forecast market reactions.
Source: Eurostat, Euro Indicators, HICP Flash Estimate
サービス・食品・工業品:4大成分の内訳
Non-energy components edge up modestly
In the October flash, the three non-energy main components also nudged higher on an annual basis, though their levels differ widely.
| Component | Weight | Sep | Oct (e) | Monthly (e) |
|---|---|---|---|---|
| Services | 468.2‰ | 3.2% | 3.3% | 0.2% |
| Food, alcohol & tobacco | 189.4‰ | 1.3% | 1.6% | 0.4% |
| Non-energy industrial goods | 252.2‰ | 1.1% | 1.2% | 0.6% |
| Energy | 90.3‰ | 18.9% | 20.8% | 1.4% |
Services: the largest block at 3.3%
Services make up about 47% of the basket by weight. The annual rate was 3.0% in August, 3.2% in September and 3.3% in October. It remains below the 3.5% of May and the 3.4% recorded in October 2025, so the change is small.
Food: unprocessed items at 4.6%
Food, alcohol & tobacco as a whole is low at 1.6%, but the sub-components diverge. Processed food, alcohol & tobacco is 0.5% (September 0.4%), while unprocessed food is 4.6% (September 4.0%), with a monthly rise of 1.0% (estimated). Unprocessed food has a small weight of 51.4 per mille.
Non-energy industrial goods: 1.2%
The 1.2% matches August as the highest since May, but the rate itself remains low.
Two readings
- Resilience side: Services edged up but remain below their May and year-earlier levels, so the move is small.
- Caution side: All three non-energy components moved up at once. This is a single month, so later releases are needed to see whether it persists.
This article reports the release and does not forecast market moves.
Source: Eurostat, Euro Indicators, HICP Flash Estimate
国別の格差:イタリアが5.6%、ドイツは2.8%に低下
Country picture: 13 of 21 rose, 6 fell, 2 were unchanged
The country table covers 21 member states. Comparing October with September, 13 countries show a higher annual rate, 6 a lower one, and 2 (Latvia and Lithuania) were unchanged. Levels and the size of moves vary widely.
Large economies (annual rate)
| Country | Oct 25 | Sep | Oct (e) | Monthly (e) |
|---|---|---|---|---|
| Germany | 2.3% | 3.3% | 2.8% | -0.1% |
| France | 0.8% | 3.4% | 3.8% | 0.4% |
| Italy | 1.3% | 4.2% | 5.6% | 1.2% |
| Spain | 3.2% | 5.0% | 4.9% | 0.5% |
- Italy rose 1.4 points from 4.2% to 5.6%, with a large monthly rate of 1.2% (estimated).
- Germany, the euro area’s largest economy, eased from 3.3% to 2.8%, with a monthly rate of -0.1% (estimated).
- France rose from 3.4% to 3.8%, while Spain edged down from 5.0% to 4.9%.
Distribution
- Highest: Lithuania 6.1%, Bulgaria 6.0%, Greece 5.6%, Italy 5.6%, Cyprus 5.4%, Belgium 5.2%
- Lowest: Malta 2.3%, Germany 2.8%, Slovakia 2.9%, Latvia 3.0%
- Declines: Germany, Spain, Luxembourg (5.2% to 4.9%), Malta, Austria, Slovakia
The gap between the highest (Lithuania, 6.1%) and the lowest (Malta, 2.3%) is 3.8 points. Belgium rose from 4.5% to 5.2% and Finland from 2.7% to 3.4%.
Reading the dispersion
Germany’s decline and Italy’s rise happened in the same month, so national paths are not moving in step. A single euro area rate is the aggregate of these different national readings. The release does not explain country-level drivers, so none are offered here.
Source: Eurostat, Euro Indicators, HICP Flash Estimate
統計の読み方と次回の公表予定
How to read a flash estimate
Every figure in this release is a flash number, and values marked ‘e’ are estimates. Eurostat publishes the flash at the end of each reference month, and the complete set of harmonised indices for the euro area, the EU and member states follows around the middle of the next month. This two-step process is common among statistical agencies, and the full release can differ slightly from the flash.
Small revisions visible in the tables
Comparing the September row in the new release with the September flash published on 2 October shows minor updates.
| Item | September flash | September in new table |
|---|---|---|
| Euro area all-items | 3.8% | 3.8% |
| Energy | 18.8% | 18.9% |
| Italy | 4.1% | 4.2% |
| Belgium | 4.6% | 4.5% |
| Estonia | 3.0% | 3.1% |
| Finland | 2.6% | 2.7% |
| Slovakia | 3.1% | 3.0% |
The all-items rate was unchanged and every revision shown is 0.1 point. It is still a reminder that flash figures can move slightly. Slovenia’s figures carry no ‘e’ marker in the table.
What the October data show
- Resilience side: Core inflation at 2.5% and inflation excluding energy at 2.3% were both flat, and six countries, including Germany, recorded lower annual rates.
- Risk side: Energy at 20.8% and the all-items rate at 4.0% are the highest in the periods shown, and 13 countries moved higher.
What to watch next
The full October data are scheduled for release on 18 November 2026. Energy, services and Italy’s figures are the readings to check against their flash estimates.
This article reports the release and does not forecast market moves.
Source: Eurostat, Euro Indicators, HICP Flash Estimate
Disclaimer: This article is for informational purposes only. All investment decisions are made solely at your own risk.