
📺 Watch the Full Video Analysis
This article was automatically generated by the NFC Market Live AI analysis system. (Updated: 2026-11-04 00:17 JST)
📄 Primary Source
U.S. Bureau of Labor Statistics
https://www.bls.gov/news.release/pdf/jolts.pdf
📊 A walkthrough of the September JOLTS report released by the US Labor Department on Nov 3.
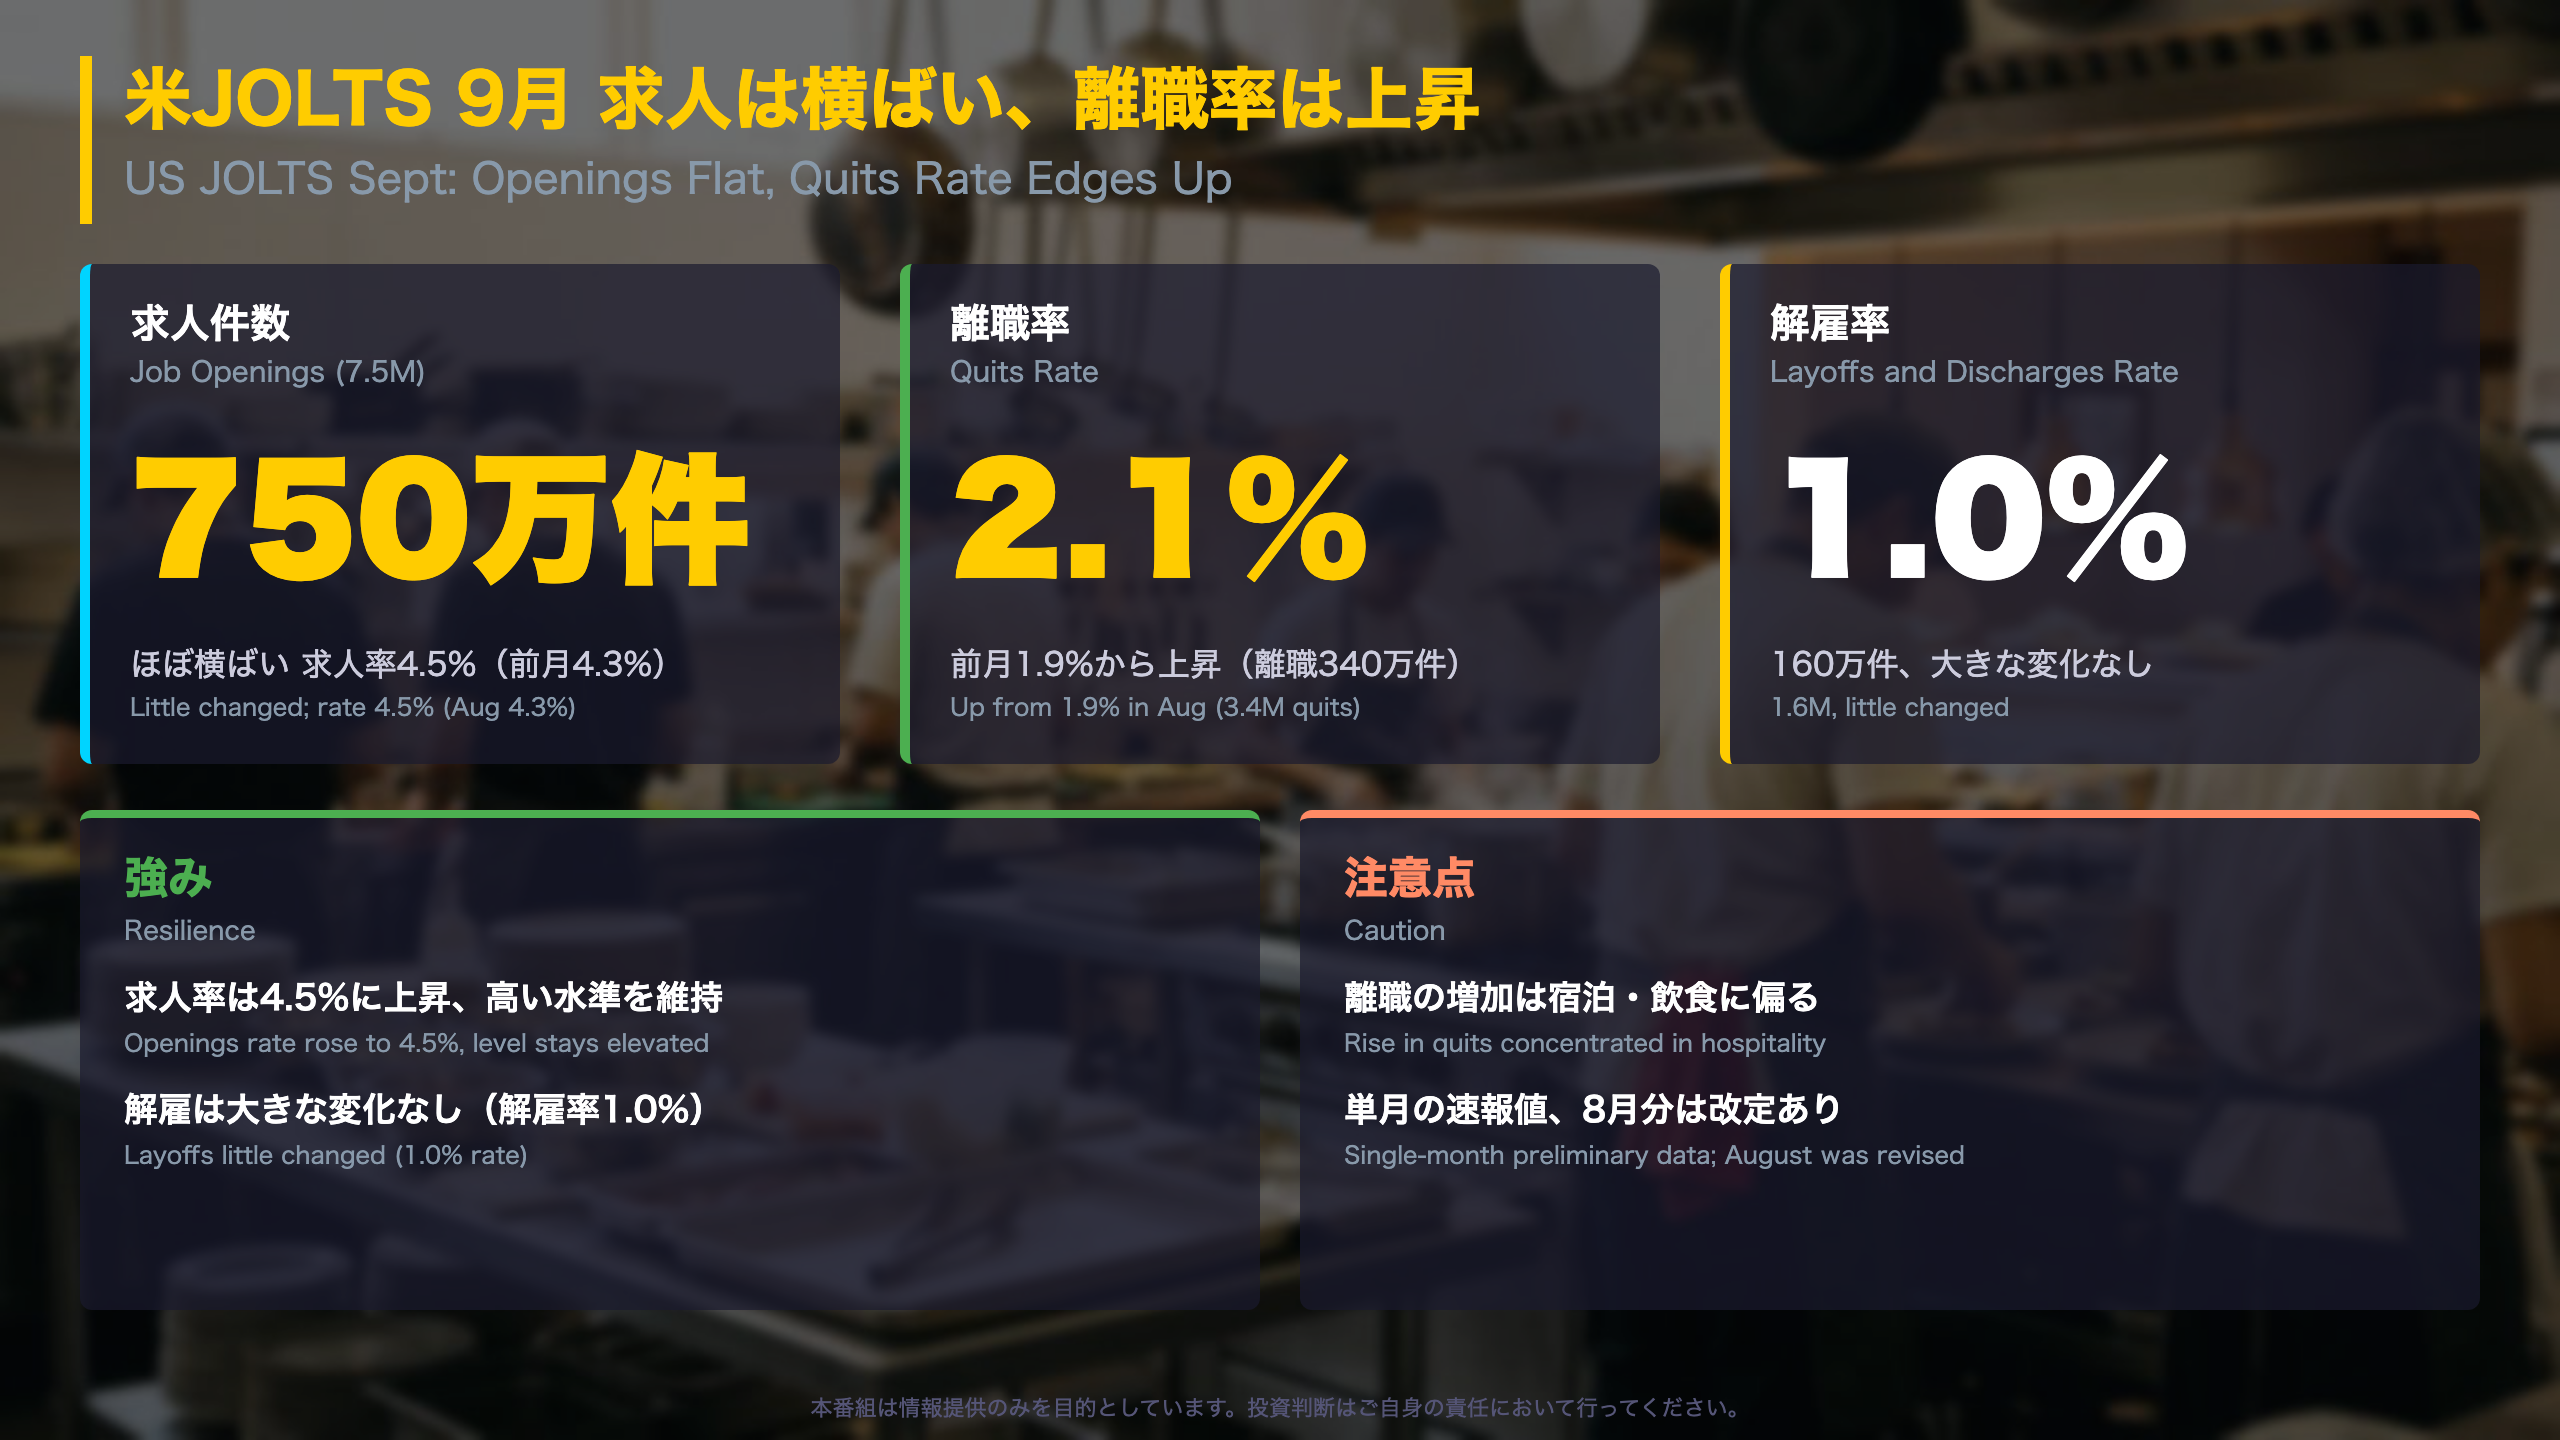
Job openings were little changed at 7.5 million (rate 4.5%), and layoffs barely moved, pointing to a resilient labor market.
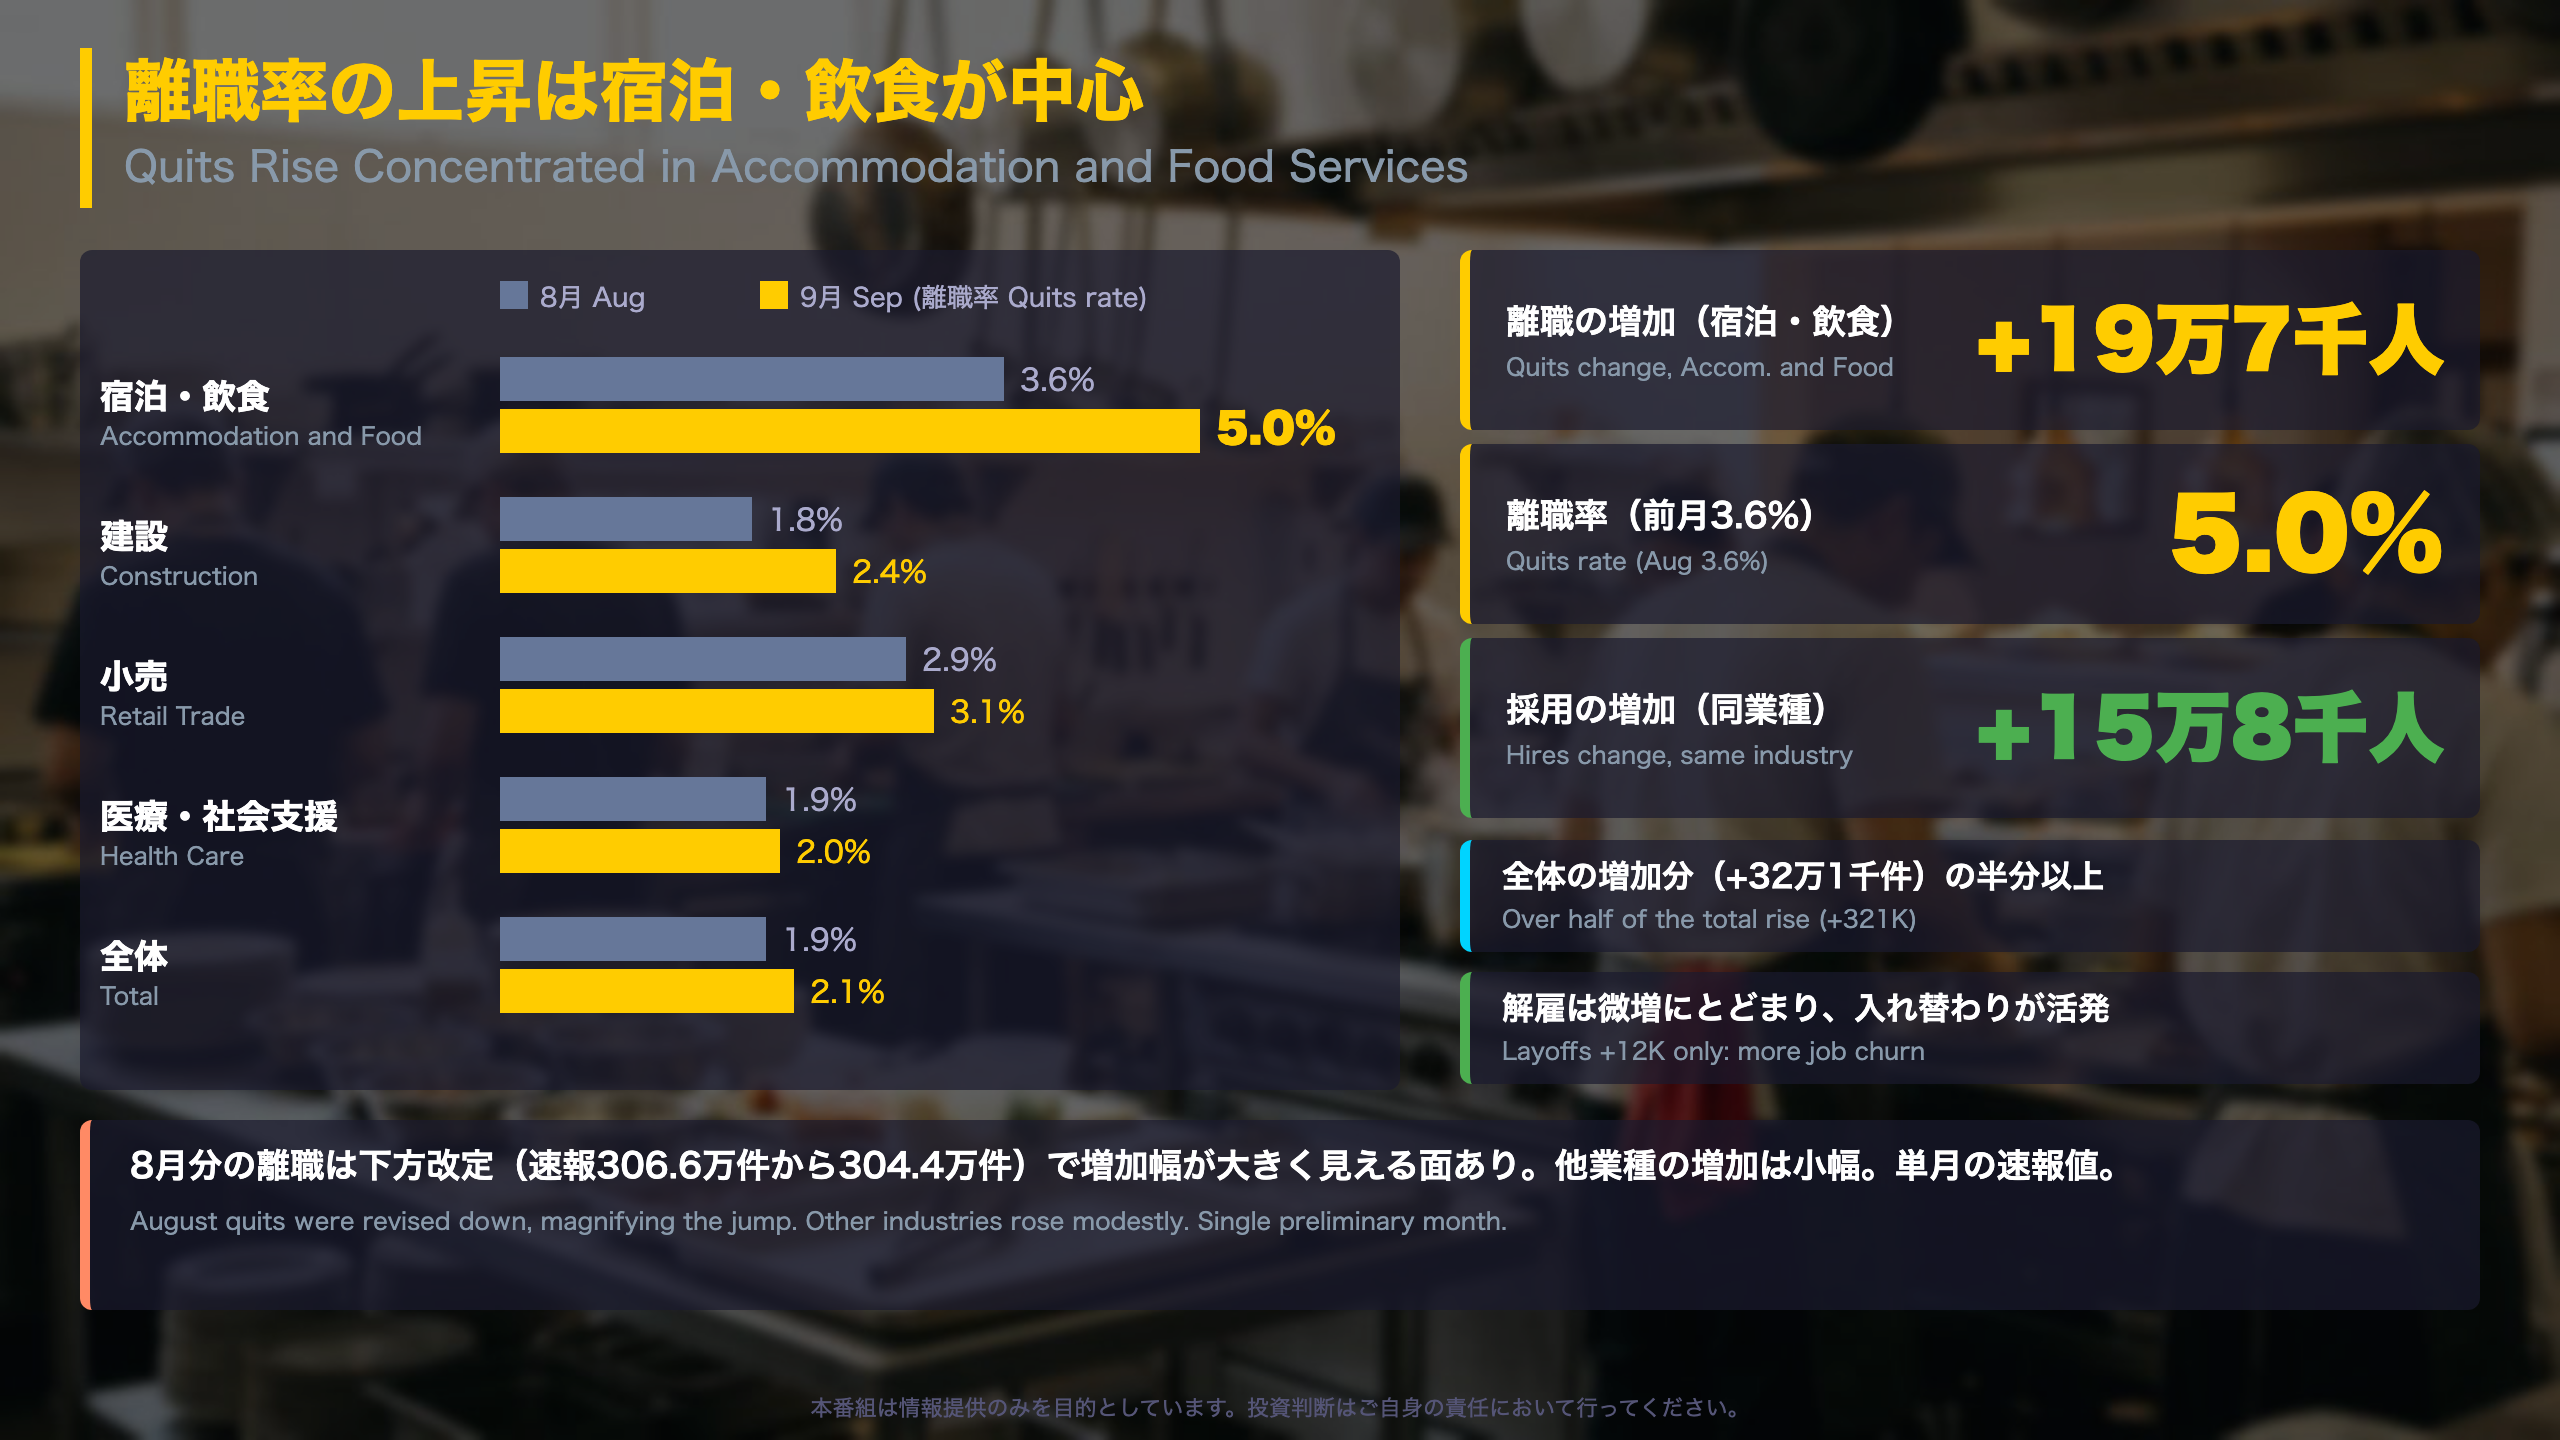
📈 The quits rate rose from 1.9% to 2.1%, but the increase was concentrated in accommodation and food services, where hires also rose, which suggests more job churn.
⚠️ This is a single preliminary month, and August was revised. The drop in health care layoffs partly reverses an August spike.
💡 The October report is due December 1 at 10:00 a.m. ET.
サマリー:求人は横ばい、離職率は上昇
September JOLTS: A Resilient Labor Market With Mixed Signals
The Job Openings and Labor Turnover Survey (JOLTS), published by the Bureau of Labor Statistics (BLS) under the US Department of Labor, is a monthly sample survey of roughly 21,000 establishments. Unlike the payrolls report, it captures demand (openings) and flows (hires, quits, layoffs). It is widely followed as a gauge of labor market tightness.
What the September report said
- Openings: 7.5 million, rate 4.5% (August revised: 7.19 million, 4.3%)
- Hires: 5.4 million, rate 3.4%
- Quits: 3.4 million, rate 2.1% (August: 1.9%)
- Layoffs and discharges: 1.6 million, rate 1.0%
The BLS summary line: ‘The number of job openings was little changed at 7.5 million in September.’
Revisions matter
August openings were revised up by 111,000, hires by 79,000, and layoffs by 127,000, while quits were revised down by 22,000. That means September’s layoff figure compares with a higher revised August base.
How to read it
Unlike Japan’s job-offers-to-applicants ratio published by the Ministry of Health, Labour and Welfare, JOLTS does not report a ratio of openings to jobseekers; the openings-per-unemployed measure requires unemployment data from the separate household survey, which is not in this release.
Constructive reading: the openings rate rose and layoffs stayed low. Cautious reading: the BLS describes most changes as small, the data are preliminary, and the quits increase was concentrated in one industry. Watch the October report (December 1, 10:00 a.m. ET) alongside payrolls and wage data for confirmation.
深掘り1:離職の増加は宿泊・飲食が中心
Behind the Rise in Quits: Churn in Accommodation and Food Services
Quits climbed to 3.37 million in September (rate 2.1%) from a revised 3.04 million in August (1.9%), and were 375,000 above September 2025. The BLS notes that ‘the quits rate can serve as a measure of workers’ willingness or ability to leave jobs.’ US policymakers and economists often watch it as a proxy for labor market confidence and wage-switching behavior, much as Japan watchers look at job-switching rates alongside the Ministry of Health, Labour and Welfare’s wage data.
Where the increase came from
| Accommodation and food services | August | September |
|---|---|---|
| Quits | 522K (3.6%) | 719K (5.0%) |
| Hires | 721K (5.0%) | 879K (6.1%) |
| Layoffs | 139K (1.0%) | 151K (1.1%) |
| Openings | 676K (4.5%) | 659K (4.4%) |
Both quits and hires jumped while openings eased slightly, a pattern more consistent with reshuffling between jobs than with falling demand.
Other detail
- Construction quits rose to 198K (rate 2.4% from 1.8%).
- Establishments with 1-9 employees saw the quits rate rise from 1.7% to 2.2%.
- The West region added about 195K quits.
Two readings
Constructive: the hospitality quits rate was 4.1% in June and 3.7% in July before dipping to 3.6%, so September is a rebound toward more normal mobility. Cautious: August’s revised base was low versus June and July, which magnifies the jump, and the data are preliminary. We therefore avoid concluding that confidence has risen broadly; confirmation would need to come from the October report and wage data.
深掘り2:求人の中身と解雇の内訳
Inside Openings and Layoffs: What Rose and What Reversed
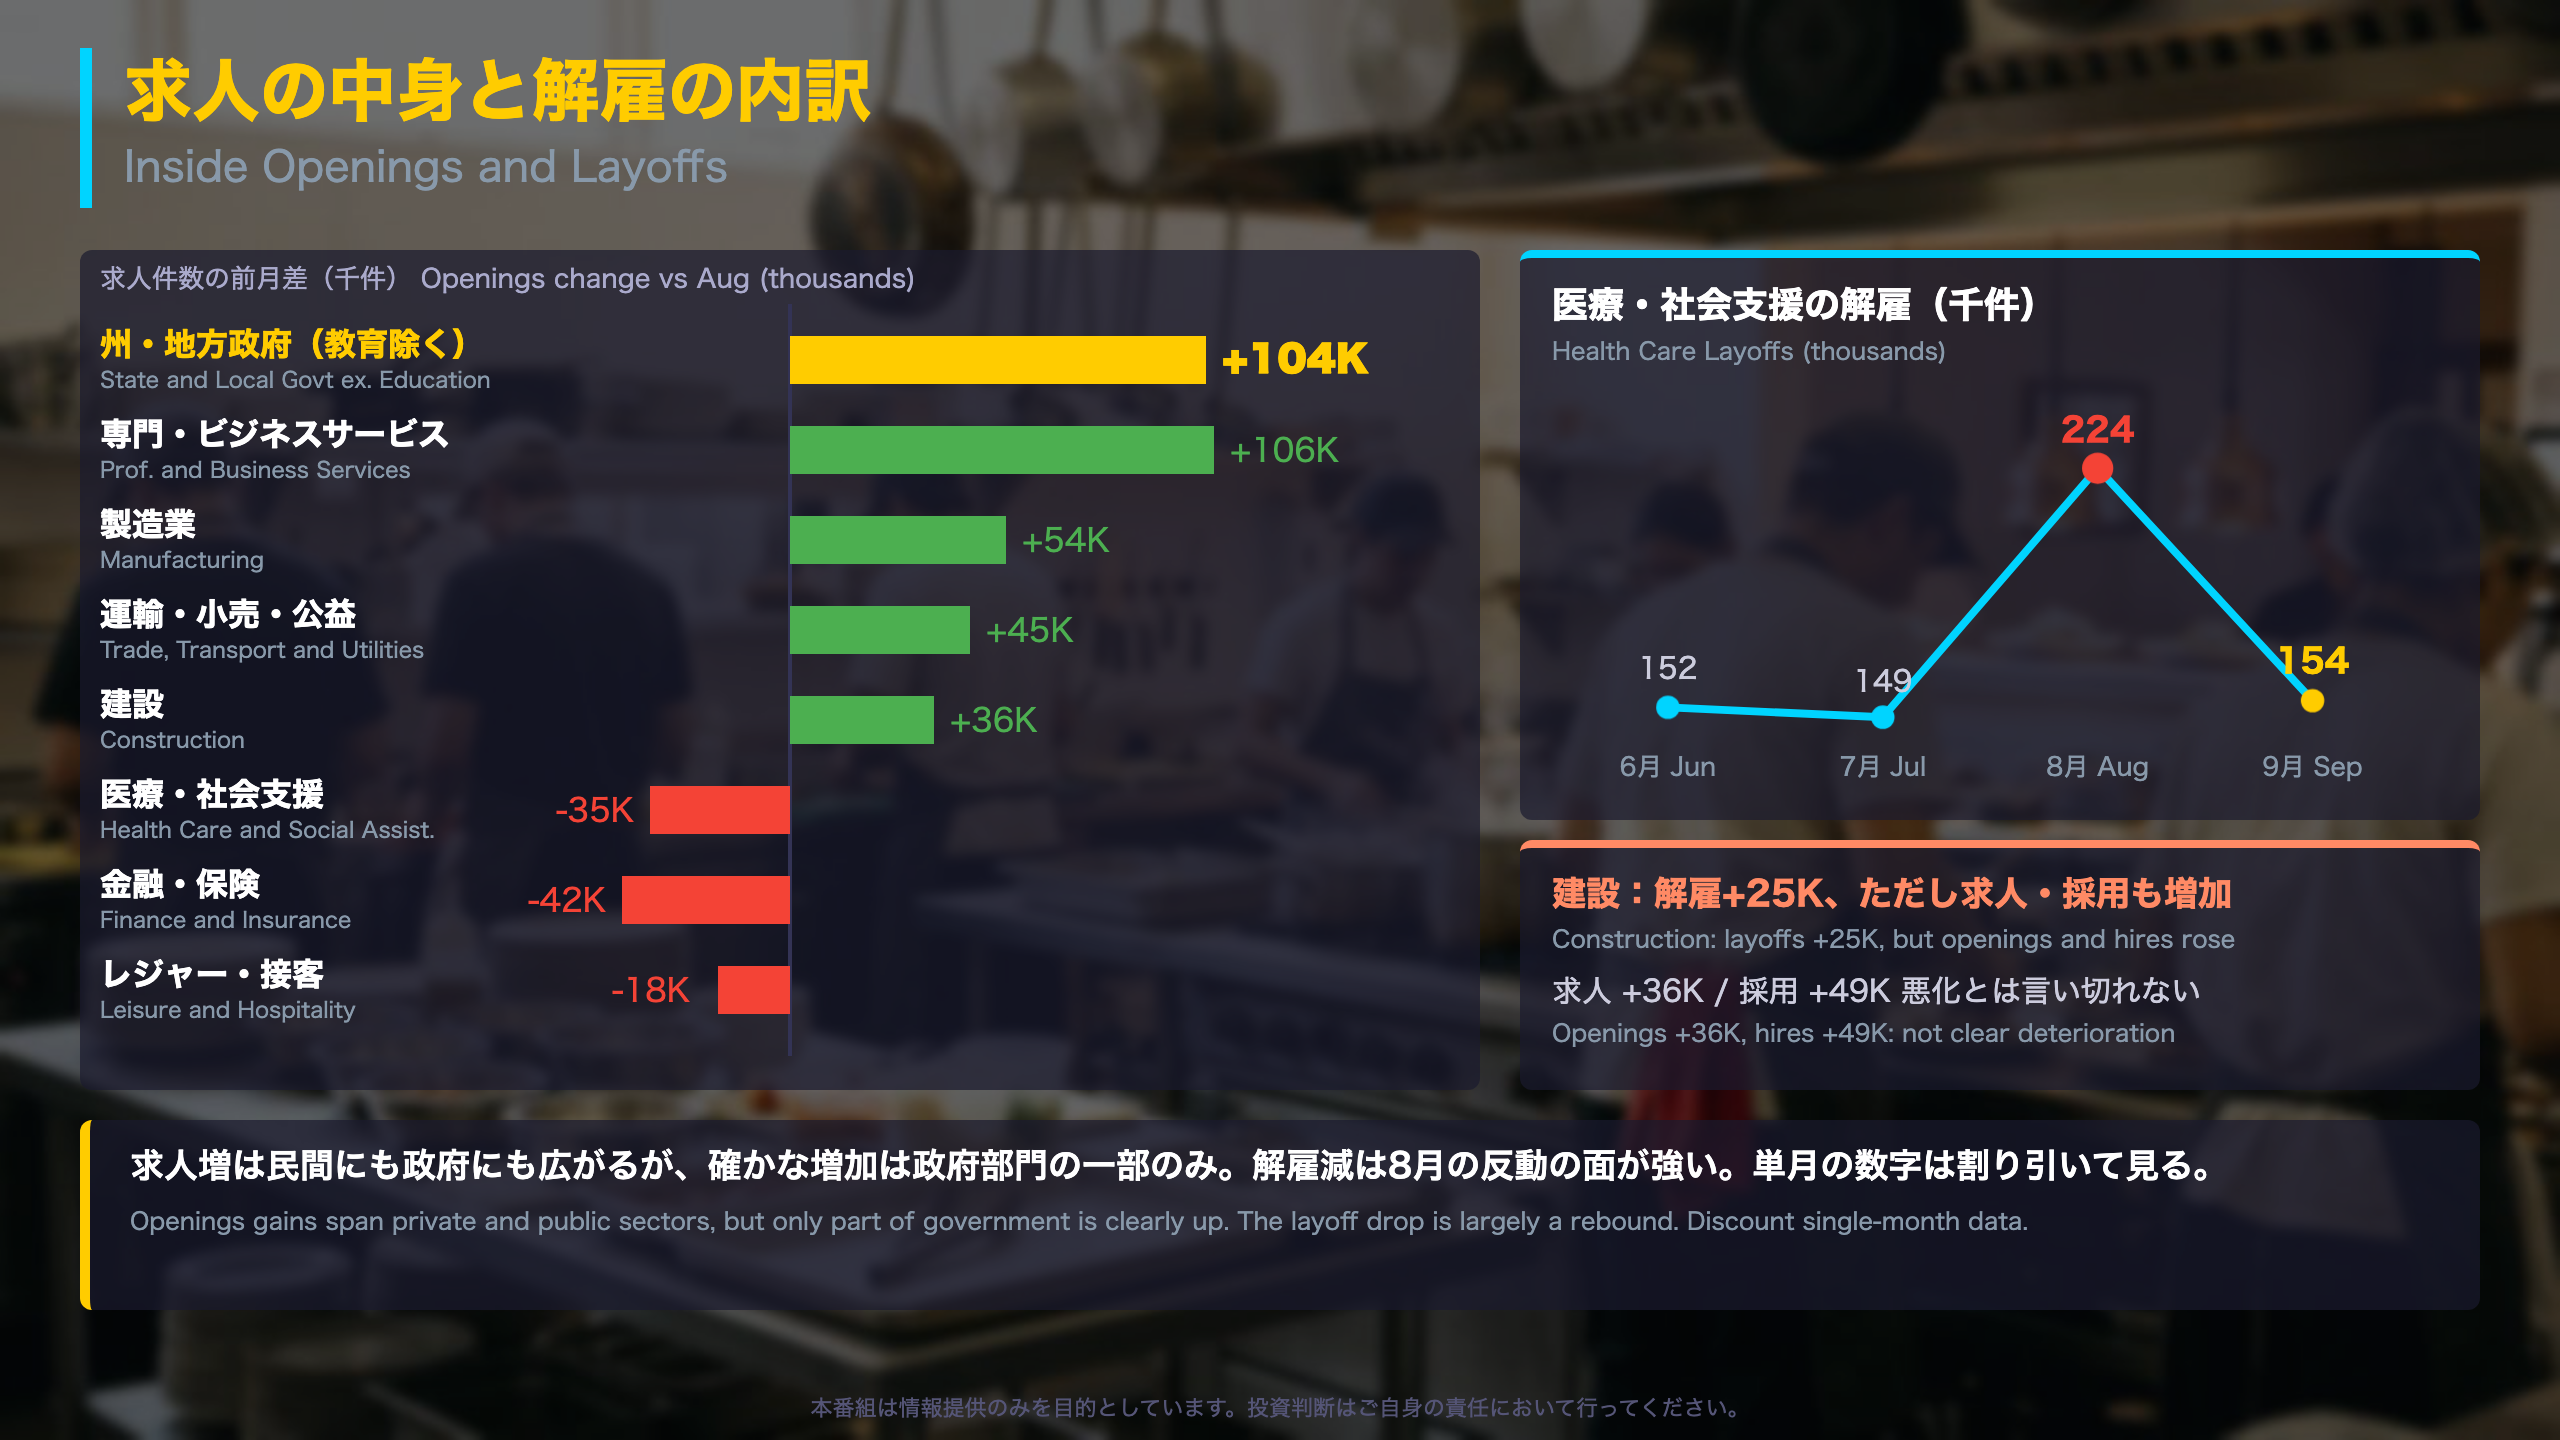
September openings were 7.52 million, versus a revised 7.19 million in August. Notably, the BLS flagged an increase in only one industry: ‘Job openings increased in state and local government, excluding education (+104,000).’ For context, JOLTS counts a job as open only if the position exists, could start within 30 days, and the employer is actively recruiting, so it is narrower than some online-postings measures.
Industry detail (thousands, Aug to Sep)
- State and local government ex-education: 415 to 519
- Professional and business services: 1,204 to 1,310
- Manufacturing: 530 to 584
- Finance and insurance: 331 to 289
- Health care and social assistance: 1,514 to 1,479
Leisure and hospitality openings were 779K, far below 1.15 million a year earlier, a reminder that the broad aggregate hides large sectoral swings. Regionally, the West rose by 244K.
Layoffs: a rebound, not necessarily an improvement
Health care layoffs fell by 70K to 154K, but that simply returns to the June (152K) and July (149K) range after August’s spike to 224K. Construction layoffs rose 25K to 138K, yet construction hires (+49K) and openings (+36K) rose too. By establishment size, layoffs fell sharply at firms with 1-9 employees (rate 1.2% to 0.5%) but rose at firms with 10-49 employees (1.0% to 1.4%).
Two readings
Constructive: the layoff rate of 1.0% is low and openings gains were broad-based across private and public employers. Cautious: only one statistically flagged opening gain, a layoff decline that is partly a mean reversion, and preliminary data. The October release (December 1) will show whether the government openings jump persists.
質疑で深める:強さ・賃金・過去比較

Q&A Supplement: Openings-to-Unemployed, Wages, and the Quits Rate in Context
Why we do not state a V/U ratio
Market commentary often cites the ratio of job openings to unemployed workers (the ‘V/U’ ratio). The numerator comes from JOLTS (7.52 million openings), but the denominator comes from the Current Population Survey, which is not part of this release. We therefore do not compute it. What the report does give is the openings rate of 4.5% (August: 4.3%), defined as openings divided by employment plus openings. Japan’s equivalent headline measure is the job-offers-to-applicants ratio from the Ministry of Health, Labour and Welfare, which is built differently.
The quits rate in context
Total quits rate: May 2.0%, June 2.0%, July 1.9%, August 1.9% (revised), September 2.1%. In accommodation and food services: 4.2%, 4.1%, 3.7%, 3.6%, then 5.0%. The 0.2-point move at the total level is modest, while the hospitality swing is large.
Reliability
JOLTS samples about 21,000 establishments and the BLS reports at the 90% confidence level (1.65 standard errors). September figures are preliminary; August openings were revised up by 111K and layoffs by 127K. Annual benchmark revisions arrive with the January data.
Wages
This release contains no wage data, so any link between quits and wage pressure must be verified with separate wage statistics such as average hourly earnings or the Employment Cost Index.
What to watch
The October JOLTS is due December 1 at 10:00 a.m. ET. Key checks: whether the total quits rate holds near 2.1% or returns to 1.9%, and whether the hospitality quits rate stays near 5%.
Disclaimer: This article is for informational purposes only. All investment decisions are made solely at your own risk.