📺 Watch the Full Video Analysis
This article was automatically generated by the NFC Market Live AI analysis system. (Updated: 2026-10-27 23:17 JST)
📄 Primary Source
U.S. Census Bureau
https://www.census.gov/construction/nrs/pdf/newressales.pdf
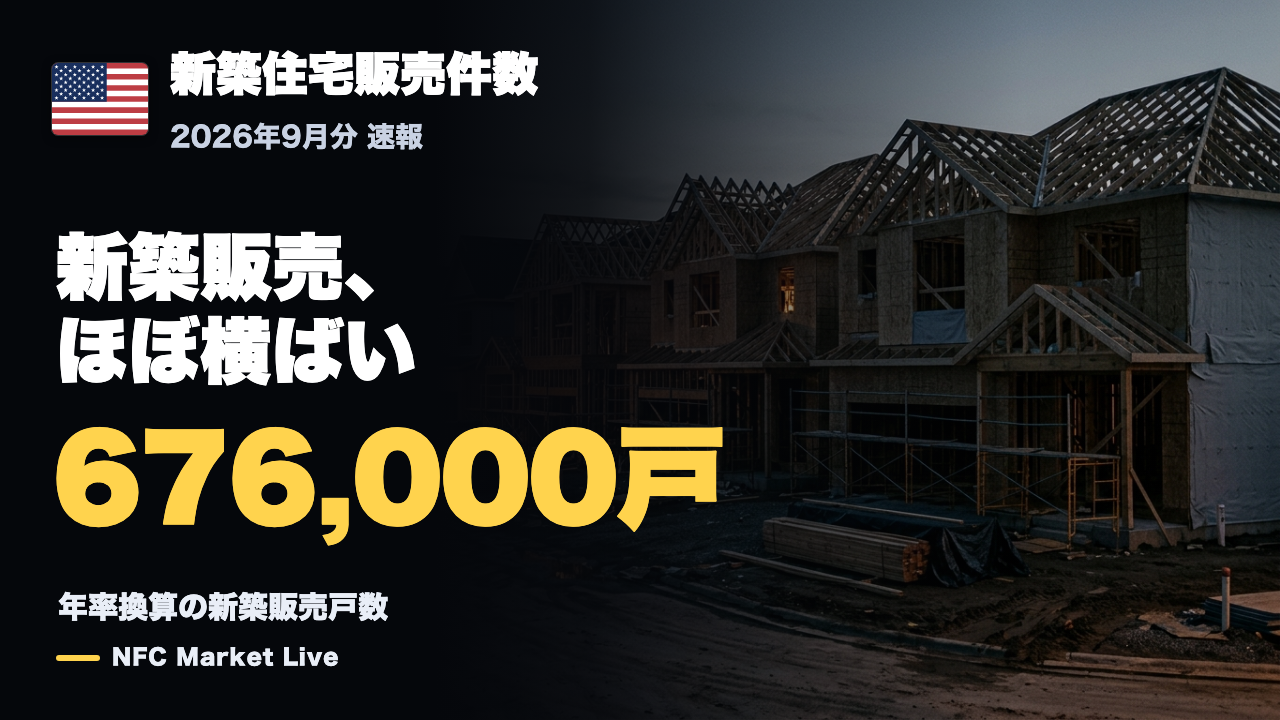
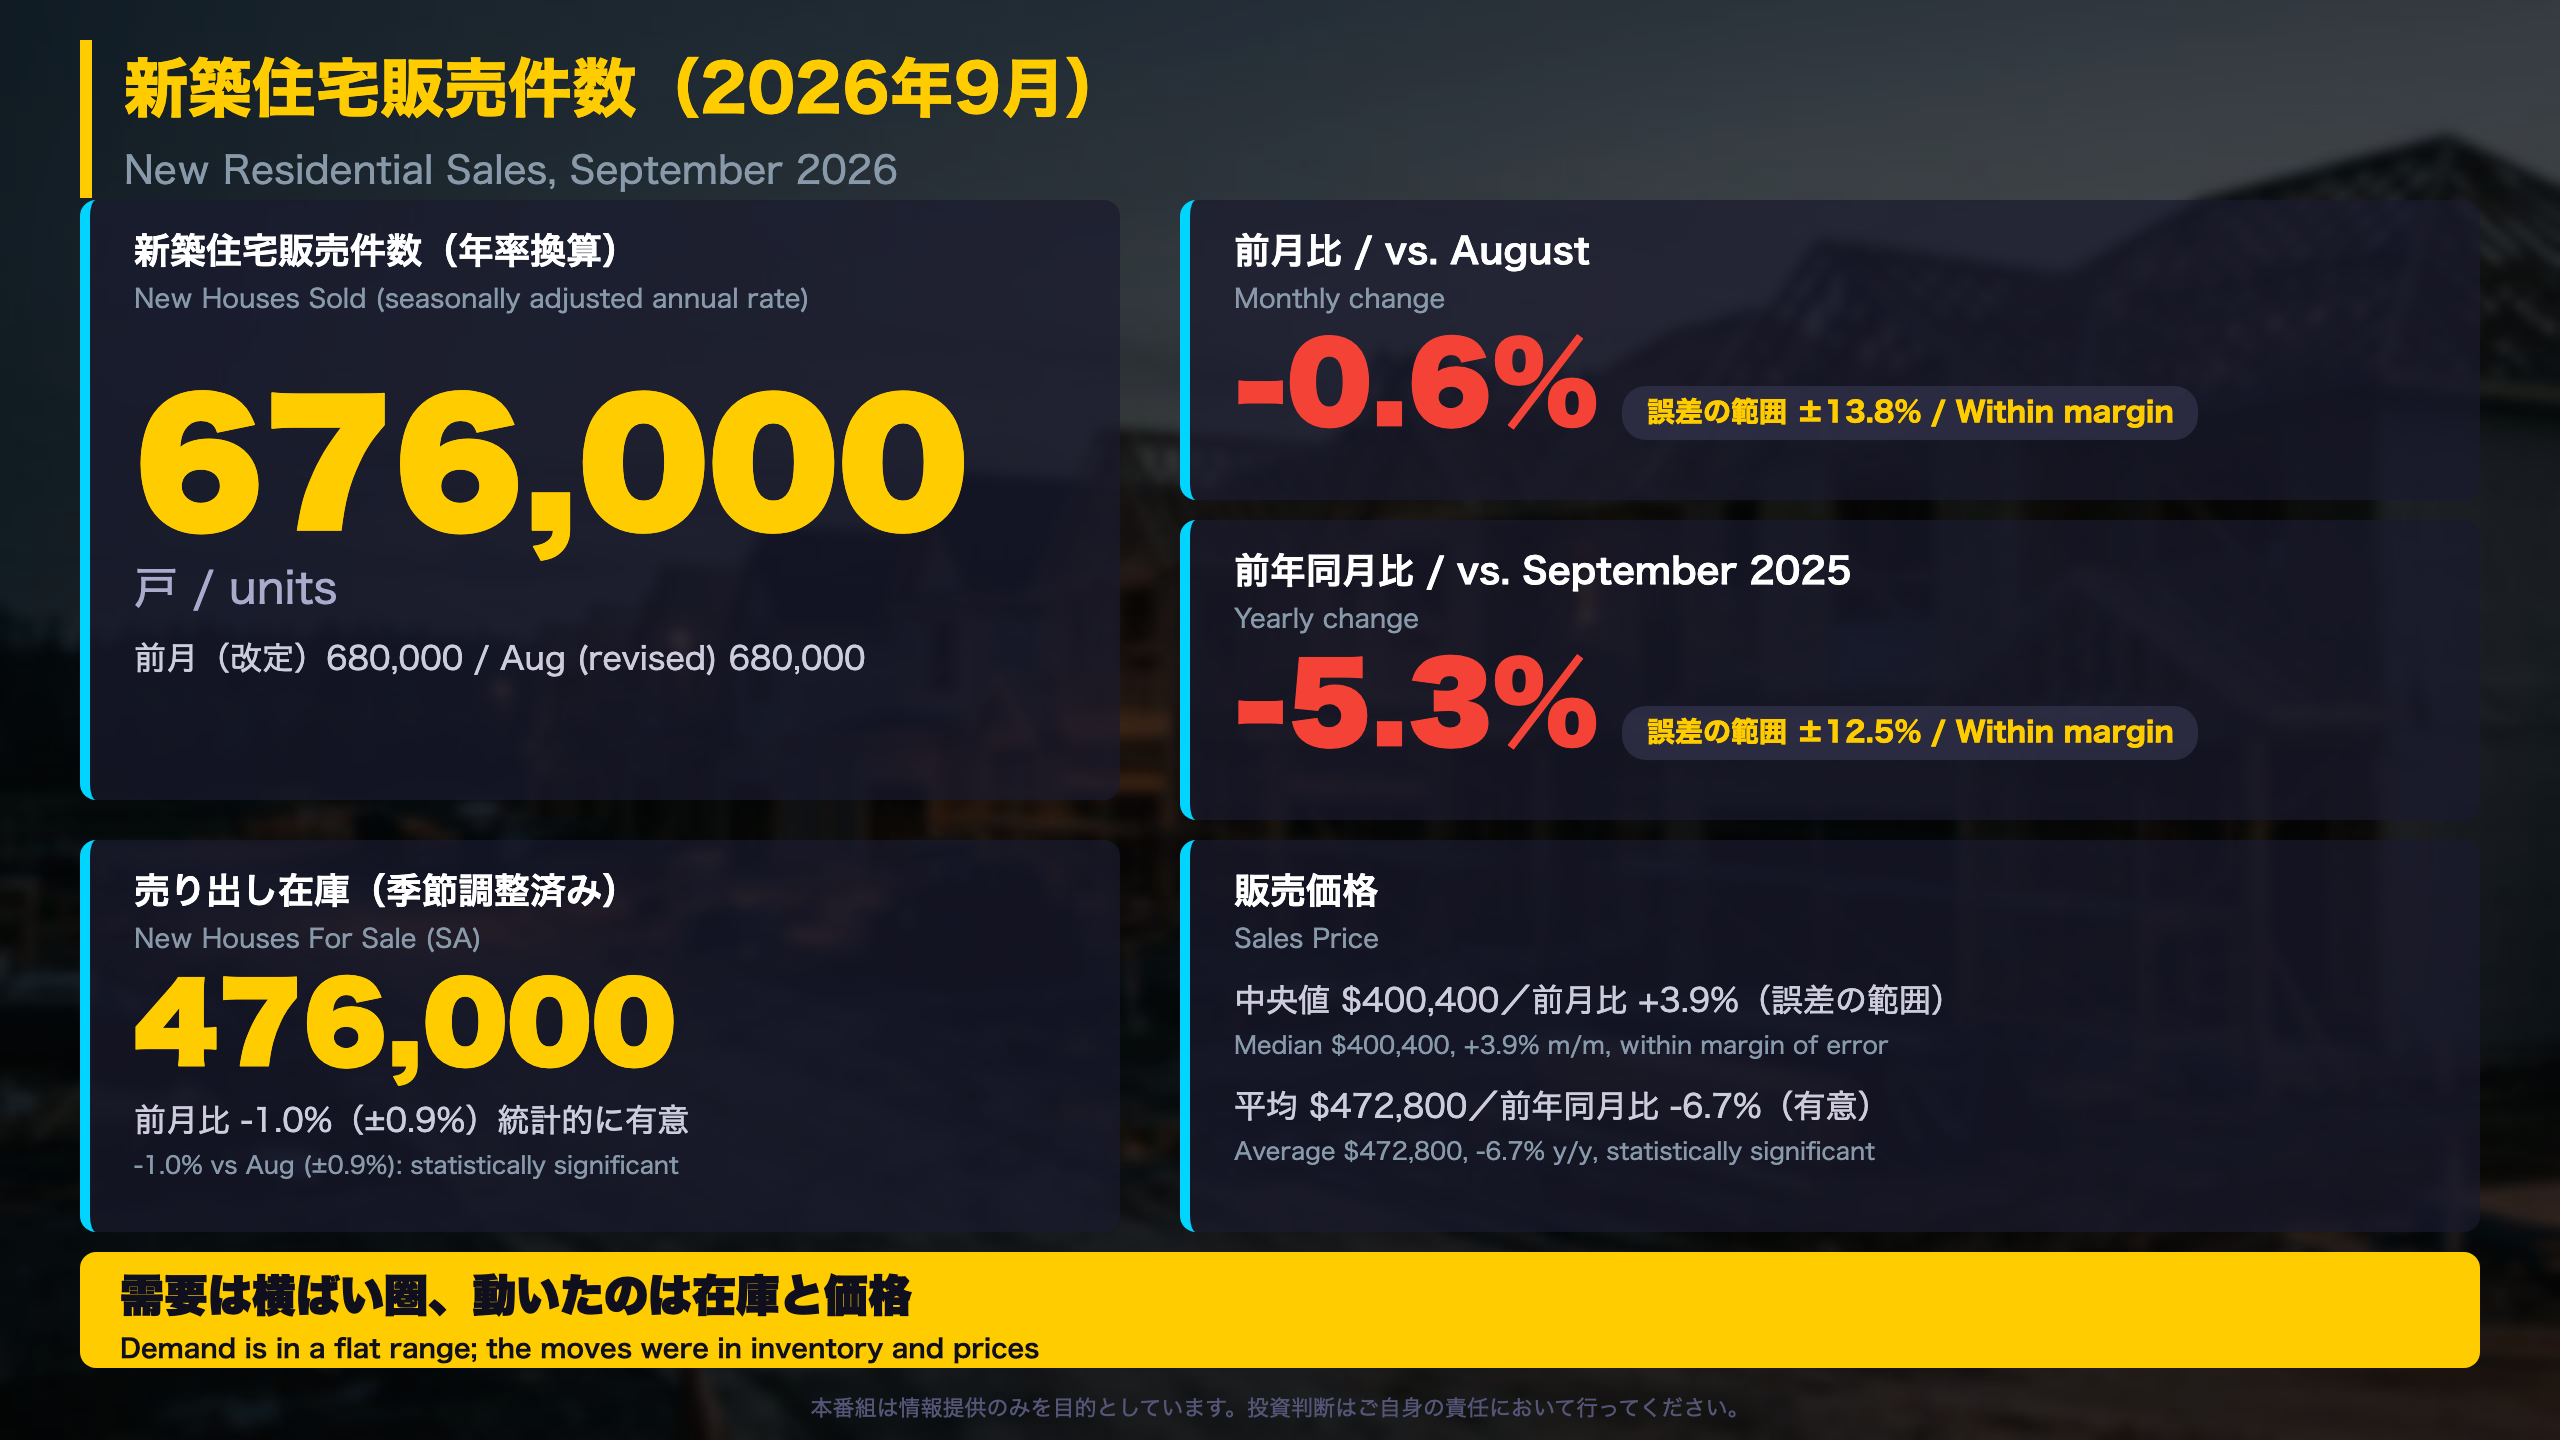
📊 The Census Bureau and HUD reported September new home sales at a 676,000 annual rate (-0.6% m/m, -5.3% y/y). Both changes are within the margin of error, so demand reads as flat.
📉 Inventory for sale fell 1.0% (statistically significant), months’ supply was 8.4, and the average price is down 6.7% y/y (significant).
💡 We look at the price-band mix and time on market to explain the gap between median and average prices.
⚠️ Next release: October data on November 25, 2026.
サマリー:新築住宅販売は横ばい圏
September New Home Sales: Flat Demand, Mixed Details
What the report is. The U.S. Census Bureau and the Department of Housing and Urban Development (HUD) jointly publish New Residential Sales every month. It counts new single-family houses where a contract has been signed or a deposit taken, seasonally adjusted and expressed as an annual rate. It measures sales of new homes rather than construction starts, and it is only one part of the U.S. housing picture alongside existing-home sales.
Key figures
- 676,000 annualized, -0.6% from August (680,000) and -5.3% from September 2025 (714,000)
- Both changes sit inside the 90% confidence interval (±13.8% and ±12.5%), so neither is statistically significant
- Inventory for sale: 476,000 (-1.0%, statistically significant); months’ supply 8.4
- Median price: $400,400; average price: $472,800
Context
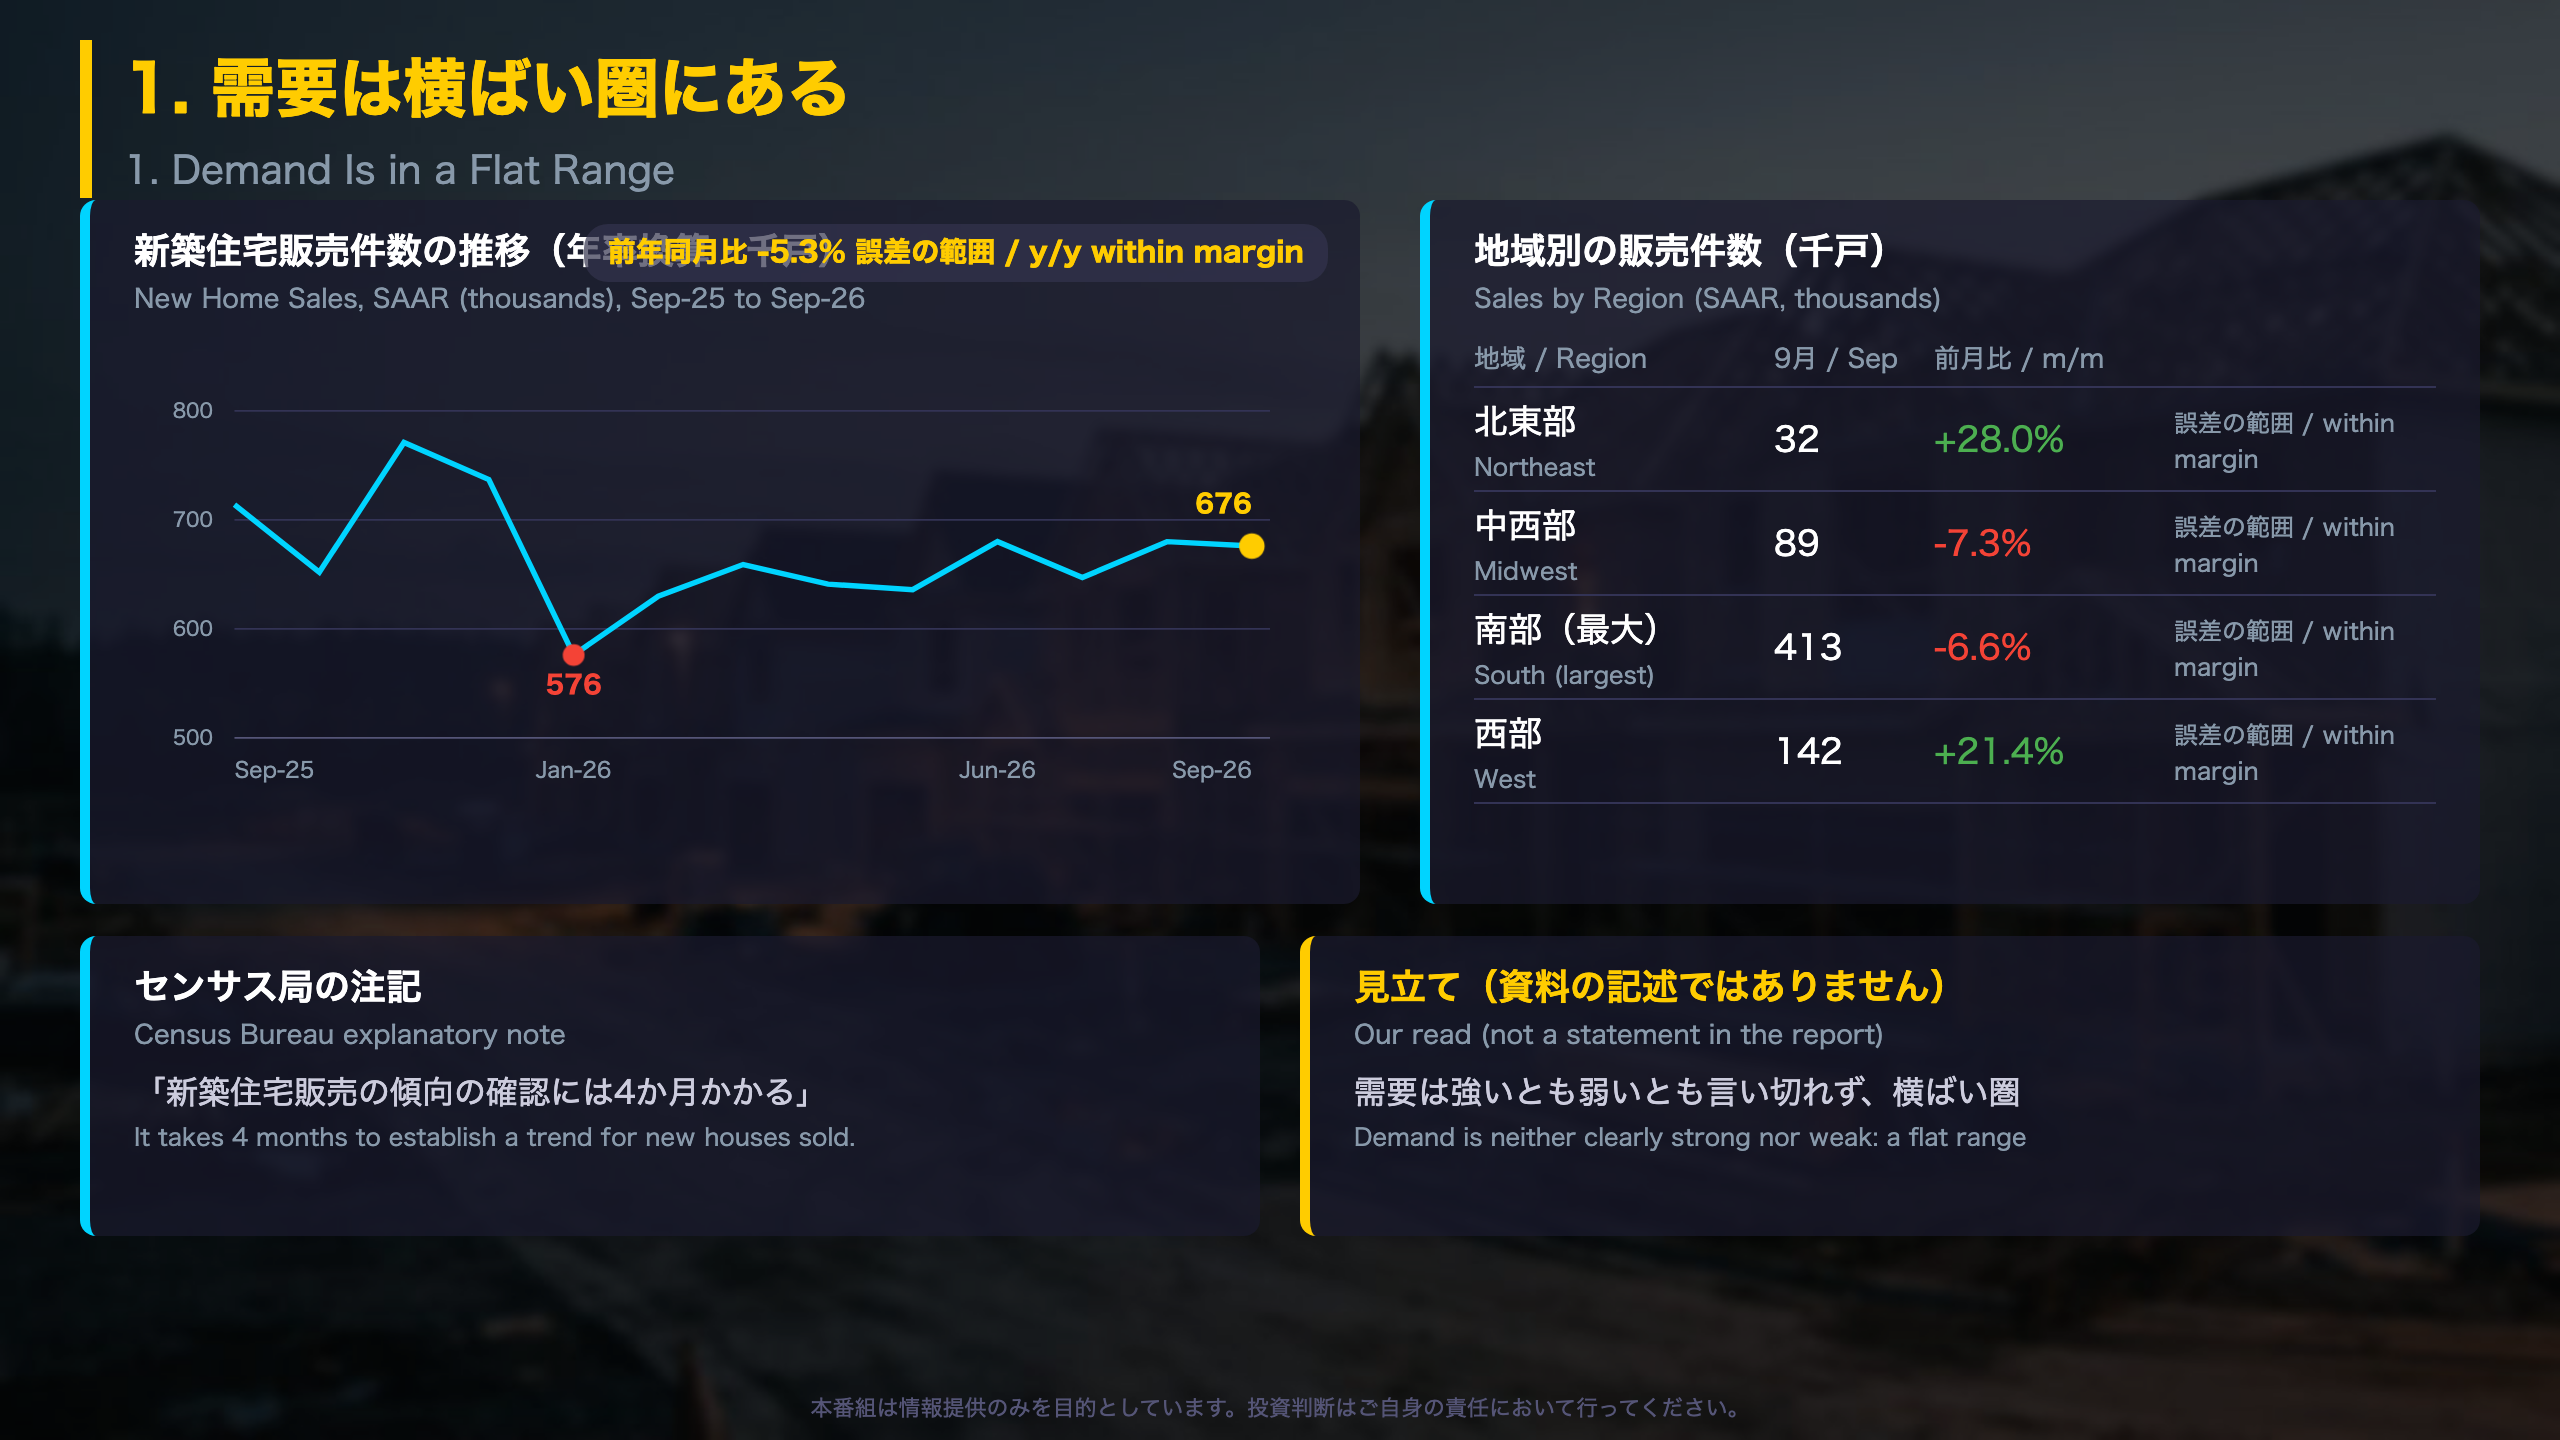
Sales dropped to 576,000 in January and have ranged between 647,000 and 680,000 since June. The Bureau cautions that ‘it takes 4 months to establish a trend for new houses sold’, and that preliminary estimates are revised by about 6.7% on average.
Why it matters for global readers
Housing is generally regarded as one of the more interest-rate-sensitive parts of the U.S. economy, so this series is closely watched. Unlike many national statistics, the release prints explicit confidence intervals, which makes it easy to separate signal from noise. This month, the sales numbers are mostly noise, while the drop in inventory is a small but real move.
Next release: November 25, 2026 (October data).
深掘り1:需要は横ばい圏にある
Regional Detail and Sub-Indicators
Sales by region (SAAR, thousands)
| Region | Sep | Aug | m/m (90% CI) | y/y |
|---|---|---|---|---|
| Northeast | 32 | 25 | +28.0% (±51.6) | +10.3% |
| Midwest | 89 | 96 | -7.3% (±33.5) | -8.2% |
| South | 413 | 442 | -6.6% (±17.0) | -0.7% |
| West | 142 | 117 | +21.4% (±29.4) | -17.4% |
The confidence intervals are very wide, which is typical for regional slices of a sample survey. Every interval spans zero, so none of the regional moves is statistically distinguishable from no change. The West may be partly rebounding from a weak August (117,000), yet it remains well below its level a year ago.
Stage of construction (Table 3a)
Of the 676,000 homes sold, 380,000 were completed, 214,000 were under construction and 82,000 had not yet been started. Sales of not-started homes rose from 65,000 in August. Note that in the U.S., a ‘sale’ is counted when a deposit is taken or a contract is signed, which can occur before a building permit is issued.
How to read it
- Constructive: the national figure is stable relative to recent months, and two regions rose.
- Cautious: the South, which accounts for the largest volume, edged down.
‘It takes 4 months to establish a trend for new houses sold.’ (Census Bureau)
For international readers, this note matters: unlike headline CPI, new home sales are volatile and frequently revised, with preliminary estimates revised by roughly 6.7% on average. The next data point, for October, arrives on November 25, 2026.
深掘り2:在庫と価格
Inventory Structure and Price Detail
What is on the market (for sale, SA, thousands)
| Stage | Sep 2025 | Aug 2026 | Sep 2026 |
|---|---|---|---|
| Not started | 103 | 112 | 115 |
| Under construction | 262 | 257 | 250 |
| Completed | 122 | 112 | 111 |
| Total | 487 | 481 | 476 |
Completed homes for sale have trended down from 128,000 in January, while not-started homes are the highest in the 13-month table. That mix hints that builders are leaning on homes sold before completion, though a single report cannot confirm it.
Months’ supply in context
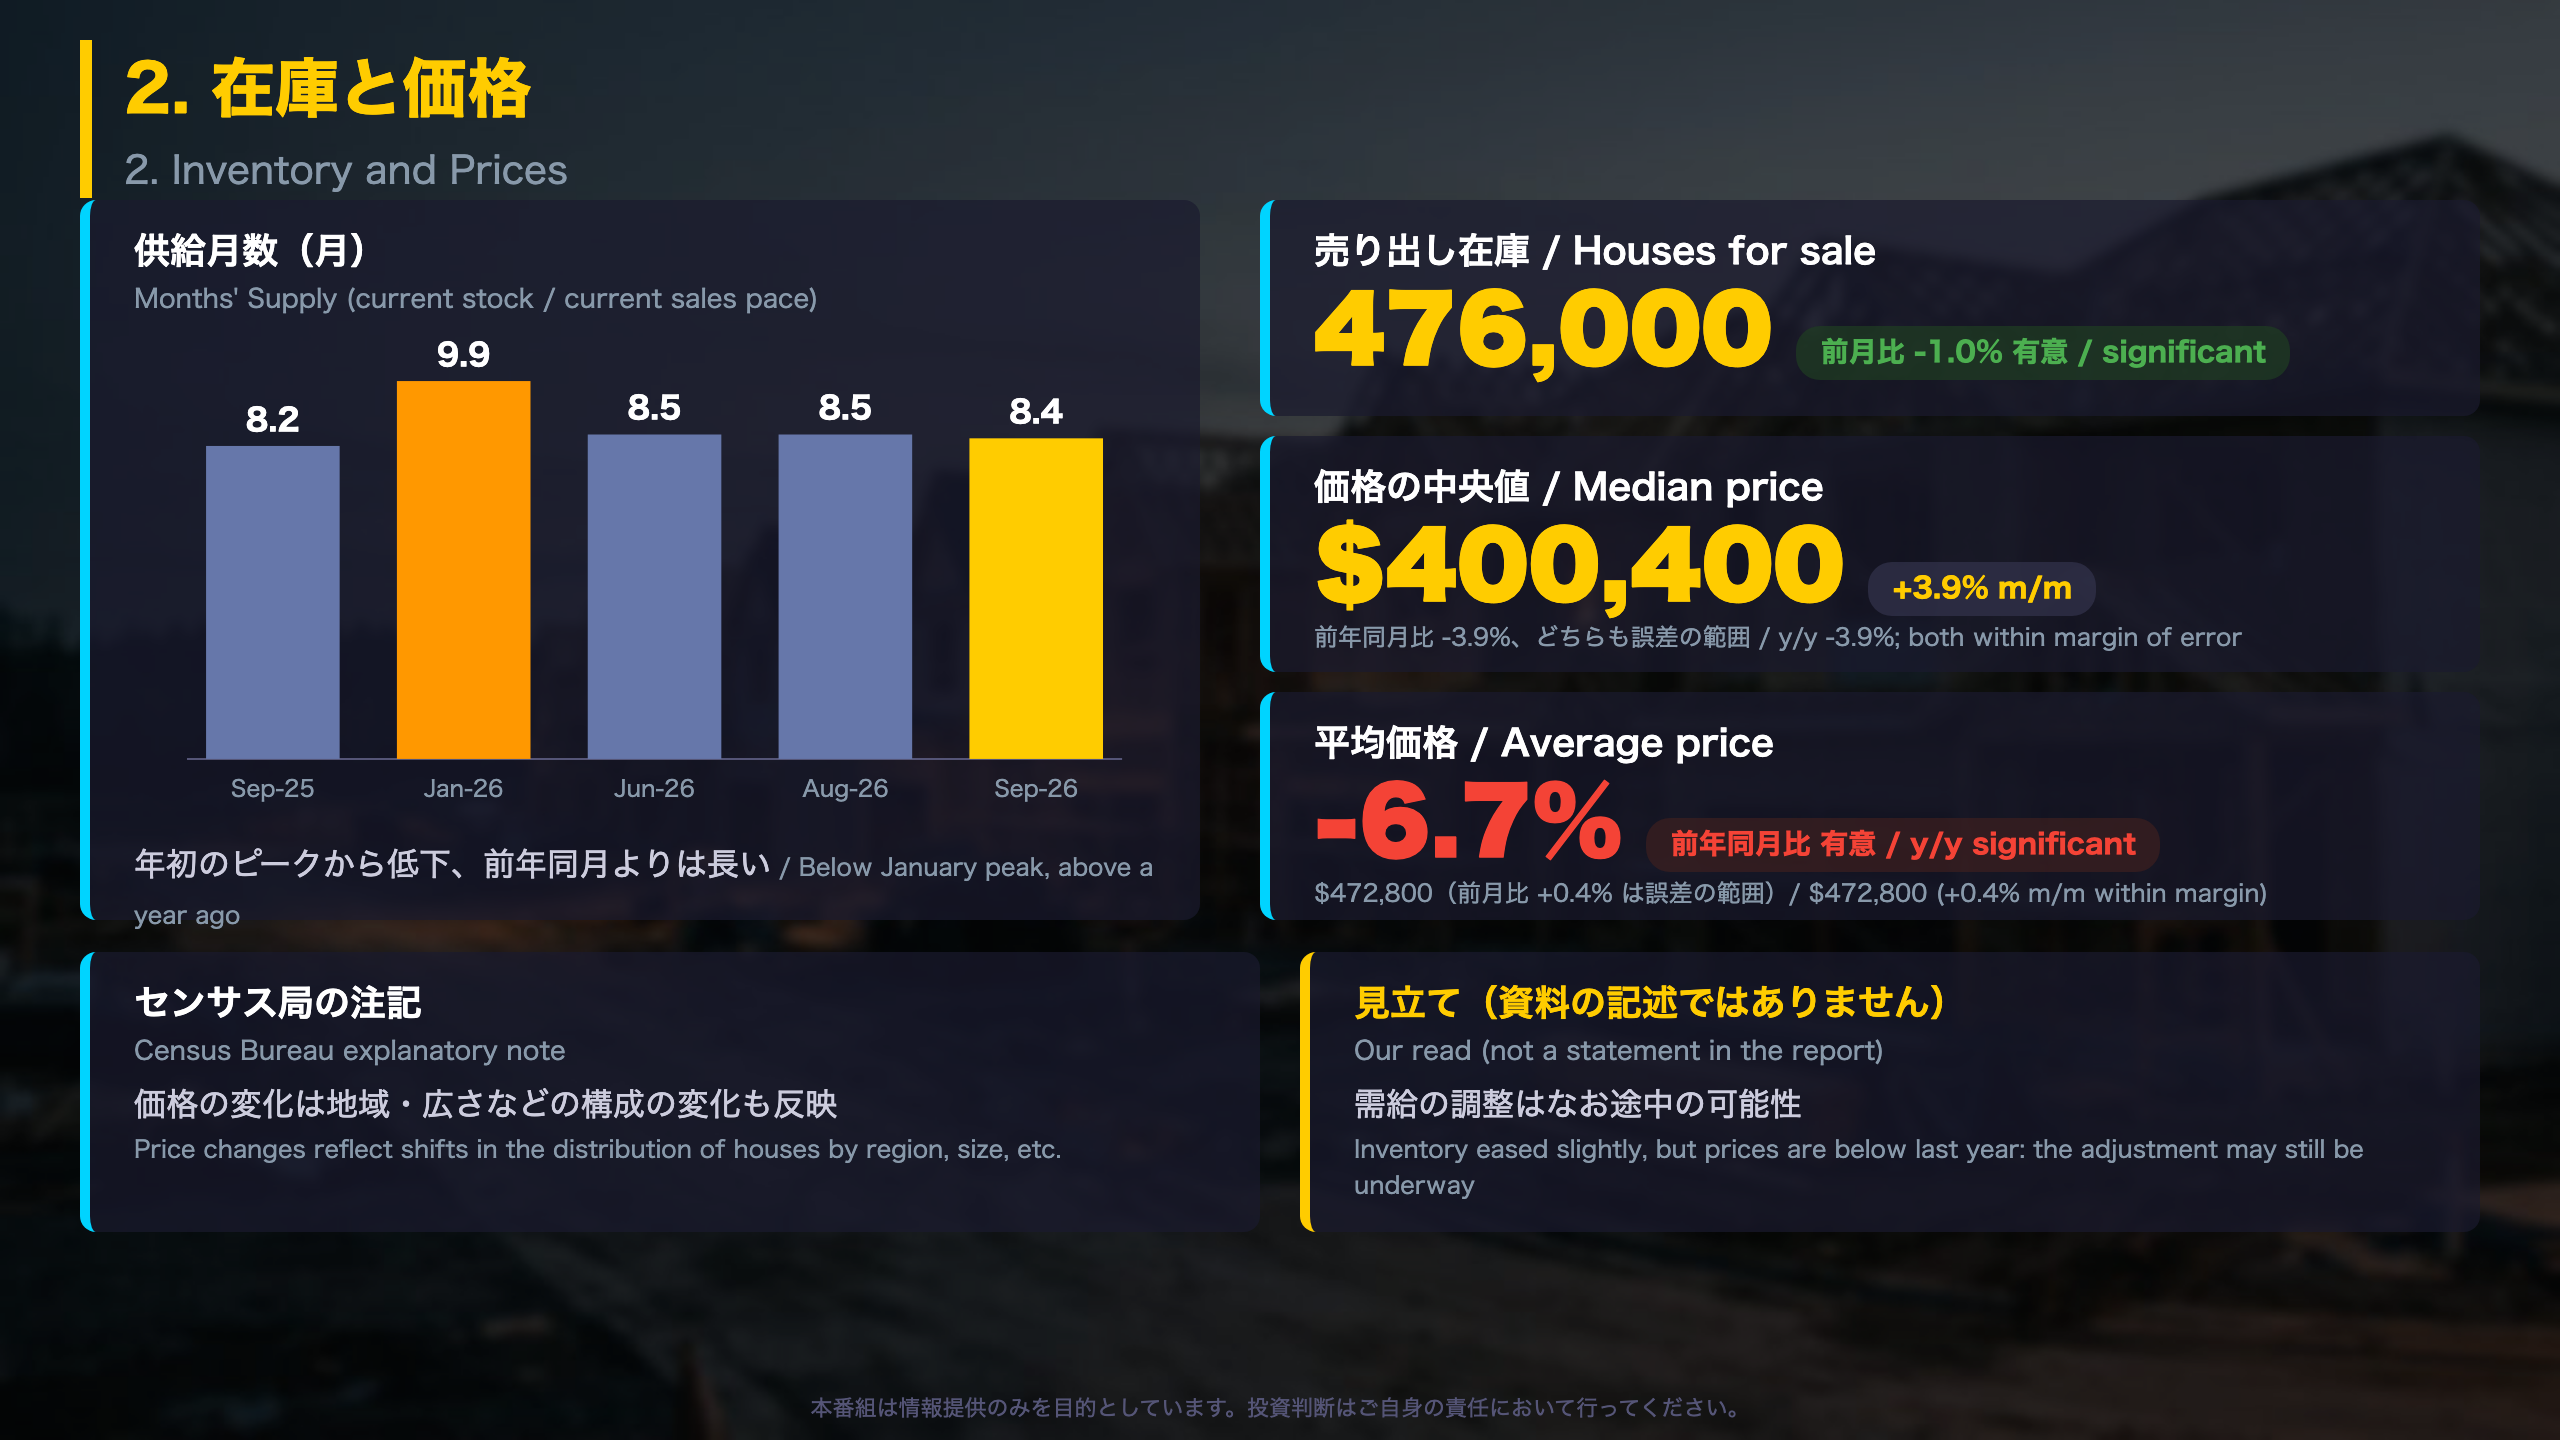
Months’ supply is the stock of homes for sale divided by the current sales pace. It was 8.2 in September 2025, dipped to 7.7 in November, spiked to 9.9 in January, and has hovered between 8.4 and 9.2 since. At 8.4 it is mid-range, and above the 6-month level that is often cited as a balanced market in U.S. commentary.
Prices
- Median: $400,400, +3.9% m/m and -3.9% y/y, both within the margin of error
- Average: $472,800, +0.4% m/m (not significant) and -6.7% y/y (significant)
‘Changes in sales price data reflect changes in the distribution of houses by region, size, etc.’ (Census Bureau)
Balanced reading
The significant fall in inventory and the lower months’ supply versus January are signs of an adjusting market. But prices and supply have not yet returned to year-ago levels (median $416,800, supply 8.2 months). Mix effects between regions and sizes make price comparisons tricky; the report gives no breakdown. Next release: November 25, 2026.
質疑:価格の食い違いと売れ残りの度合い
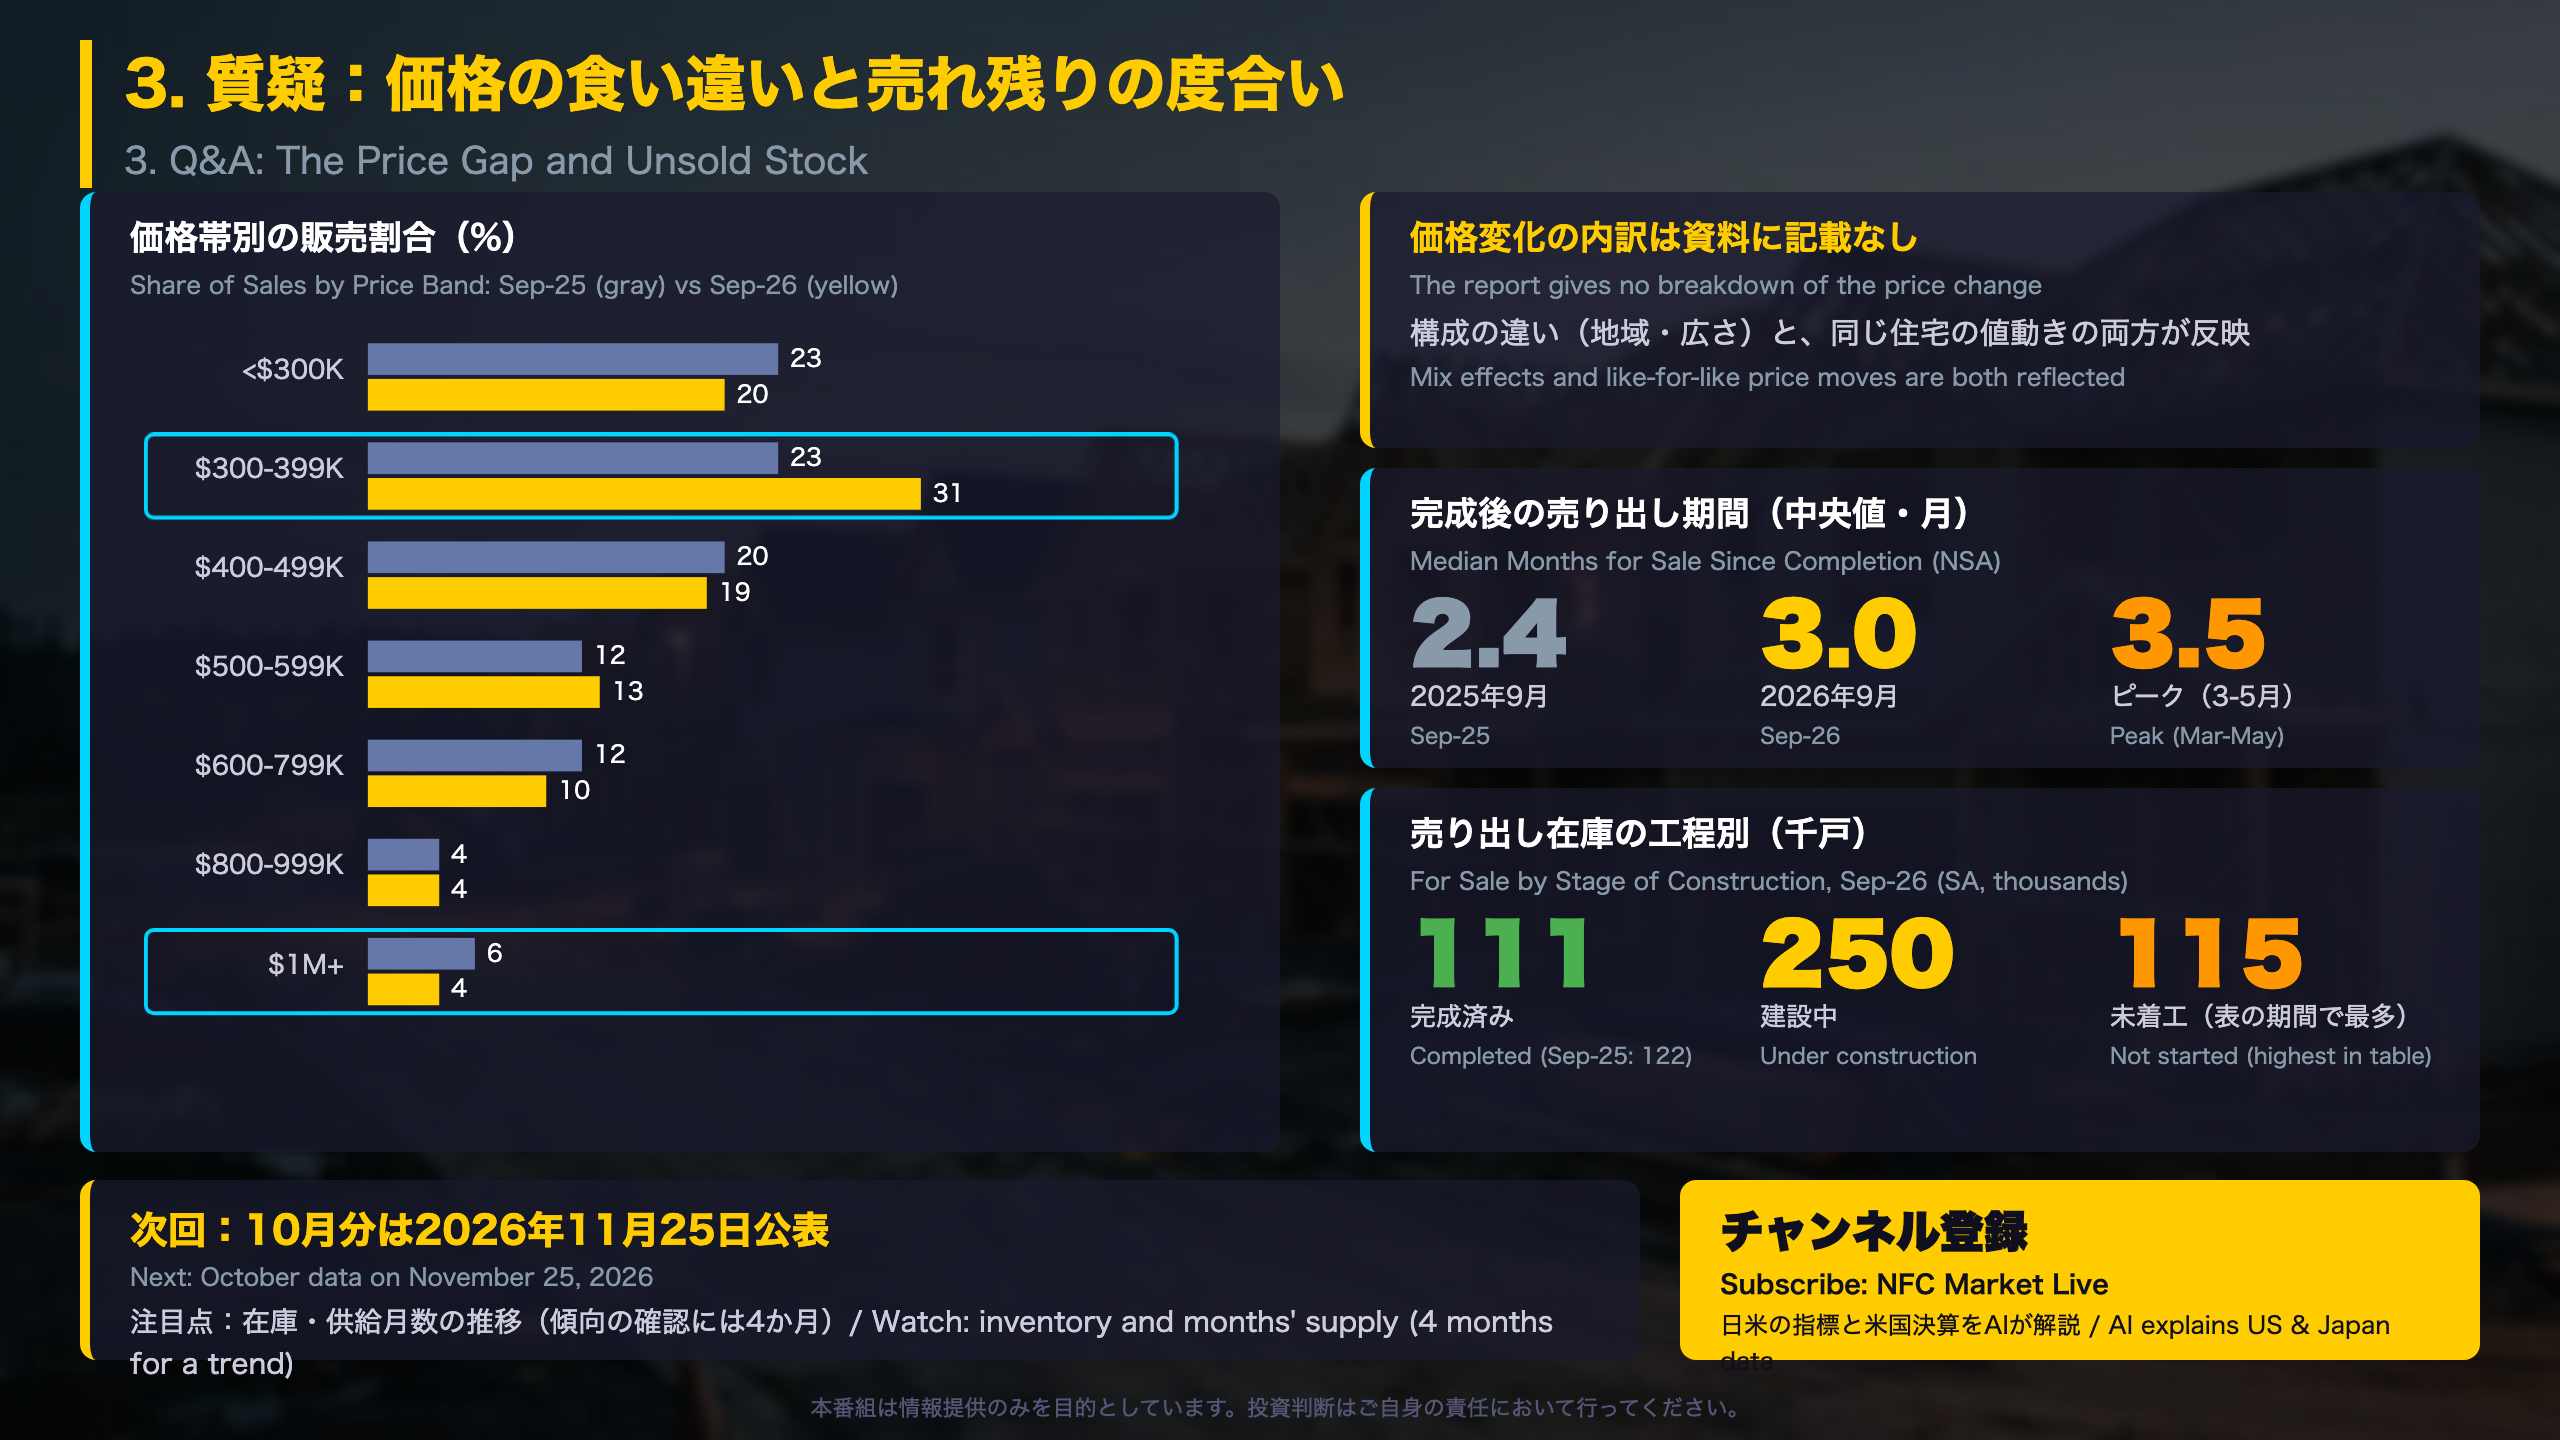
Price-Band Mix and Time on Market
Share of sales by price band (%)
| Price band | Sep 2025 | Sep 2026 |
|---|---|---|
| Under $300K | 23 | 20 |
| $300-399K | 23 | 31 |
| $400-499K | 20 | 19 |
| $500-599K | 12 | 13 |
| $600-799K | 12 | 10 |
| $800-999K | 4 | 4 |
| $1M and over | 6 | 4 |
The $300-399K band rose from 23% to 31% of sales, while the $1M-plus band slipped from 6% to 4%. A shift toward lower-priced homes is one possible explanation for why the average price is down significantly year on year (-6.7%) while the median change (-3.9%) is statistically indistinguishable from zero. The report, however, does not break out mix versus like-for-like price effects, so no causal claim is possible.
Time on market
The median number of months a completed new home has been for sale rose from 2.4 (September 2025) to a 3.5-month plateau from March to May, and has since eased to 3.1, 3.1 and 3.0. Shorter durations suggest completed homes are turning over a little faster, but the number of not-started homes for sale (115,000) is the highest in the table.
‘Changes in sales price data reflect changes in the distribution of houses by region, size, etc., as well as changes in the prices of houses with identical characteristics.’
What to watch next
- The Census Bureau’s caution that a trend takes four months to establish
- Inventory, months’ supply (recent range 7.7 to 9.9), and not-started stock
- Next release: November 25, 2026 (October data)
This is a fact-based checklist, not a forecast of housing or Fed policy.
Disclaimer: This article is for informational purposes only. All investment decisions are made solely at your own risk.