📺 Watch the Full Video Analysis
This article was automatically generated by the NFC Market Live AI analysis system. (Updated: 2026-10-15 21:45 JST)
📄 Primary Source
U.S. Bureau of Labor Statistics
https://www.bls.gov/news.release/pdf/ppi.pdf
📊 A walk-through of the September Producer Price Index released by the U.S. Bureau of Labor Statistics on Oct 15.
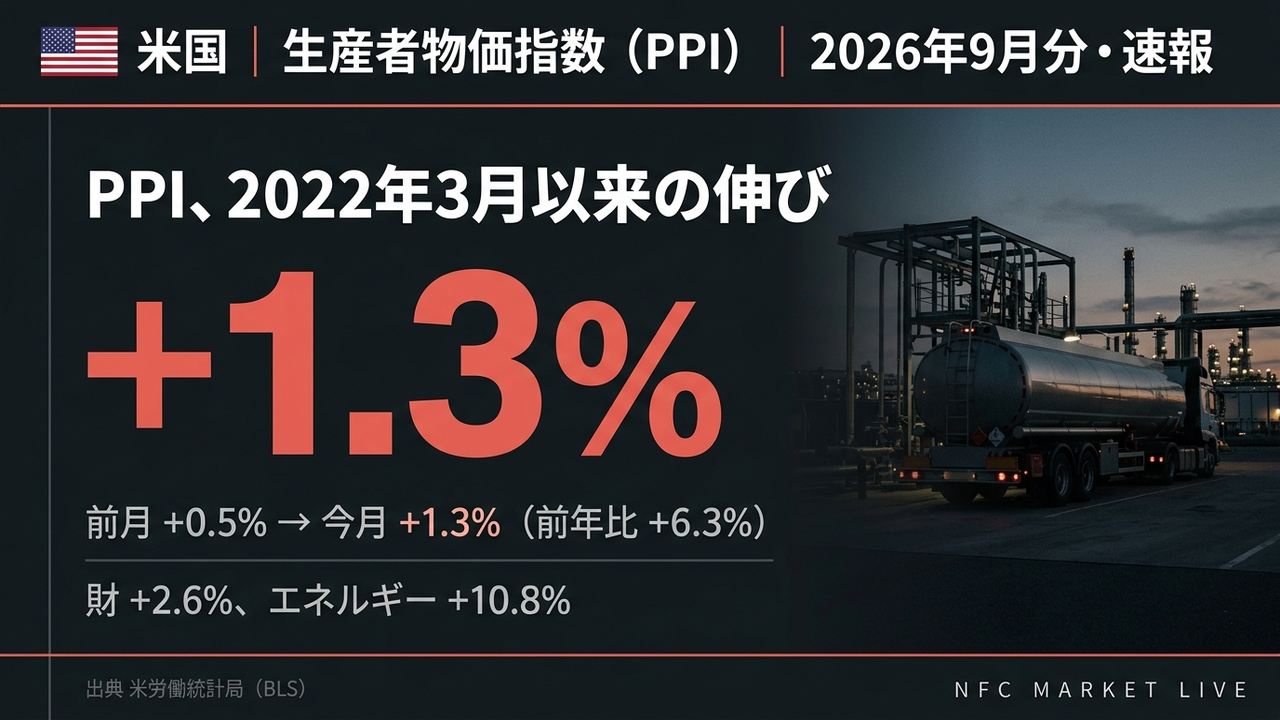
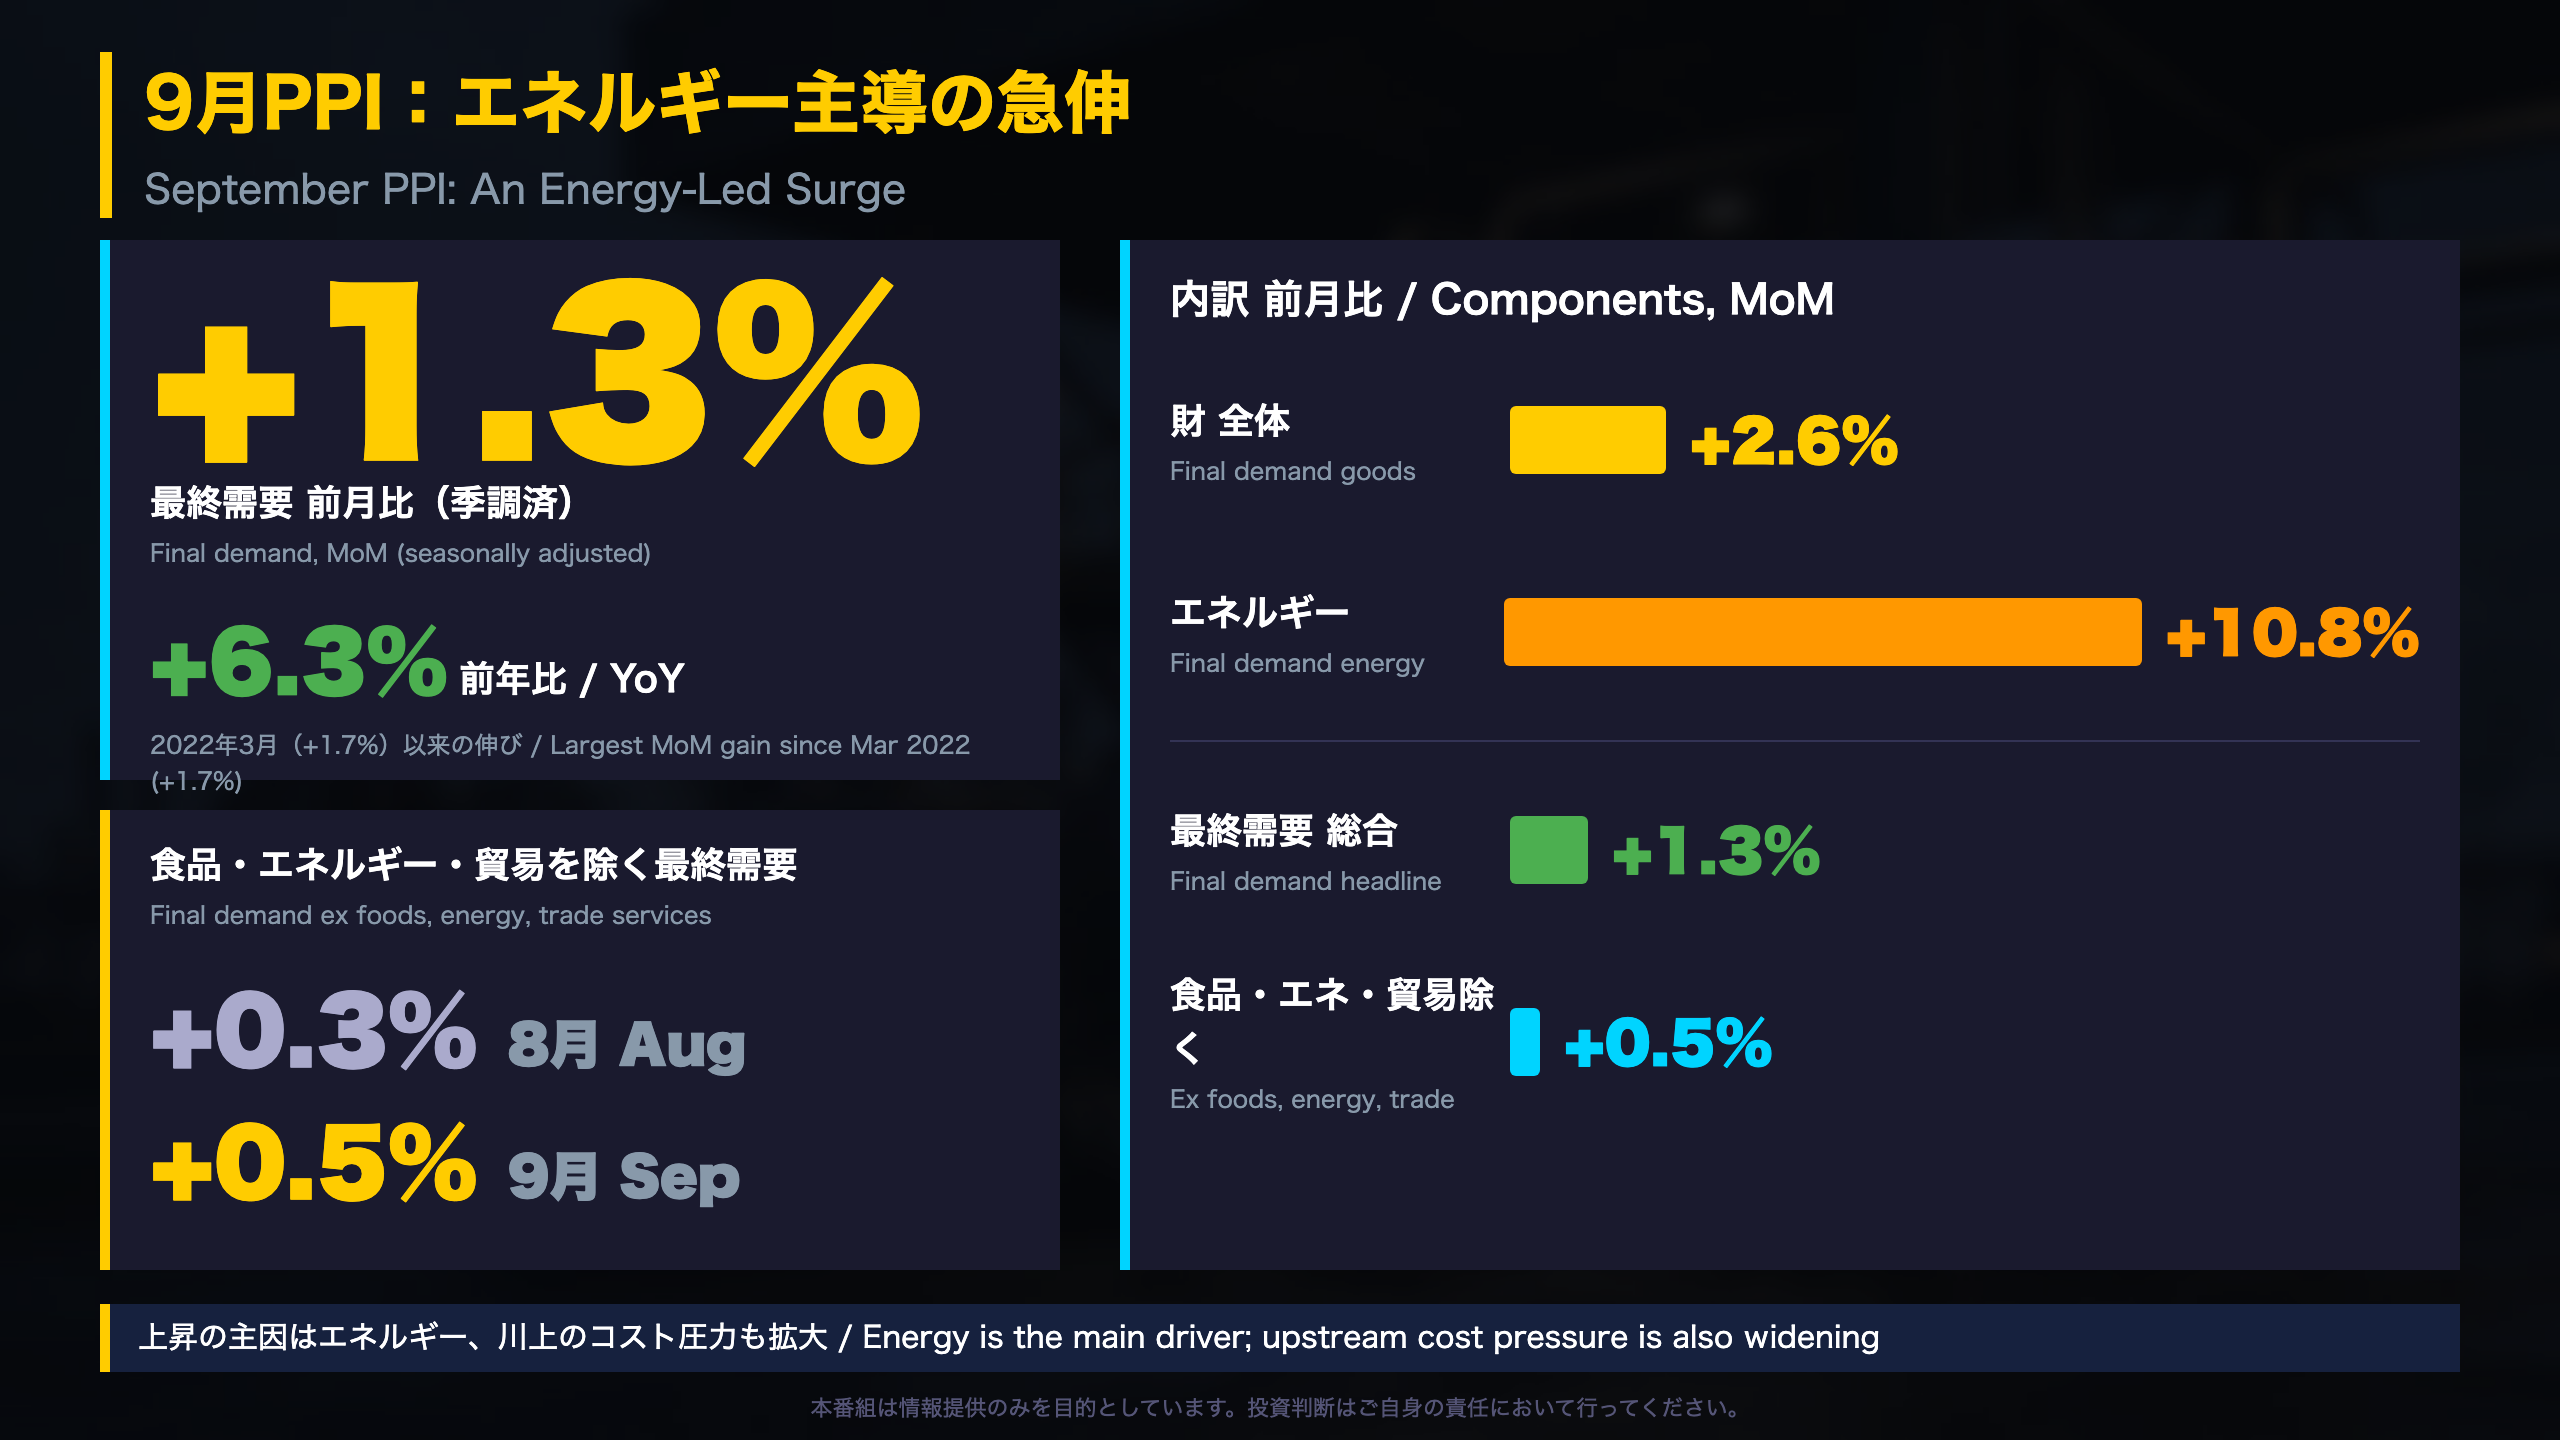
📈 Final demand rose 1.3% MoM and 6.3% YoY. Goods +2.6%, energy +10.8%, gasoline +20.3%.
🔎 Final demand excluding foods, energy and trade services rose 0.5% (0.3% in August). Intermediate stage 2 +3.9%, stage 4 +1.1%.
💡 The jump is energy-led, yet cost pressure is also building upstream. We lay out why the print leans hawkish for the next CPI and the Fed’s inflation read, with the offsetting factors.
⚠️ PPI and CPI differ in scope, so pass-through is not one-for-one.
📅 Next: October PPI on Nov 13.
9月PPI:エネルギー主導の急伸
What the September PPI Says at a Glance
The Producer Price Index (PPI), published by the U.S. Bureau of Labor Statistics (BLS), measures price changes from the seller’s perspective, unlike the Consumer Price Index, which measures them from the buyer’s. The headline gauge, final demand, covers goods, services and construction sold for consumption, investment, government use and export.
Headline numbers
- Final demand: +1.3% MoM, seasonally adjusted, the largest since +1.7% in March 2022.
- Year over year: +6.3%, the highest since +6.4% in December 2022.
- Prior months were revised up: August to +0.5% from +0.4%, July to +0.2% from +0.1%.
Strength versus restraint
Goods jumped 2.6%, the largest since the series began in December 2009. Yet the narrower measure excluding foods, energy and trade services rose 0.5%, less than half the headline, and the annual rate of that measure is 5.0%, up from 4.7% in the August release.
Why it matters internationally
For readers used to Japan’s Corporate Goods Price Index, the closest analogue, note that the U.S. PPI includes services (about 68% of final demand weights), which makes it a broader pipeline gauge. The Federal Reserve watches PPI mainly as an early read on consumer price components, not as a direct policy trigger.
The next release, for October, is due Nov 13 at 8:30 a.m. ET.
最終需要の中身:寄与度の簡易試算
Decomposing the 1.3% Headline
BLS publishes relative importance weights for each PPI component, updated each December. For final demand, services carry roughly 68% of the weight, goods 29% and construction 2.6%. Trade services (margins earned by wholesalers and retailers) alone are close to 20%.
A rough contribution estimate (our own calculation)
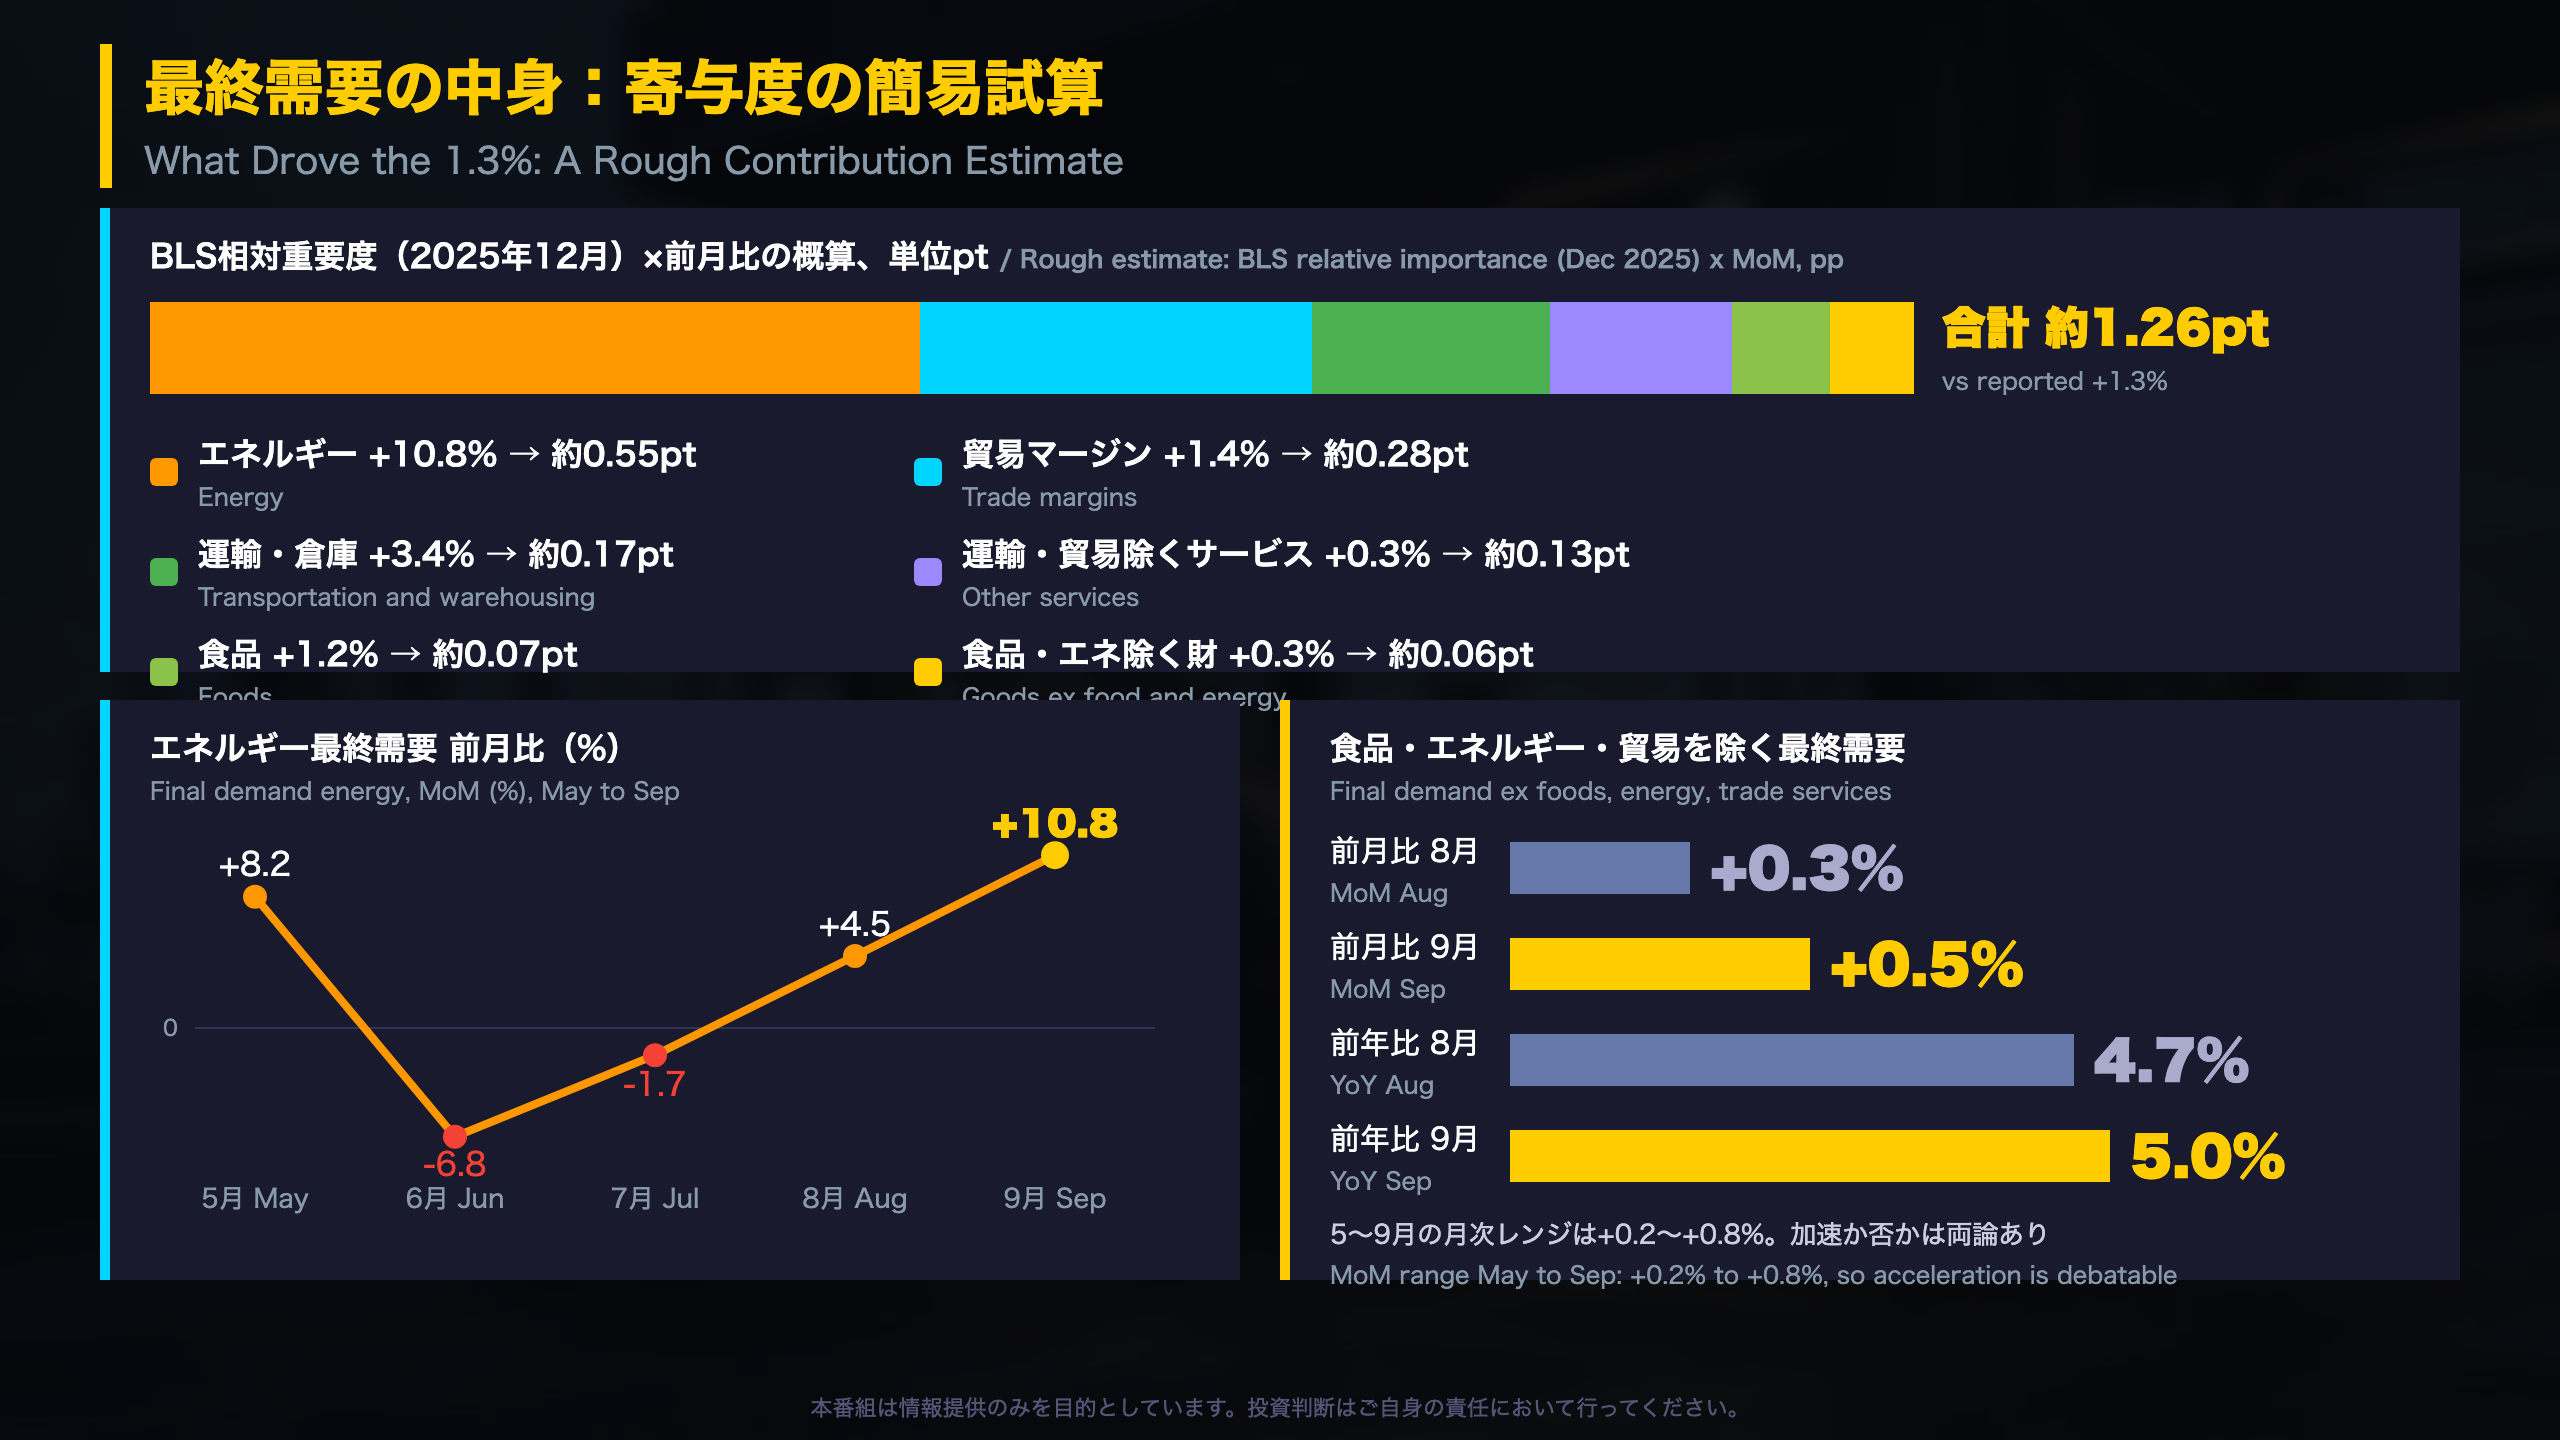
Multiplying December 2025 weights by September monthly changes gives approximately:
- Energy: about 0.55 points
- Trade margins: about 0.28 points
- Transportation and warehousing: about 0.17 points
- Other services: about 0.13 points
- Foods: about 0.07 points; core goods about 0.06 points
The sum, about 1.26 points, is close to the reported 1.3%, though effective weights drift as prices move, so treat this as a guide only.
Volatility matters
Final demand energy moved +8.2%, -6.8%, -1.7%, +4.5% and +10.8% from May to September. Such swings are why many analysts focus on measures stripping out food, energy and trade. That measure ran +0.8%, +0.2%, +0.5%, +0.3% and +0.5% over the same months, so September looks like a pickup but sits inside its recent range.
Comparison with Japan
Japan’s Corporate Goods Price Index is more goods-weighted, so a given energy shock tends to loom larger there than in the U.S. PPI, where services dominate the basket.
財とサービス:主因は燃料、運輸、貿易マージン
Goods: Energy Leads, but Details Diverge
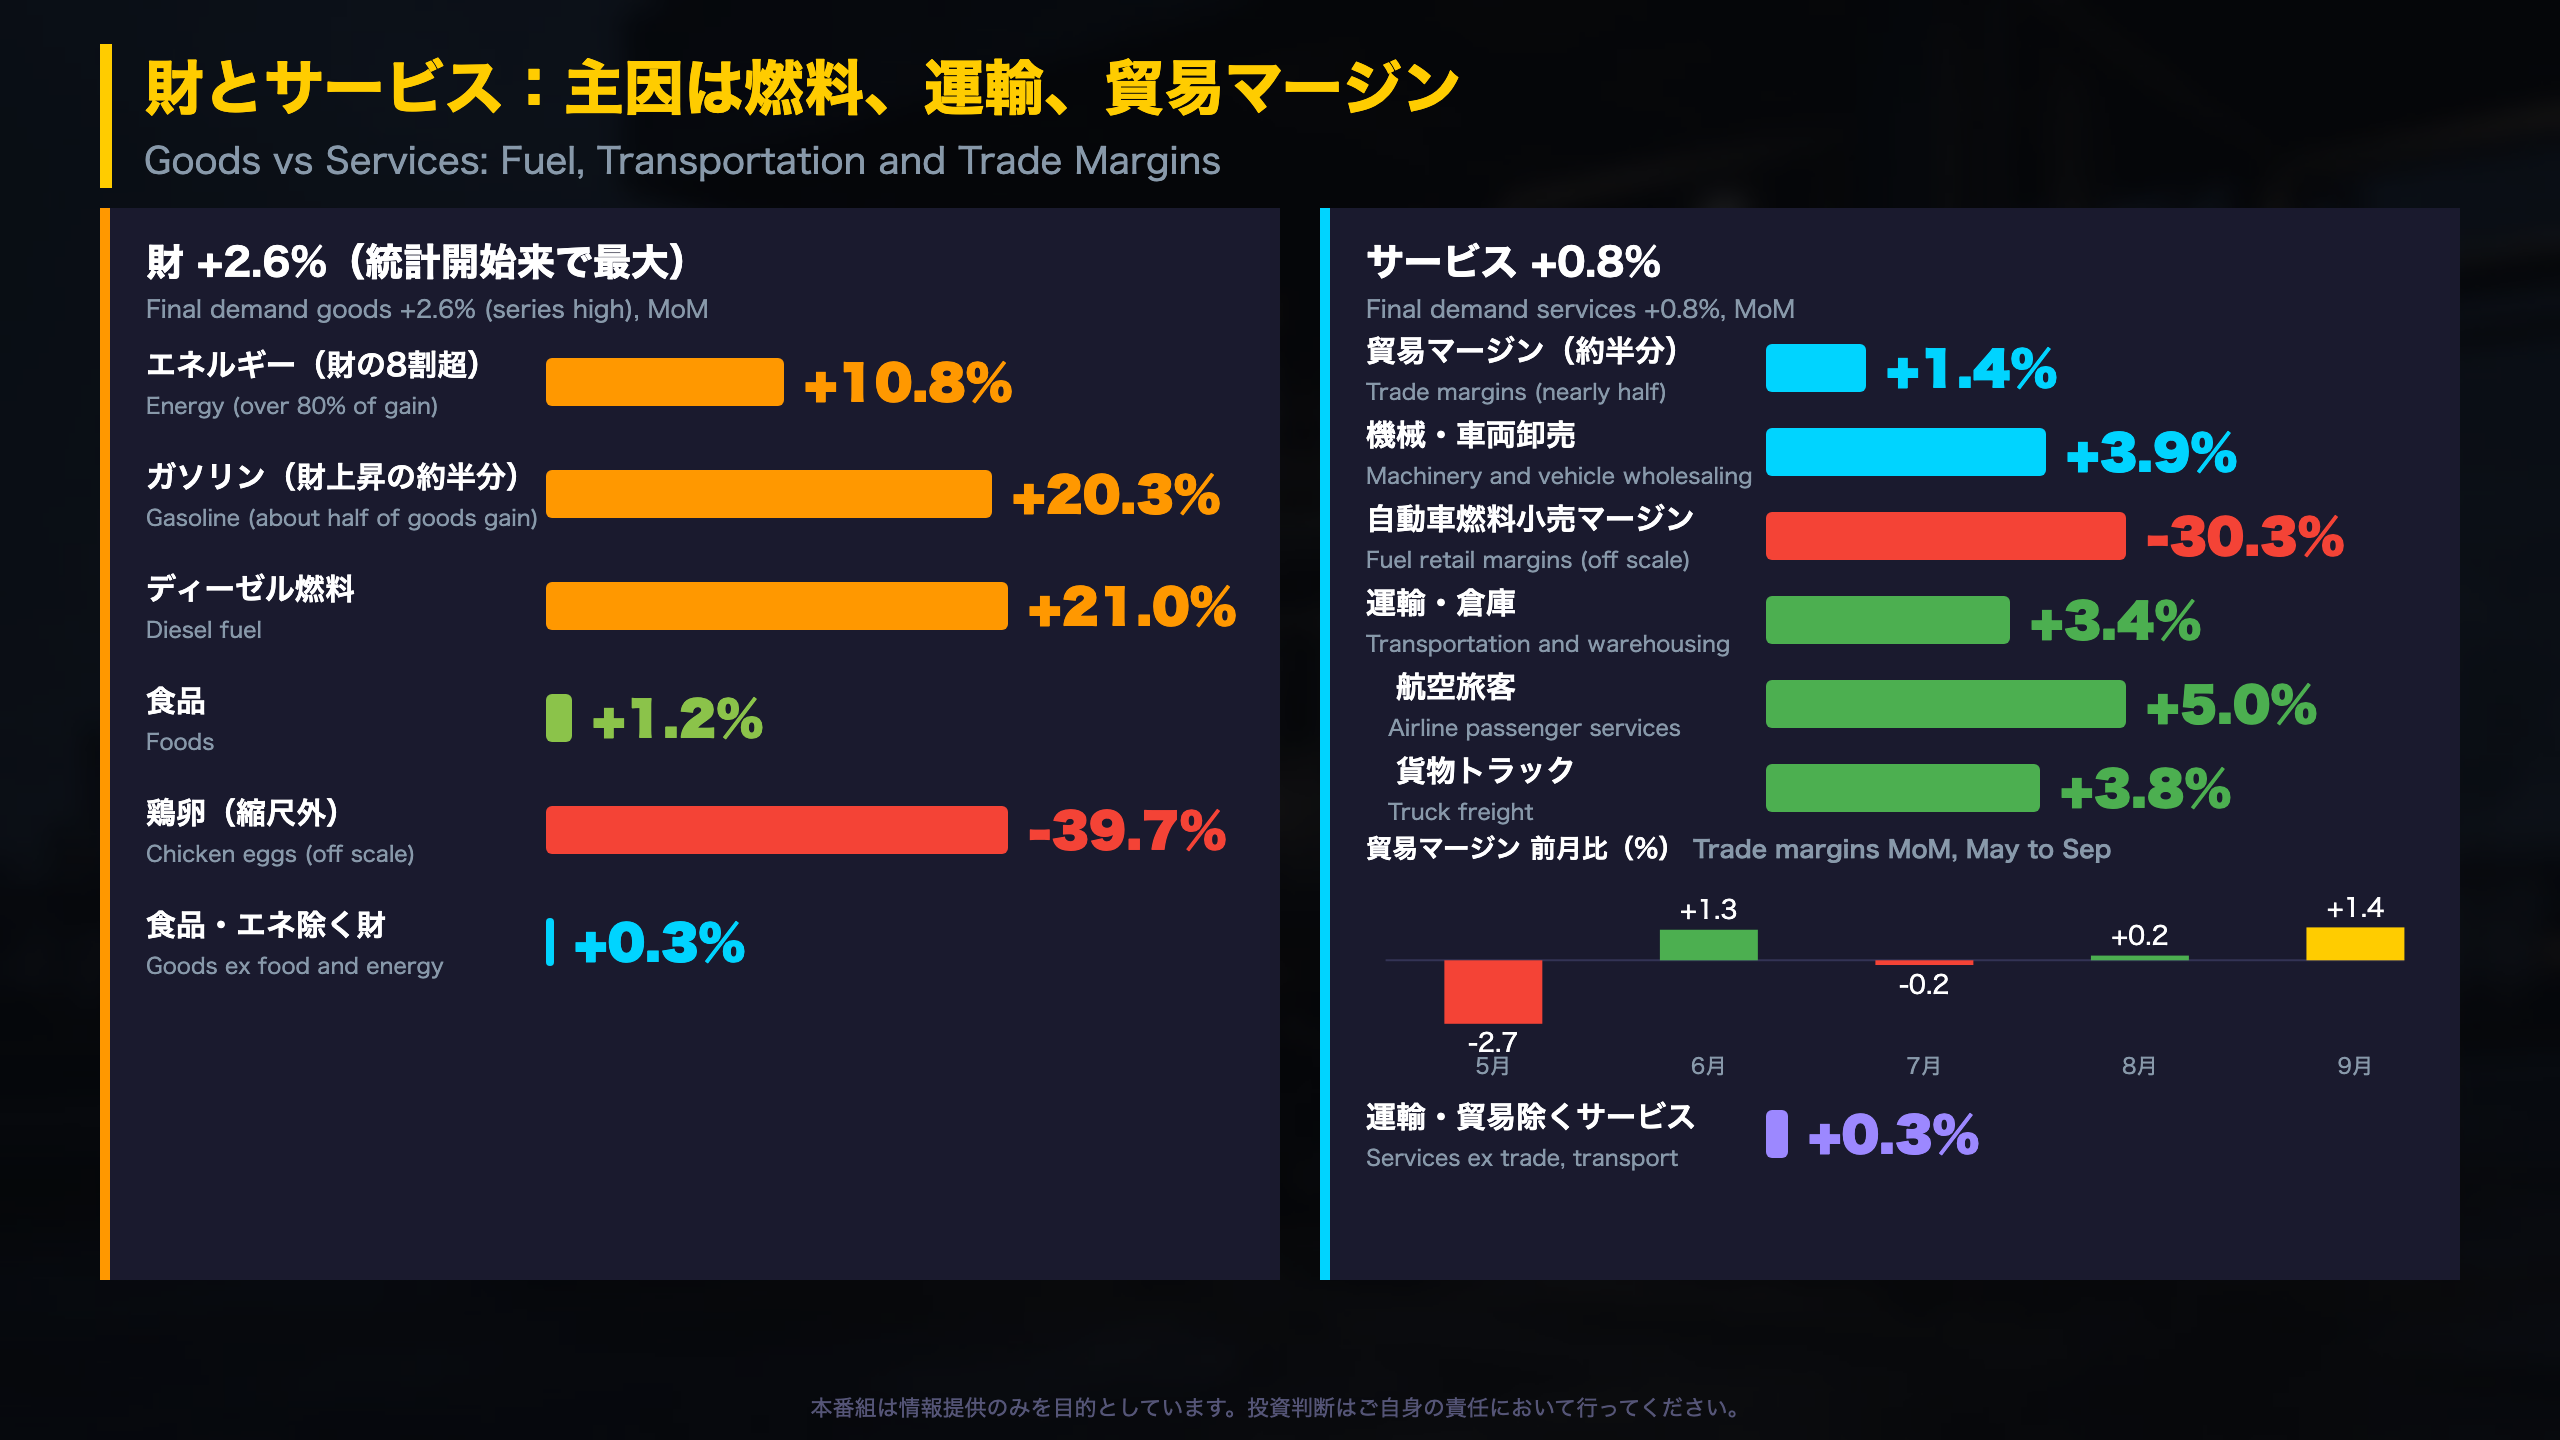
Final demand goods rose 2.6%, the largest since BLS began calculating the series in December 2009. Energy rose 10.8% and accounted for over 80% of the gain. Gasoline (+20.3%) alone explains about half of it, and diesel rose 21.0%. In foods, fresh vegetables climbed 41.0% while eggs fell 39.7%, a reminder that agricultural items swing widely.
Goods excluding foods and energy rose 0.3%, within a 0.2% to 0.4% band over the last four months.
Services: Margins and Transportation
PPI trade services measure margins, not retail prices: the spread wholesalers and retailers earn over their acquisition cost. Machinery and vehicle wholesaling margins rose 3.9% after a string of declines, while automotive fuel retailing margins fell 30.3%. A plausible reading, though based on one month, is that pump prices lagged wholesale costs.
Transportation and warehousing jumped 3.4% (airline passengers +5.0%, truck freight +3.8%), consistent with higher fuel costs but also with volatile airfares.
Why this matters for CPI
CPI does not include trade margins in the same way, and owners’ equivalent rent, its largest component, is absent from PPI. Services ex trade, transportation and warehousing, the part most similar to sticky consumer services, rose only 0.3%.
For Japanese readers: this is roughly the services-side counterpart that Japan’s Services Producer Price Index tracks, though U.S. PPI services coverage is broader.
中間需要:川上のコスト圧力はどこまで広がるか
Reading the Pipeline
BLS publishes intermediate demand in two ways. By commodity type it splits goods (processed versus unprocessed) and services. By production flow it ranks industries in four stages, with stage 4 serving final demand directly and stage 1 farthest upstream. The stage system was built to study how price changes travel toward consumers.
September stage data
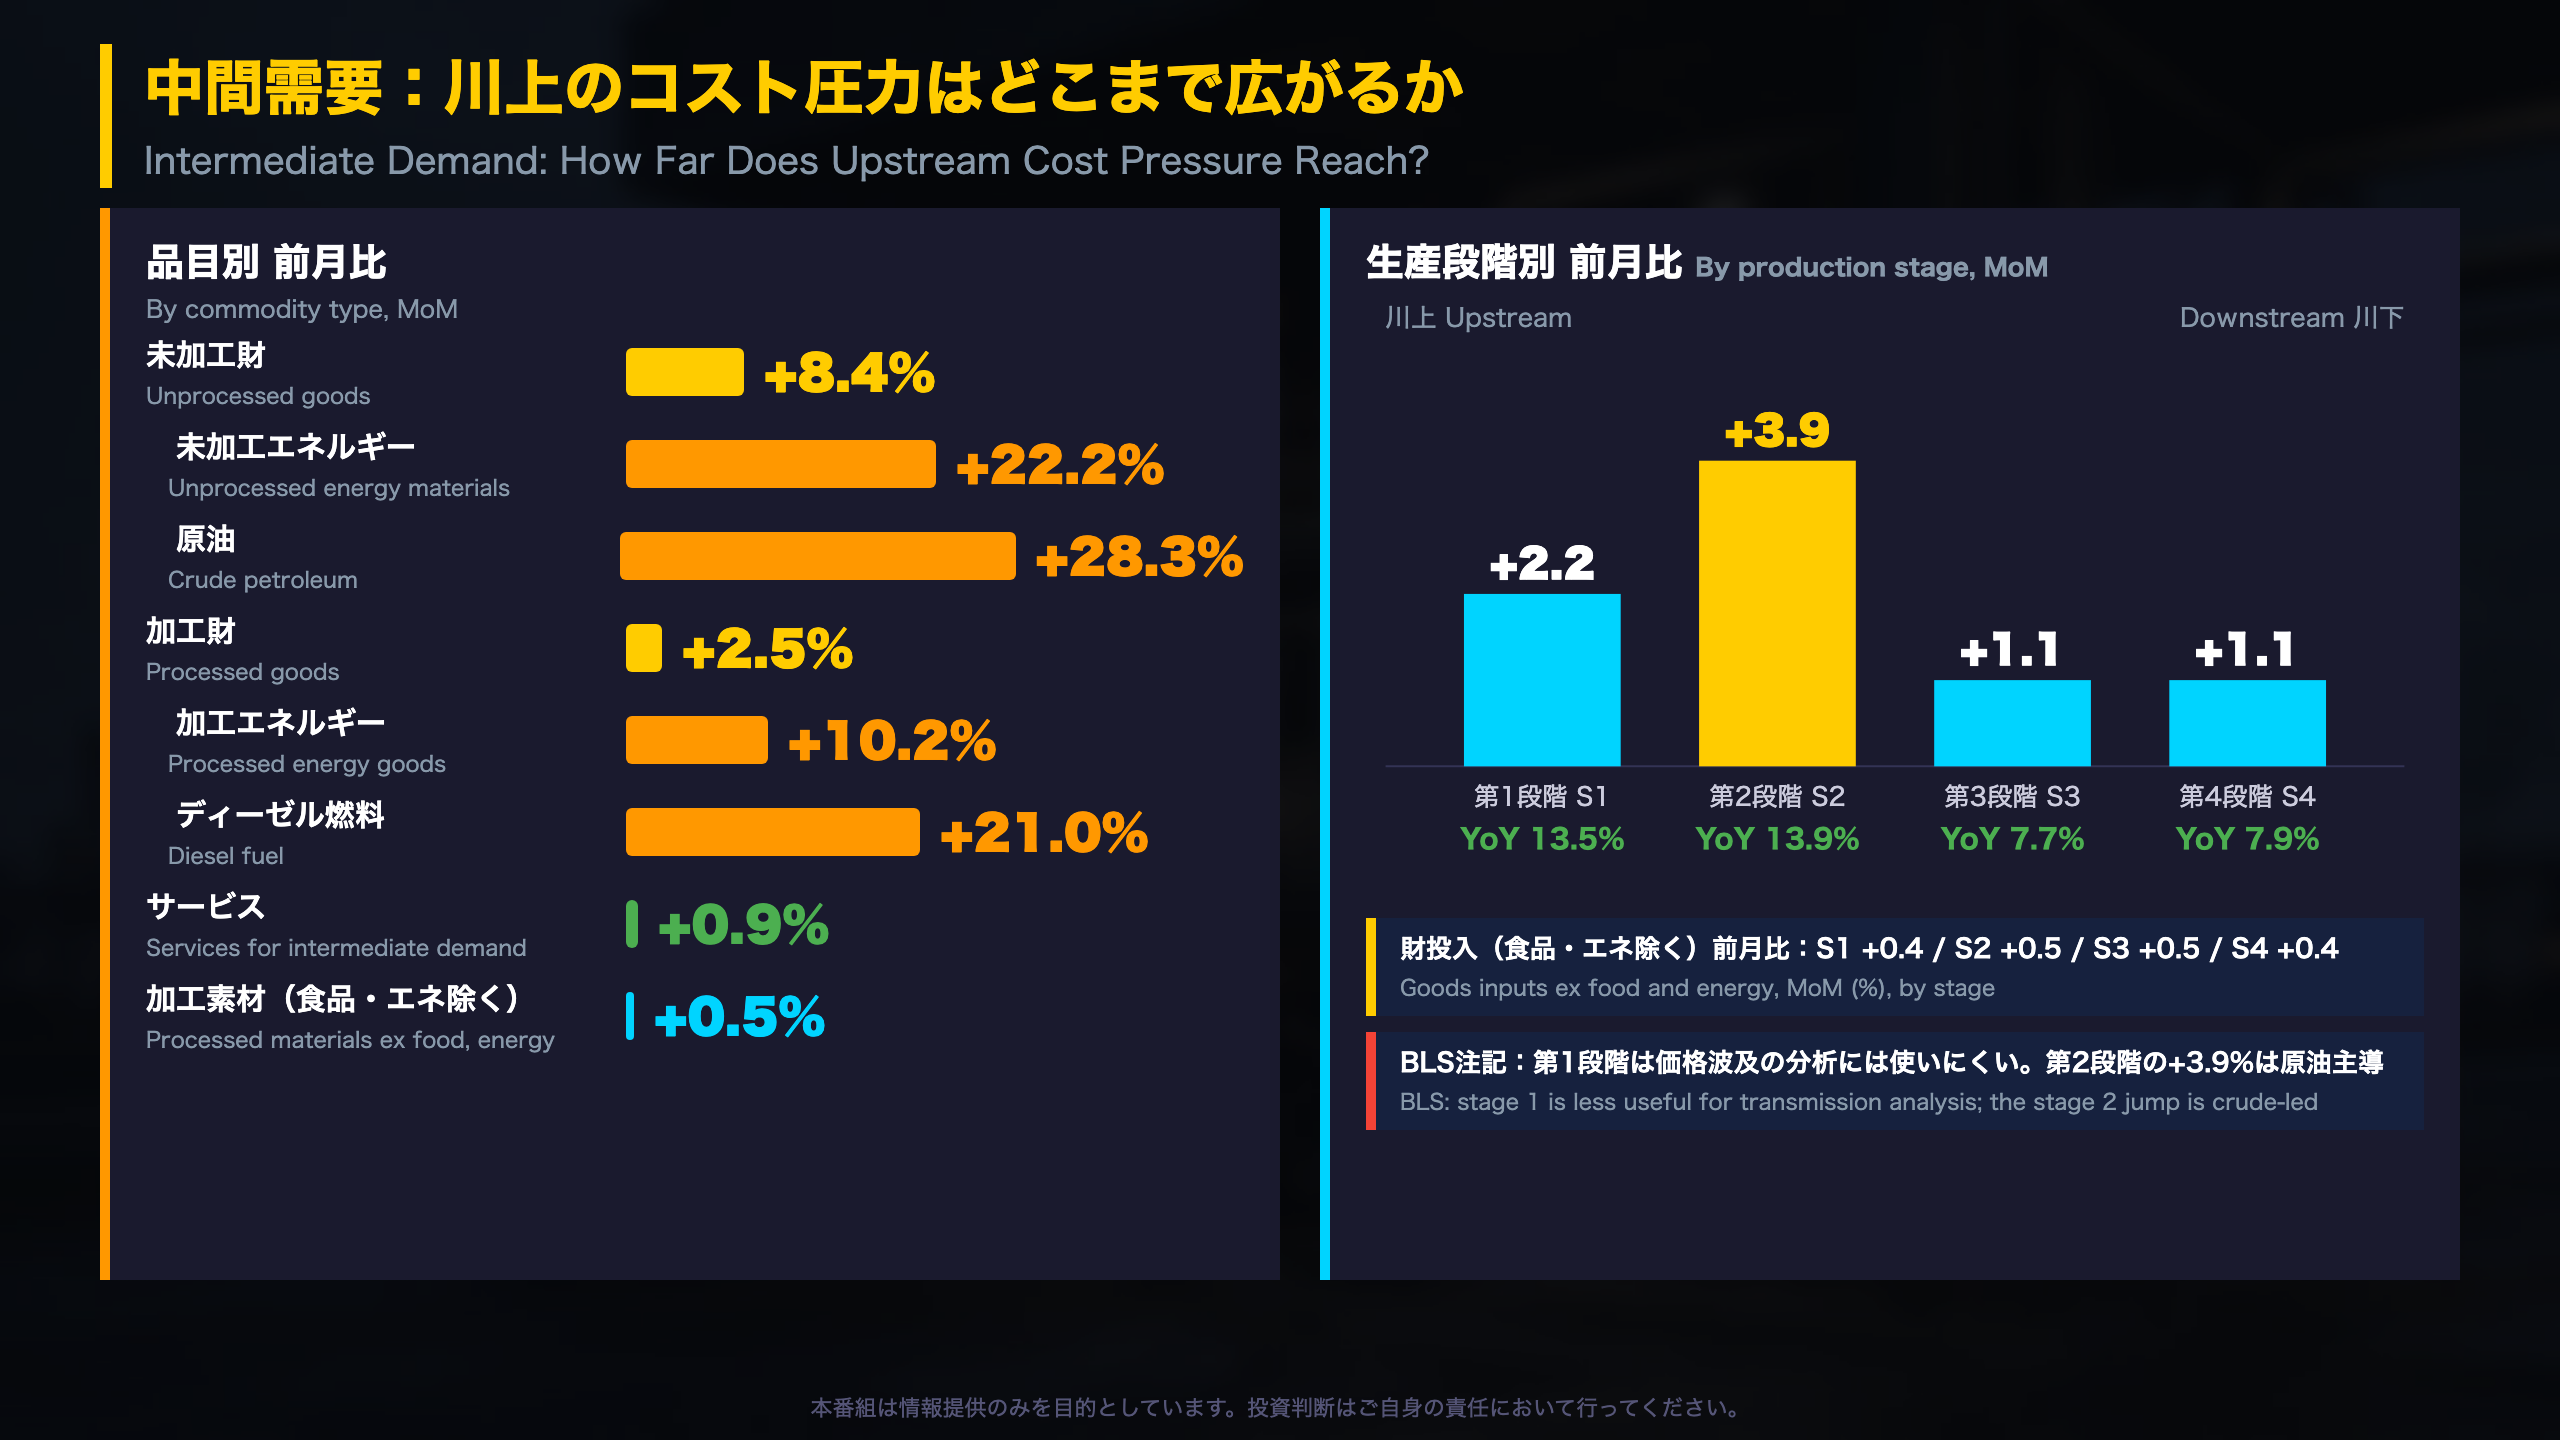
- Stage 1: +2.2% MoM, 13.5% YoY
- Stage 2: +3.9% MoM, 13.9% YoY
- Stage 3: +1.1% MoM, 7.7% YoY
- Stage 4: +1.1% MoM, 7.9% YoY
Goods inputs to stage 2 rose 8.9%, but energy inputs rose 21.5% while goods inputs excluding food and energy rose 0.5%.
By commodity
Processed goods +2.5% (14.1% YoY, highest since August 2022), unprocessed goods +8.4% (21.5% YoY, led by crude petroleum at +28.3%), services +0.9% (6.3% YoY).
Interpretation
A hawkish reading stresses breadth: processed materials excluding food and energy are up 8.5% on the year and steel mill products 27.6%. A more cautious reading notes that the monthly pace outside energy is around 0.5%, and that BLS warns stage 1 is not suited to transmission analysis because its inputs are produced within stage 1 or later stages.
Compared with Japan’s input price indices in the Corporate Goods Price Index, the U.S. stage framework adds services, which are over half of intermediate demand coverage in some segments.
CPI・FRBへのシグナル:タカ派寄り(条件付き)
Verdict: Hawkish-Leaning, With Conditions
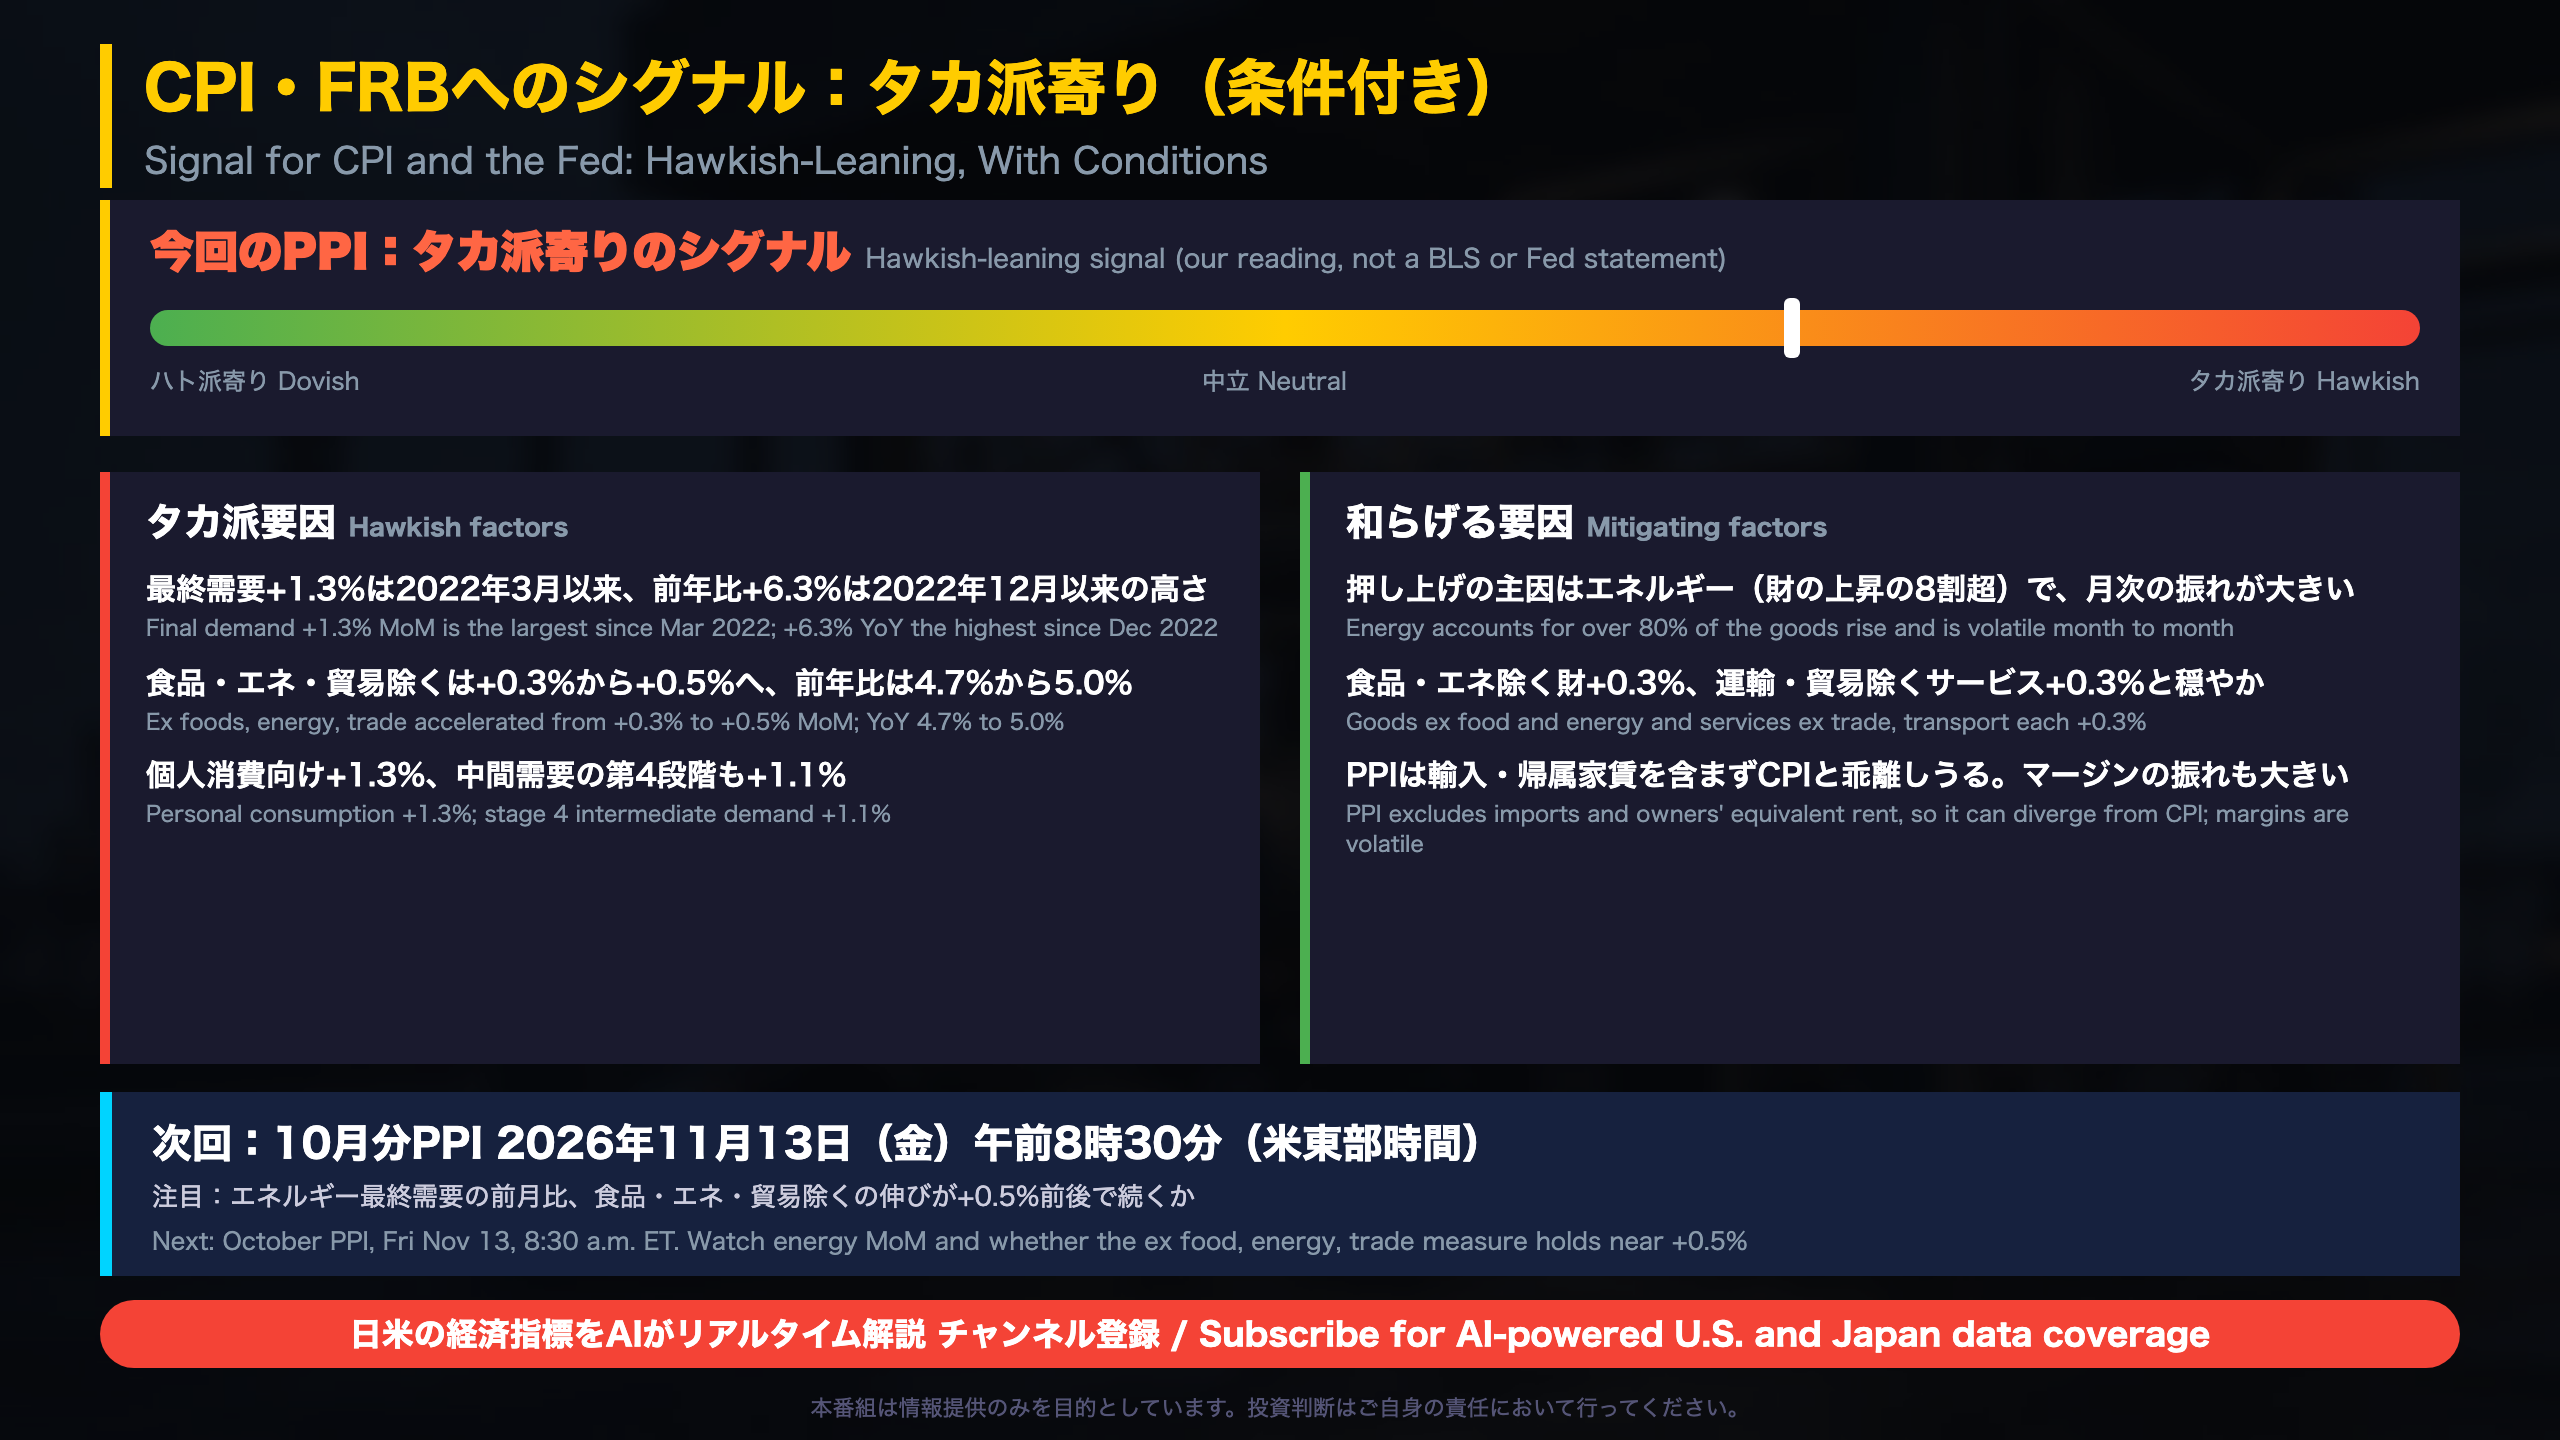
This is our reading of the data, not a statement from BLS or the Federal Reserve. PPI is an upstream price gauge; it does not set policy and its lead over CPI varies.
Why it leans hawkish
- Final demand +1.3% MoM and +6.3% YoY are the highest readings since 2022.
- The measure excluding foods, energy and trade services accelerated to +0.5% MoM, with the annual rate up to 5.0% from 4.7%.
- Personal consumption prices within PPI rose 1.3%, with goods +3.6%.
- Intermediate demand pressure is broad: stage 4 +1.1%, processed goods +2.5%.
Why caution is warranted
- Energy drives the gain, and it has whipsawed: +8.2%, -6.8%, -1.7%, +4.5% and +10.8% over five months.
- Goods excluding food and energy (+0.3%) and services excluding trade and transportation (+0.3%) are steady.
- The ex-food-energy-trade measure ran between +0.2% and +0.8% since May, so +0.5% is not clearly a new regime.
- PPI is not CPI. BLS notes that PPI excludes imports and owners’ equivalent rent, CPI’s largest item, and excludes taxes. Trade margins can swing sharply month to month.
- August and July were revised up by 0.1 point each.
What to watch
The October PPI arrives Friday, Nov 13, at 8:30 a.m. ET. Key questions: does energy reverse or extend, and does the core measure stay near 0.5% or return to the 0.2% to 0.3% area seen in June and August?
Japanese readers can compare with the BOJ’s habit of looking through energy-driven swings in headline prices; the Fed’s framework similarly emphasizes core measures.
Disclaimer: This article is for informational purposes only. All investment decisions are made solely at your own risk.