📺 Watch the Full Video Analysis
This article was automatically generated by the NFC Market Live AI analysis system. (Updated: 2026-10-15 21:44 JST)
📄 Primary Source
NFC Market Live
https://www.newyorkfed.org/medialibrary/media/survey/empire/empire2026/2026_09-empire-state-manufacturing-survey.pdf
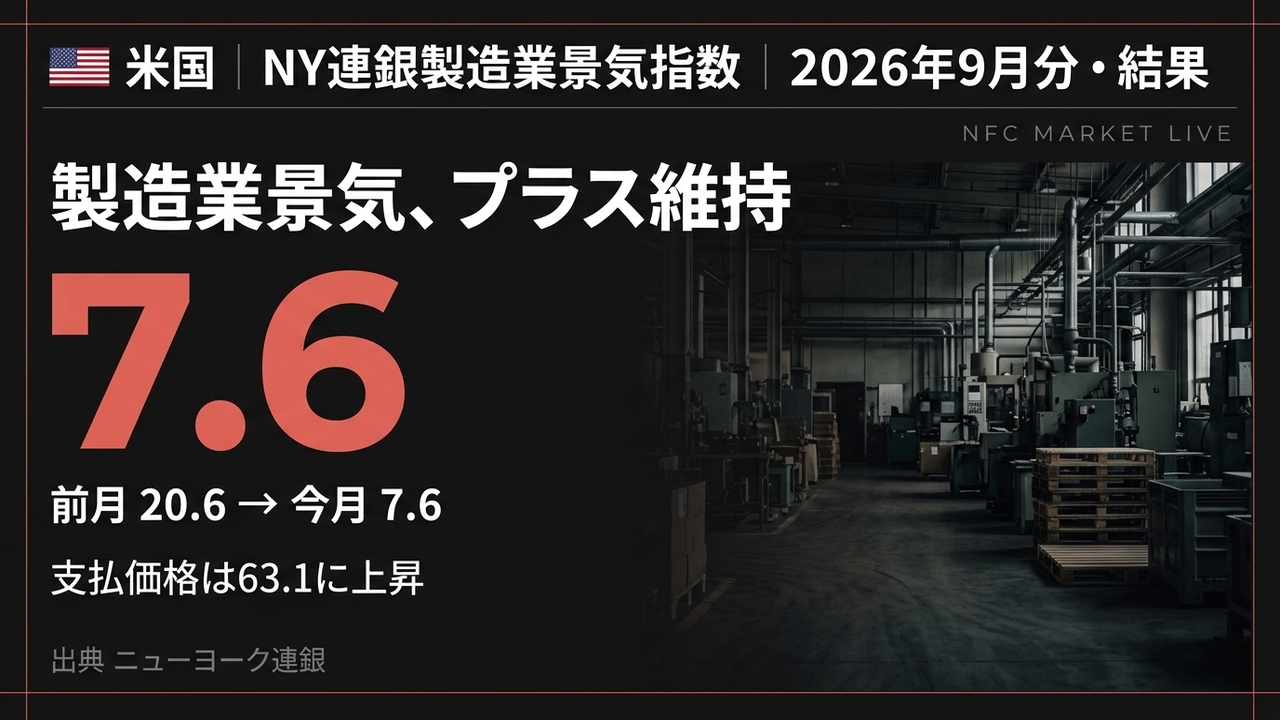
📊 Deep dive into the NY Fed’s September Empire State Manufacturing Survey.
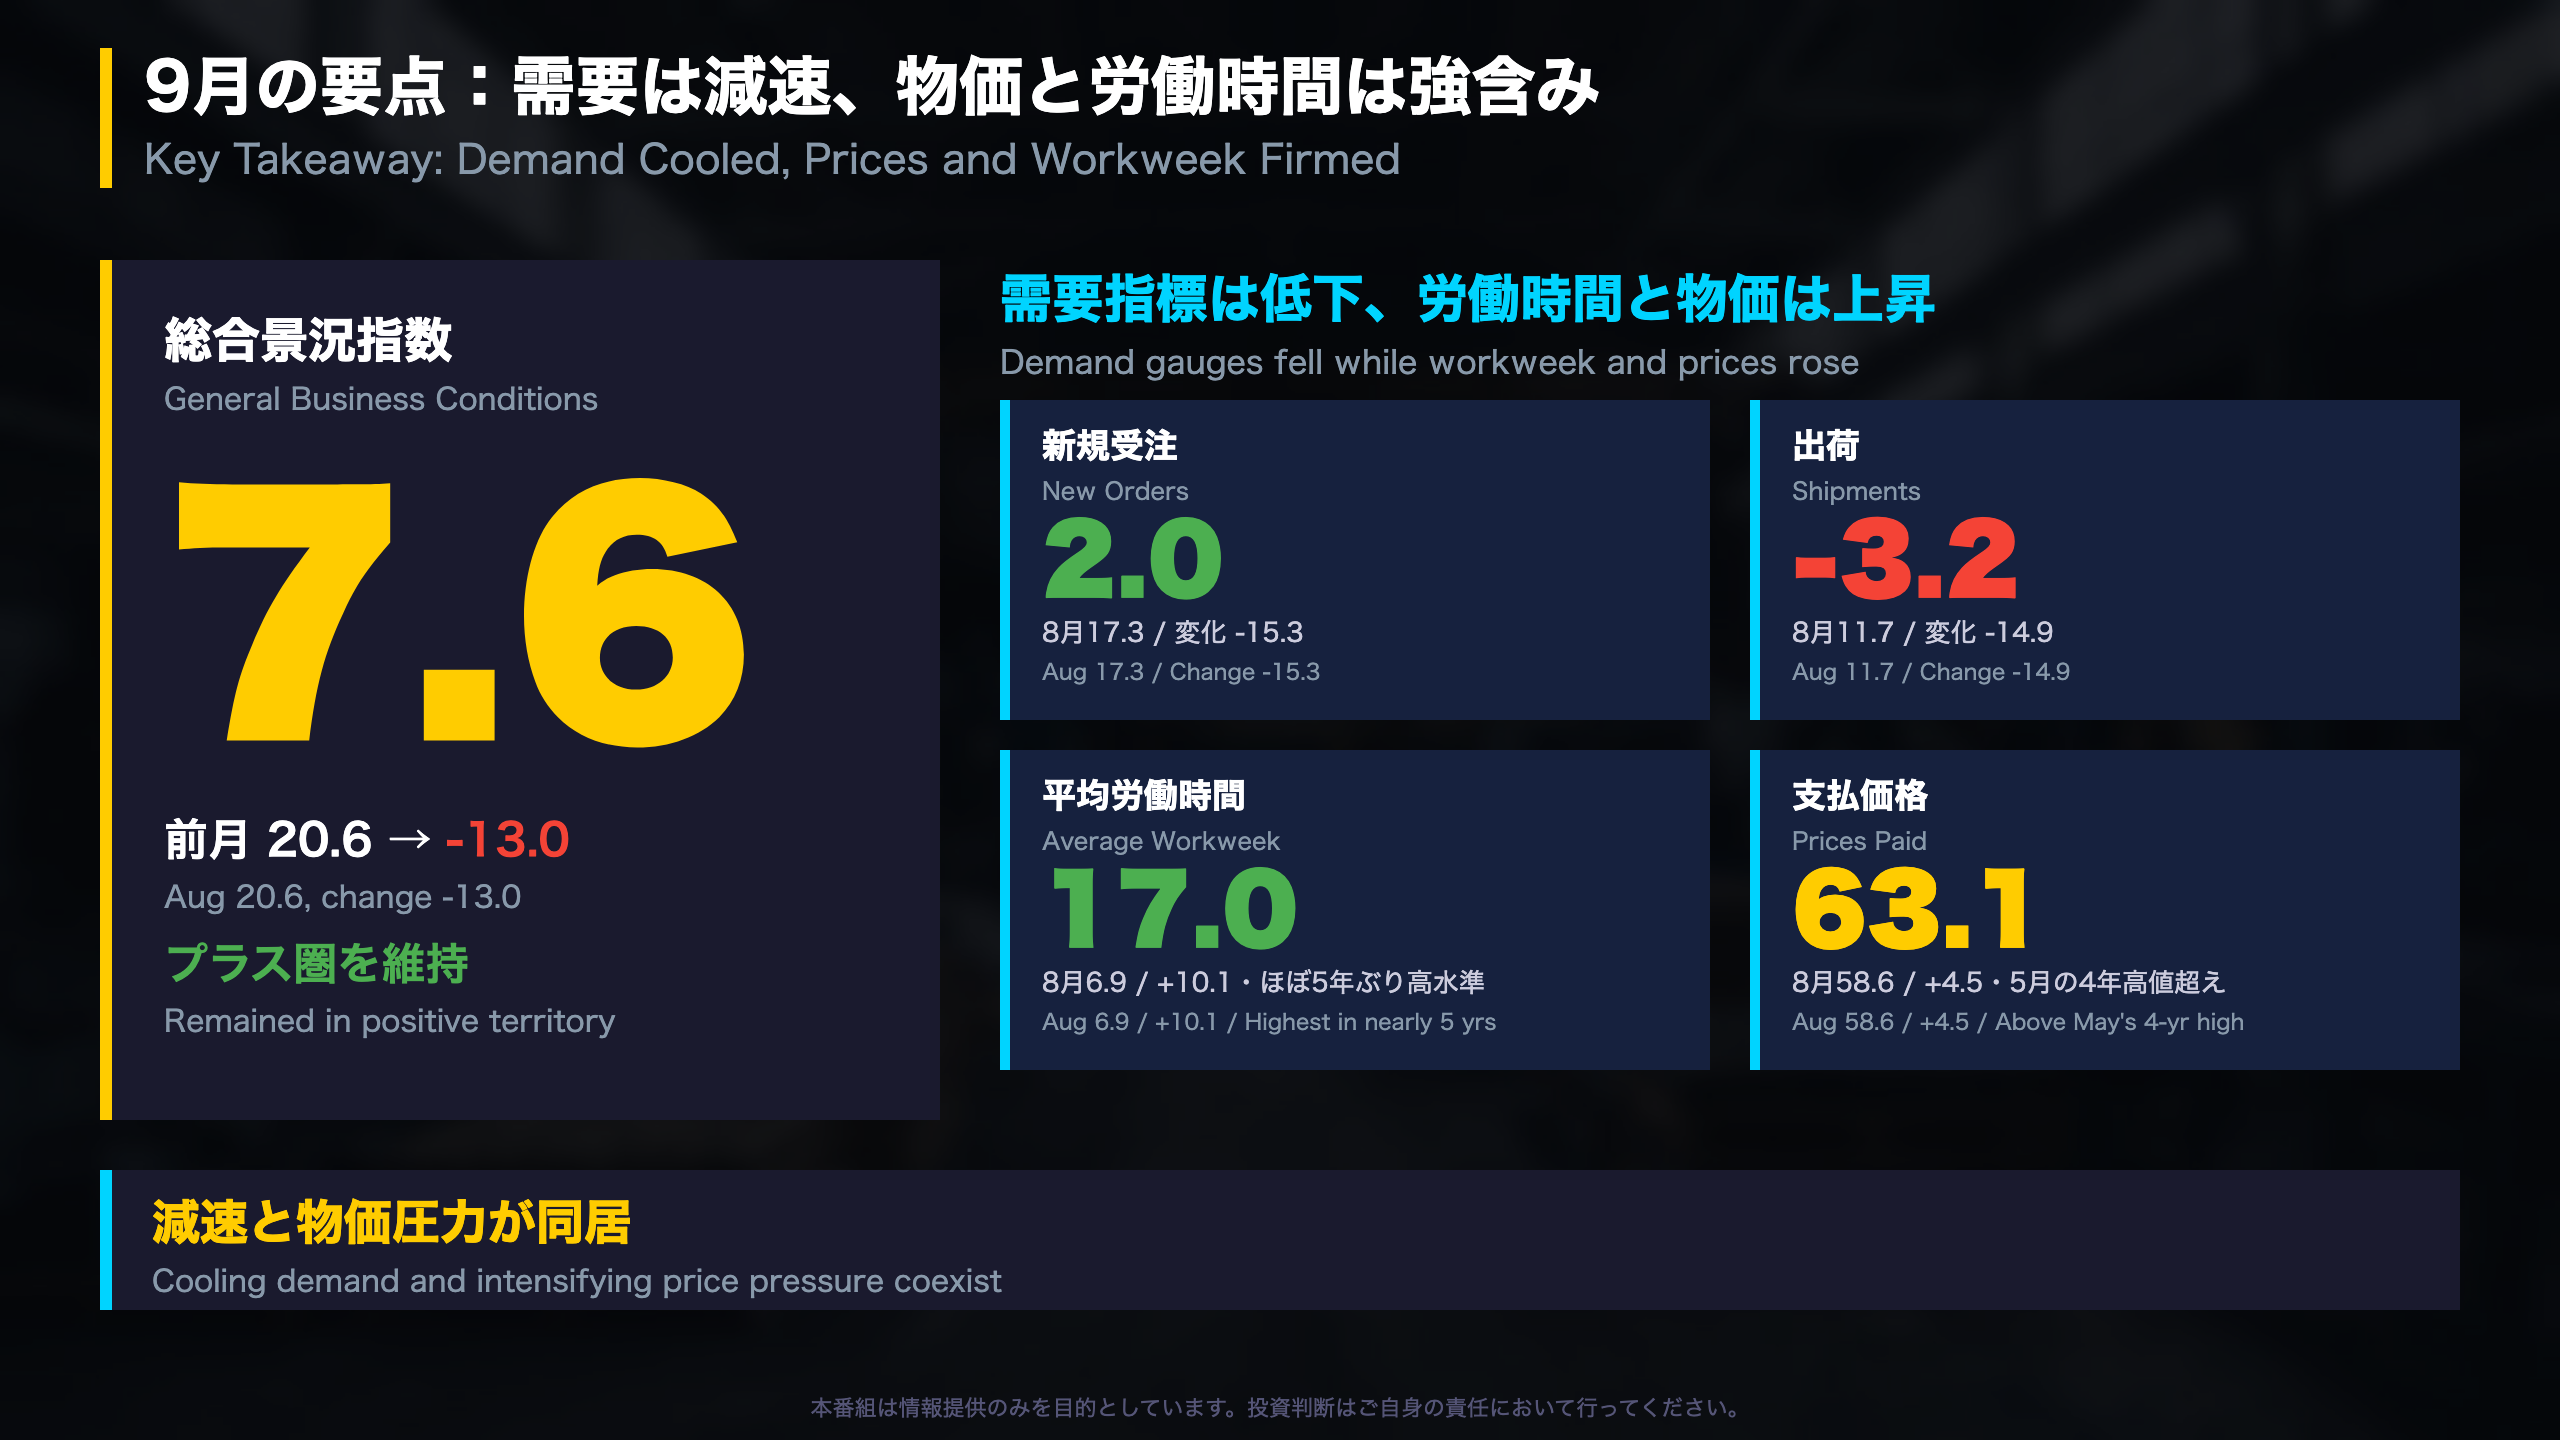
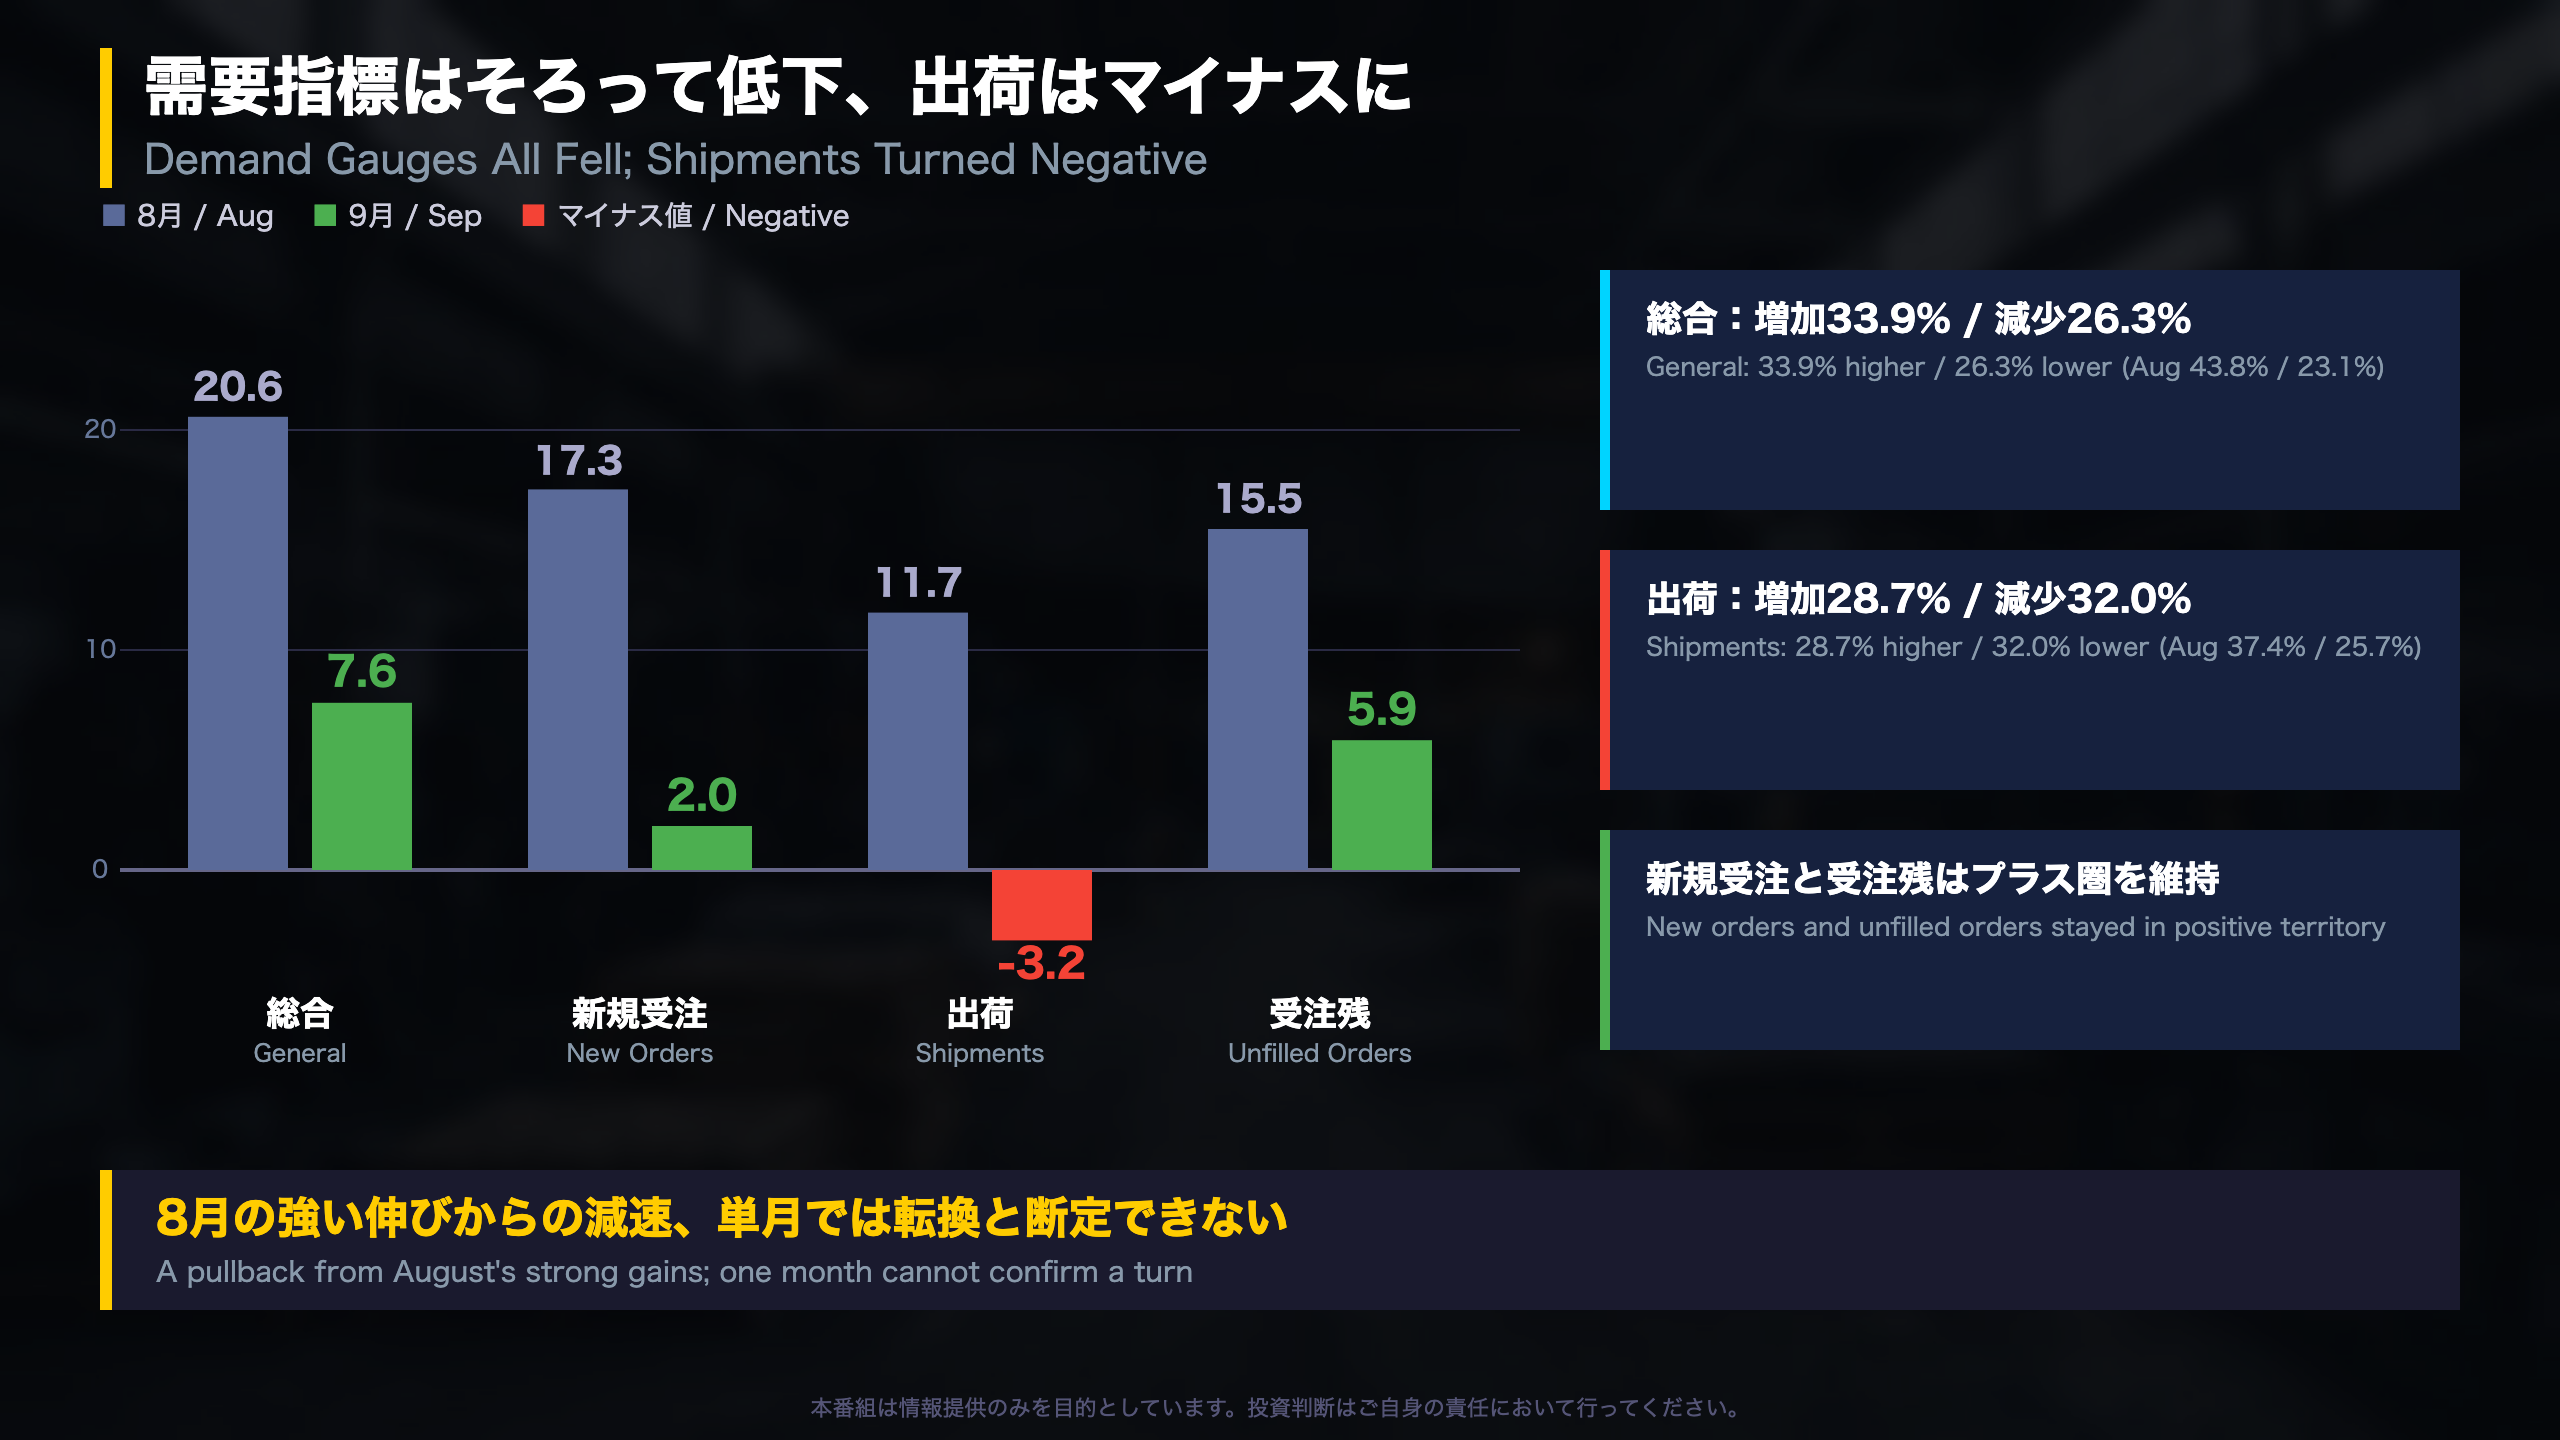
📉 Headline index fell 13 pts to 7.6 (Aug: 20.6); new orders 2.0, shipments -3.2.
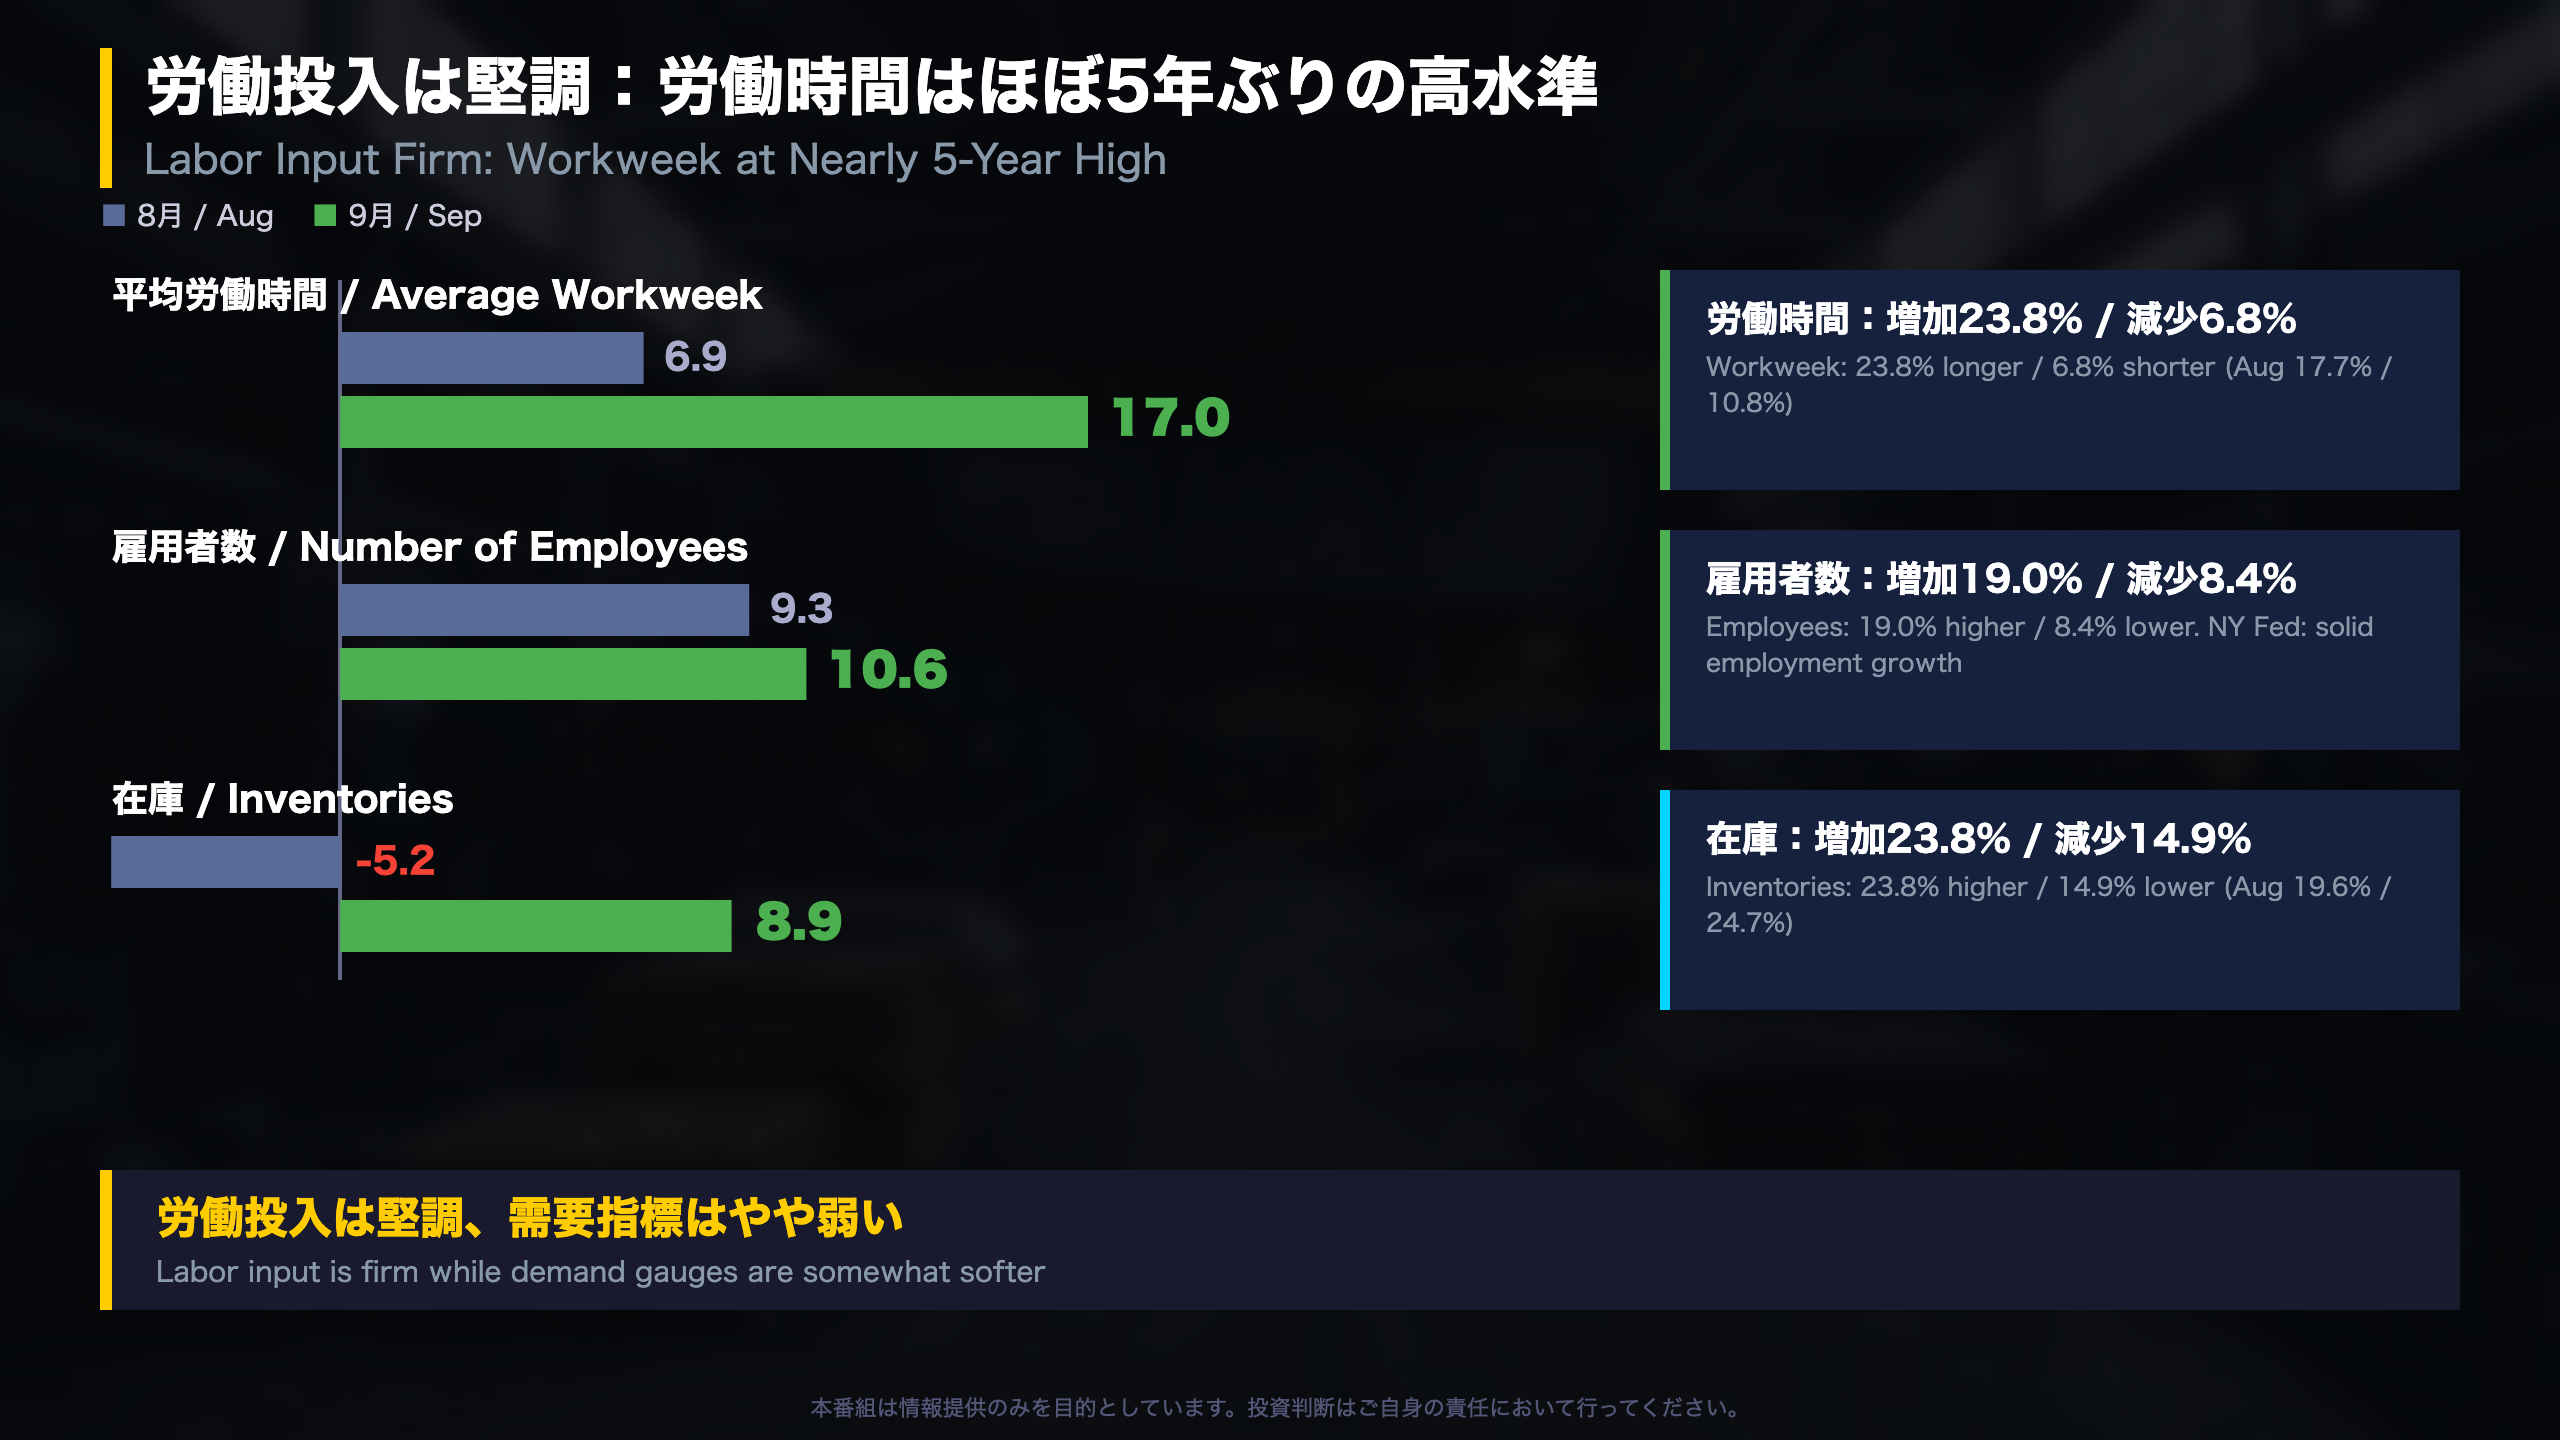
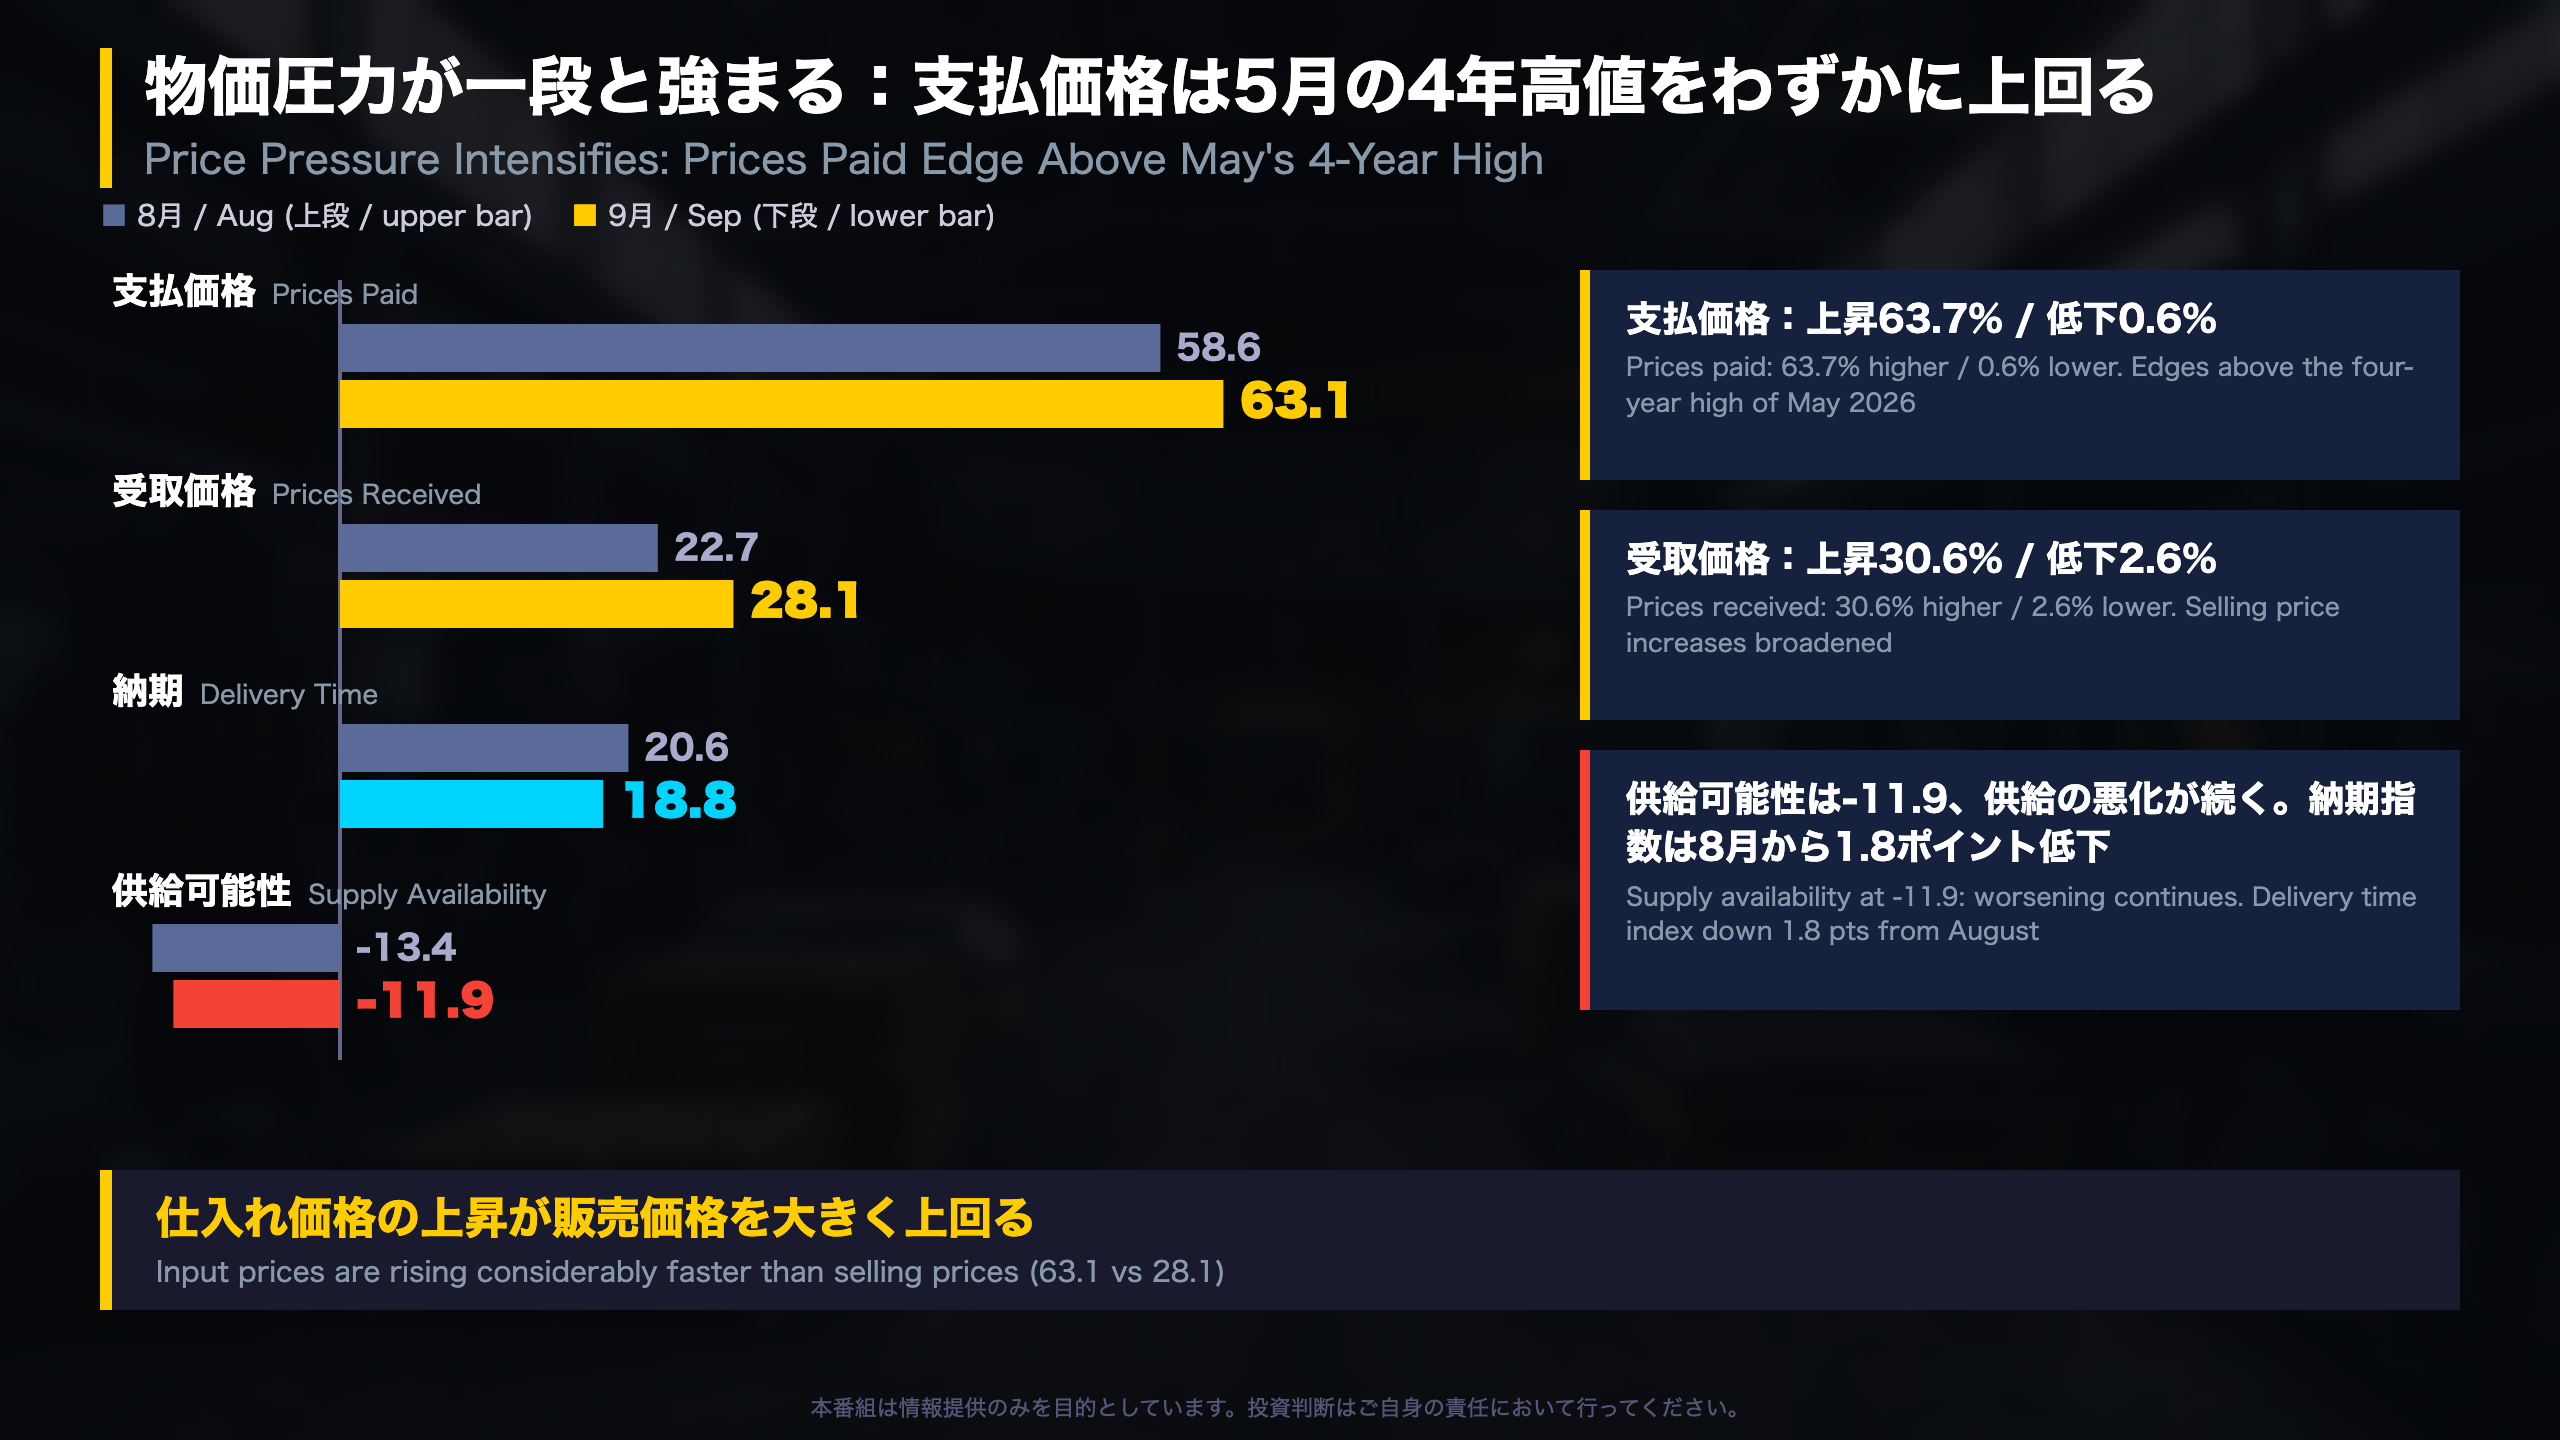
📈 Workweek index 17.0, highest in nearly 5 years; prices paid 63.1, above May’s 4-year high.
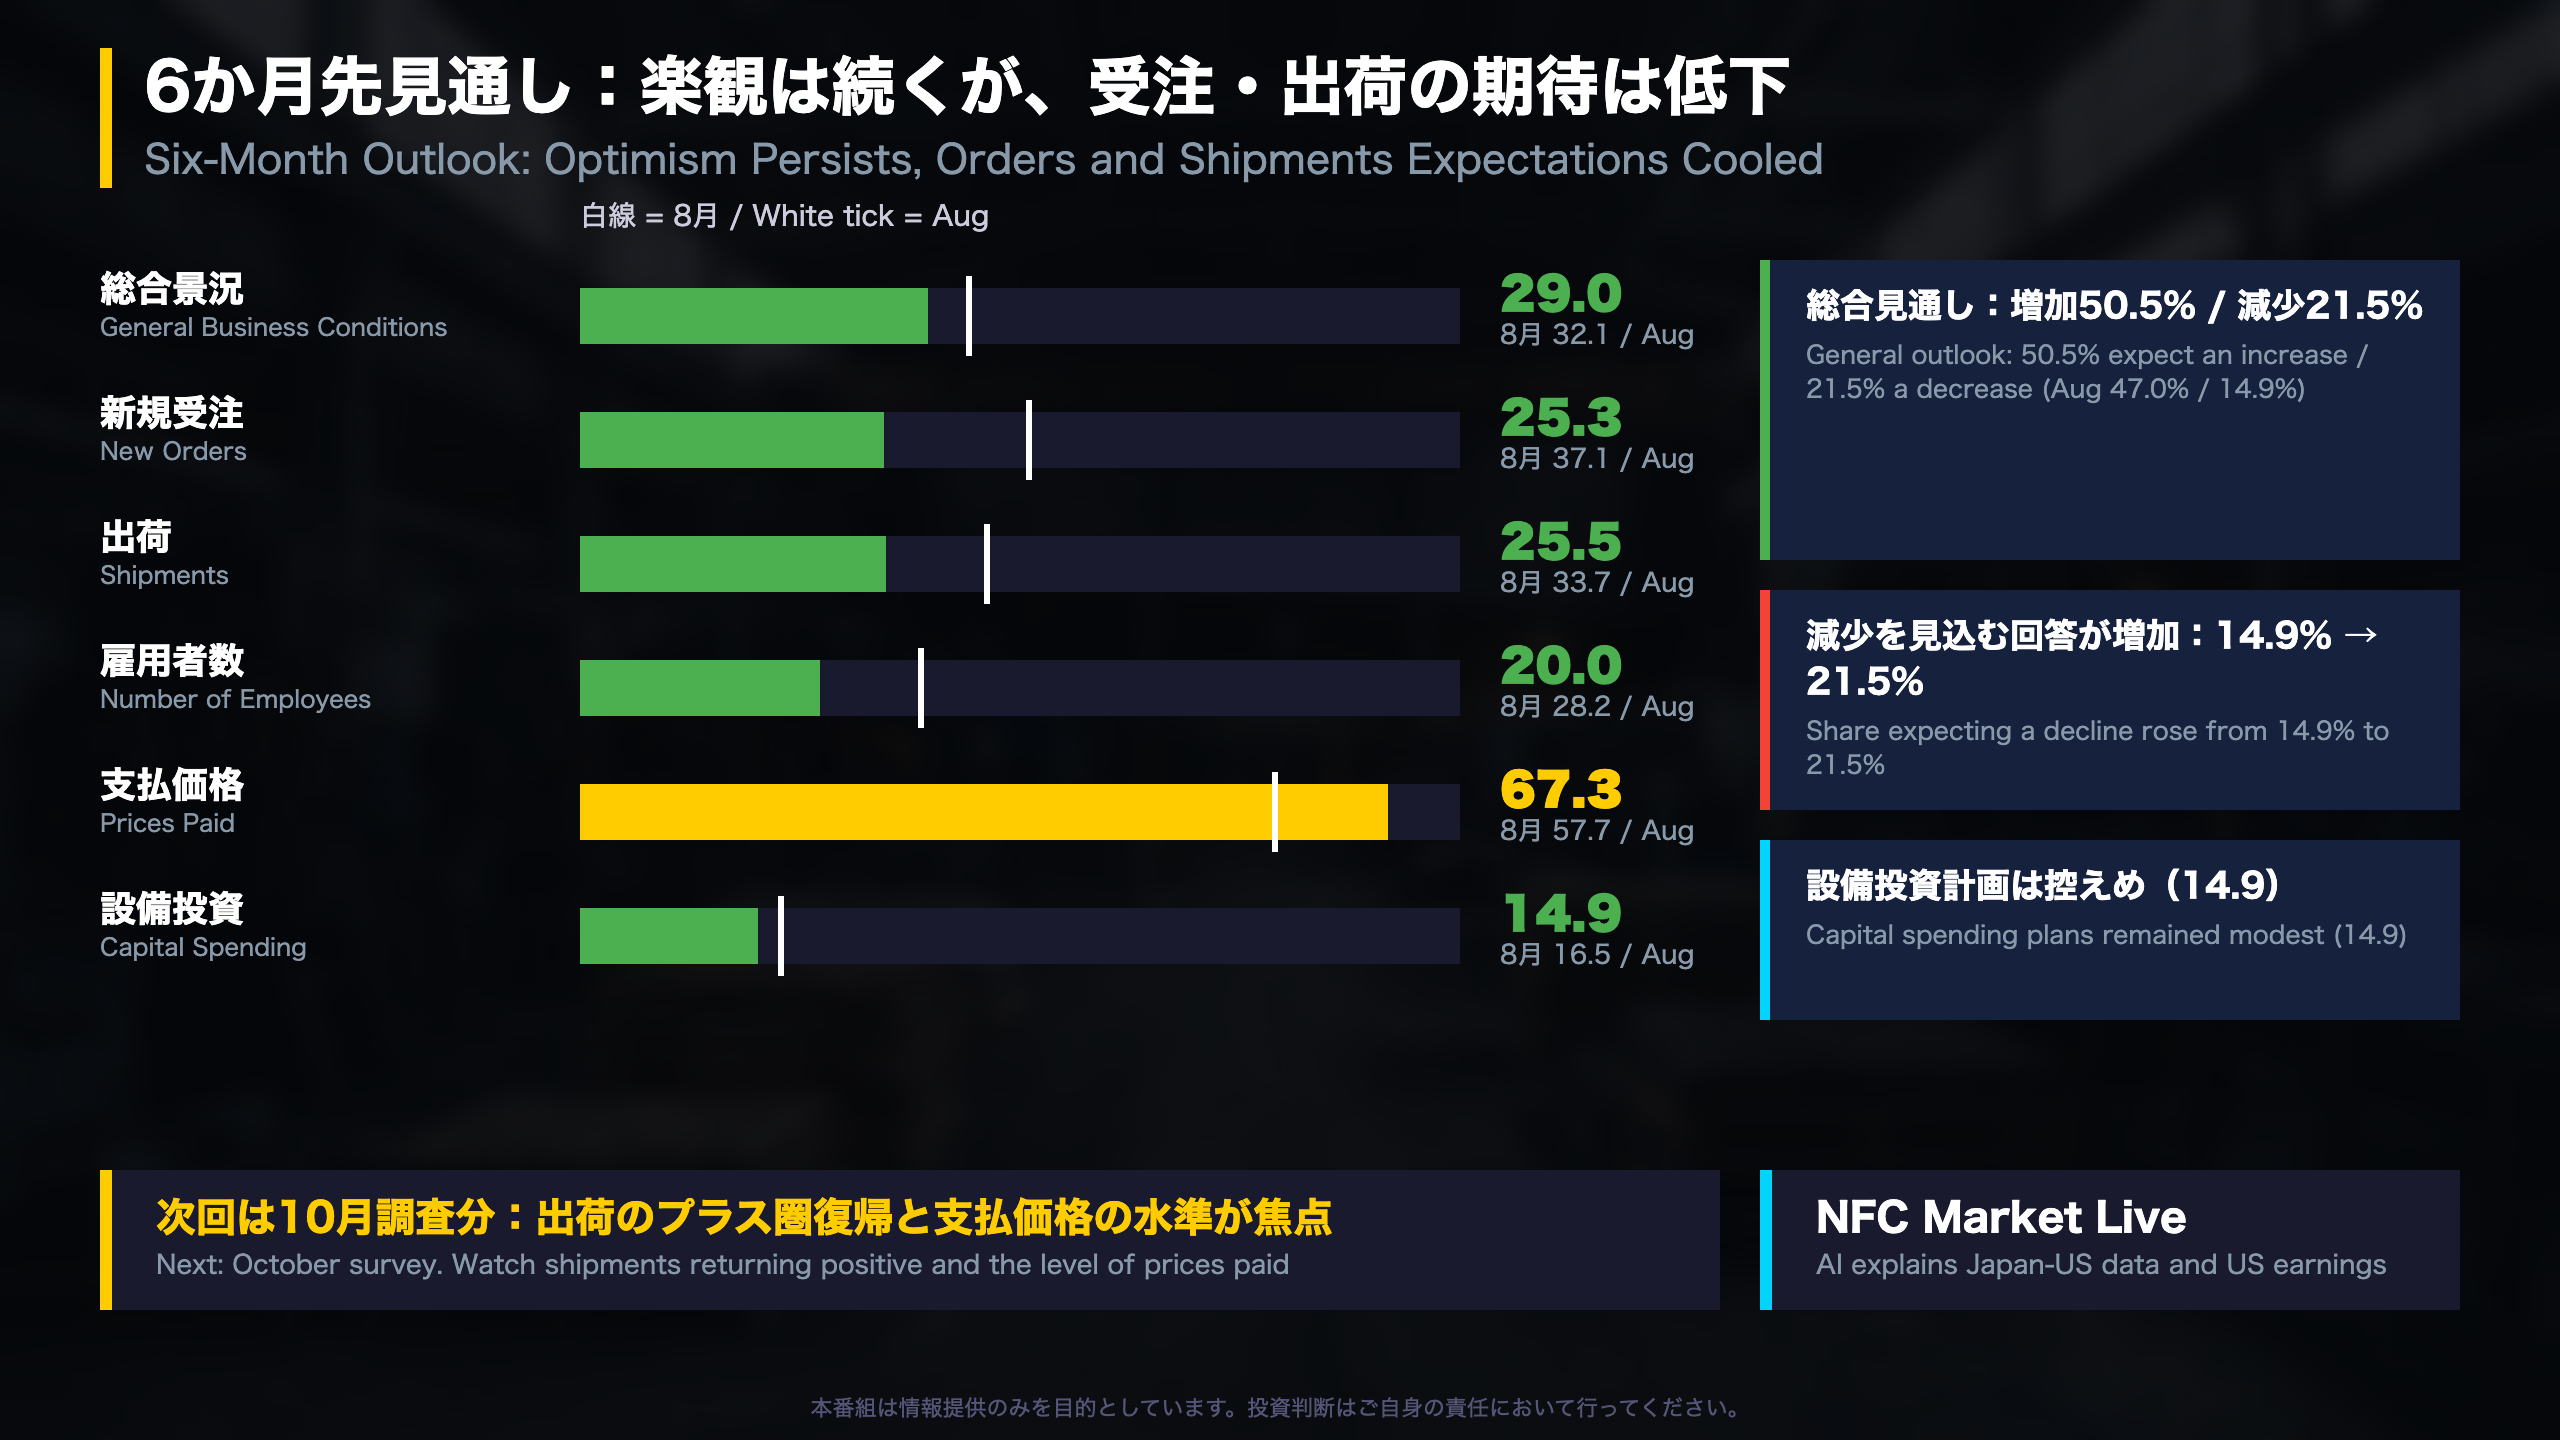
💡 6-month outlook still optimistic at 29.0; expected prices paid 67.3.
⚠️ Single-month data: next survey needed to confirm any trend.
9月の要点:需要は減速、物価と労働時間は強含み
What the Empire State Survey Is
The Empire State Manufacturing Survey is a monthly poll of manufacturers in New York State, run by the Federal Reserve Bank of New York. Results are diffusion indices: the percentage of firms reporting an increase minus the percentage reporting a decrease, so zero is the dividing line between expansion and contraction. It is one of the earliest regional readings on US factory conditions each month.
September at a Glance
- Headline index: 7.6 (August: 20.6), a 13.0-point drop but still positive
- New orders: 2.0, shipments: -3.2
- Average workweek: 17.0, the highest in nearly five years
- Prices paid: 63.1, edging above May 2026’s four-year high
Two Ways to Read It
Resilience: Activity kept expanding after August’s strong gain, and employment grew at what the New York Fed called a solid pace.
Risk: Shipments turned negative and price pressure intensified in the same month. Responses were collected September 2-10, and a single month cannot establish a trend.
Market Context
The report contains no monetary-policy commentary. Readers following US growth and inflation data may weigh the price indices against the demand gauges in upcoming surveys; the next release covers October.
需要指標はそろって低下、出荷はマイナスに
Demand Gauges in Detail
All four demand-related indices in the Empire survey declined from August:
| Index | Aug | Sep |
|---|---|---|
| General business conditions | 20.6 | 7.6 |
| New orders | 17.3 | 2.0 |
| Shipments | 11.7 | -3.2 |
| Unfilled orders | 15.5 | 5.9 |
Why the Shipments Reading Matters
In September, 32.0% of firms reported lower shipments versus 28.7% reporting higher, so the index slipped below zero. In August the split was 37.4% higher versus 25.7% lower. New orders, by contrast, still had slightly more firms reporting increases (27.8%) than decreases (25.8%).
Bull vs. Bear Reading
- Constructive: Orders and unfilled orders remain above zero, and the drop follows an unusually strong August reading (headline 20.6).
- Cautious: Six-month expectations for unfilled orders fell from 19.6 to 5.9, a 13.7-point decline, which may point to a softer order pipeline in firms’ own view.
The New York Fed summarized the month this way: new orders edged up, shipments declined slightly, unfilled orders increased and delivery times lengthened substantially. One survey month leaves wide room for noise, so confirmation from October data is the key checkpoint.
労働投入は堅調:労働時間はほぼ5年ぶりの高水準
Labor Input: The Firm Side of the Report
While demand indices cooled, labor-related gauges strengthened:
- Average workweek: 6.9 → 17.0 (+10.1), the highest level in nearly five years; 23.8% of firms reported longer hours vs. 6.8% shorter
- Employment: 9.3 → 10.6 (+1.3); the New York Fed described “solid” job growth
- Inventories: -5.2 → 8.9 (+14.1); in August more firms reported falling stocks (24.7%) than rising (19.6%), while September flipped to 23.8% rising vs. 14.9% falling
How to Interpret the Gap
Hours worked often adjust before headcount, so a jump in the workweek index can show firms stretching existing staff. That reading is an interpretation, not stated in the report. A more cautious view notes that shipments fell while inventories rose, so labor strength may not yet be matched by sales.
Forward-Looking Check
Six-month expectations are more restrained: employment fell from 28.2 to 20.0, and the workweek expectation moved from 1.0 to -4.0. Firms appear to see the current hours surge as near-term rather than permanent, though this rests on a single survey.
For international readers, note that these are diffusion indices, not payroll counts, so they show the breadth of change rather than the number of jobs added.
物価圧力が一段と強まる:支払価格は5月の4年高値をわずかに上回る
Prices and Supply Chains
| Index | Aug | Sep | Change |
|---|---|---|---|
| Prices paid | 58.6 | 63.1 | +4.5 |
| Prices received | 22.7 | 28.1 | +5.4 |
| Delivery time | 20.6 | 18.8 | -1.8 |
| Supply availability | -13.4 | -11.9 | +1.5 |
Key Facts
- 63.7% of firms reported higher input prices; just 0.6% reported lower.
- The prices paid index edged above its four-year high set in May 2026, according to the New York Fed.
- A positive delivery-time reading means longer delivery times; supply availability below zero means worse availability.
Six Months Ahead
Expected prices paid jumped from 57.7 to 67.3, while expected prices received eased from 48.7 to 42.3. The report states that price increases are expected to remain elevated.
Two Perspectives
Persistent cost pressure: Input prices are rising far faster than selling prices (63.1 vs. 28.1), a gap firms must absorb or pass through.
Stabilizing supply: The delivery-time index slipped 1.8 points and supply availability improved marginally, though both remain in the “worse” direction.
For comparison, readers tracking US inflation can treat these as a regional input-cost signal; they are not a direct measure of consumer inflation.
6か月先見通し:楽観は続くが、受注・出荷の期待は低下
Six-Month Outlook
| Expected index | Aug | Sep |
|---|---|---|
| General conditions | 32.1 | 29.0 |
| New orders | 37.1 | 25.3 |
| Shipments | 33.7 | 25.5 |
| Employment | 28.2 | 20.0 |
| Prices paid | 57.7 | 67.3 |
| Capital spending | 16.5 | 14.9 |
Breadth of Optimism
The share of firms expecting better conditions rose from 47.0% to 50.5%, but the share expecting worse conditions also rose, from 14.9% to 21.5%. Responses became more dispersed even as the average stayed solidly positive.
Bull vs. Bear
- Constructive: Four core outlook indices remain at 20 or above, and employment is still expected to grow significantly, per the report.
- Cautious: Expectations for orders and shipments both dropped by more than 8 points, and capital spending plans remain modest at 14.9.
What to Watch
The next survey covers October (the release date is not stated in the report). Two thresholds matter: whether the shipments index returns above zero from -3.2, and whether prices paid holds near 63.1.
For non-Japanese readers: this channel covers Japan and US indicators and US earnings with AI-driven commentary, and the Empire survey is one of several regional Fed readings used to gauge US factory trends.
Disclaimer: This article is for informational purposes only. All investment decisions are made solely at your own risk.