📺 Watch the Full Video Analysis
This article was automatically generated by the NFC Market Live AI analysis system. (Updated: 2026-10-13 09:02 JST)
📄 Primary Source
日本銀行
https://www.boj.or.jp/statistics/pi/cgpi_release/cgpi2609.pdf
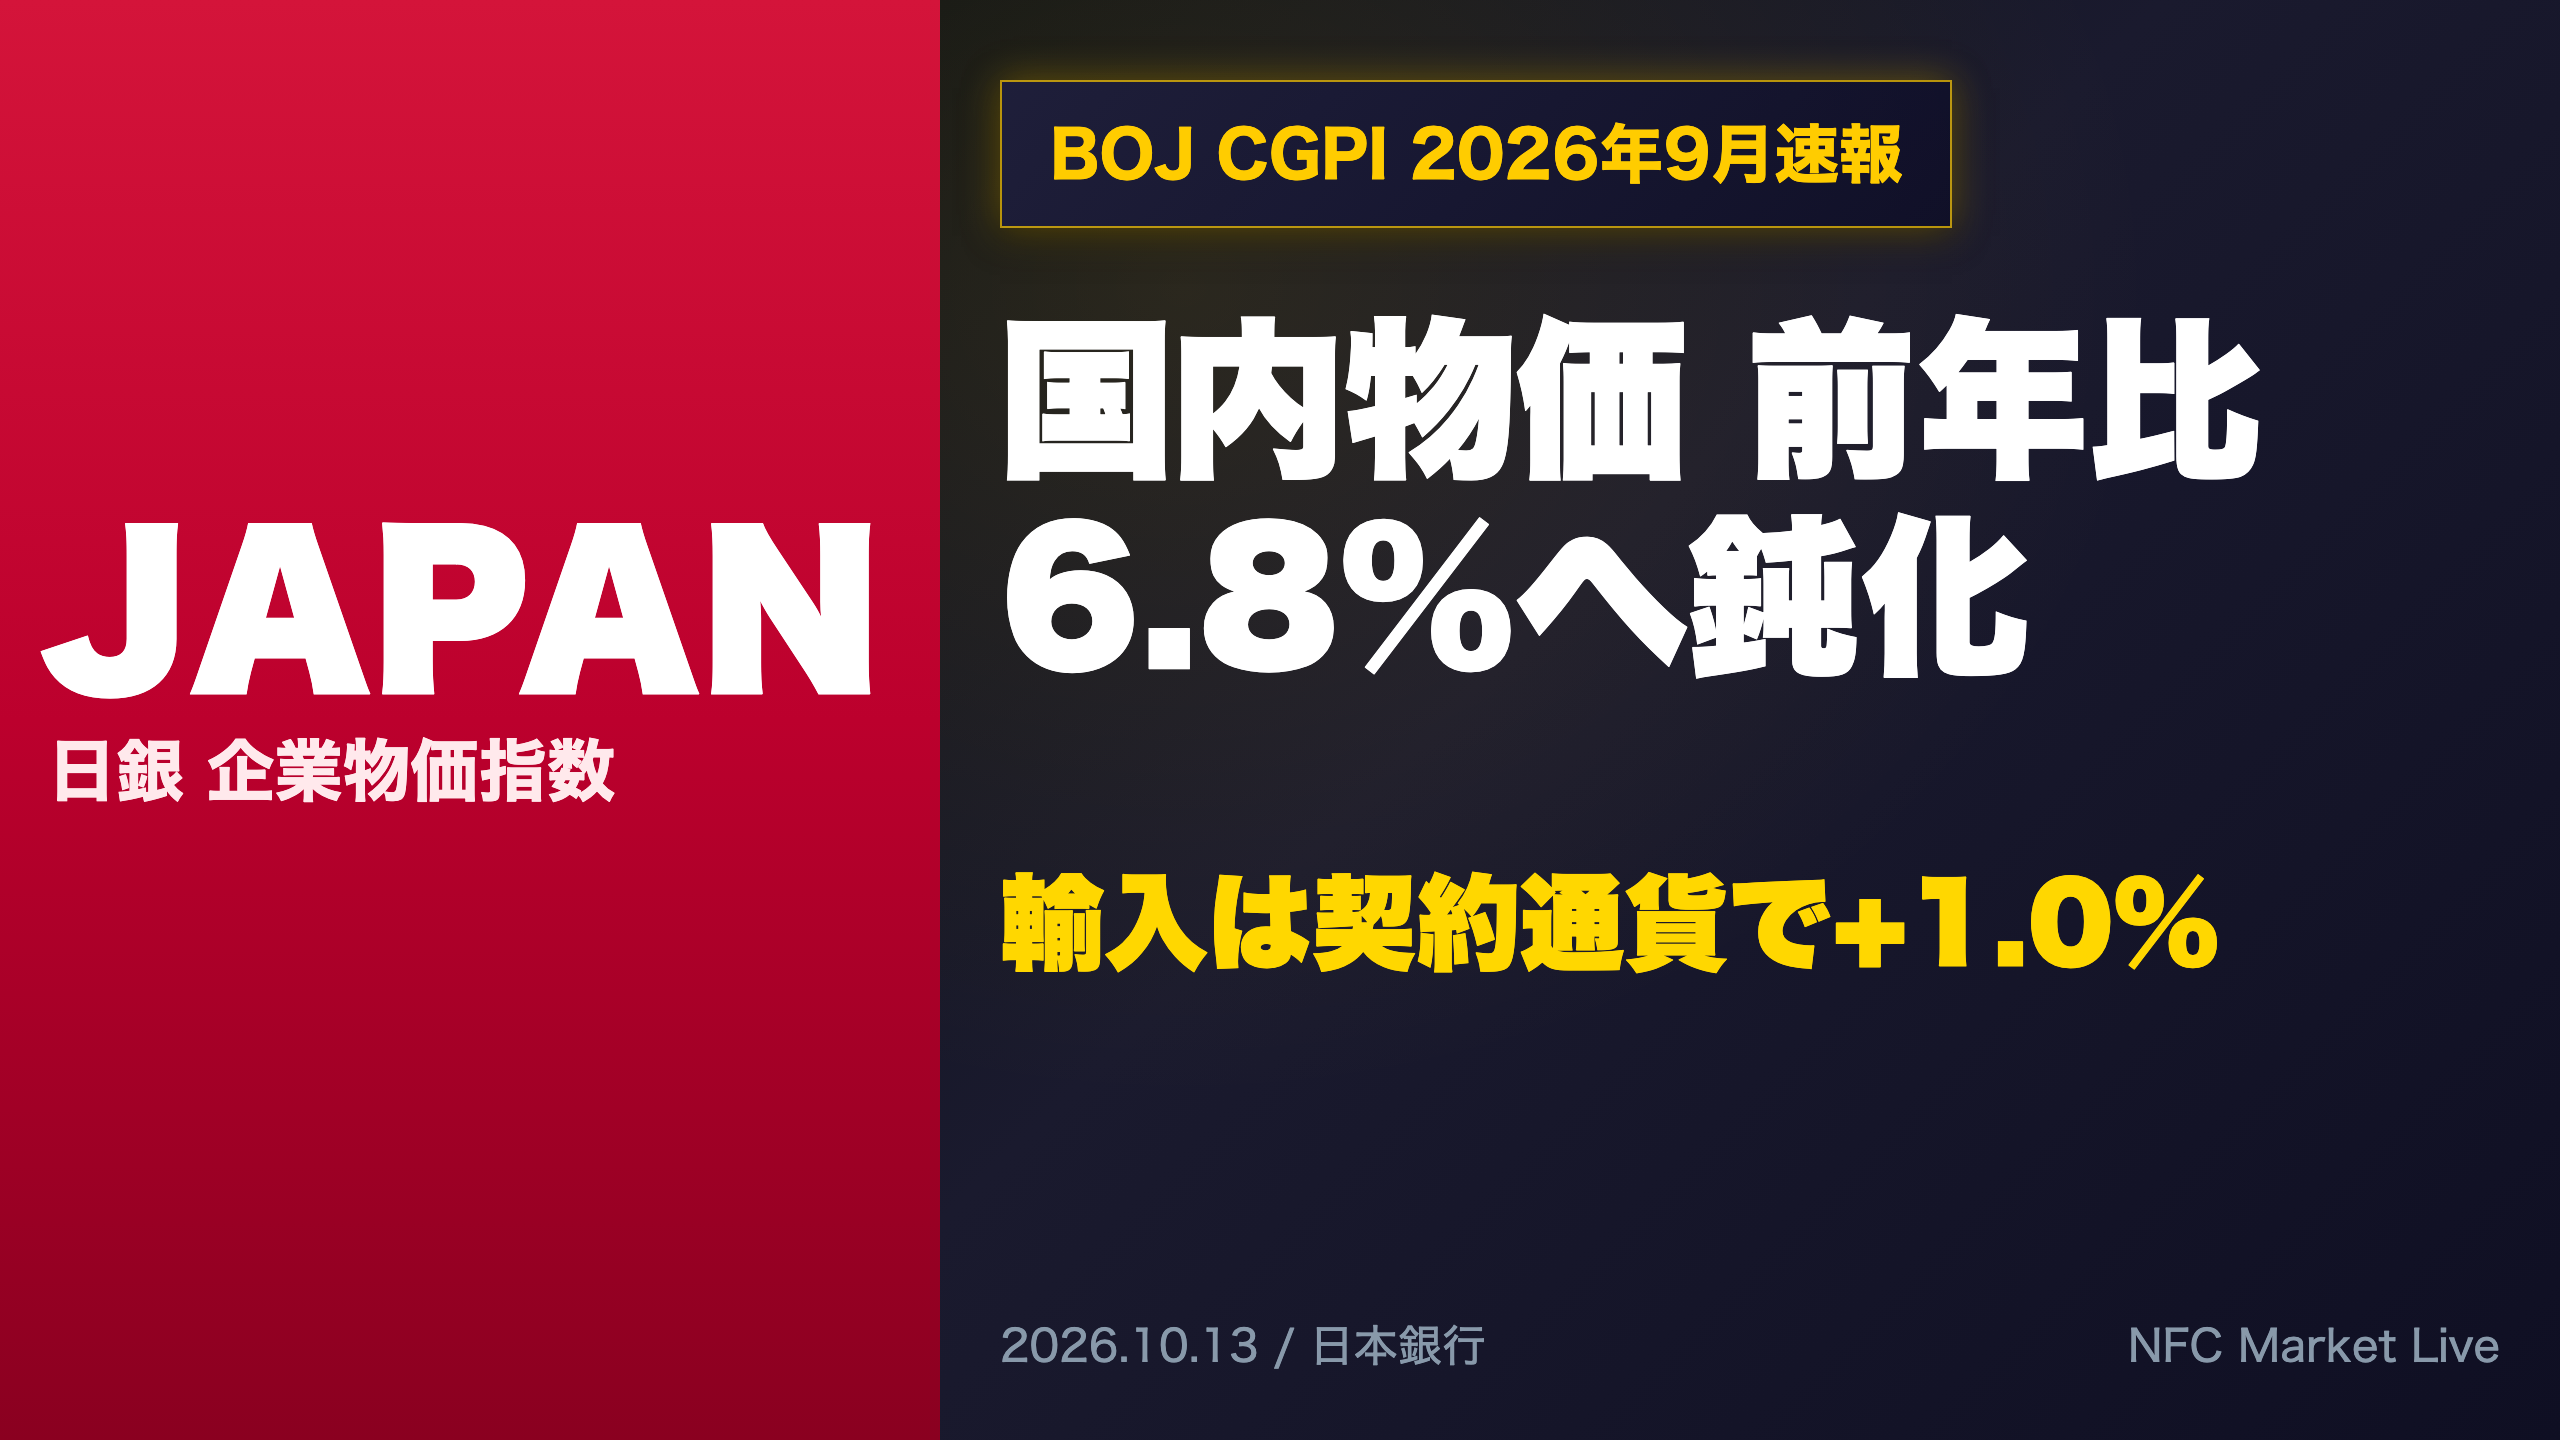
📊 A deep dive into the Bank of Japan’s Corporate Goods Price Index (CGPI), September 2026 flash, released Oct 13.
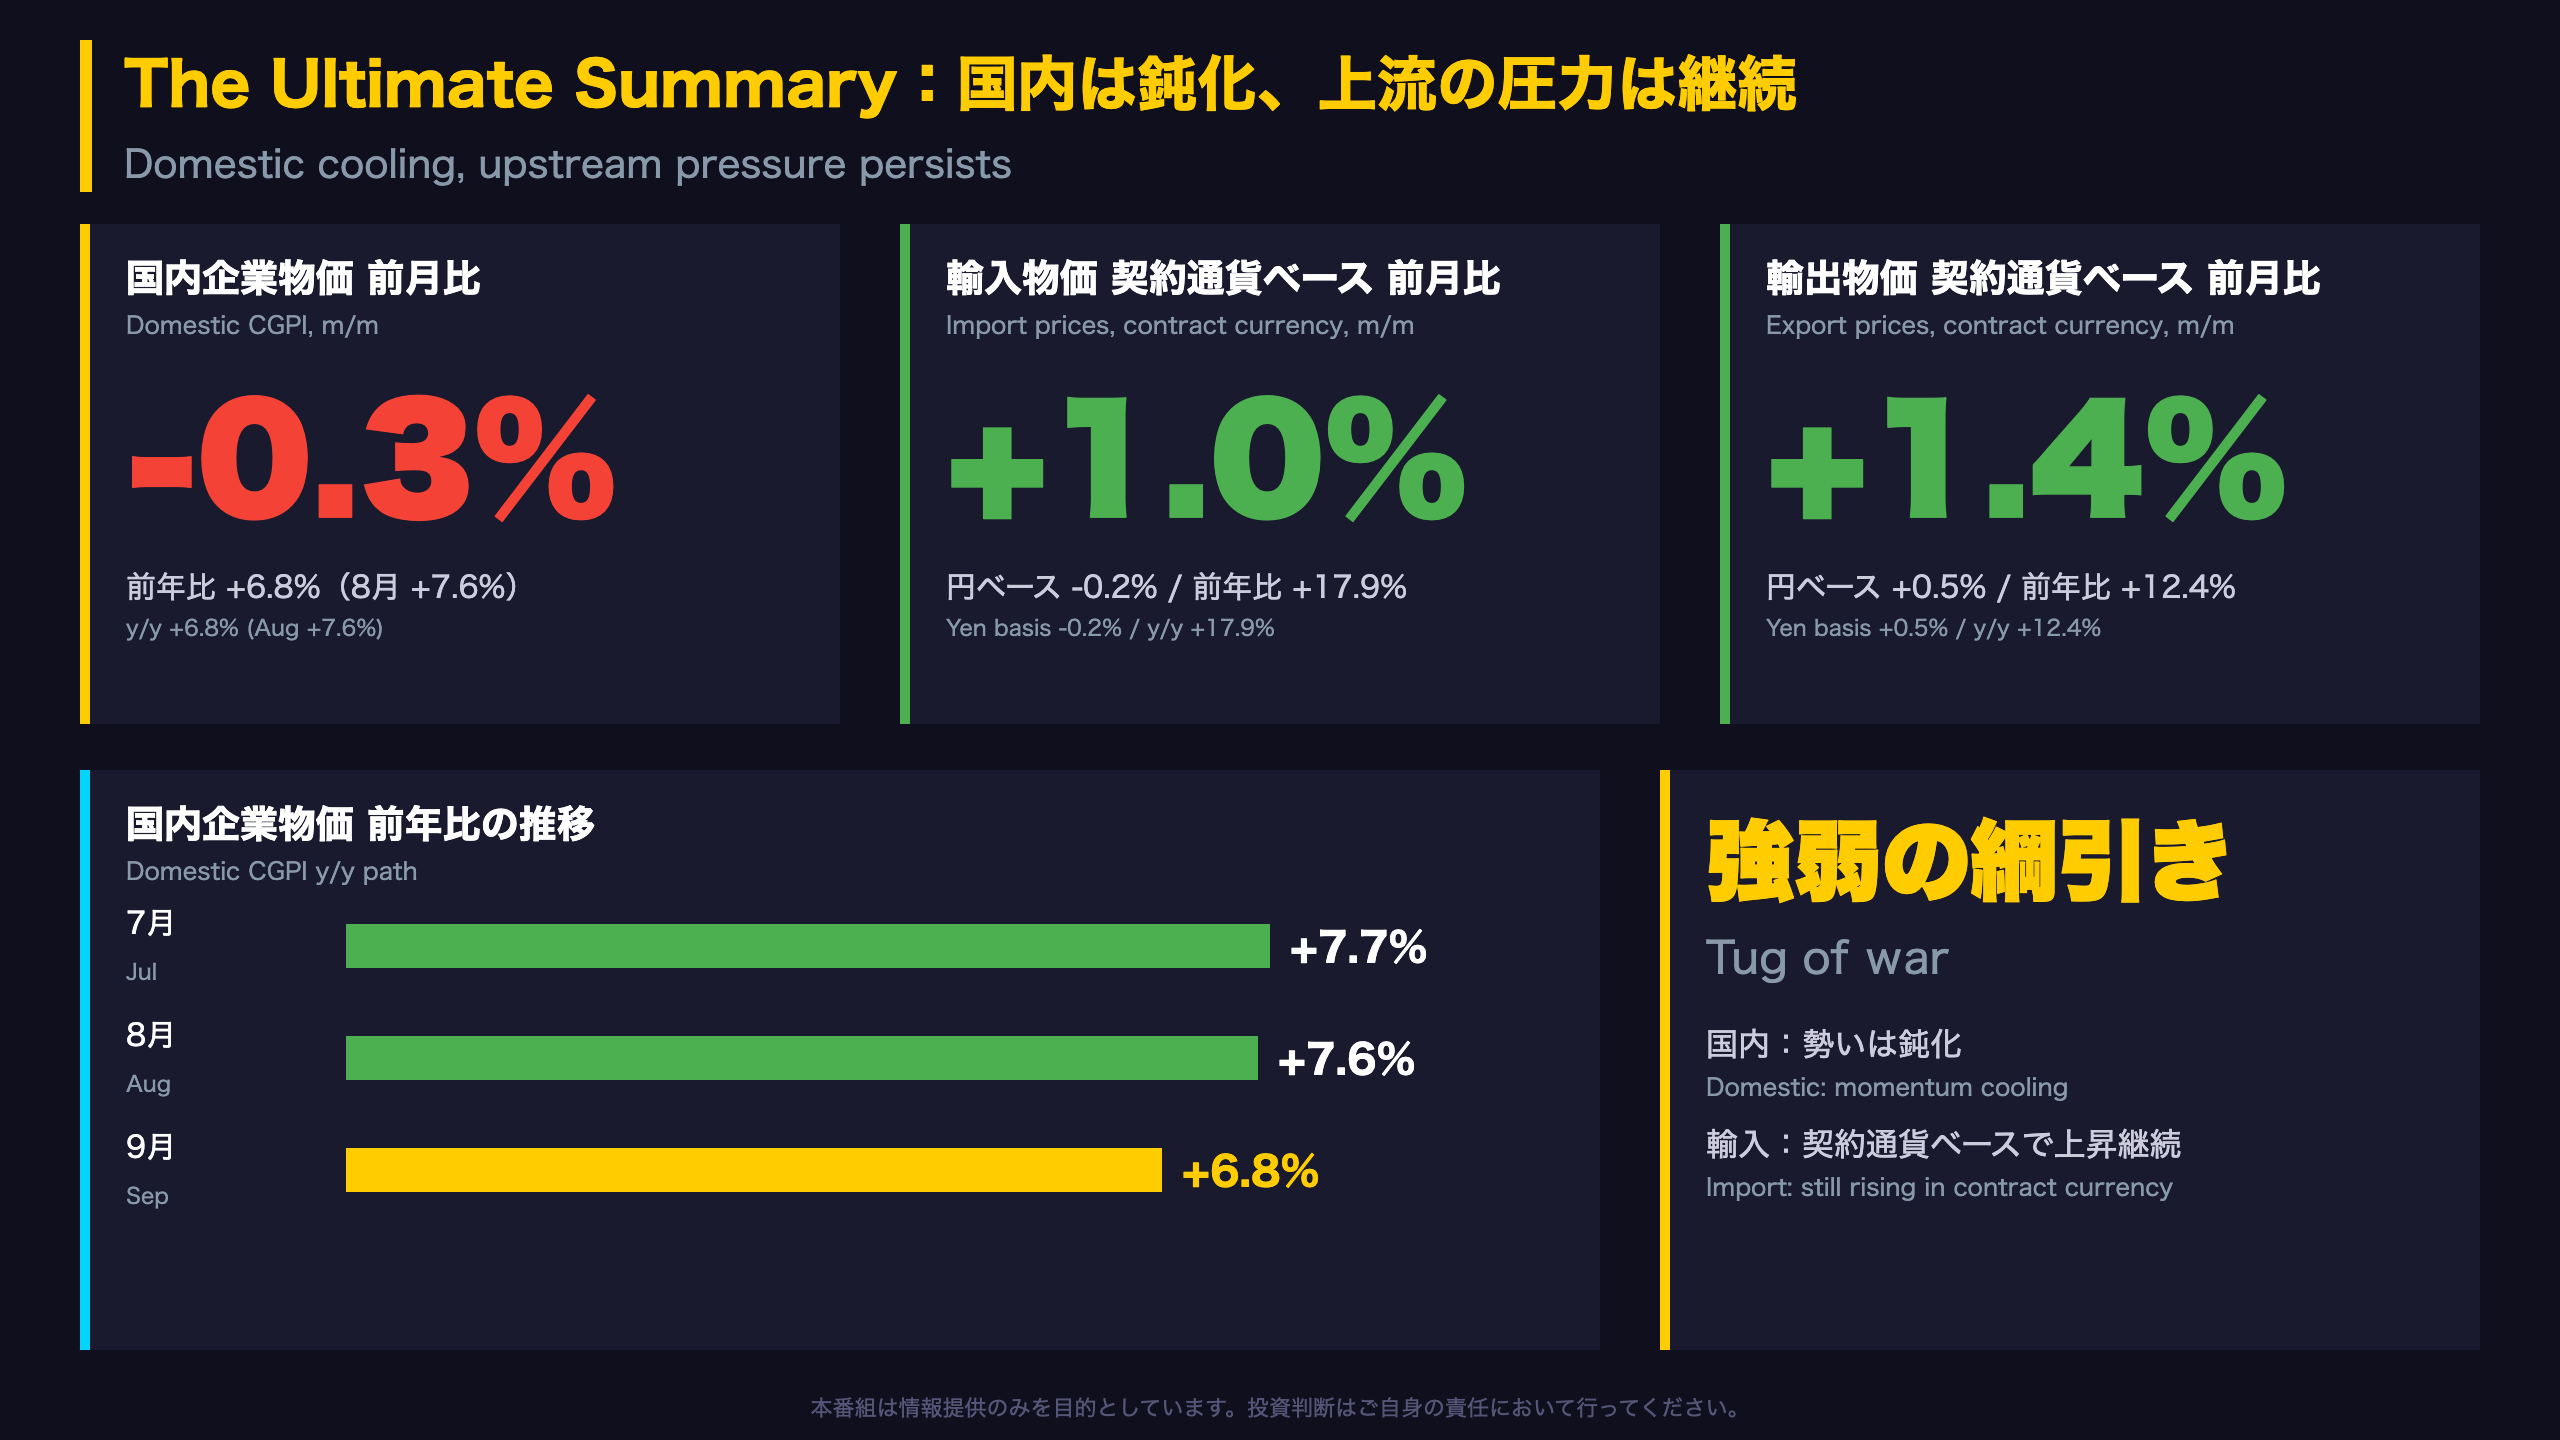
📉 Domestic CGPI fell 0.3% m/m and rose 6.8% y/y, the second straight slowdown from July’s 7.7%.
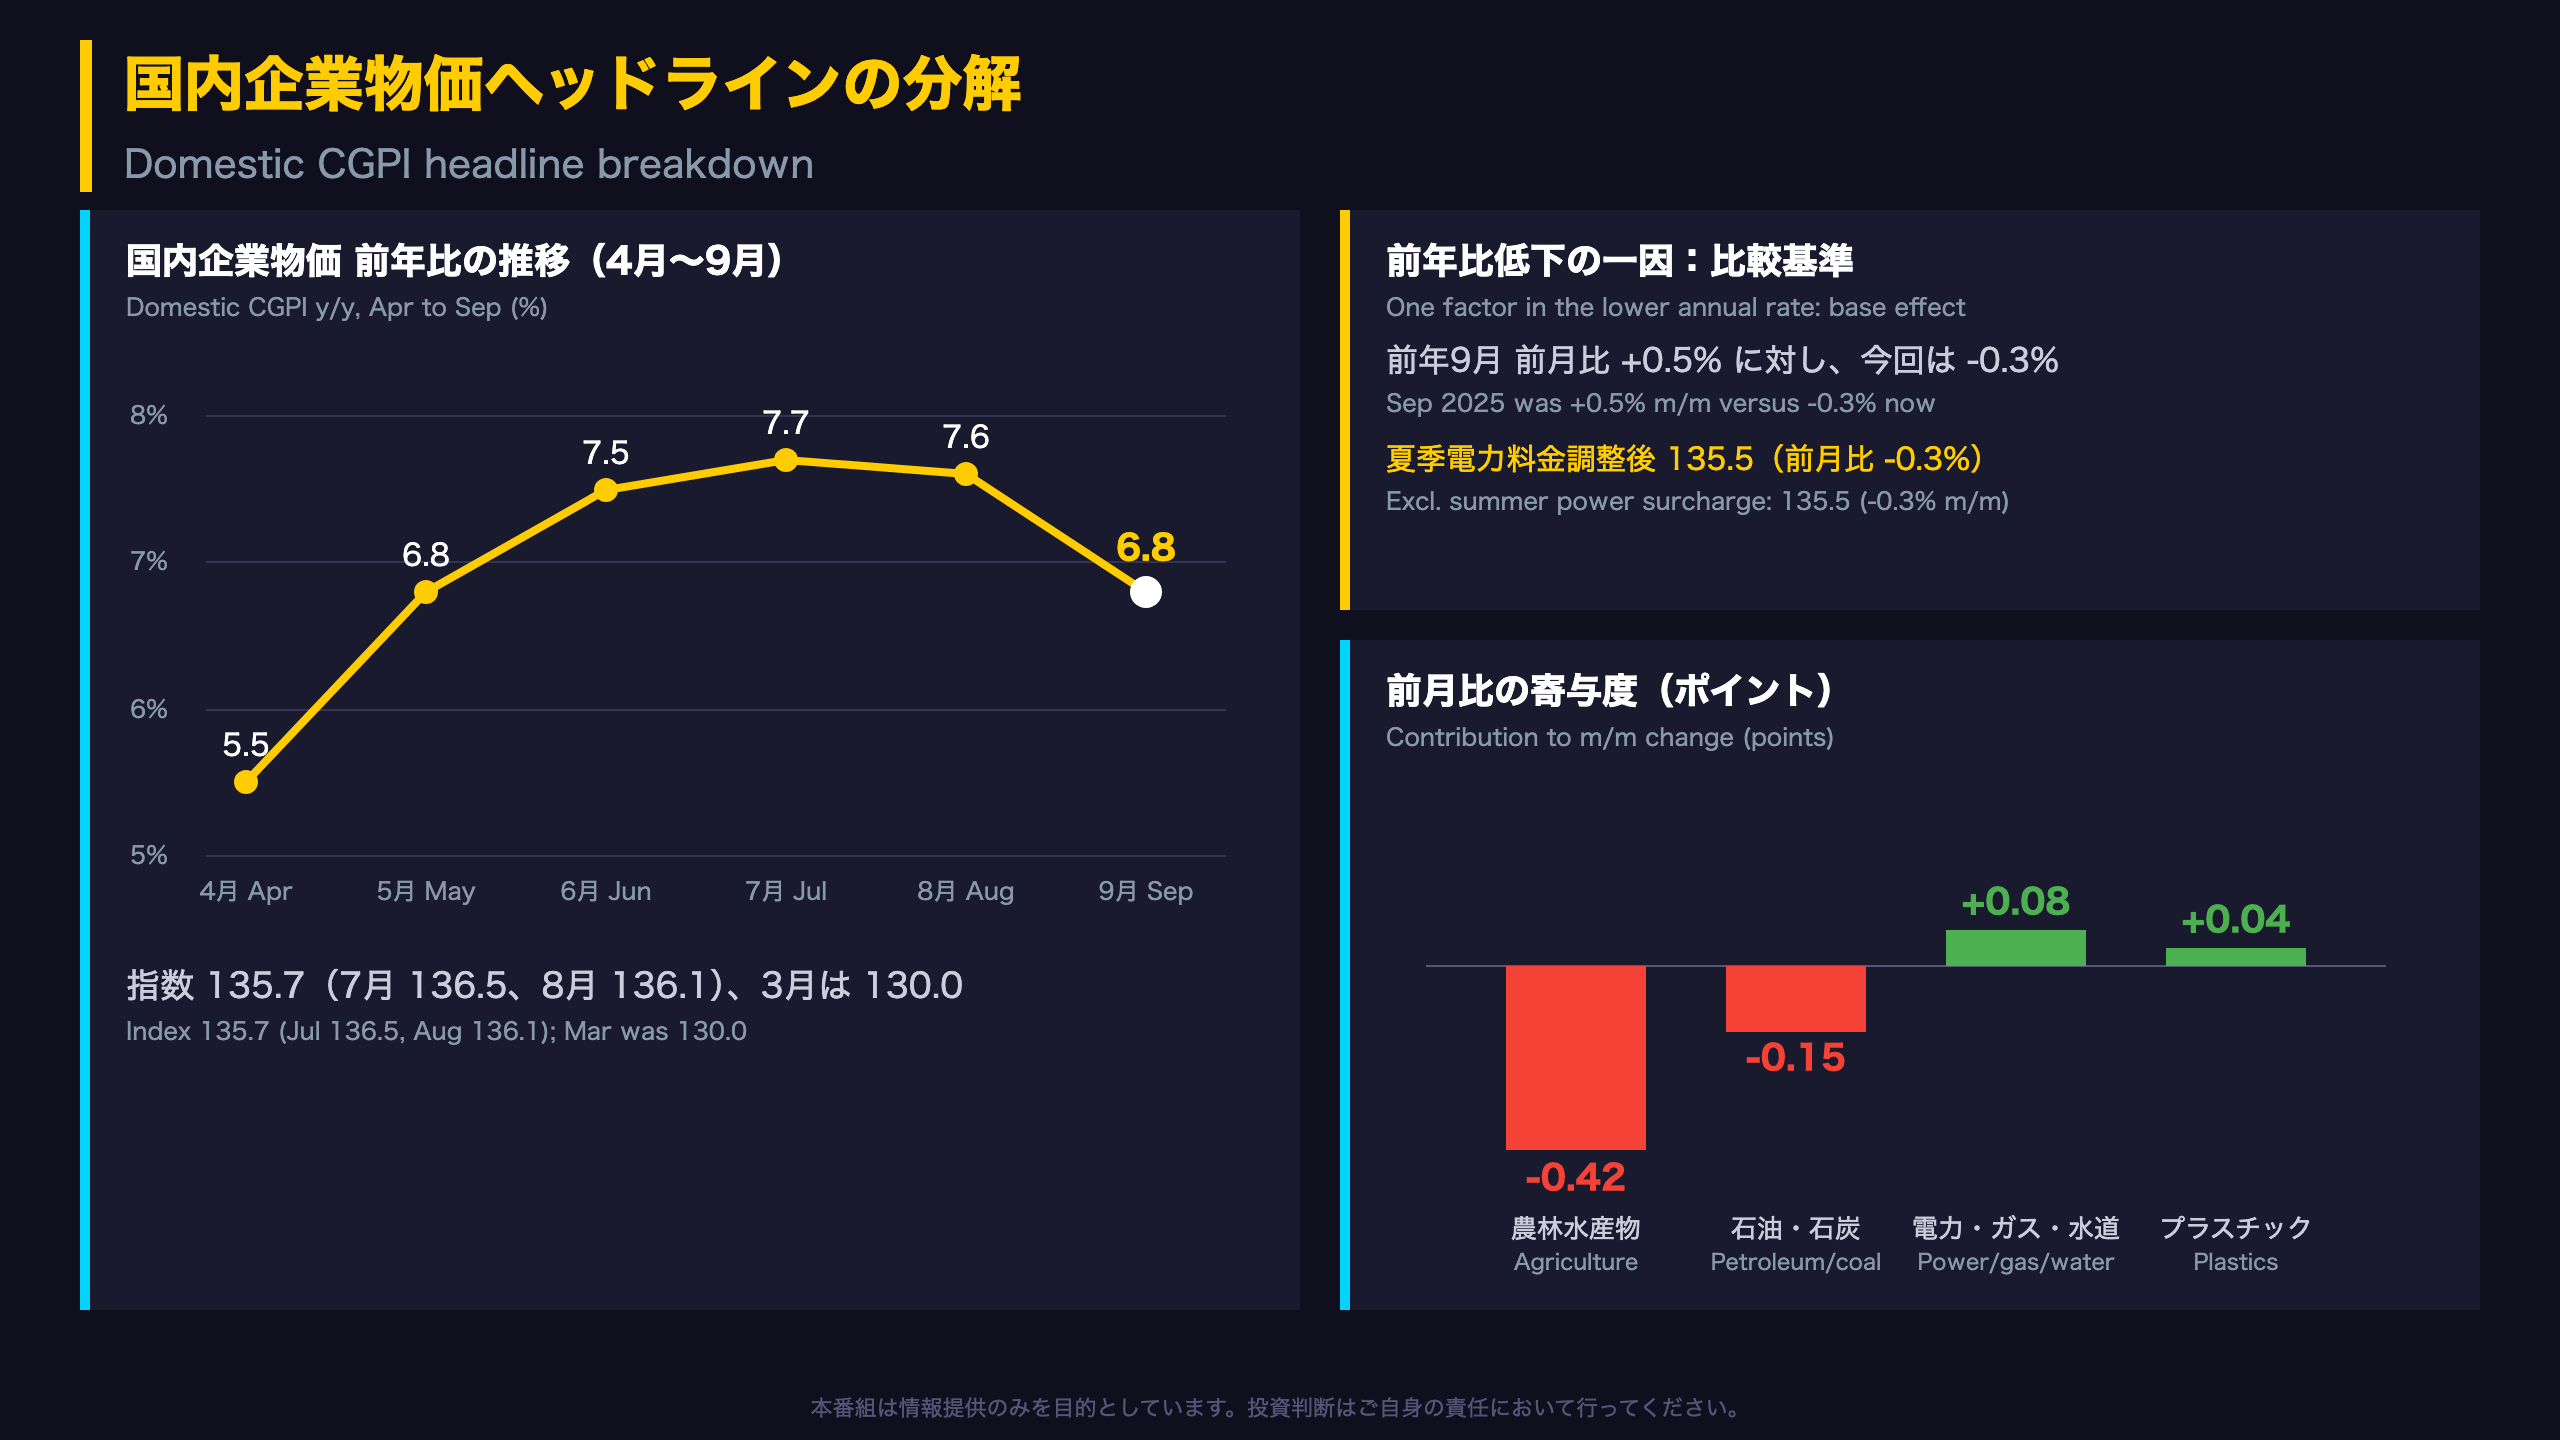
💡 The base effect (Sep 2025 was +0.5% m/m) and lower agricultural prices (-0.42pt contribution) played a role.
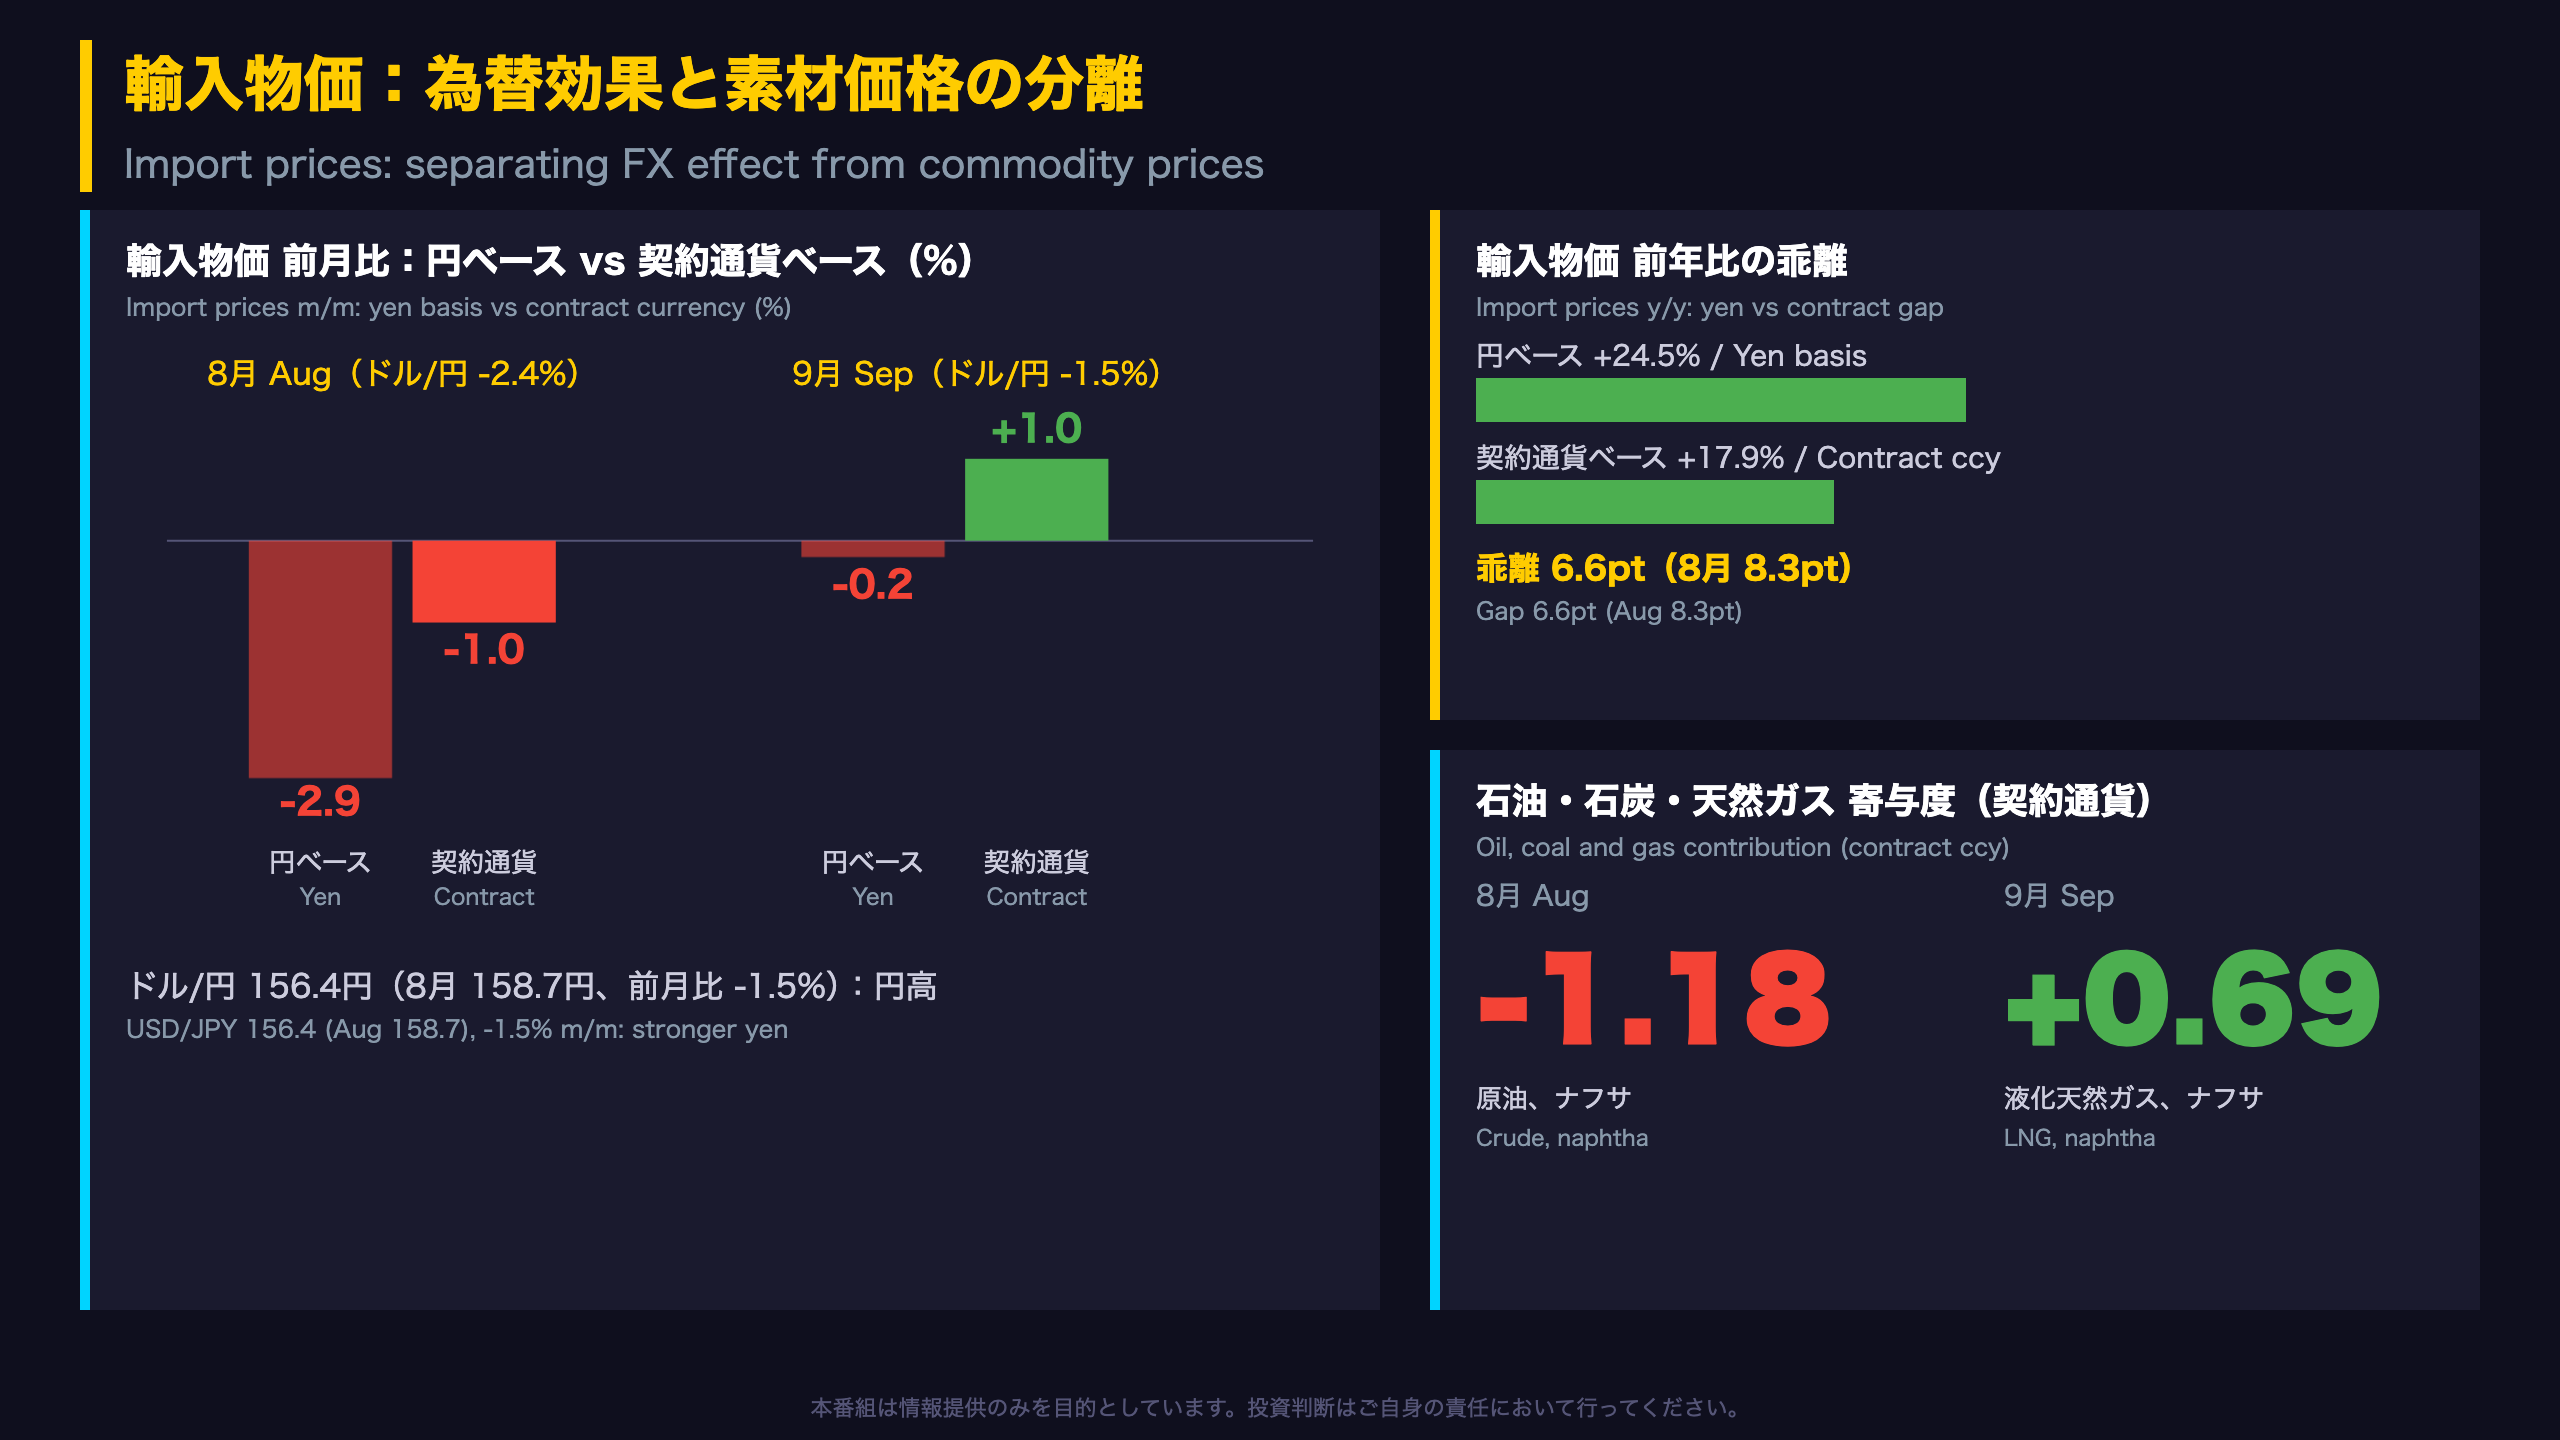
⚠️ Import prices dropped 0.2% in yen terms but rose 1.0% in contract currency (+17.9% y/y). The yen-based dip is consistent with USD/JPY at 156.4, down 1.5% m/m.
🔍 Material categories show high annual gains while processing categories lag, pointing to uneven pass-through.
📅 Next release: Thursday, Nov 12 (October flash).
The Ultimate Summary:国内は鈍化、上流の圧力は継続
What is the CGPI?
The Corporate Goods Price Index (CGPI) is published monthly by the Bank of Japan and tracks prices at the wholesale level, with 2020 as the base year (=100). It is the closest Japanese analogue to the US Producer Price Index, but it also carries separate import and export price indices, each quoted in both yen and contract currency.
September at a glance
| Month | m/m | y/y |
|---|---|---|
| Jun | +0.6% | +7.5% |
| Jul | +0.4% | +7.7% |
| Aug | -0.3% | +7.6% |
| Sep | -0.3% | +6.8% |
The annual rate has eased for two straight months from the July peak, yet the index level (135.7) remains well above March (130.0). The BOJ’s own summary line reads: \”Domestic CGPI fell 0.3% m/m (+6.8% y/y).\”
Reading it across borders
CGPI is an input-cost gauge, not a measure of what households pay. A 6.8% wholesale annual rate is therefore not directly comparable with consumer inflation targets such as the Federal Reserve’s 2%, nor with Japan’s own CPI, which sits later in the supply chain.
Two readings
- Cooling: two consecutive monthly declines and a falling annual rate suggest momentum has settled after the sharp April to May surge (+2.8% and +1.1% m/m).
- Still elevated: contract-currency import prices are up 17.9% y/y, so upstream cost levels remain high once currency moves are stripped out.
This release contains no BOJ policy statement. Next release: Thursday, November 12 (October flash).
国内企業物価ヘッドラインの分解
Category detail (September flash)
| Category | Index | m/m | y/y |
|---|---|---|---|
| Agriculture, forestry and fishery | 146.4 | -8.8% | -13.3% |
| Petroleum and coal products | 174.6 | -2.2% | +11.5% |
| Electric power, gas and water | 145.7 | +1.3% | +10.5% |
| Plastic products | 132.1 | +1.1% | +12.8% |
| Non-ferrous metals | 261.1 | 0.0% | +40.2% |
| Iron and steel | 147.4 | +0.3% | +3.2% |
How to read the contributions
The BOJ publishes contribution-to-change figures by category, similar to the way the US BLS shows relative importance in PPI releases. This month the decline came from two groups: agricultural products (-0.42 points, led by rice and pork) and petroleum and coal products (-0.15 points). Electricity, gas and water added 0.08 points.
Agricultural prices swung from +1.5% y/y in August (revised) to -13.3% y/y. With a weight of about 4.0% of the index, a rough calculation suggests this alone could account for around 0.6 points of the headline slowdown. This is an approximation, not a figure from the source.
Summer power surcharge
The BOJ also publishes an index excluding the summer electricity surcharge applied each July to September. In September the adjusted index is 135.5 against 135.7, and both fell 0.3% m/m.
Two readings
- Temporary factors: most manufactured categories still rose on the month, for example chemicals (+0.3%) and metal products (+0.7%).
- Breadth to watch: this is the second consecutive monthly decline, and the source does not say whether agricultural weakness has run its course.
輸入物価:為替効果と素材価格の分離
Why import prices have two versions
The BOJ’s Import Price Index is published in yen terms and in contract-currency terms. The yen-based series reflects what Japanese firms actually pay after converting foreign-currency invoices. The contract-currency series strips out the exchange-rate effect and shows the underlying price change in the invoice currency, most often US dollars. The gap between the two is therefore a rough yen effect.
September detail
| Category | Yen m/m | Contract m/m | Yen y/y | Contract y/y |
|---|---|---|---|---|
| Petroleum, coal and natural gas | +0.9% | +2.3% | +43.6% | +36.1% |
| Metals | 0.0% | +1.1% | +32.4% | +25.2% |
| Electric and electronic equipment | -0.6% | +0.6% | +29.5% | +22.5% |
| Food and agricultural products | -1.2% | -0.1% | +6.2% | +2.2% |
The contract-currency headline index (143.6) is back at July’s level, while the yen-based index (193.8) sits below July’s 199.9. The BOJ footnote reads: \”A negative sign indicates a stronger yen.\”
Do not confuse with export prices
Export prices show what Japanese producers charge abroad. In September, export prices rose 0.5% in yen terms while import prices fell 0.2%, so the same currency move affected the two indices differently.
What to watch
- Underlying cost view: contract-currency prices turned positive (+1.0%) as energy rebounded.
- Currency view: the yen-based dip is consistent with USD/JPY moving from 158.7 to 156.4 (-1.5% m/m).
The source reports the exchange rate as a monthly change only, so the annual currency effect is not available.
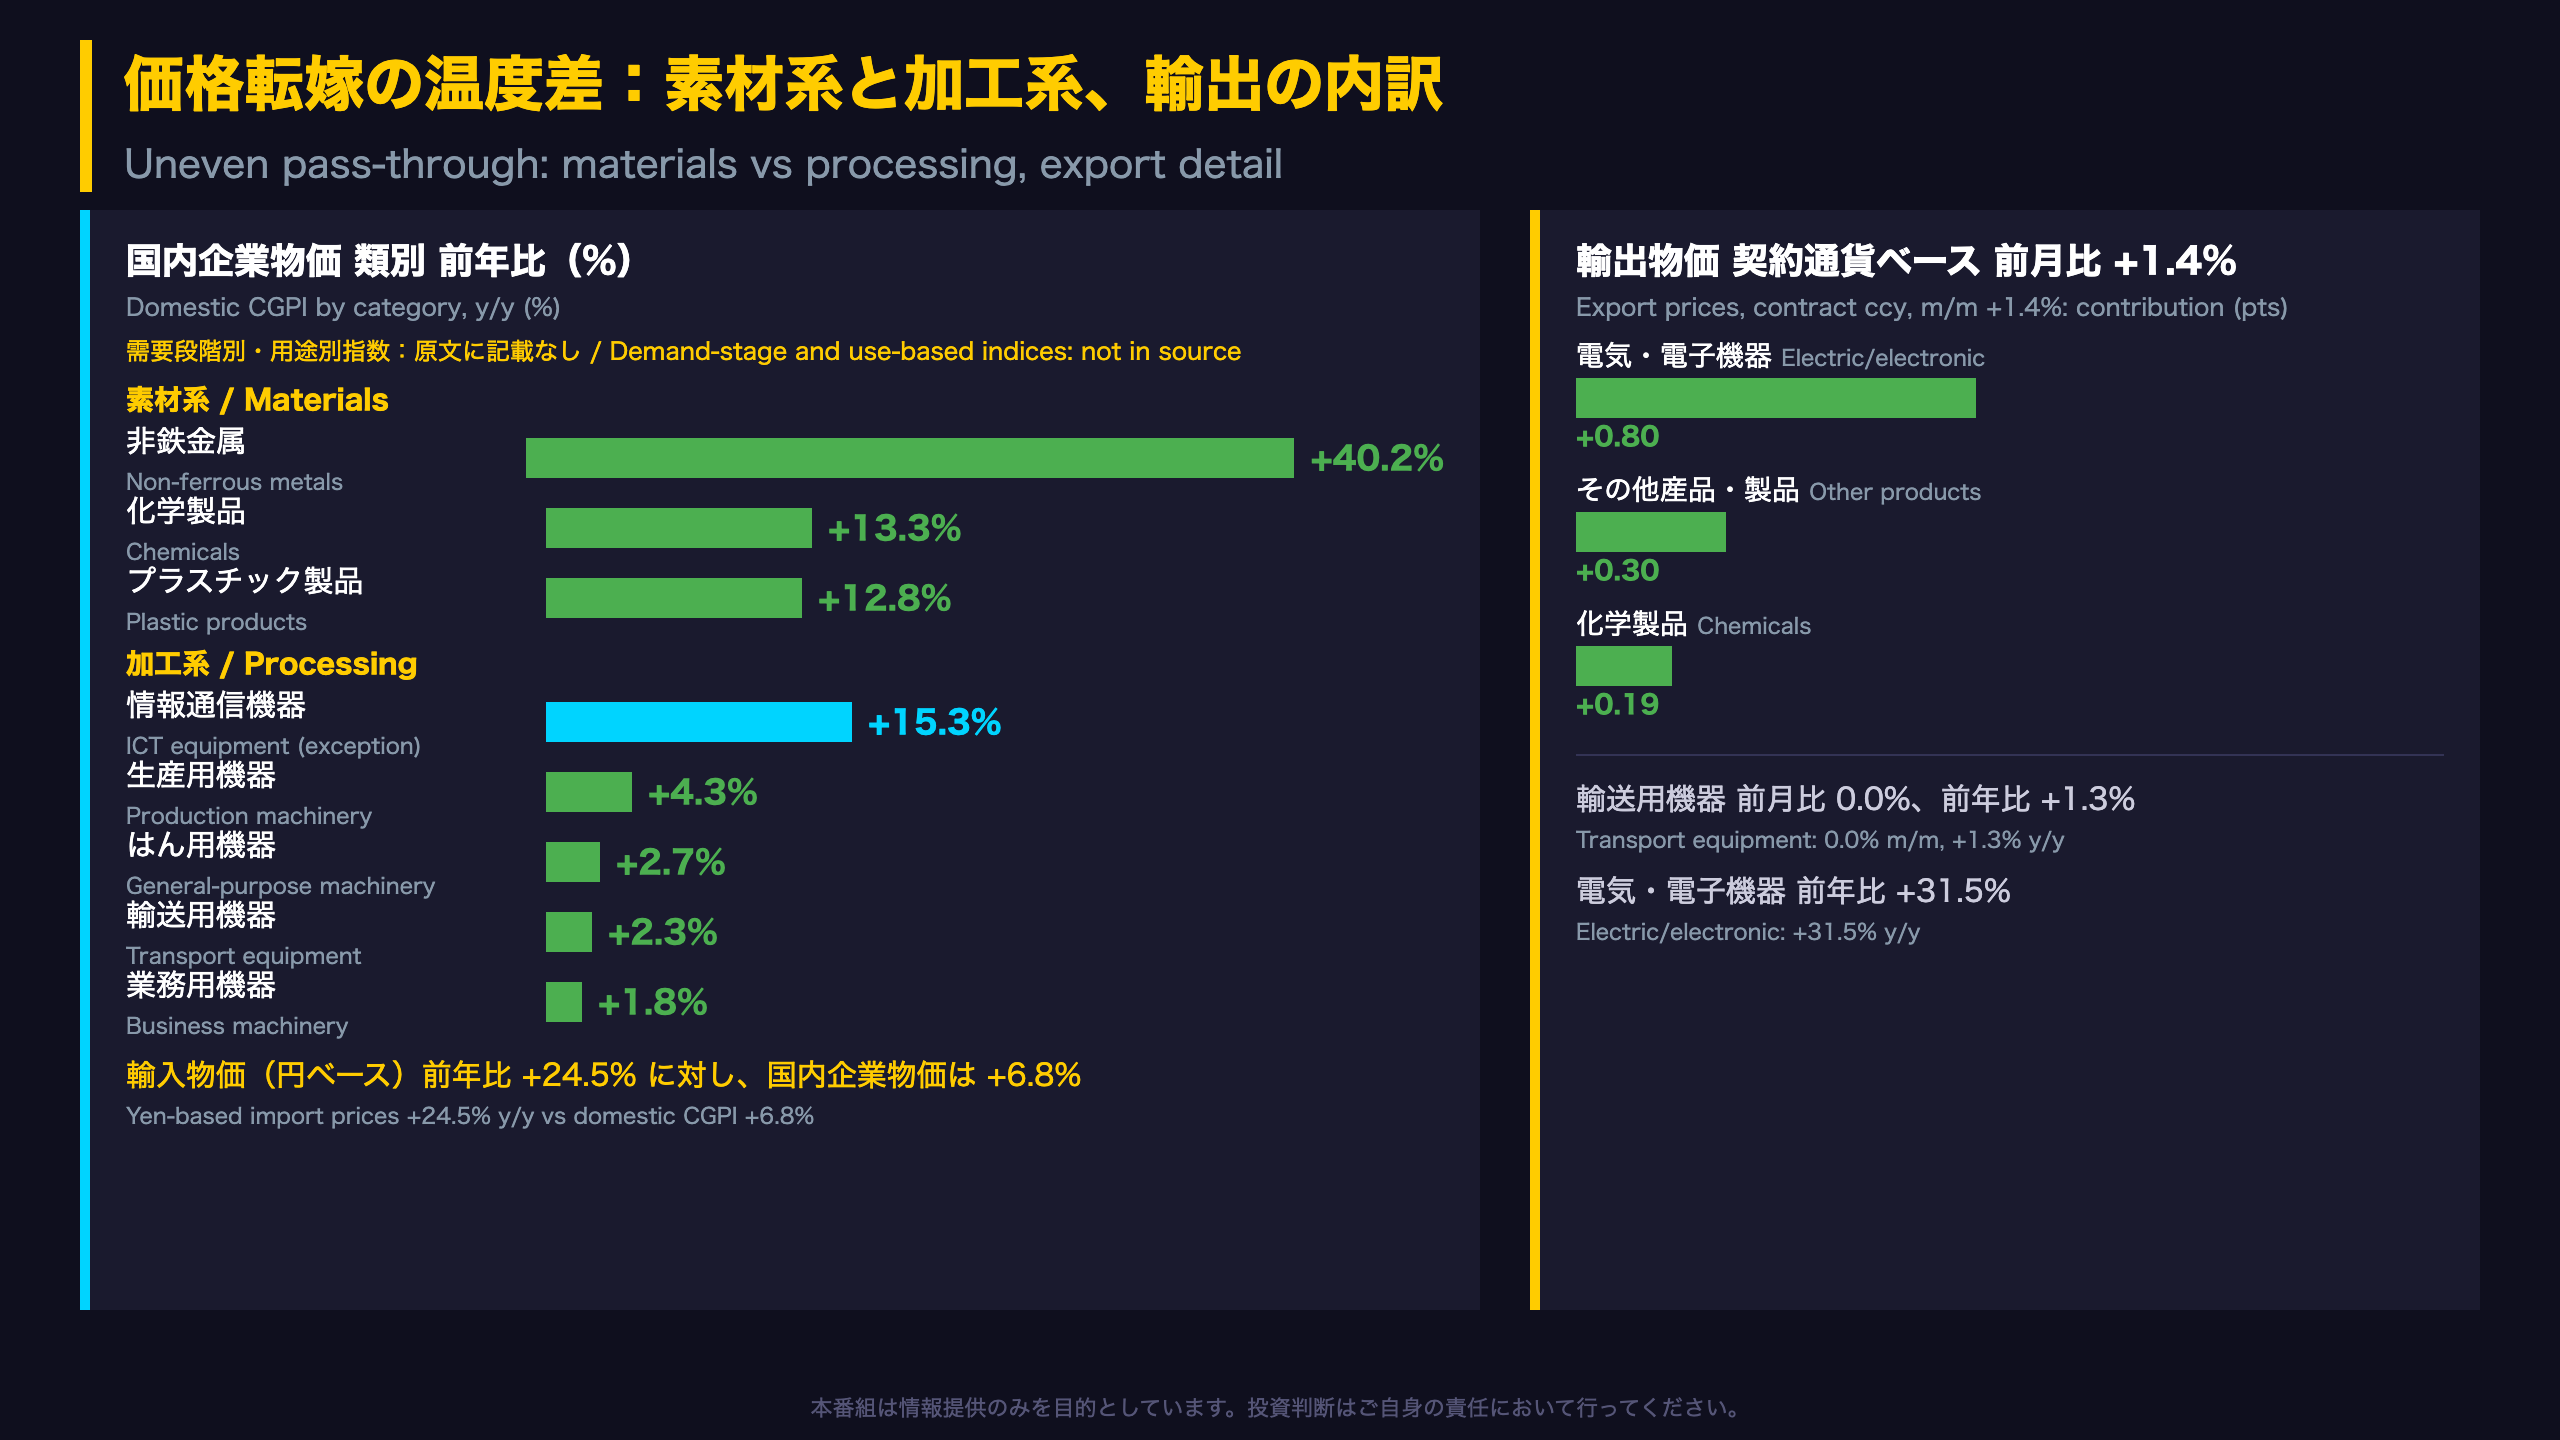
価格転嫁の温度差:素材系と加工系、輸出の内訳
Reading pass-through without demand-stage data
The BOJ normally also publishes CGPI by demand stage (raw materials, intermediate goods, final goods). That breakdown is not included in this release, so the categories below are a proxy only.
| Group | Category | y/y | m/m |
|---|---|---|---|
| Materials | Non-ferrous metals | +40.2% | 0.0% |
| Materials | Chemicals | +13.3% | +0.3% |
| Materials | Iron and steel | +3.2% | +0.3% |
| Processing | Information and communication equipment | +15.3% | +0.2% |
| Processing | Electrical machinery | +5.1% | +0.3% |
| Processing | Transport equipment | +2.3% | +0.1% |
Closer to consumers
Food and beverages are up 4.2% y/y and textiles 1.4%, both below the 6.8% headline. Japan’s CPI is outside this report, but the gap between upstream and downstream rates is consistent with pass-through that is still incomplete.
Export detail (contract currency)
- Electric and electronic equipment: +3.6% m/m, +31.5% y/y, led by MOS memory integrated circuits.
- Other products: +3.0% m/m, contributing 0.30 points (diesel, heavy fuel oil, gasoline).
- Transport equipment: 0.0% m/m, +1.3% y/y.
Two readings
- Pass-through continuing: most processing categories rose on the month.
- Pass-through lagging: downstream annual rates remain far below upstream ones. This is single-month data, so confirmation requires later releases.
Memory-chip-driven export gains are a product-specific story and should not be read as a broad domestic price signal.
根拠の鎖と次の注目点
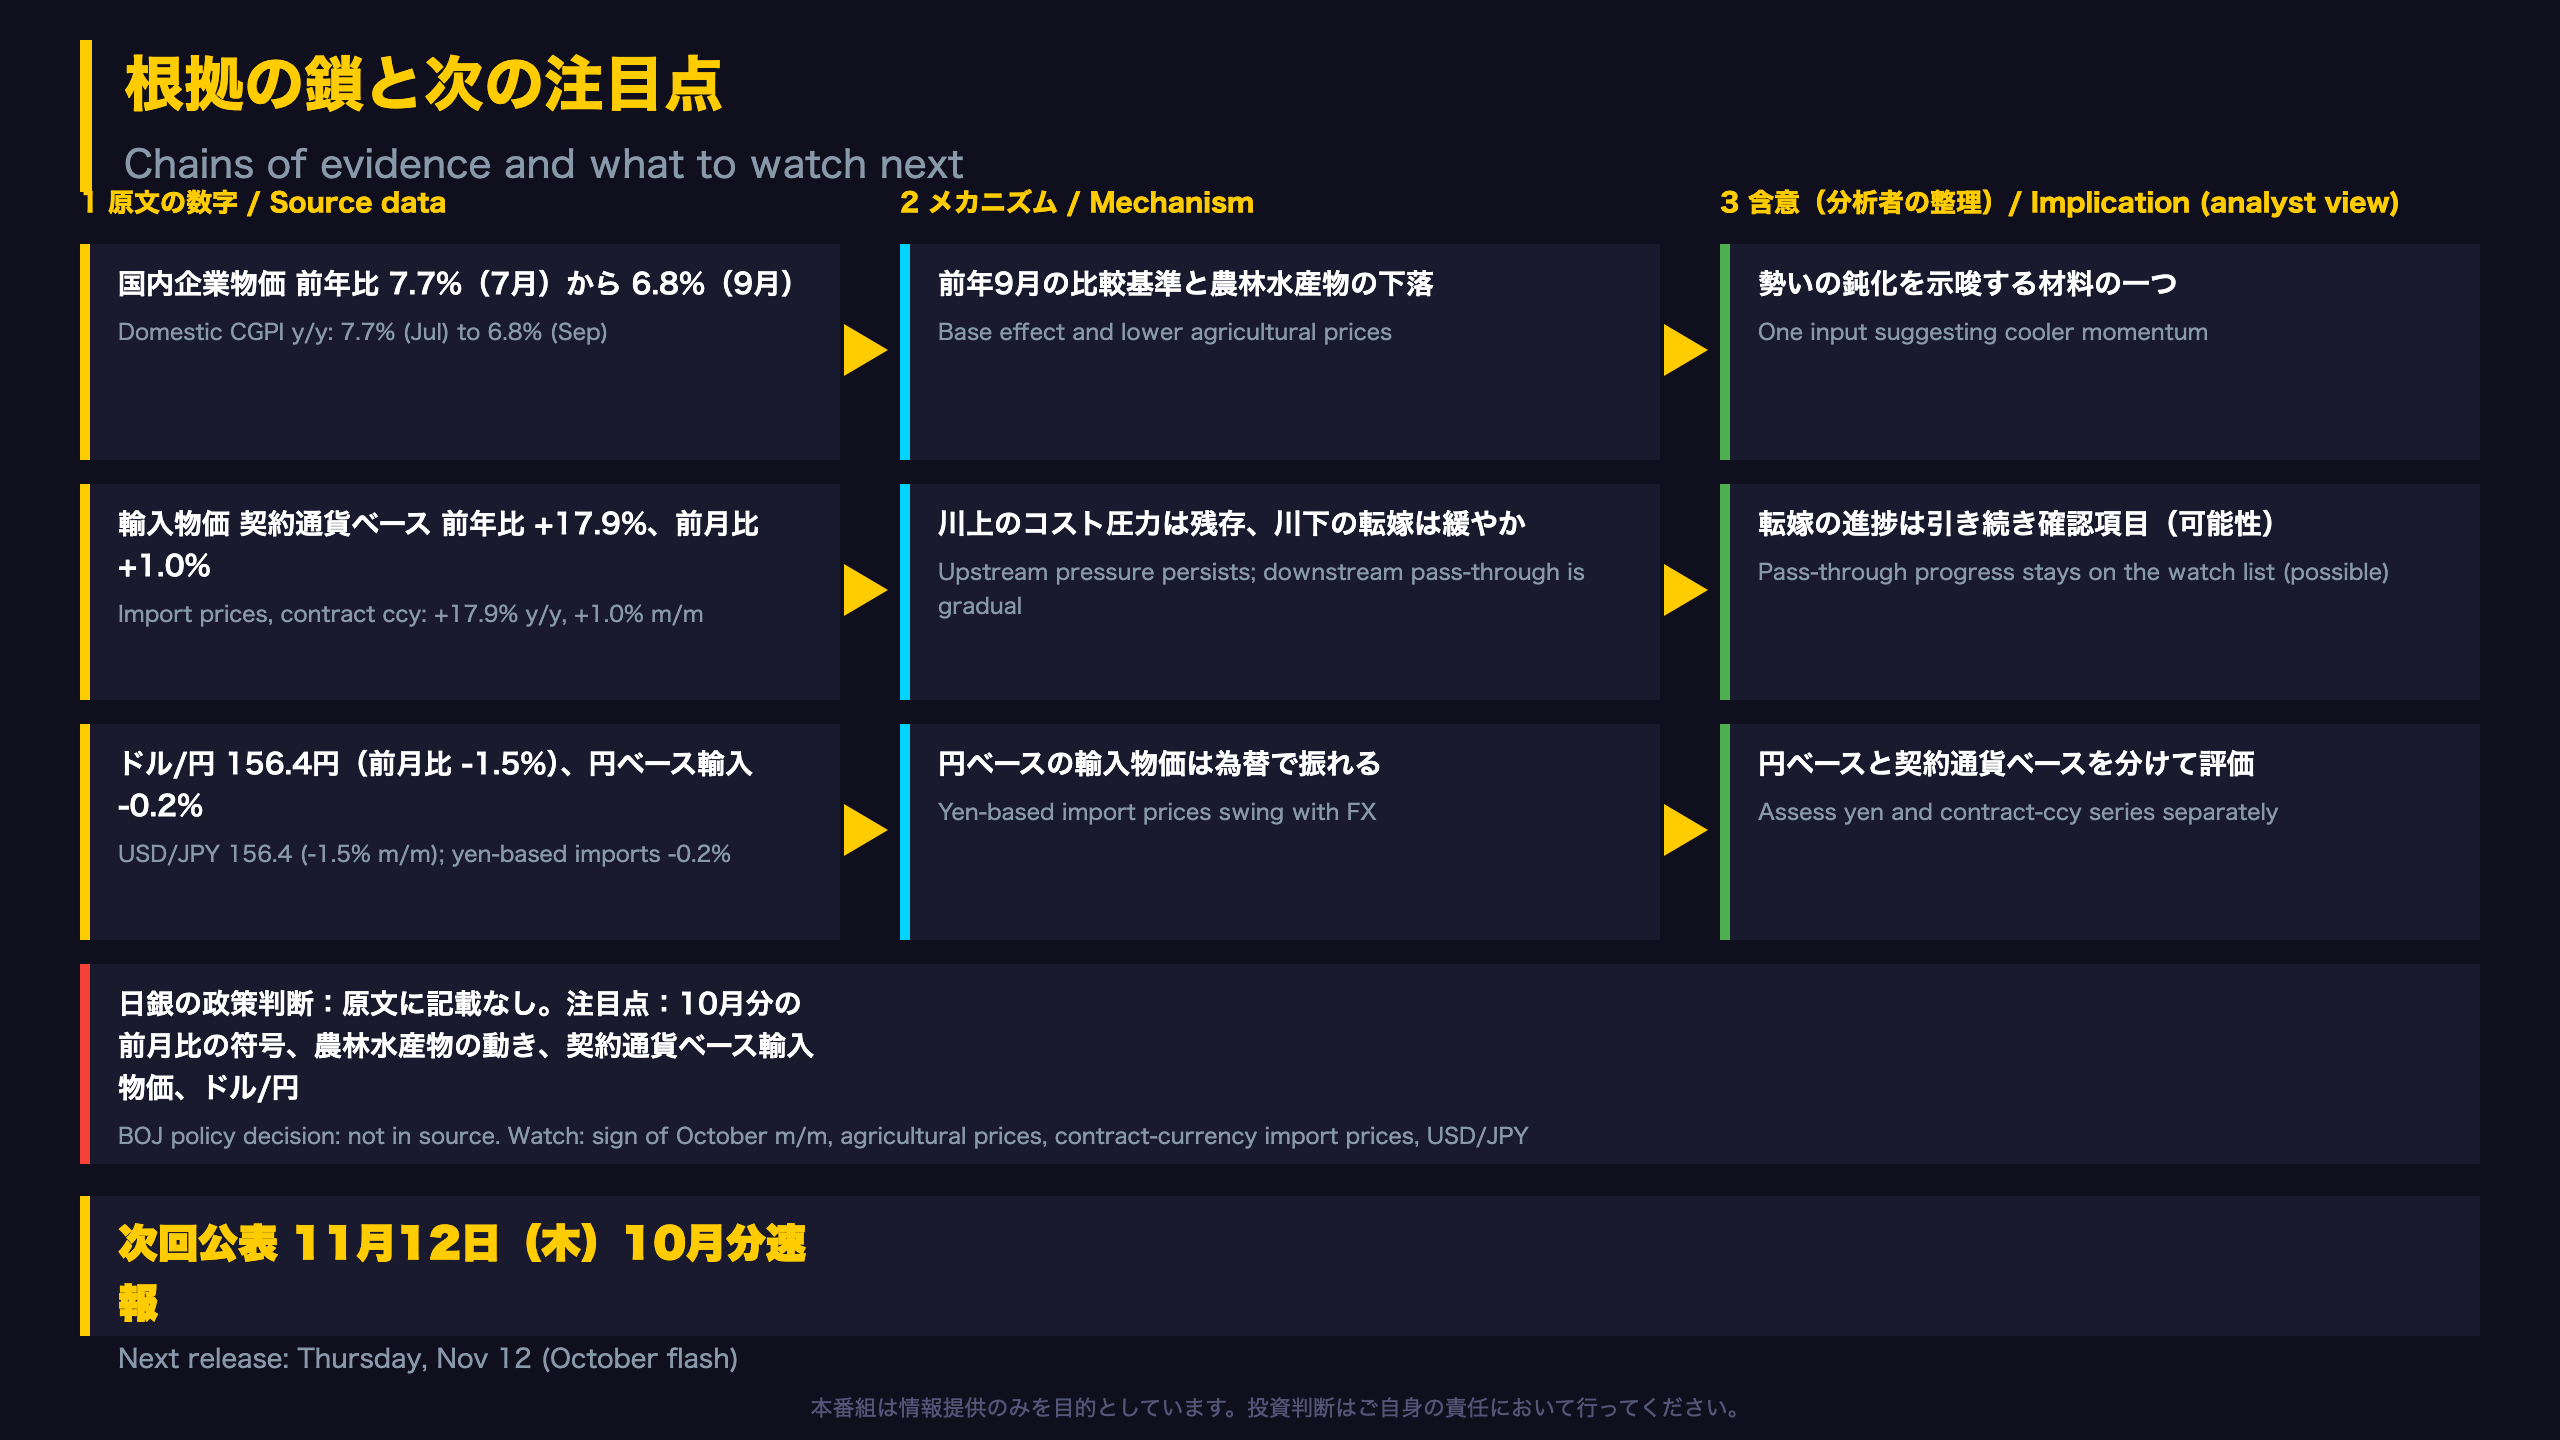
Chains of evidence, from data to possible policy relevance
The release contains no statement on BOJ policy rates or decisions. The table below is an analyst’s framing of the published numbers, not the BOJ’s view. Producer-type price data is one of several inputs central banks monitor, alongside consumer prices, wages and the Tankan survey.
| Chain | Source data | Mechanism | Possible relevance |
|---|---|---|---|
| A | Domestic CGPI y/y 7.7% (Jul) to 6.8% (Sep) | Base effect (Sep 2025 +0.5% m/m) and agriculture (-0.42pt) | One input pointing to cooler momentum |
| B | Import prices, contract ccy, +17.9% y/y | Upstream costs still working through | Pass-through progress stays on the watch list |
| C | USD/JPY 156.4 (-1.5% m/m) | Yen-based prices swing with FX | Assess yen and contract-currency series separately |
What to watch next
- Whether the m/m decline in domestic CGPI (-0.3% in both August and September) stops in the October data.
- Whether agricultural prices (-8.8% m/m in September) stabilize.
- Whether contract-currency import prices hold their +17.9% y/y level.
Two readings
- Cooling continues: two consecutive monthly declines suggest domestic momentum has settled.
- Upstream pressure remains: non-ferrous metals are up 40.2% y/y and contract-currency imports are up 17.9% y/y.
Single-month moves include special factors such as farm products, so several months of data are needed. The BOJ states the next release is Thursday, November 12.
Disclaimer: This article is for informational purposes only. All investment decisions are made solely at your own risk.







