📺 Watch the Full Video Analysis
This article was automatically generated by the NFC Market Live AI analysis system. (Updated: 2026-09-30 09:08 JST)
📄 Primary Source
NFC Market Live
https://www.meti.go.jp/statistics/tyo/iip/result/pdf/press/b2020_202608sj.pdf, https://www.meti.go.jp/statistics/tyo/iip/result/pdf/reference/b2020_202608refsj.pdf, https://www.meti.go.jp/statistics/tyo/iip/result/pdf/real/b2020_202608figsj.pdf
📊 A deep dive into Japan’s August 2026 Industrial Production Index (IIP), released by METI.
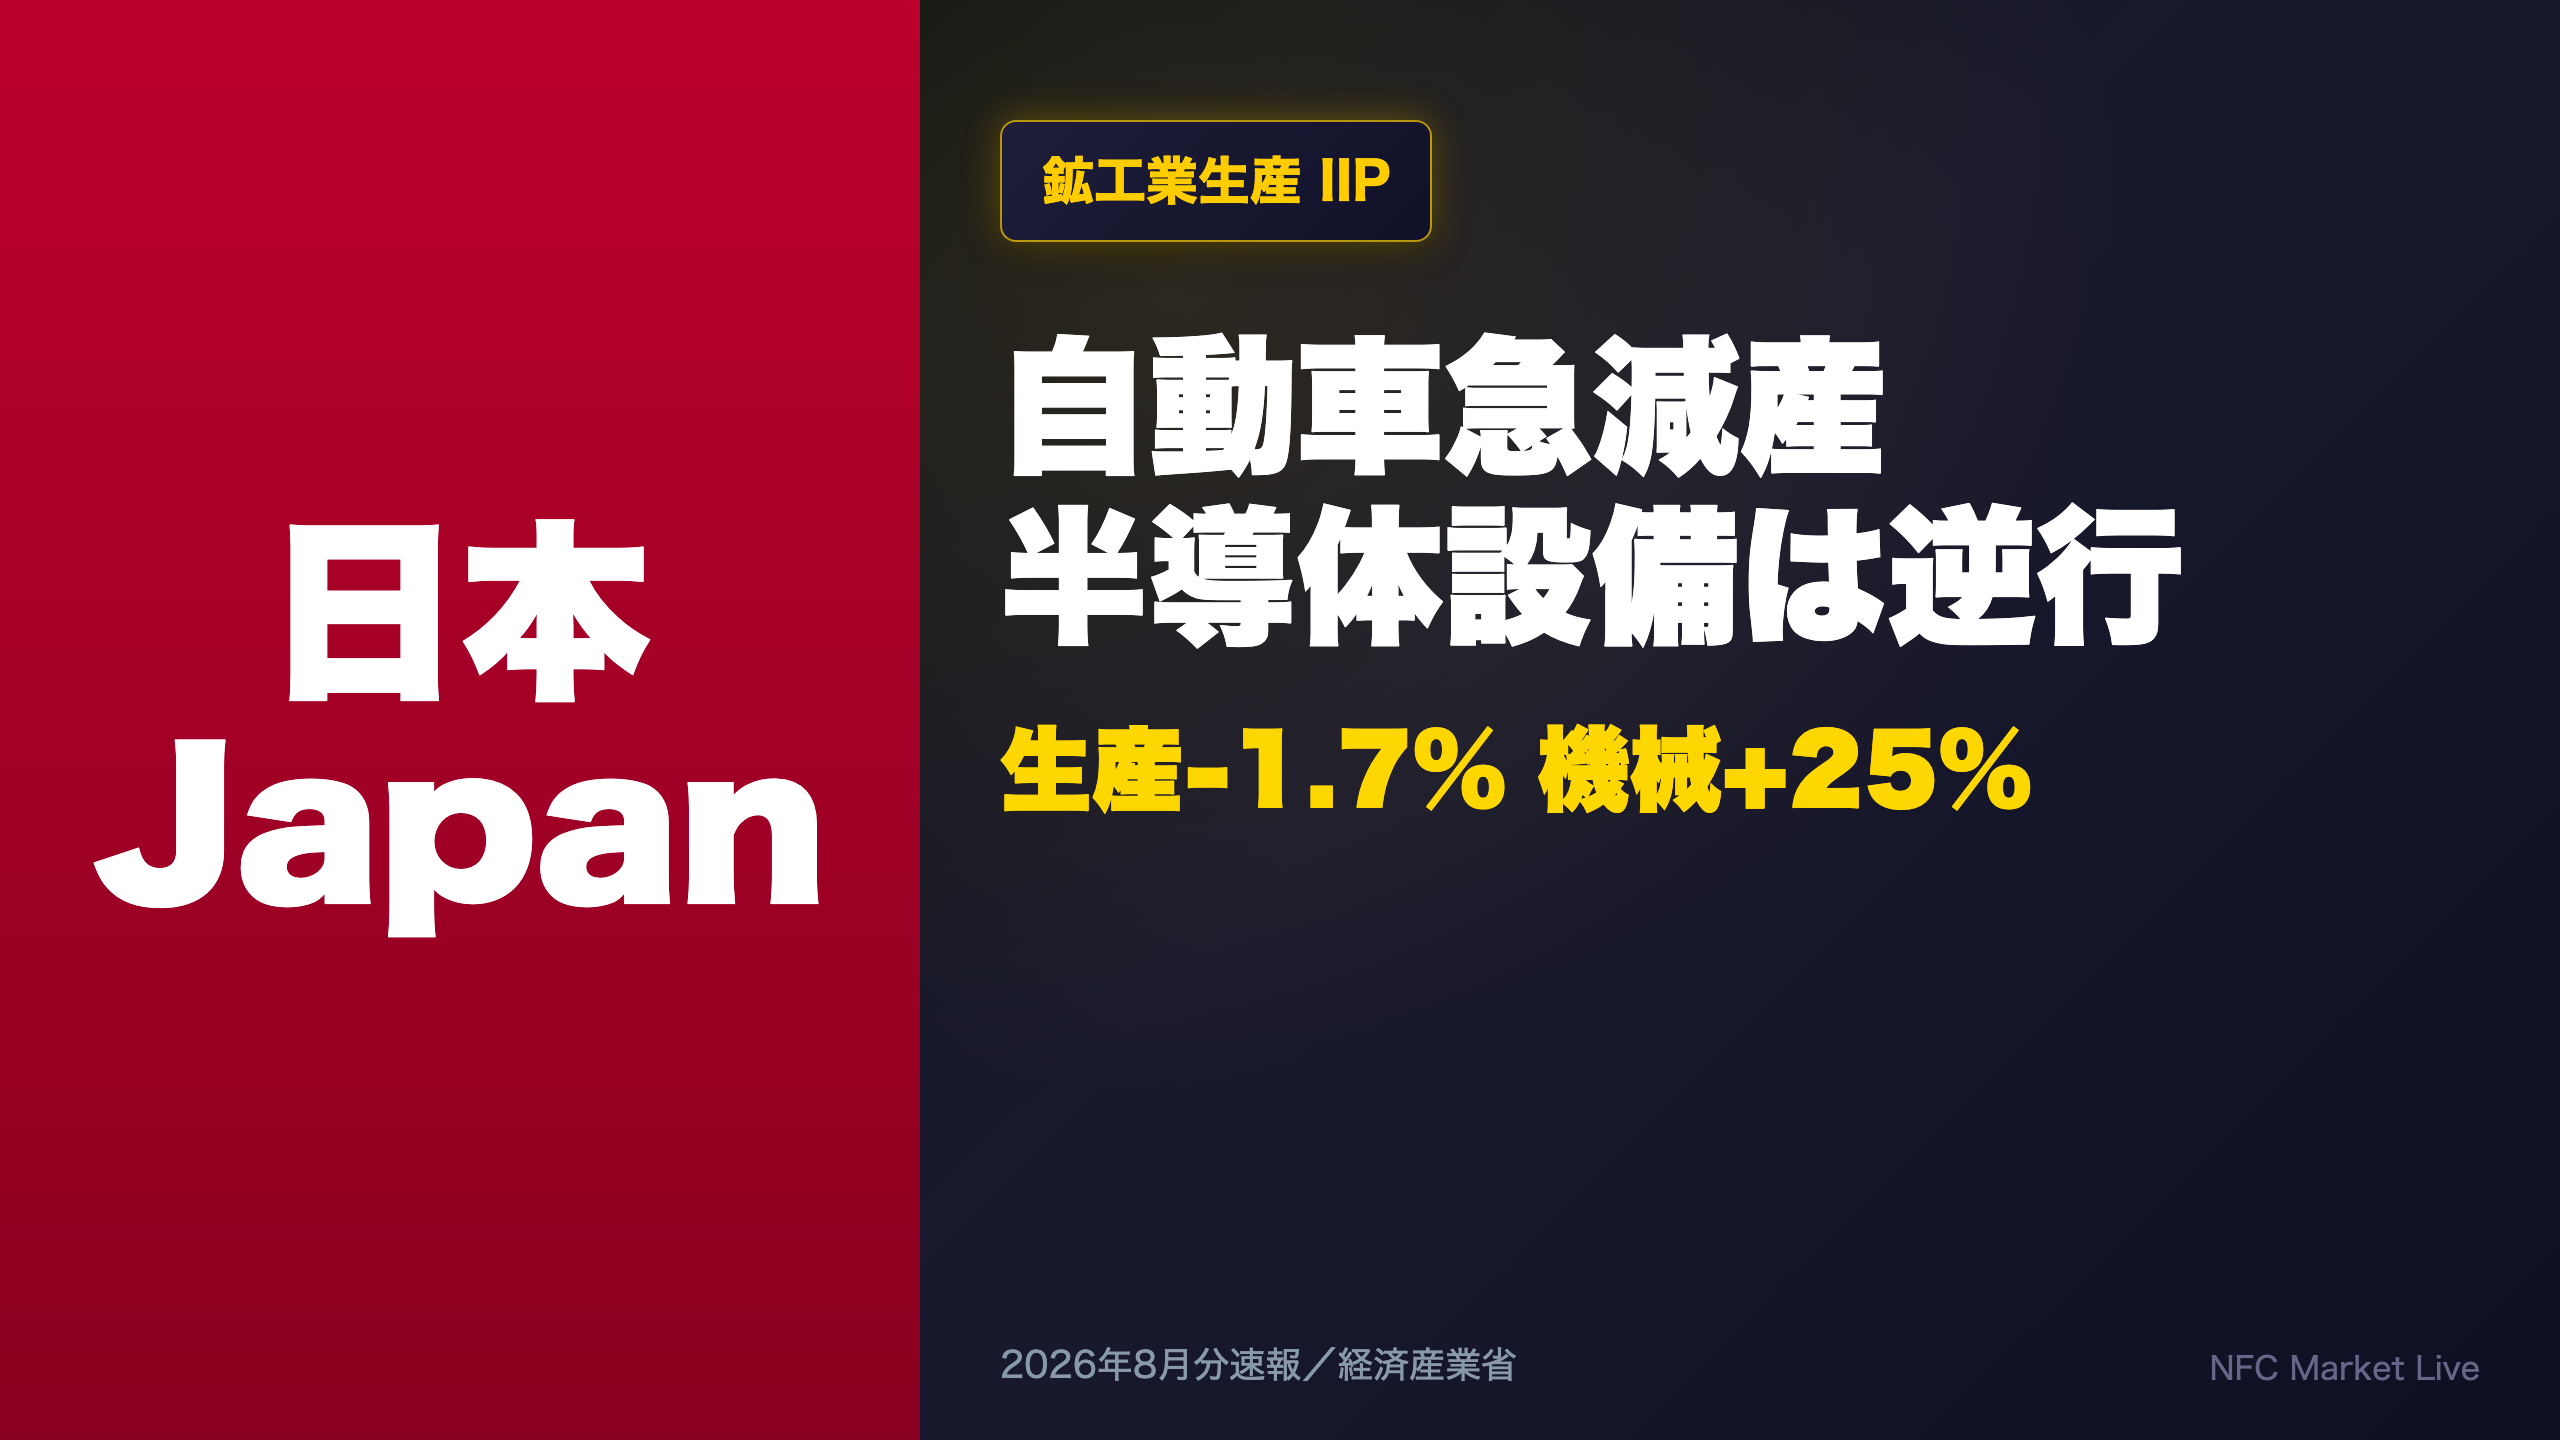
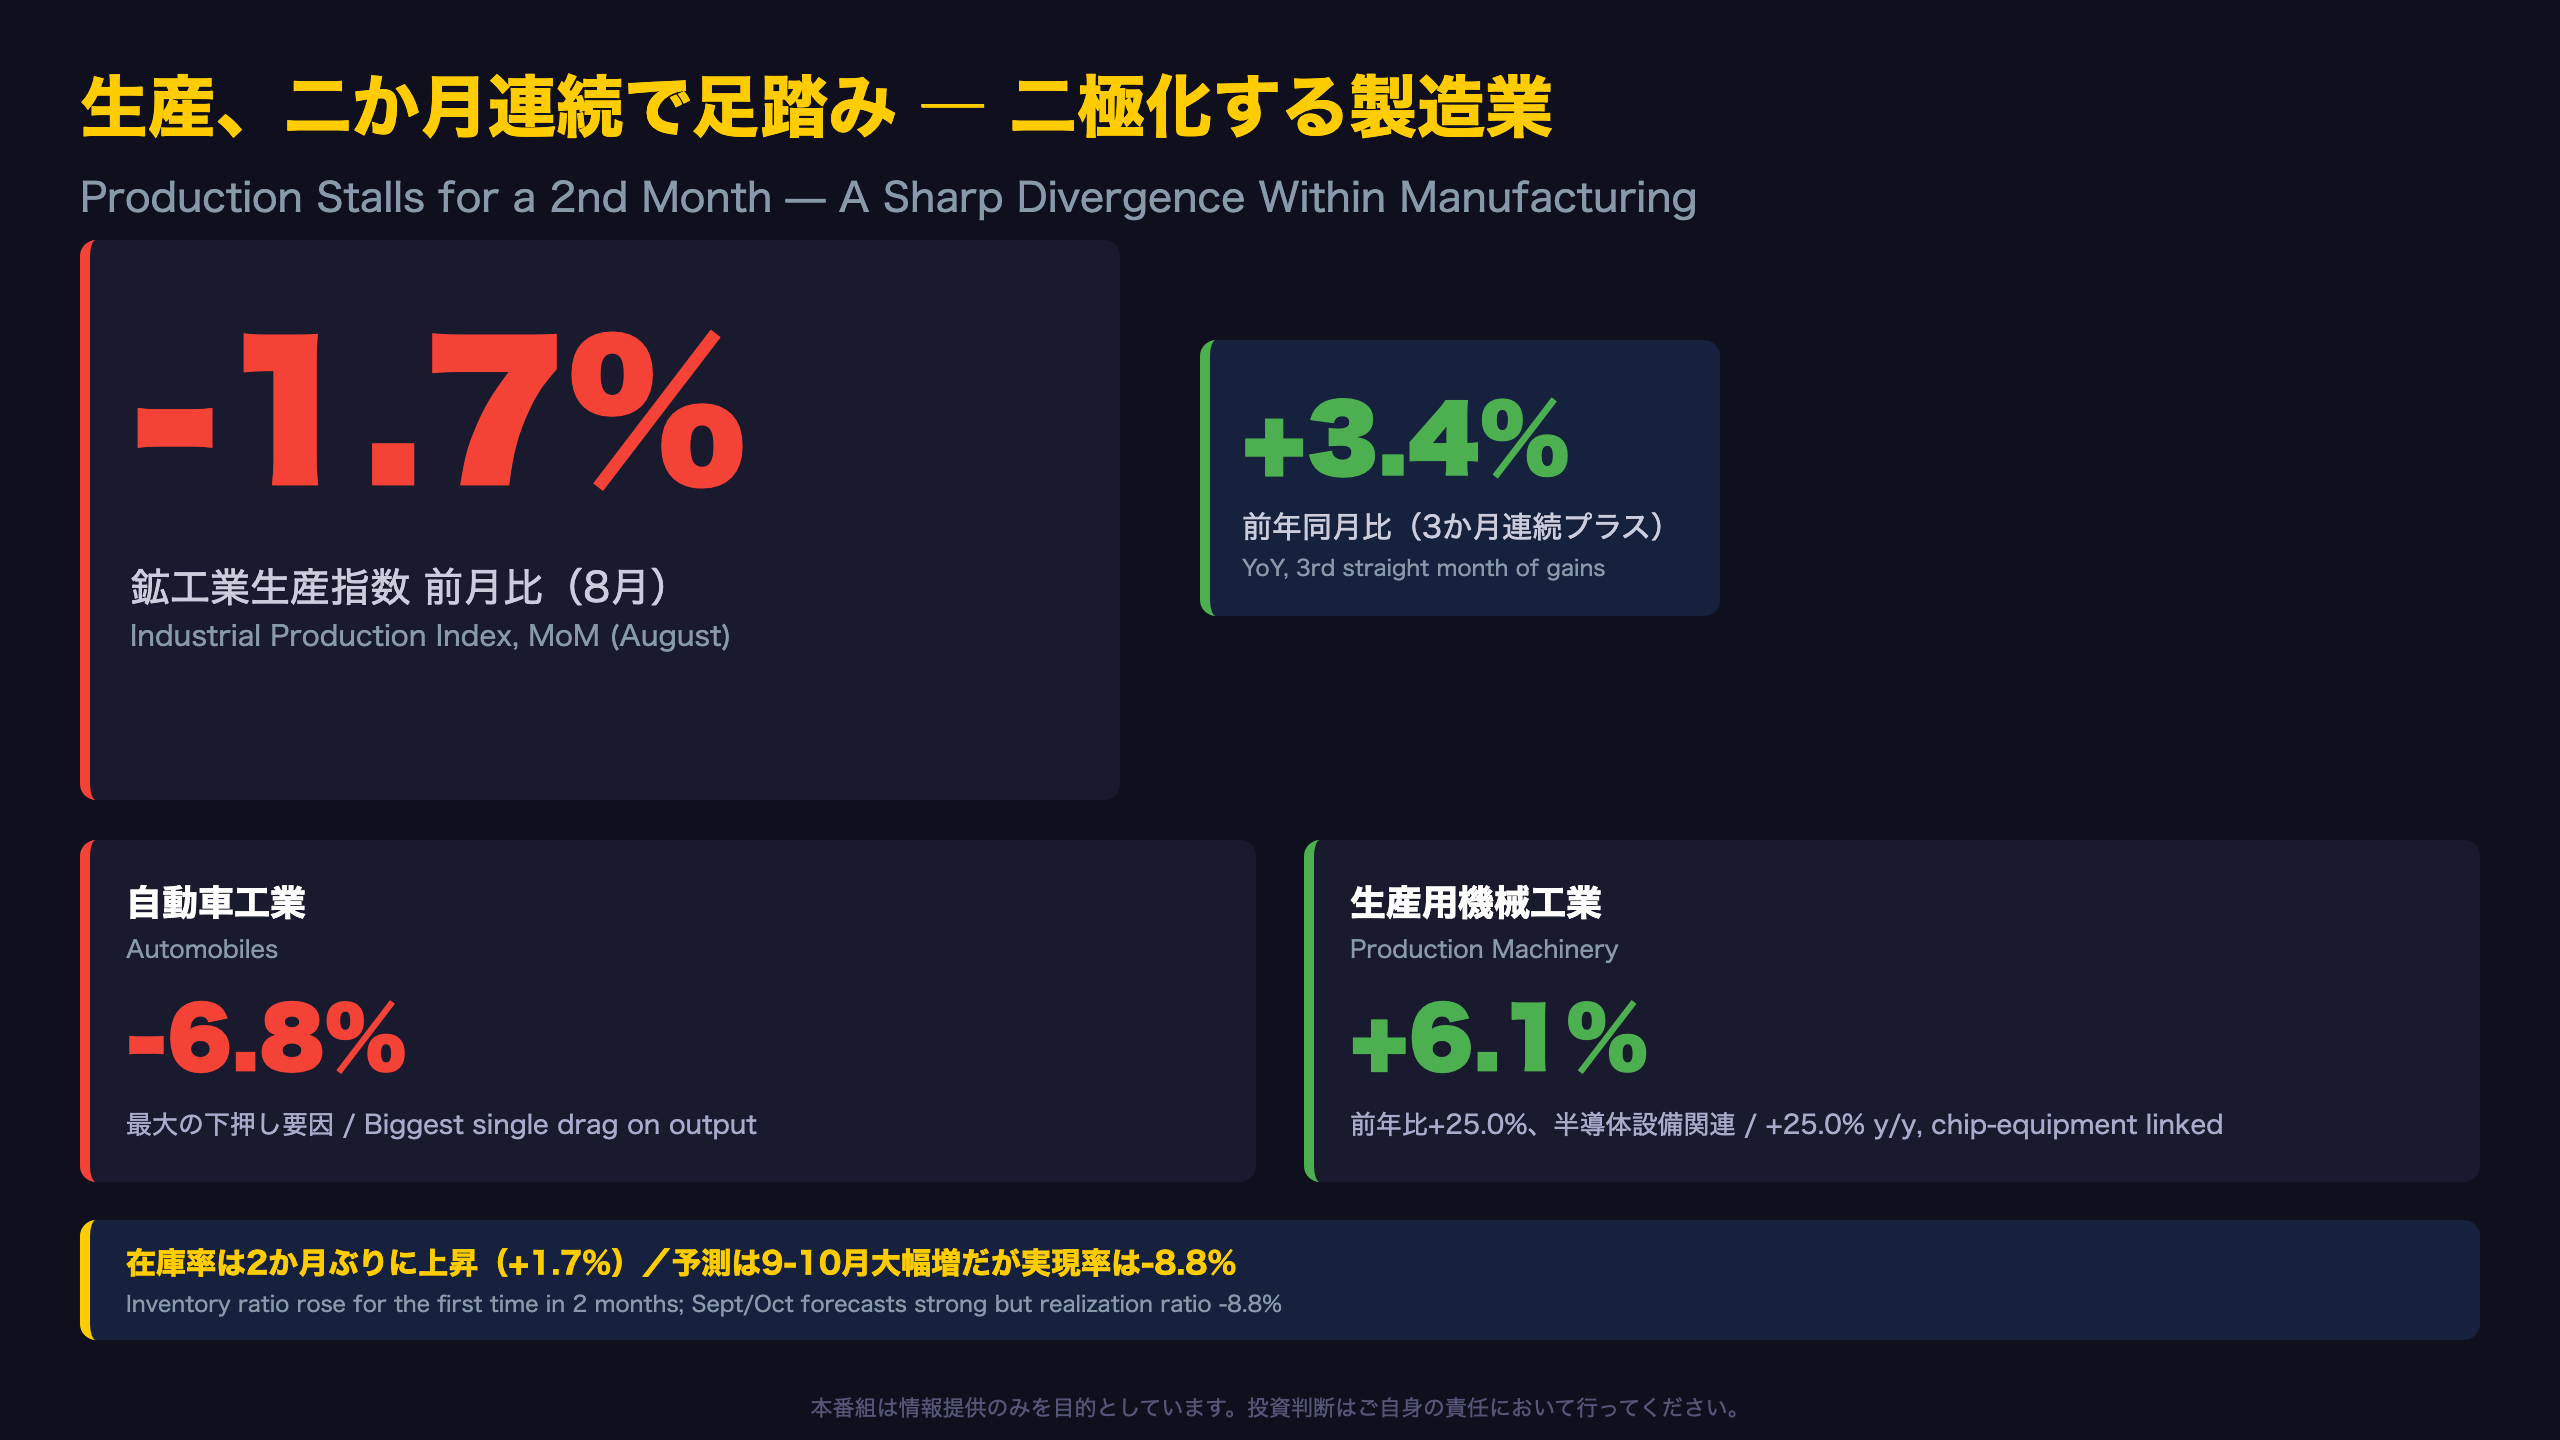
Output fell 1.7% m/m for a 2nd straight month, though y/y growth held at +3.4%.
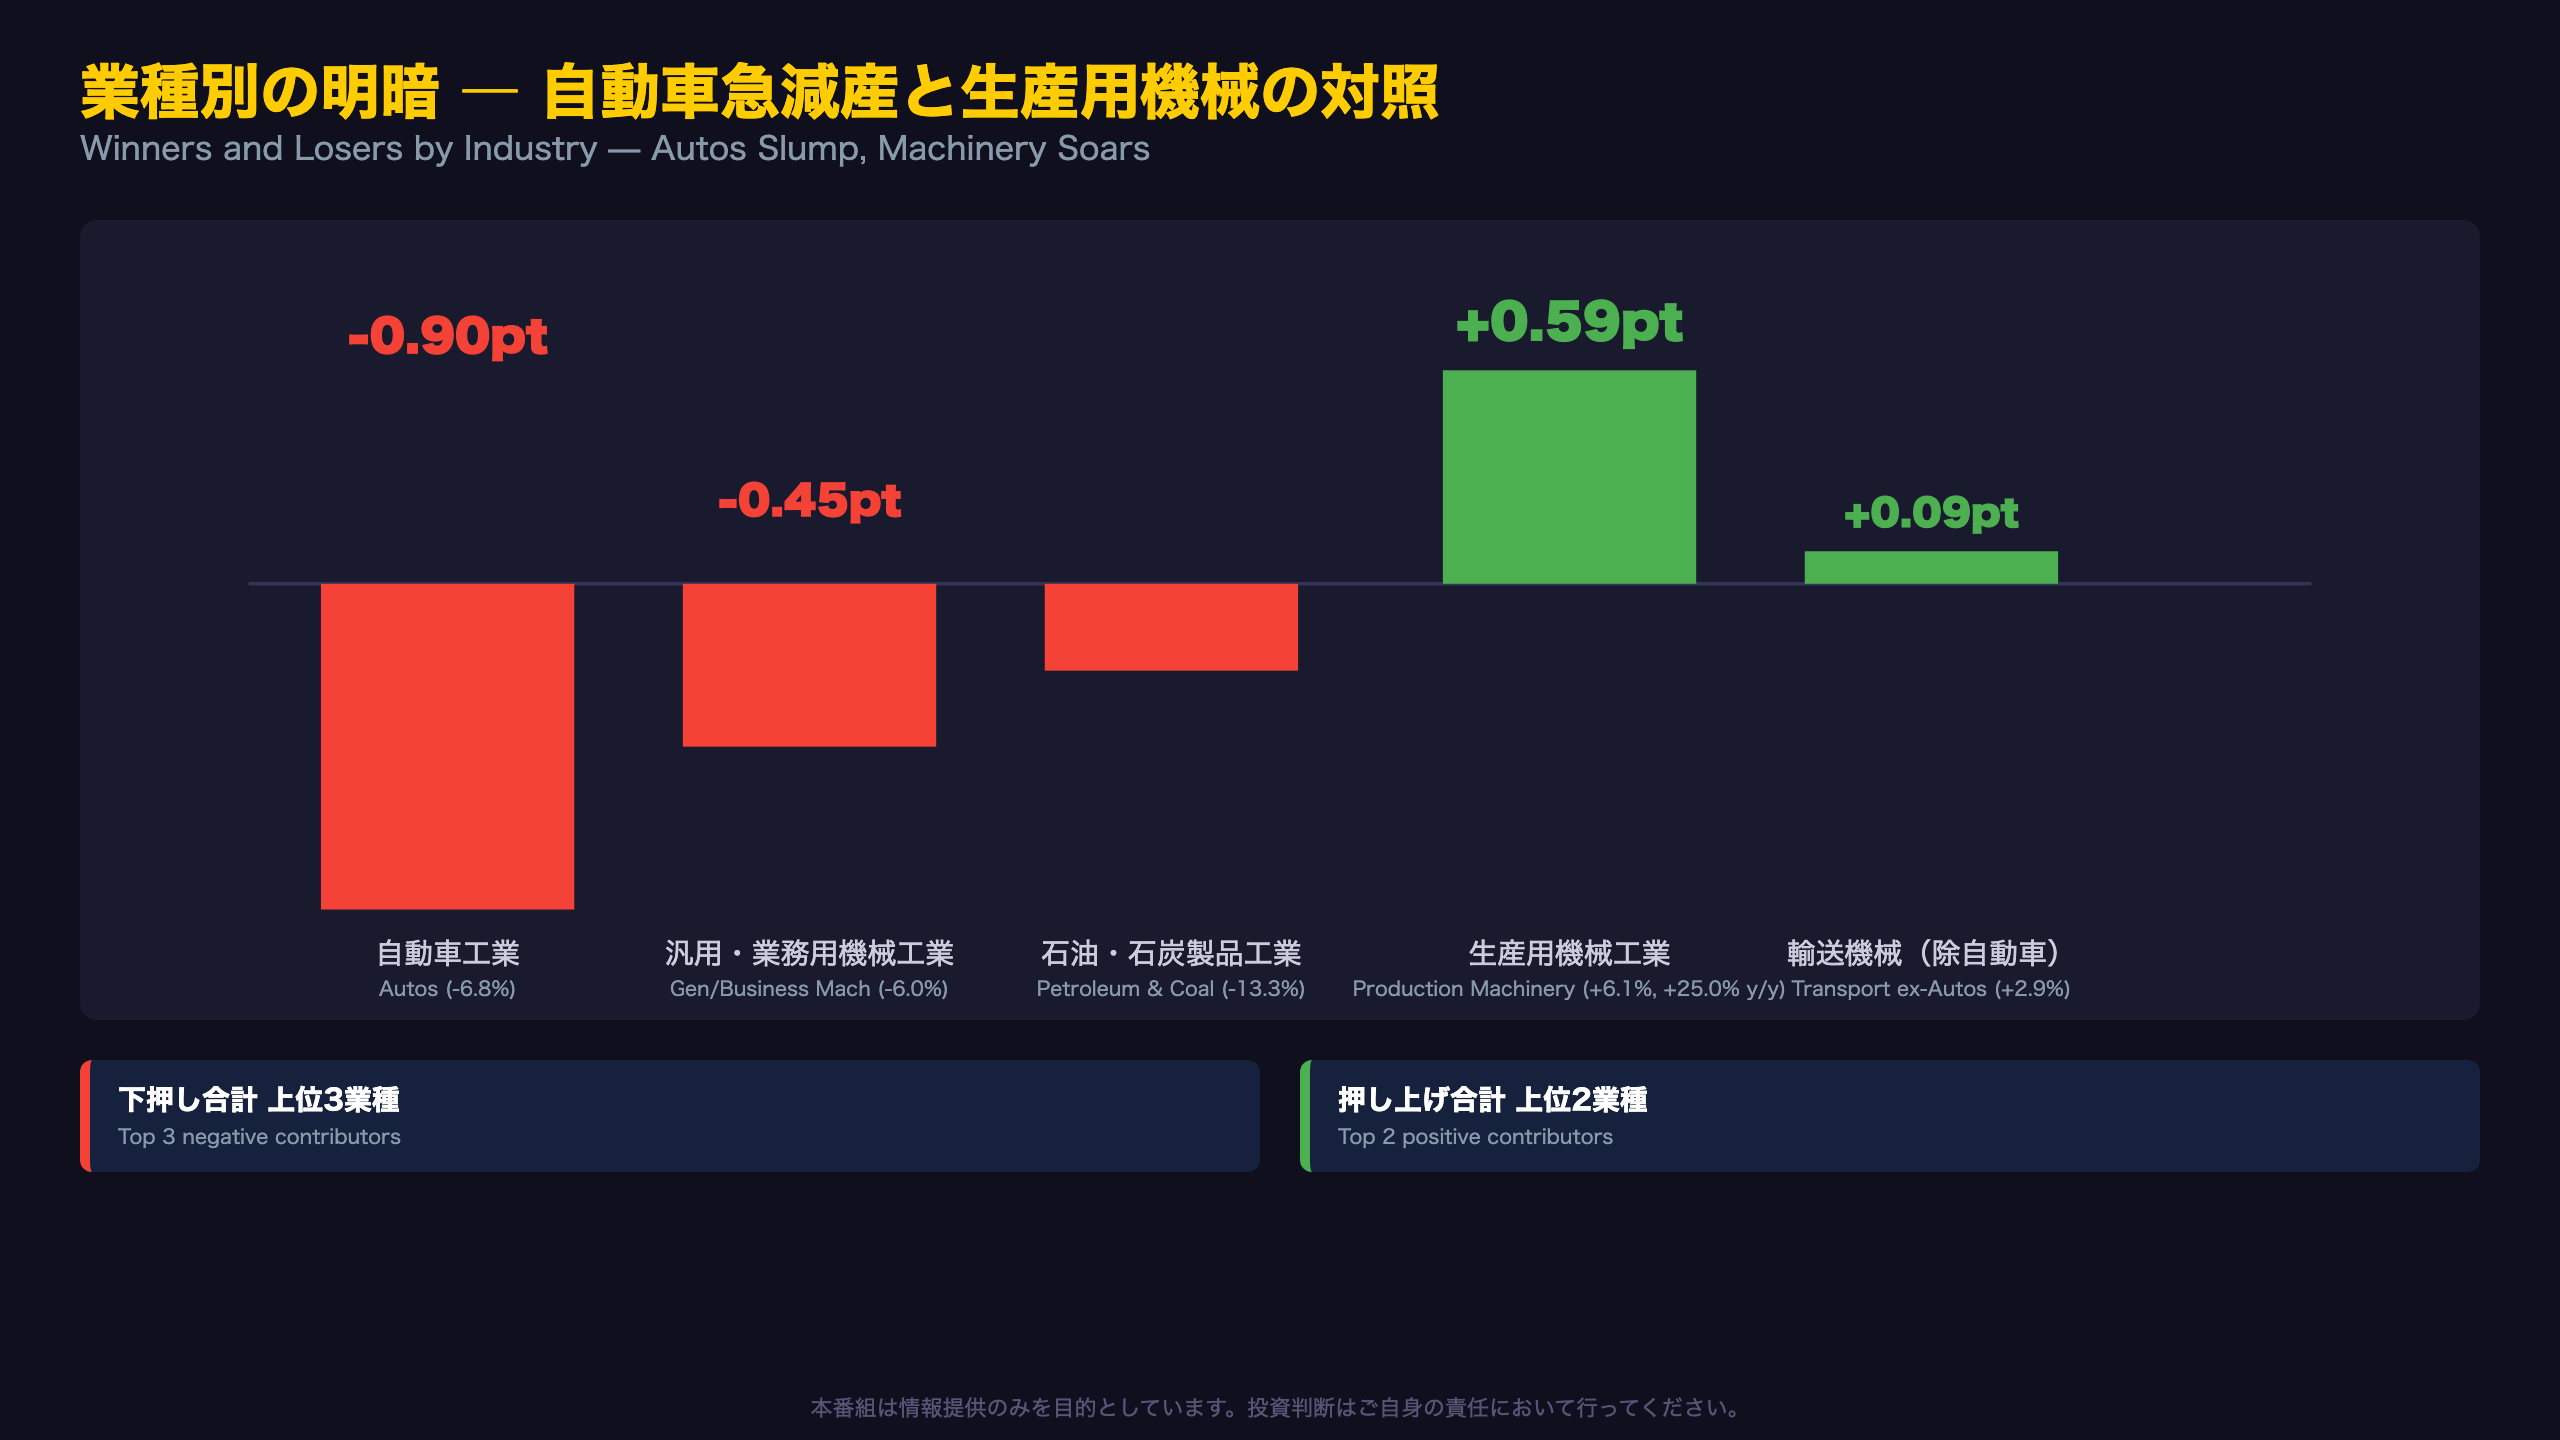
🚗 Automobiles plunged 6.8%, the single biggest drag on the headline number.
💡 Meanwhile, production machinery jumped 6.1% m/m and 25.0% y/y, driven by semiconductor-equipment demand.
⚠️ The inventory ratio rose for the first time in 2 months. September/October forecasts point to a big rebound, but the realization ratio came in at -8.8%, flagging a persistent upward bias in corporate forecasts.
We break down what this means for Japanese equities and the Bank of Japan.
The Ultimate Summary
Context: What is Japan’s Industrial Production Index?
Released monthly by Japan’s Ministry of Economy, Trade and Industry (METI), the Indices of Industrial Production (IIP) track output, shipments, and inventories across roughly 500 mining and manufacturing products, rebased to 2020=100. Unlike the U.S. Industrial Production Index from the Federal Reserve, Japan’s IIP places heavier weight on automobile and semiconductor-equipment output given the structure of Japan’s export-driven manufacturing base.
A widening realization-ratio gap
METI’s companion Production Forecast Survey polls manufacturers directly on planned output. This month’s survey revealed a -8.8% realization ratio — actual August output undershot what manufacturers themselves predicted just one month earlier by nearly nine percentage points, one of the larger misses in recent memory.
Sentiment cooling, but not alarming
The production sentiment diffusion index (DI) slipped to -5.6 in September from -4.4 in August, with pessimistic firms (29.8%) now outnumbering optimists (24.2%). METI notes that a DI trend reading below -5 has historically preceded recessions; September’s trend of -0.3 remains above that threshold.
Market read-through
For equity investors, the split between slumping autos and surging semiconductor-equipment output mirrors global tech capex cycles. For the Bank of Japan, an unchanged qualitative assessment suggests this data alone is unlikely to alter the policy reaction function.
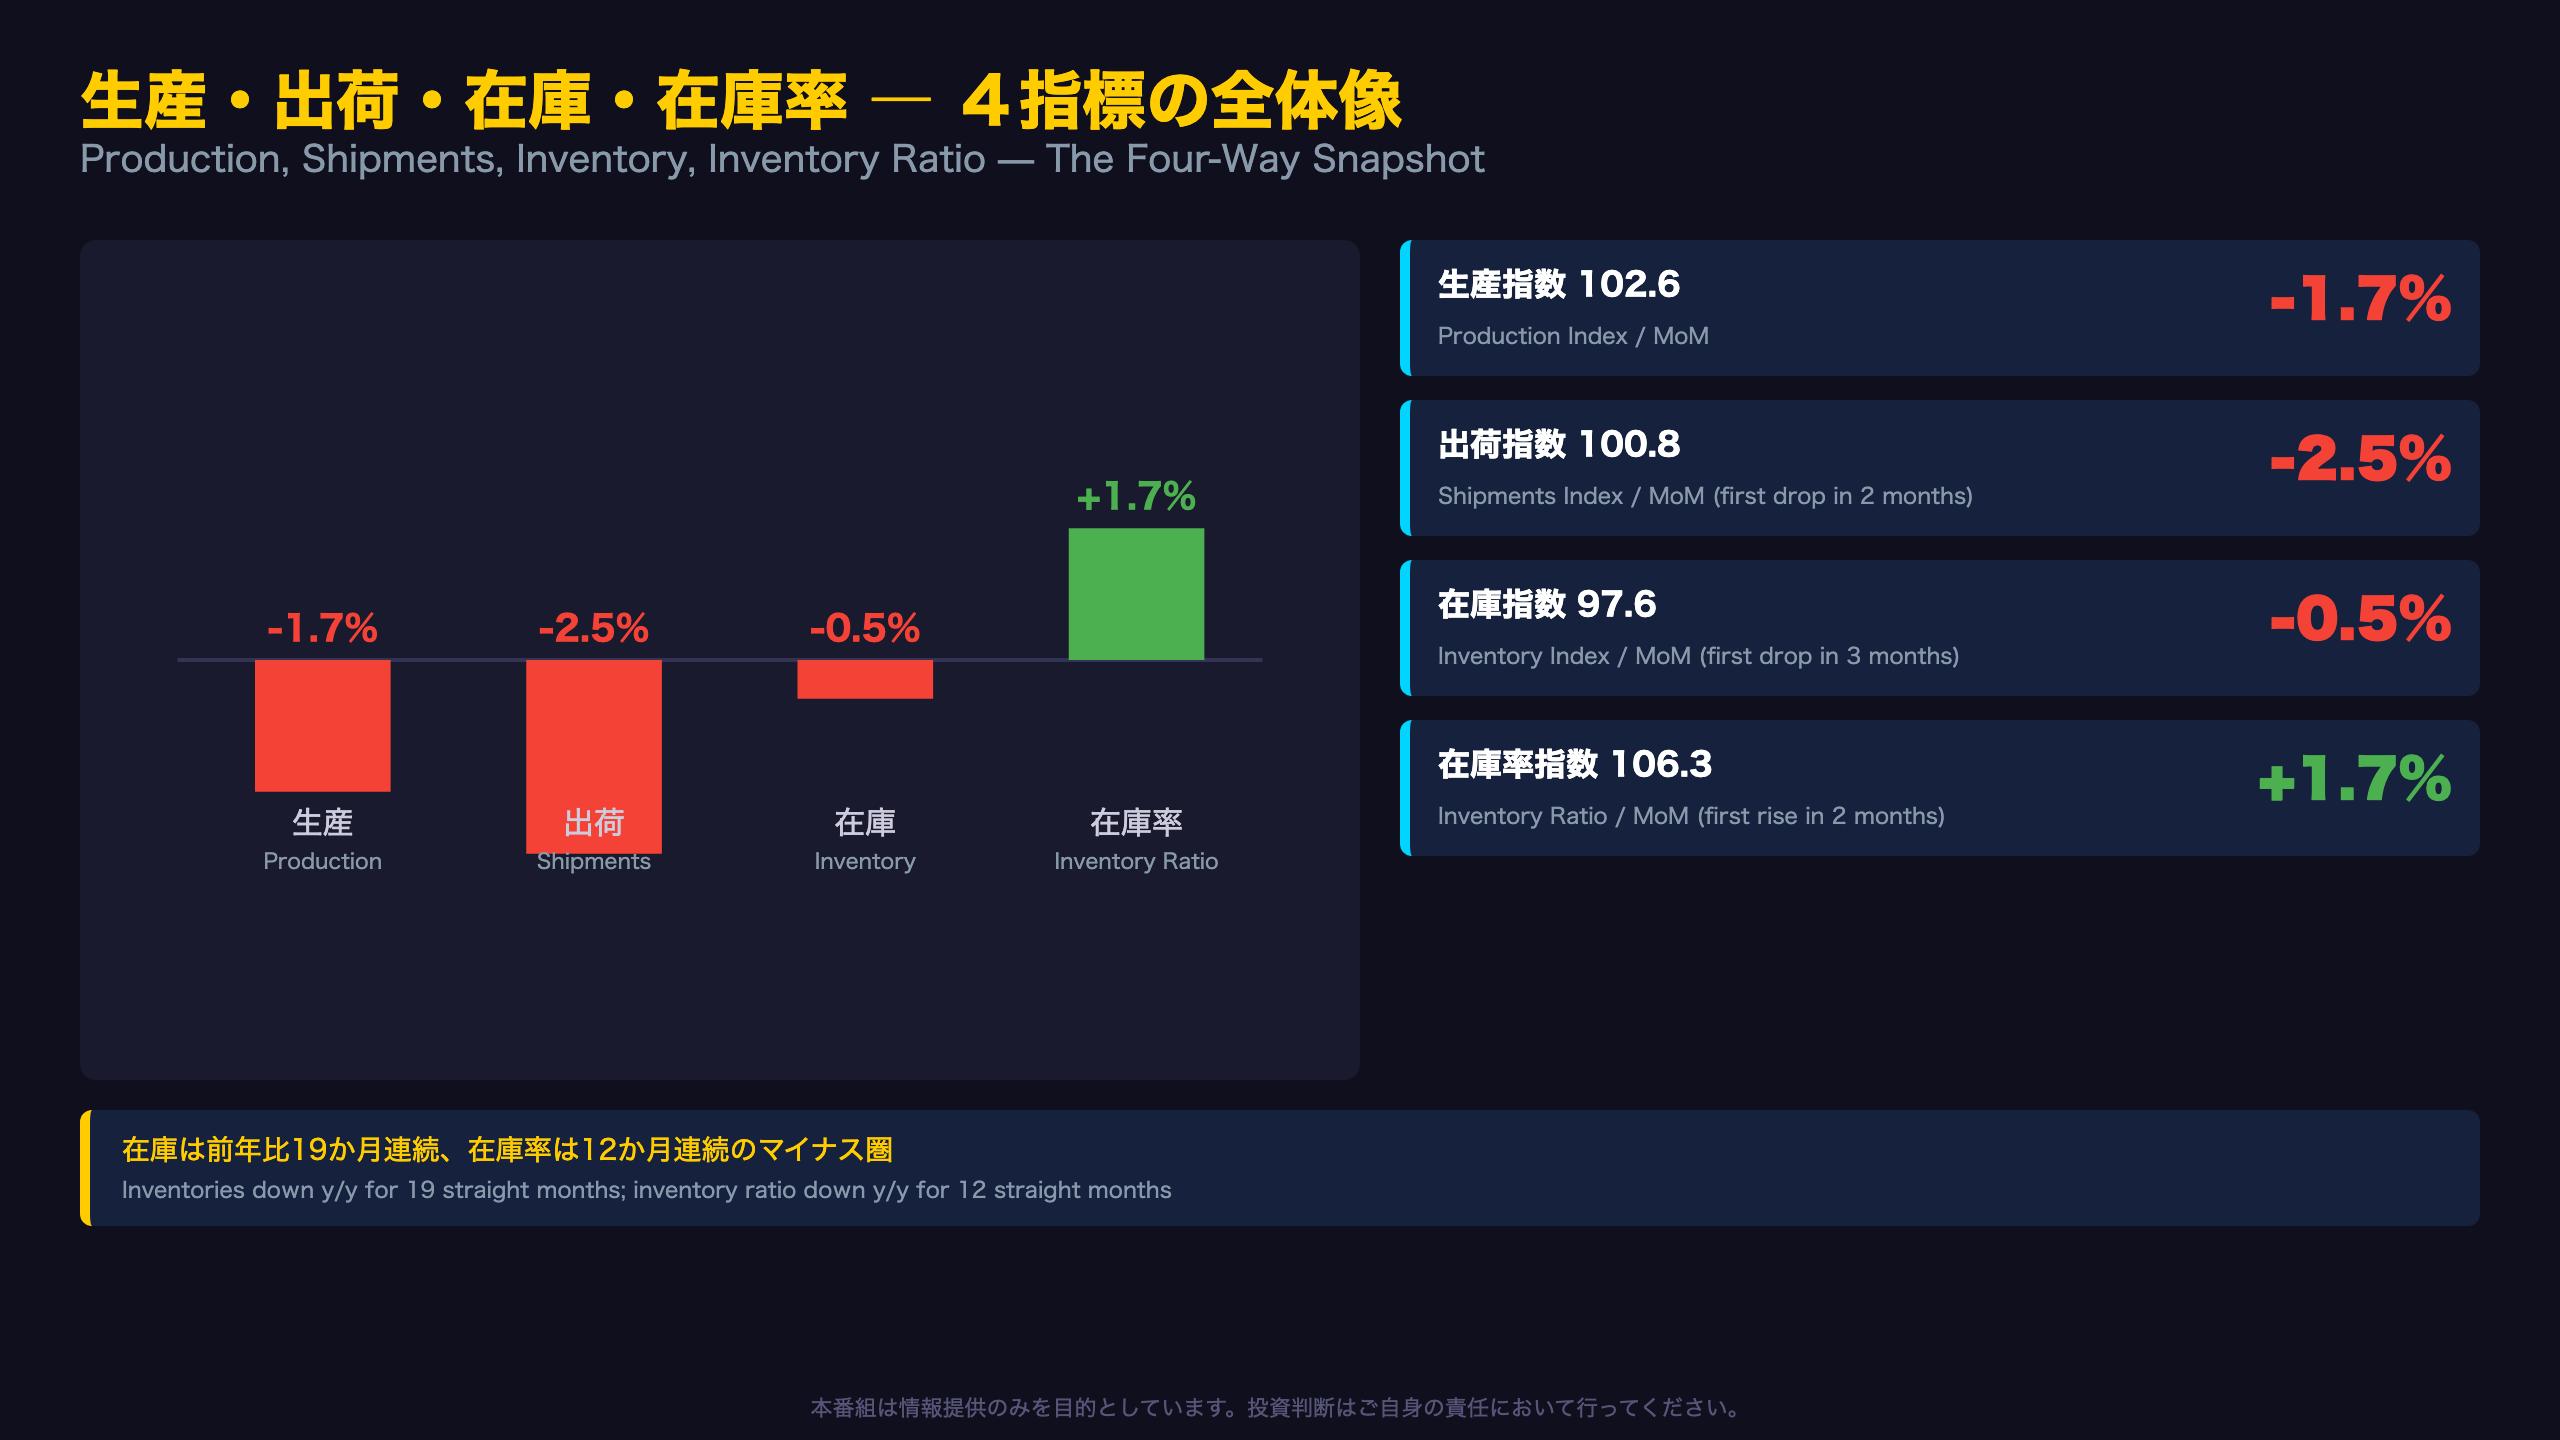
生産・出荷・在庫・在庫率 ― 4指標の全体像
Reading Japan’s Inventory Cycle Diagram
METI publishes a proprietary ‘inventory cycle chart’ plotting year-on-year production growth against year-on-year inventory growth, dividing the plane into four phases: active restocking, involuntary buildup, destocking, and drawdown-led recovery. As of Q2 2026, Japan sits near the boundary between ‘involuntary destocking’ and ‘inventory buildup’ — a classic late-cycle ambiguity zone.
Shipments falling faster than output
This month’s most notable technical detail: shipments (-2.5% m/m) fell more than output (-1.7% m/m). In standard inventory-cycle accounting, that combination should mechanically push inventories higher, yet reported inventories actually fell 0.5%. That gap implies active liquidation in specific sectors (petroleum, autos) offsetting passive buildup elsewhere.
Why this matters for investors
Nineteen straight months of year-on-year inventory declines is one of the longest stretches on record for Japan’s manufacturing sector. A sustained turn higher in the inventory ratio, if it continues into September, would be an early signal that Japan’s production cycle is entering a more cautious phase.
業種別の明暗 ― 自動車急減産と生産用機械の対照
Two-Speed Manufacturing: A Global Pattern Playing Out in Japan
The stark divergence between slumping auto output and surging production-machinery output mirrors a pattern seen across major manufacturing economies in 2026: traditional durable-goods manufacturing softening even as semiconductor- and AI-related capital equipment spending accelerates. Japan’s production machinery category captures makers of items like injection molds, industrial robots, and packaging machinery — many serving as upstream suppliers to global semiconductor fabs, conceptually similar to the ‘nondefense capital goods excluding aircraft’ category tracked in U.S. durable goods orders.
Forward-looking detail investors should watch
METI’s forecast survey shows transport equipment (which includes autos) is projected to rebound 4.6% in September and 2.7% in October—a sharp reversal from the prior survey’s -5.3% August forecast. If realized, this would support the interpretation that August’s auto weakness reflects a temporary production adjustment rather than a genuine demand collapse.
The caveat
Japan’s own forecast-survey realization ratio has recently understated actual weakness by 8.8 percentage points, meaning these optimistic revisions deserve a healthy dose of skepticism until confirmed by hard data in the October release.
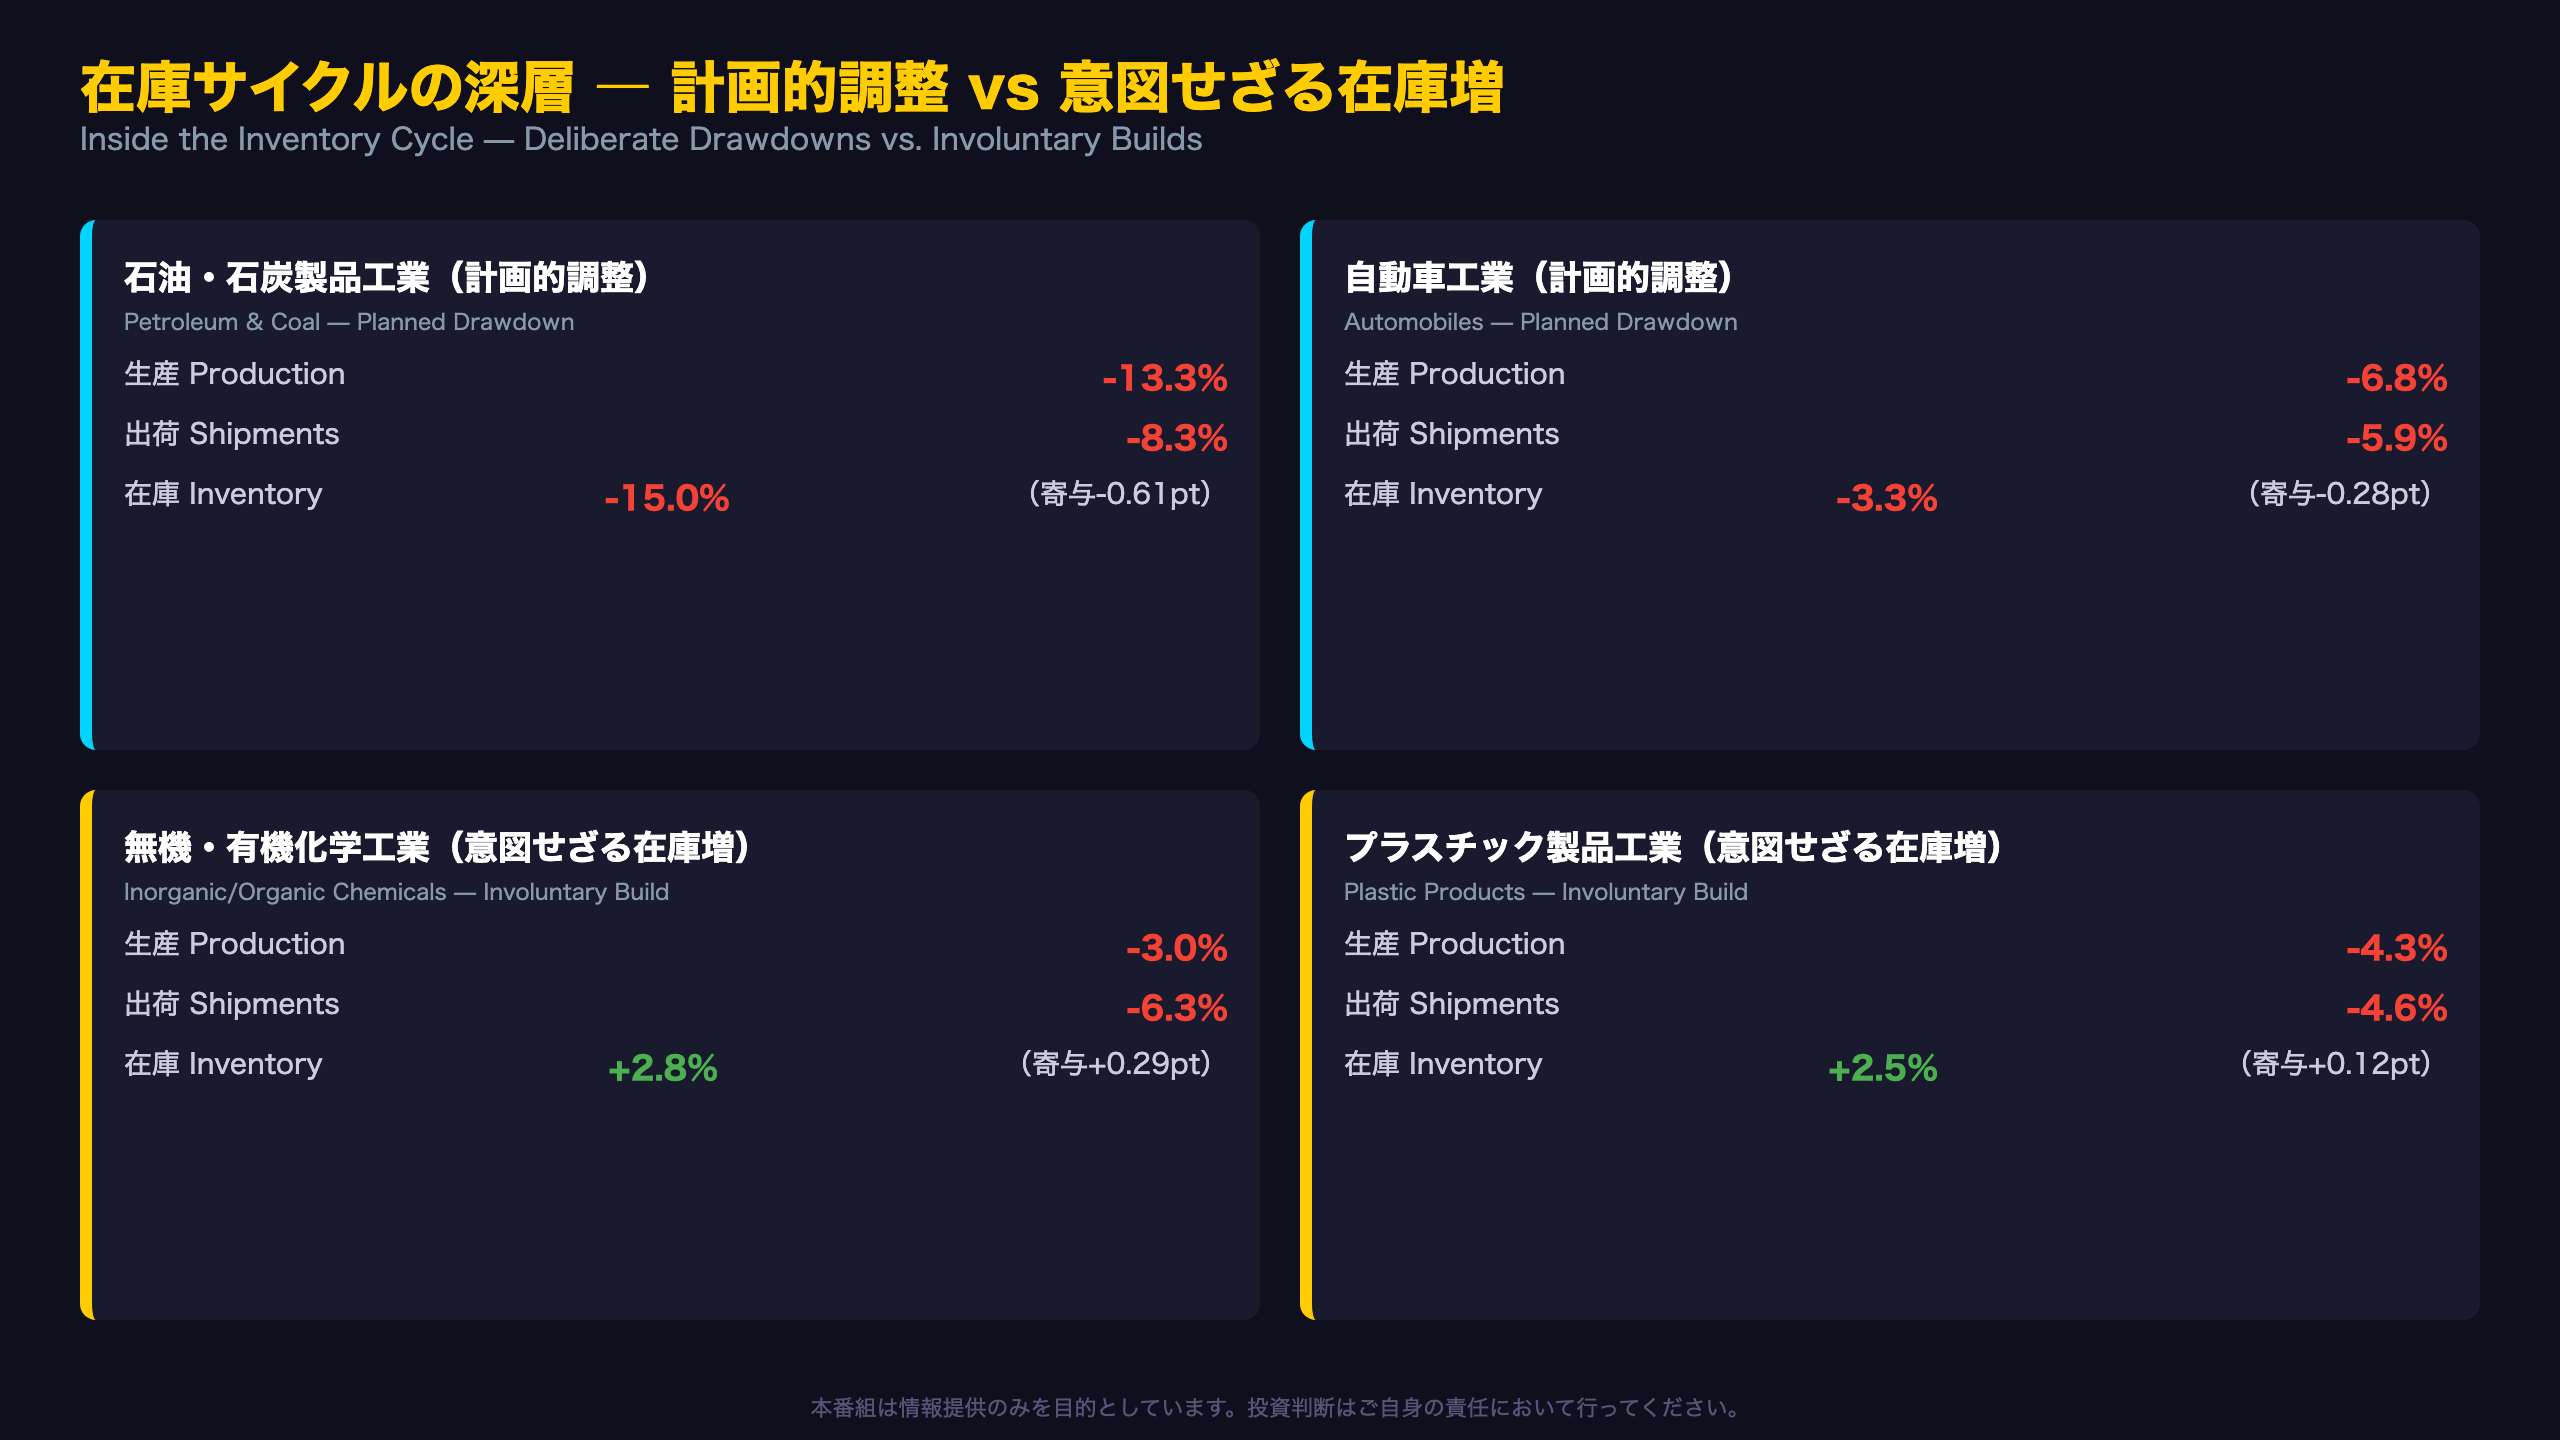
在庫サイクルの深層 ― 計画的調整 vs 意図せざる在庫増
Two Inventory Stories in One Month
This release illustrates why aggregate inventory figures can mask sharply different dynamics at the industry level. In petroleum products and automobiles, production fell faster than shipments — the classic signature of firms deliberately cutting output to work down stock ahead of softer near-term demand. Petroleum inventories fell 15.0% (gasoline -28.5%, kerosene -19.6%), while auto inventories fell 3.3% even as shipments held up relatively better than production.
The flip side: involuntary buildup
Inorganic/organic chemicals and plastic products show the opposite pattern: shipments fell faster than production, causing inventories to rise (+2.8% and +2.5% respectively) despite firms not intending to accumulate stock. In the standard four-quadrant inventory-cycle framework used by macro analysts globally, this pattern typically precedes production cuts in the following one to two months if end demand doesn’t recover.
Why the aggregate reading is ambiguous
Because these opposing forces occur simultaneously, the headline inventory ratio’s 1.7% rise this month doesn’t cleanly signal either ‘aggressive restocking’ or ‘demand collapse.’ METI’s own inventory-cycle chart placed Q2 2026 near the boundary between the ‘involuntary destocking’ and ‘inventory buildup’ quadrants — a rare instance of the data itself confirming an unusually indecisive phase of Japan’s industrial cycle.
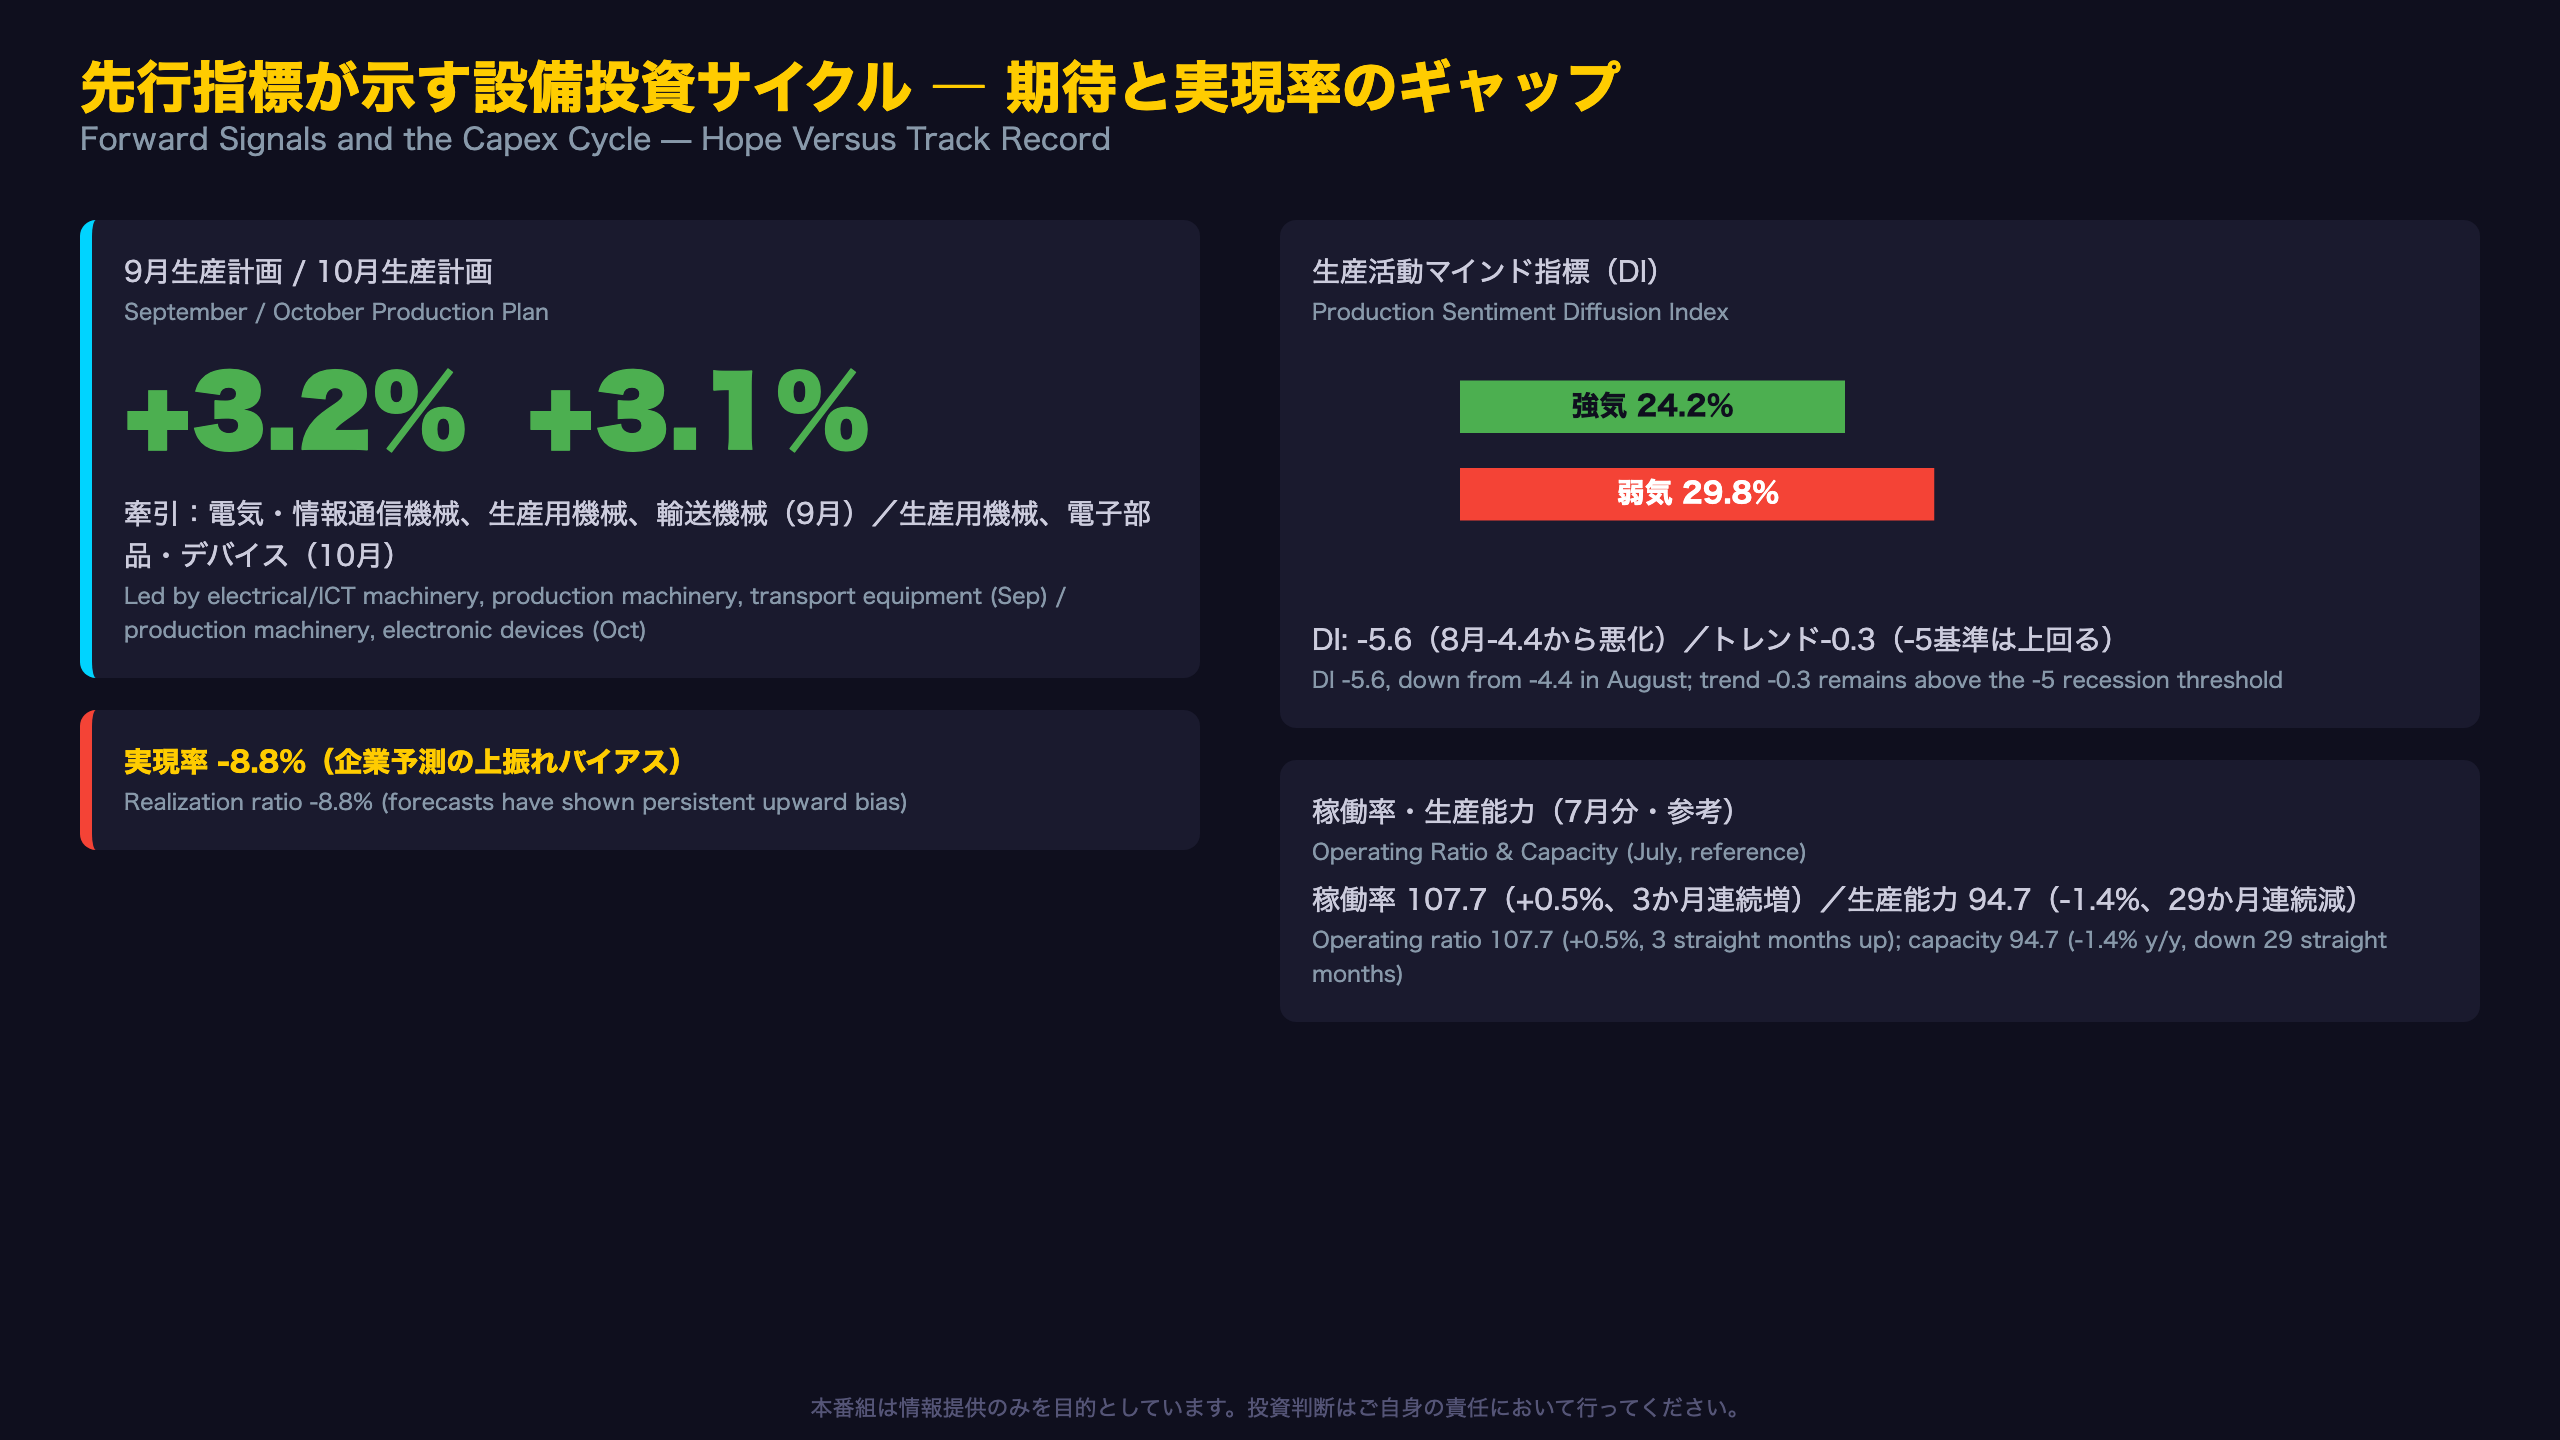
先行指標が示す設備投資サイクル ― 期待と実現率のギャップ
Decoding Japan’s Unique ‘Realization Ratio’ Metric
Unlike the U.S. ISM PMI or regional Fed surveys, METI’s Production Forecast Survey asks roughly 186 manufacturers directly for next-month and month-after output plans, then tracks how accurate those plans turn out via a ‘realization ratio.’ A negative reading means actual output undershot the plan; this month’s -8.8% realization ratio for August is a notably large miss versus recent prints (-3.2% in July, -1.4% in June), suggesting Japanese manufacturers have been persistently too optimistic about their own near-term output.
Sentiment diffusion index (DI) — a homegrown recession gauge
METI’s DI, built from the share of firms revising plans up versus down, fell to -5.6 in September from -4.4 in August, with pessimists (29.8%) now outnumbering optimists (24.2%). METI itself flags a DI trend reading below -5 as historically associated with recession risk; September’s trend of -0.3 remains above that line, offering some reassurance.
Capacity context from the most recent (July) data
July’s operating-ratio index rose to 107.7 (+0.5% m/m, a third straight monthly gain), even as the production-capacity index stayed flat at 94.7, down 1.4% year-on-year for a 29th consecutive month — meaning Japan’s manufacturing base has been structurally shrinking even as utilization of what remains ticks higher, a dynamic worth monitoring if the forecast semiconductor-equipment rebound materializes.
Disclaimer: This article is for informational purposes only. All investment decisions are made solely at your own risk.