📺 Watch the Full Video Analysis
This article was automatically generated by the NFC Market Live AI analysis system. (Updated: 2026-09-29 23:10 JST)
📄 Primary Source
U.S. Bureau of Labor Statistics
https://www.bls.gov/news.release/pdf/jolts.pdf
📊 A deep dive into the U.S. Bureau of Labor Statistics’ August JOLTS report.
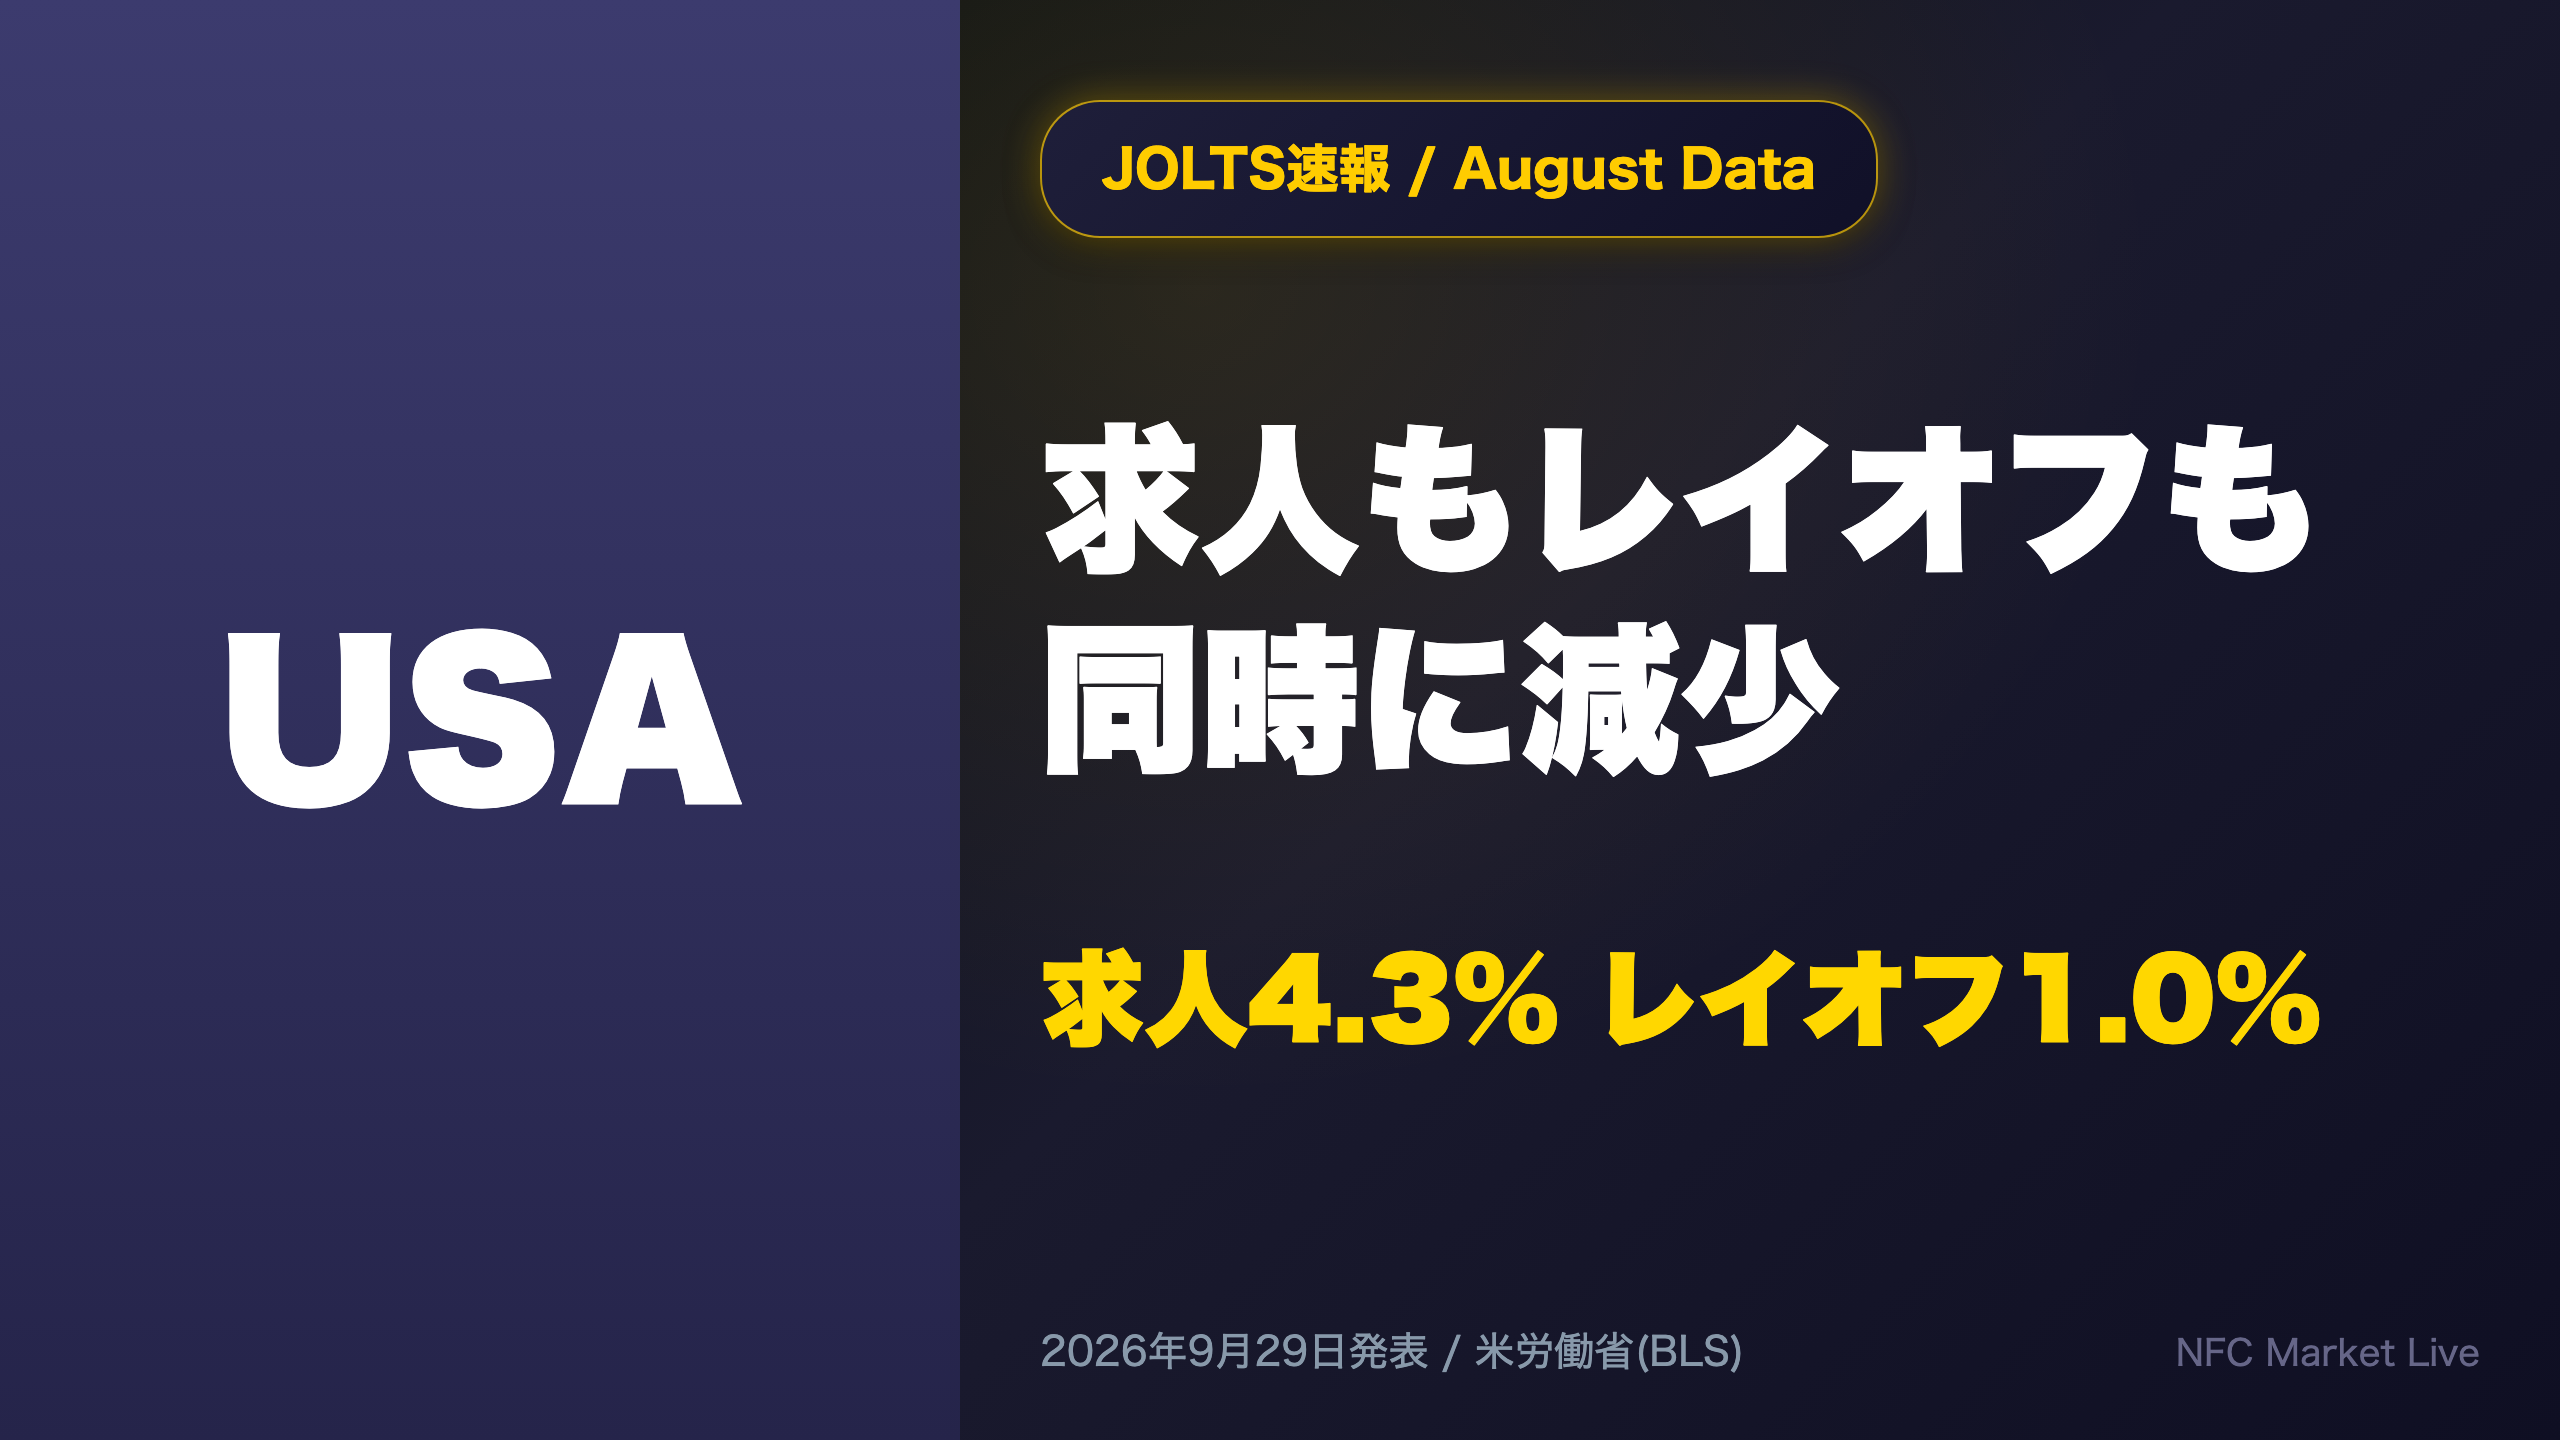
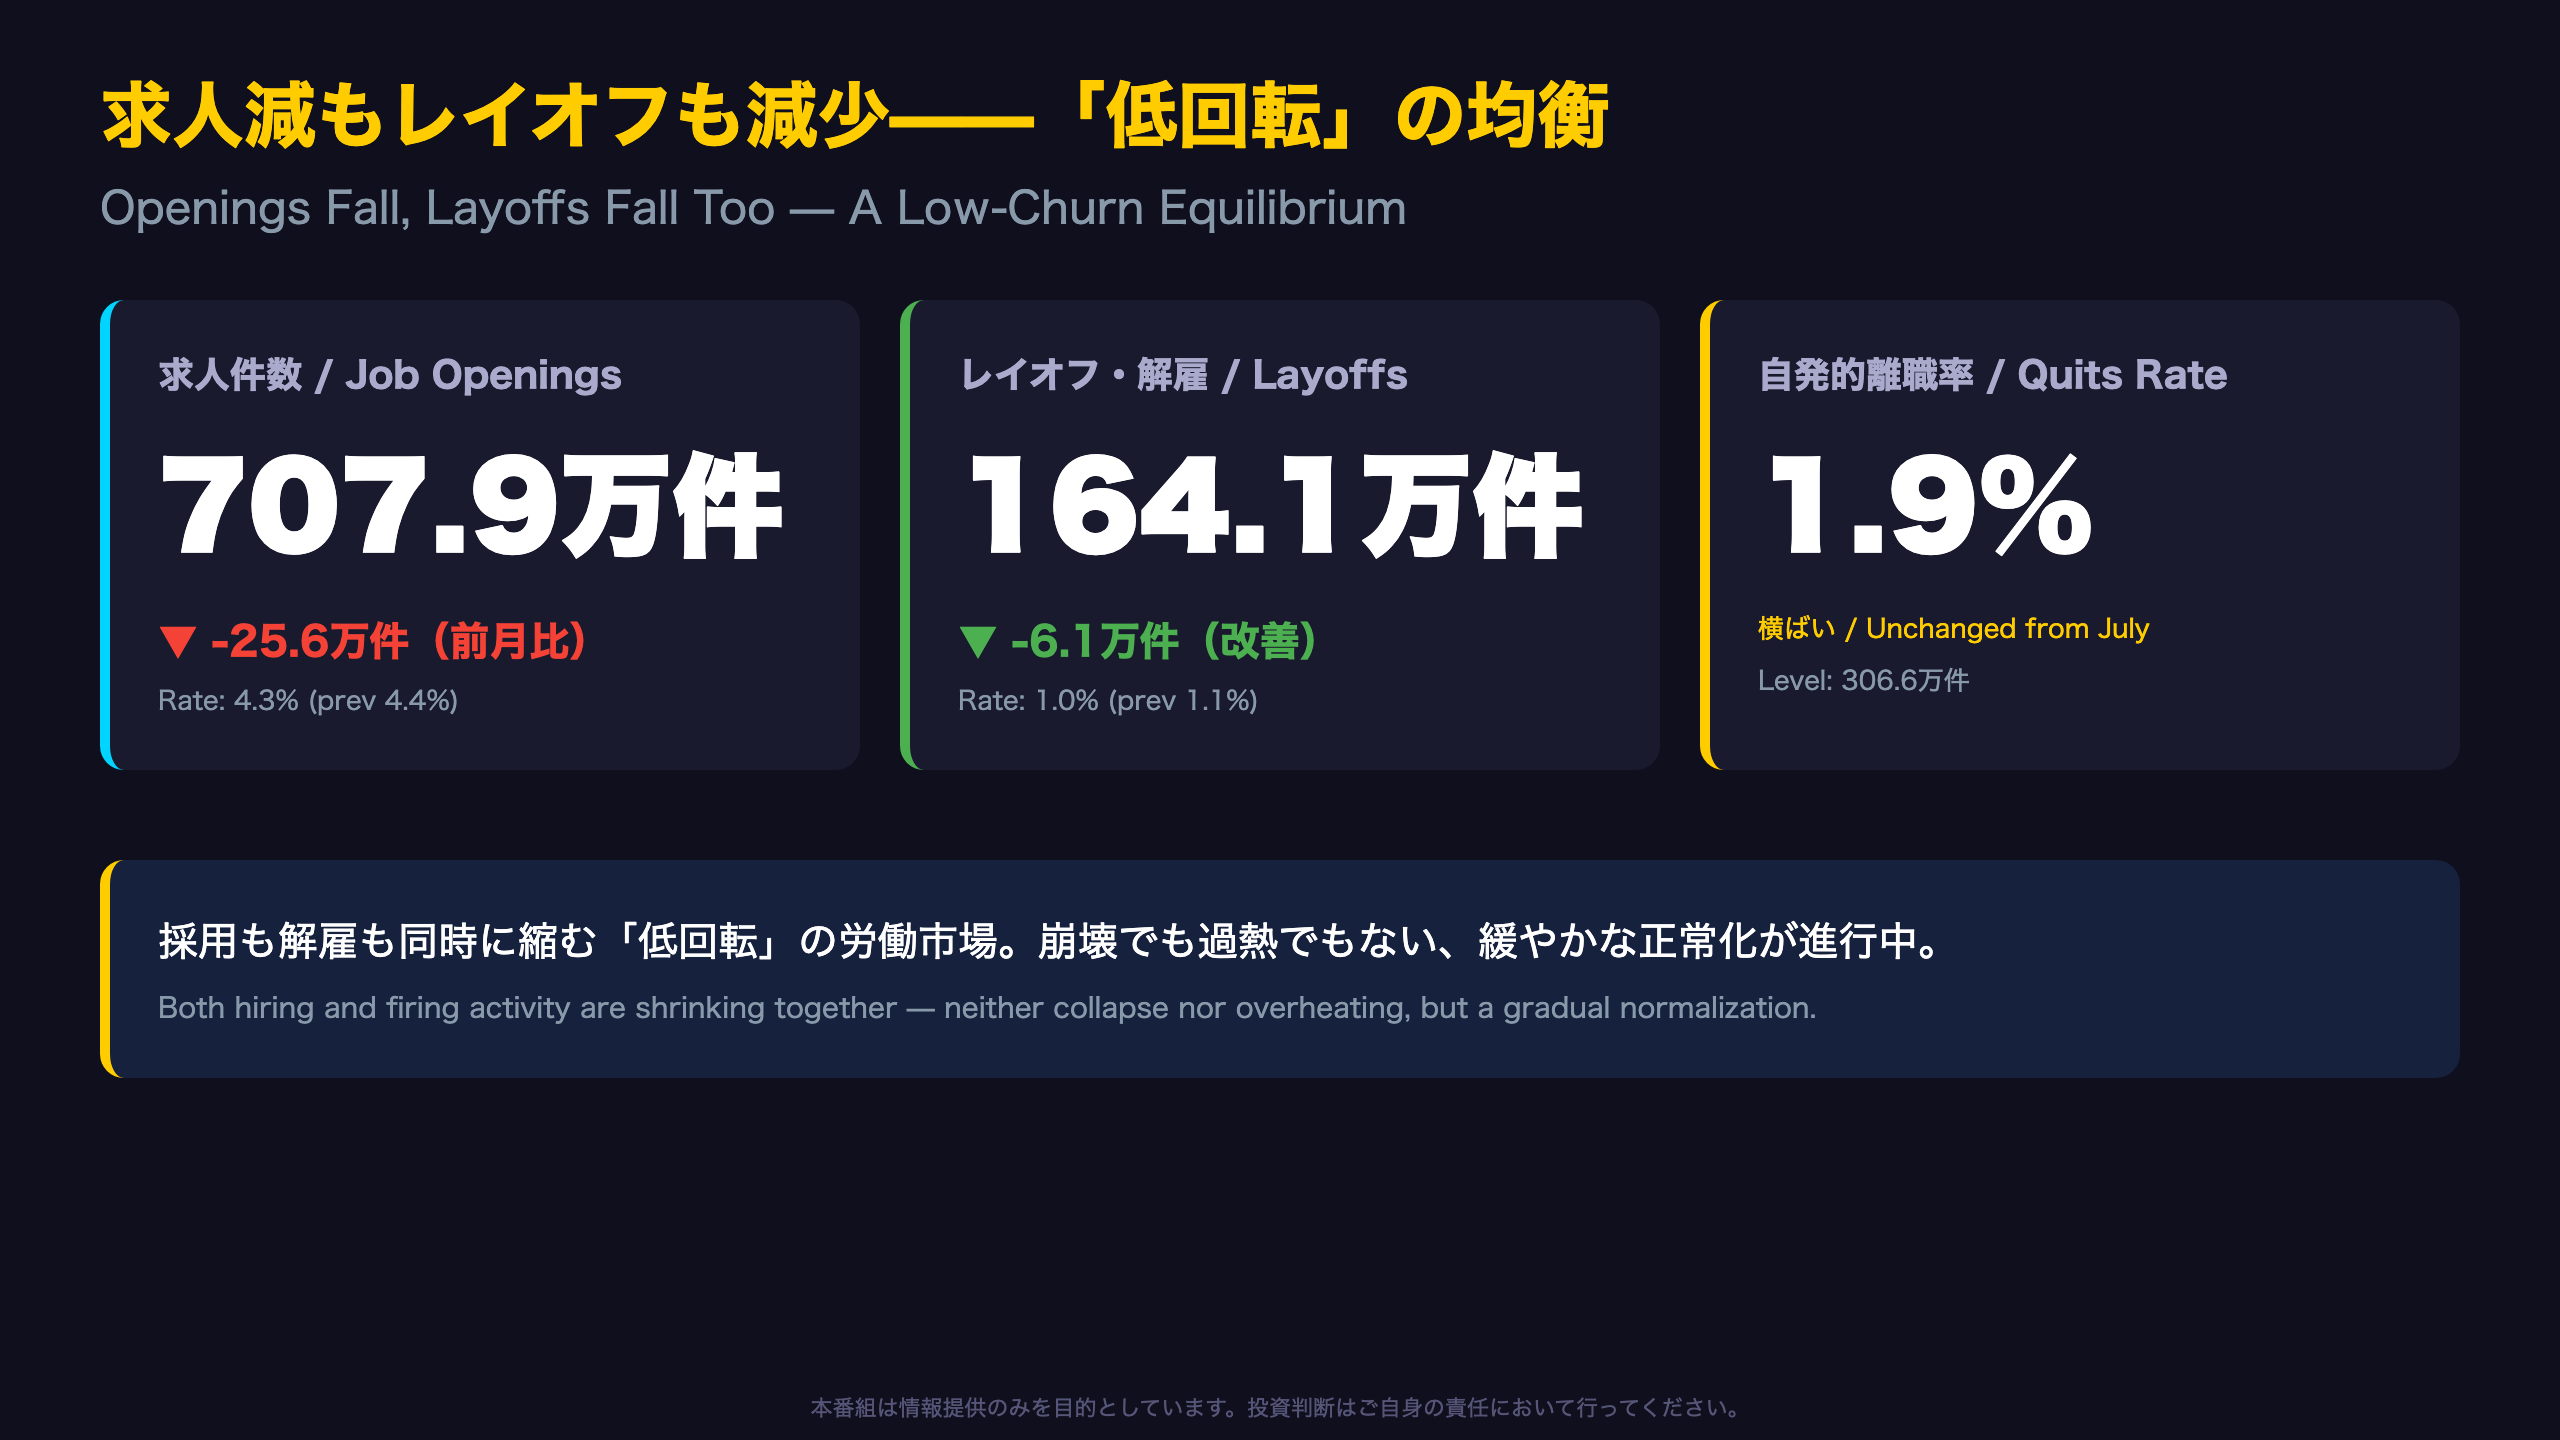
Job openings fell to 7.079 million (down from a revised 7.335 million), but layoffs also eased to 1.641 million, while the quits rate held steady at 1.9%.
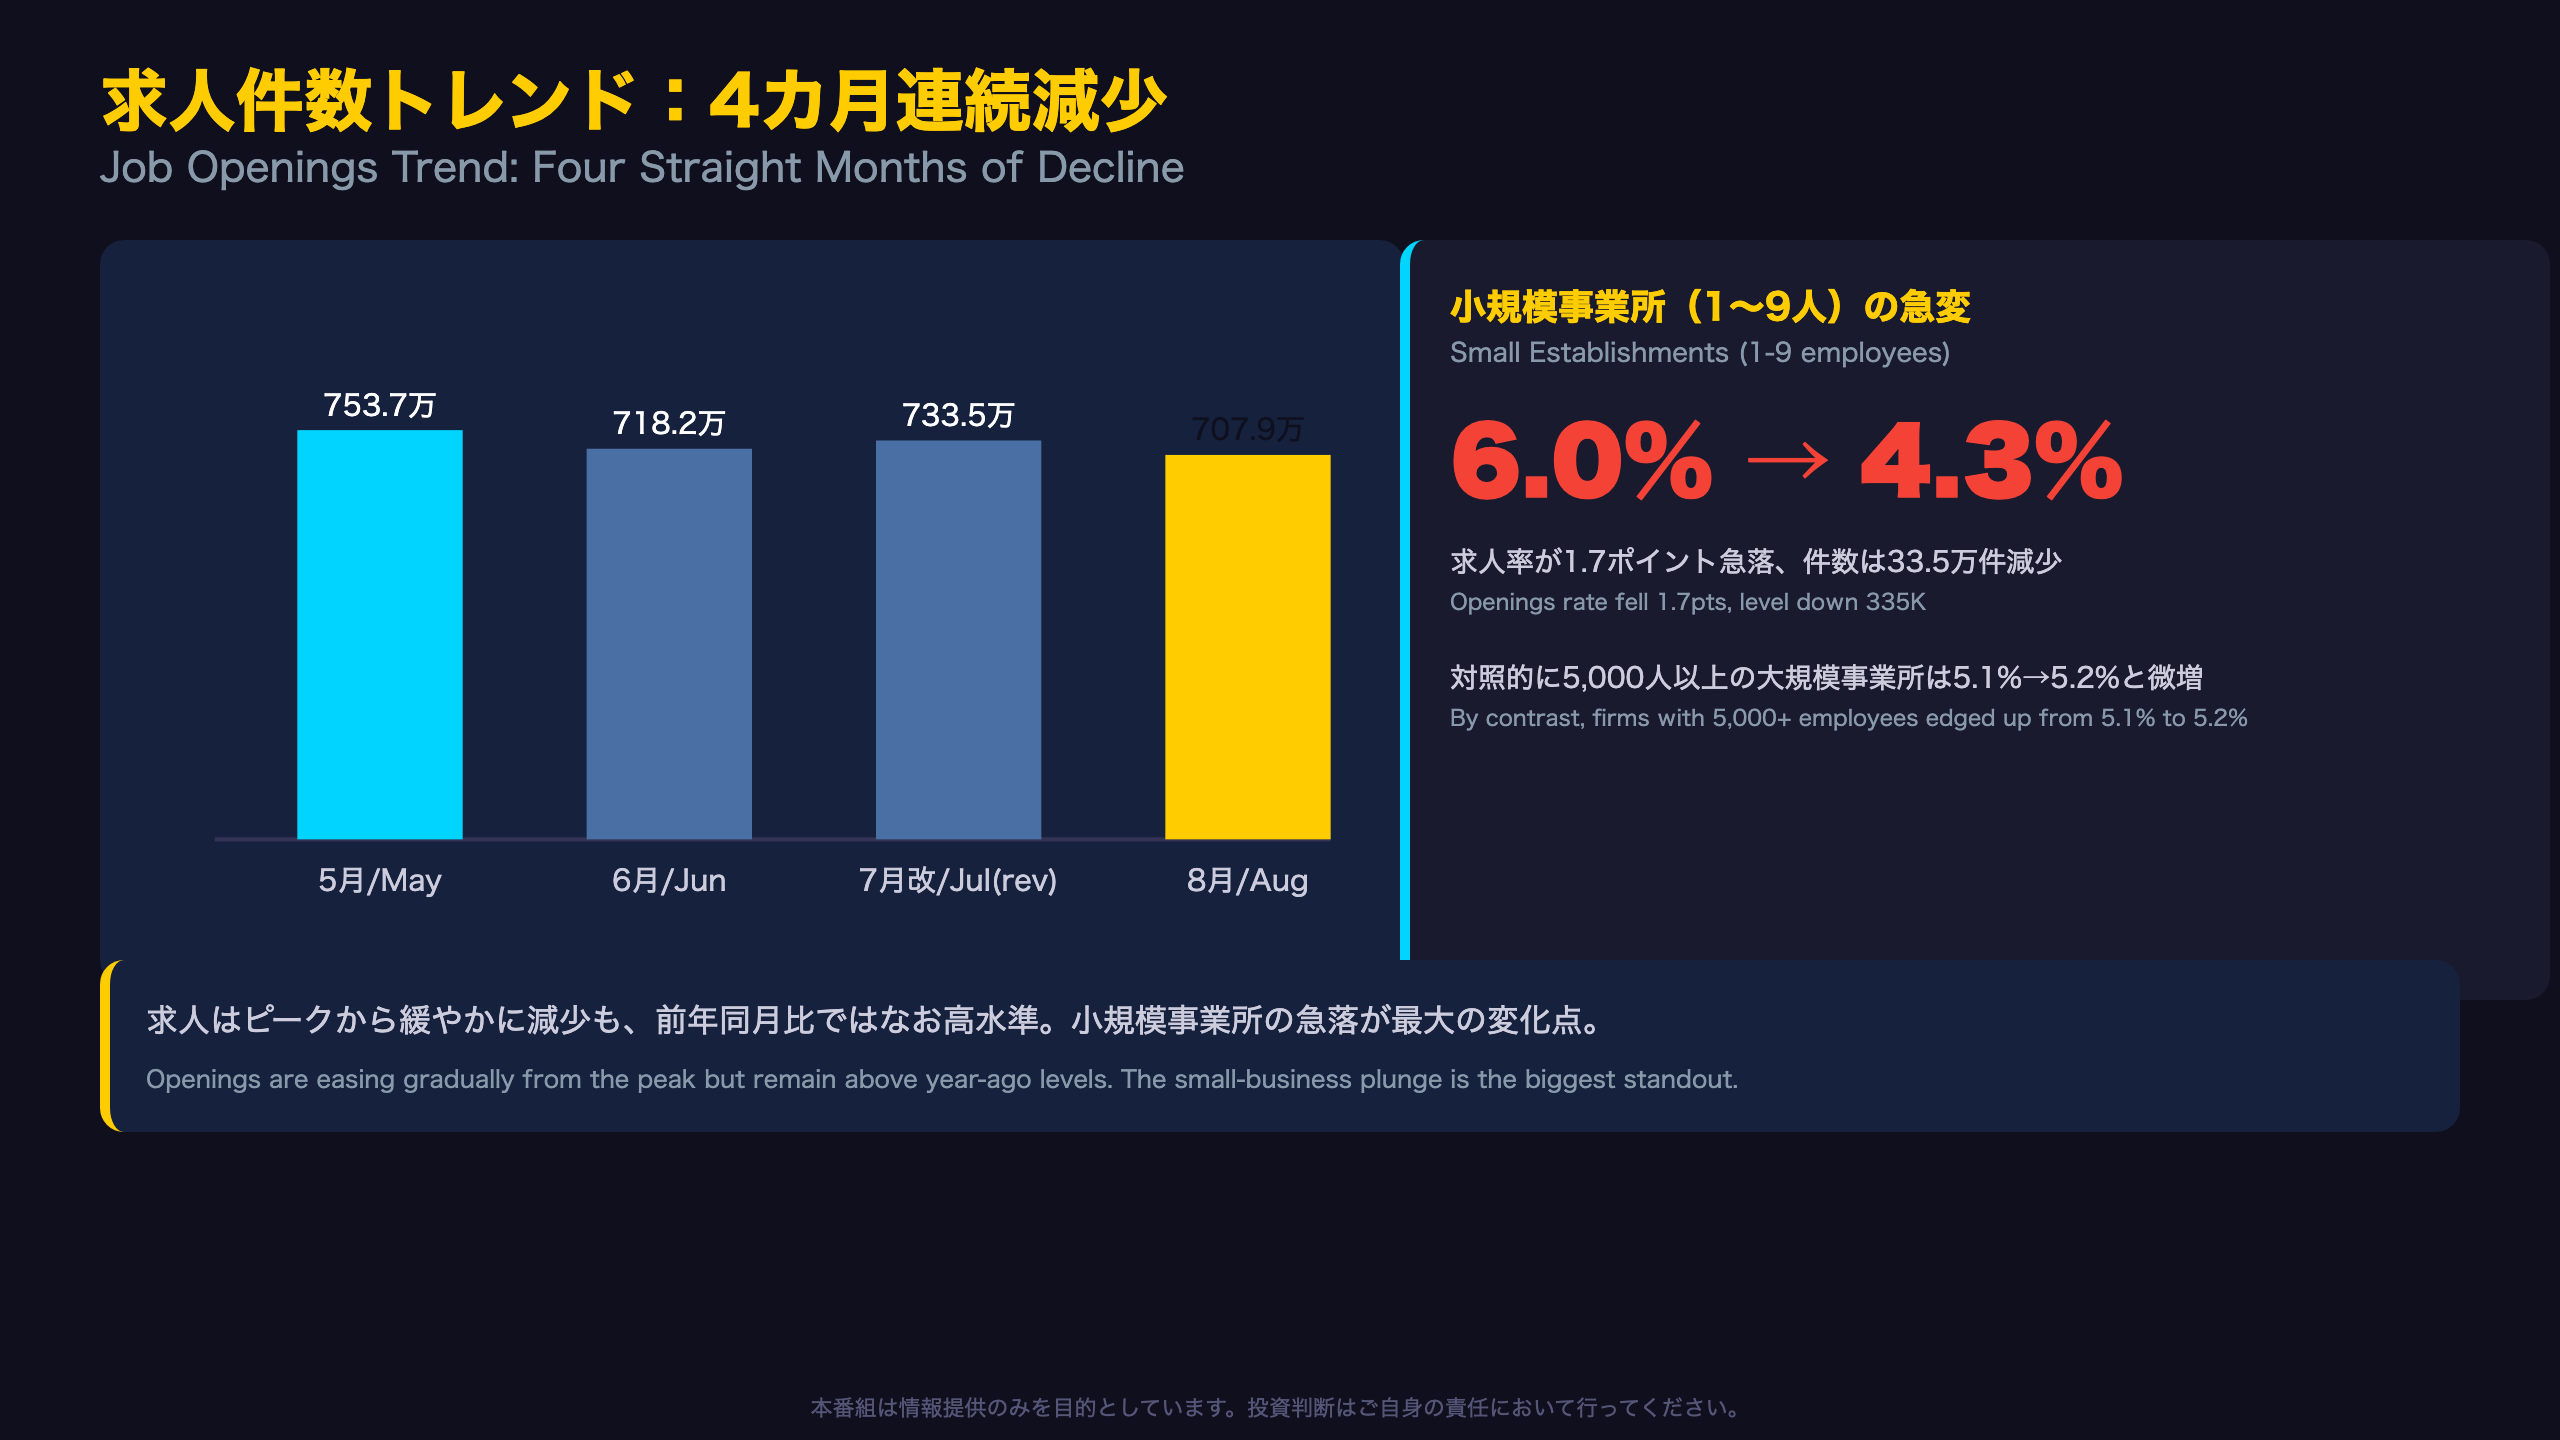
⚠️ The standout: small businesses (1-9 employees) saw their openings rate plunge from 6.0% to 4.3%, hinting at a shift in small-firm hiring sentiment.
💡 The labor market isn’t collapsing or overheating — it’s normalizing quietly. Next release (September data): November 3, 2026. We break down what it means for the Fed’s rate path.
求人減もレイオフも減少——「低回転」の均衡
What JOLTS Tells the Fed
The Job Openings and Labor Turnover Survey (JOLTS), published monthly by the U.S. Bureau of Labor Statistics, is one of the Federal Reserve’s preferred gauges of labor market slack. Fed Chair Jerome Powell has repeatedly cited the ratio of job openings to unemployed workers (the V/U ratio) as a key input into the “Beveridge Curve” framework for assessing whether the labor market is loosening gently or deteriorating sharply.
Notably, this release does not include unemployment-level data, so the V/U ratio cannot be directly calculated from the source document.
Context Matters More Than the Headline Drop
August’s openings rate of 4.3% is actually slightly above the 4.2% recorded a year earlier, a reminder that year-over-year comparisons can tell a different story than the month-over-month decline from May’s 4.5% peak.
For U.S. rate markets, a gradual four-month decline in openings, rather than a sudden cliff, supports the Fed’s preferred narrative of labor-market normalization without recession. Compare this to the 2022 tightening cycle, when openings fell from over 12 million toward 9 million within roughly 18 months; the current pace looks far more moderate.
The next release, covering September data, arrives November 3, 2026. Watch whether the openings rate breaches below 4.0%, which would mark a more decisive break from the current gradual trend.
求人トレンドの内訳——小規模事業所の急変
Industry Divergence Beneath the Headline Decline
While the aggregate job openings rate slipped to 4.3%, the industry breakdown reveals a genuinely mixed picture. Finance and insurance openings rose from a 4.4% rate to 5.0% (up to 353,000 positions), while real estate and rental leasing openings collapsed from 95,000 to just 50,000, a rate drop from 3.7% to 2.0%. Real estate is a small subsector, so single-month swings there carry wider statistical noise.
How Far From the 2022 Peak?
JOLTS openings peaked near 12 million in March 2022, the tightest labor market on record for this series. At 7.079 million, August’s reading is down more than 40% from that peak, a reminder of how extraordinary the pandemic-era hiring boom was, and how much of the current “cooling” is really normalization rather than fresh deterioration.
A Size-Based Reading of the Small-Business Slump
The sharp drop in openings among establishments with 1-9 employees (from a 6.0% rate to 4.3%) doesn’t necessarily signal collapsing demand. Larger employers (5,000+) actually saw their openings rate edge up from 5.1% to 5.2%, suggesting demand may be shifting toward bigger firms rather than disappearing altogether. For rate markets, this composition matters: a broad small-business pullback would be more concerning for future payrolls than a shift in concentration. The September report lands November 3, 2026.
離職率1.9%が語る労働者マインド
The Quits Rate as a Confidence Barometer
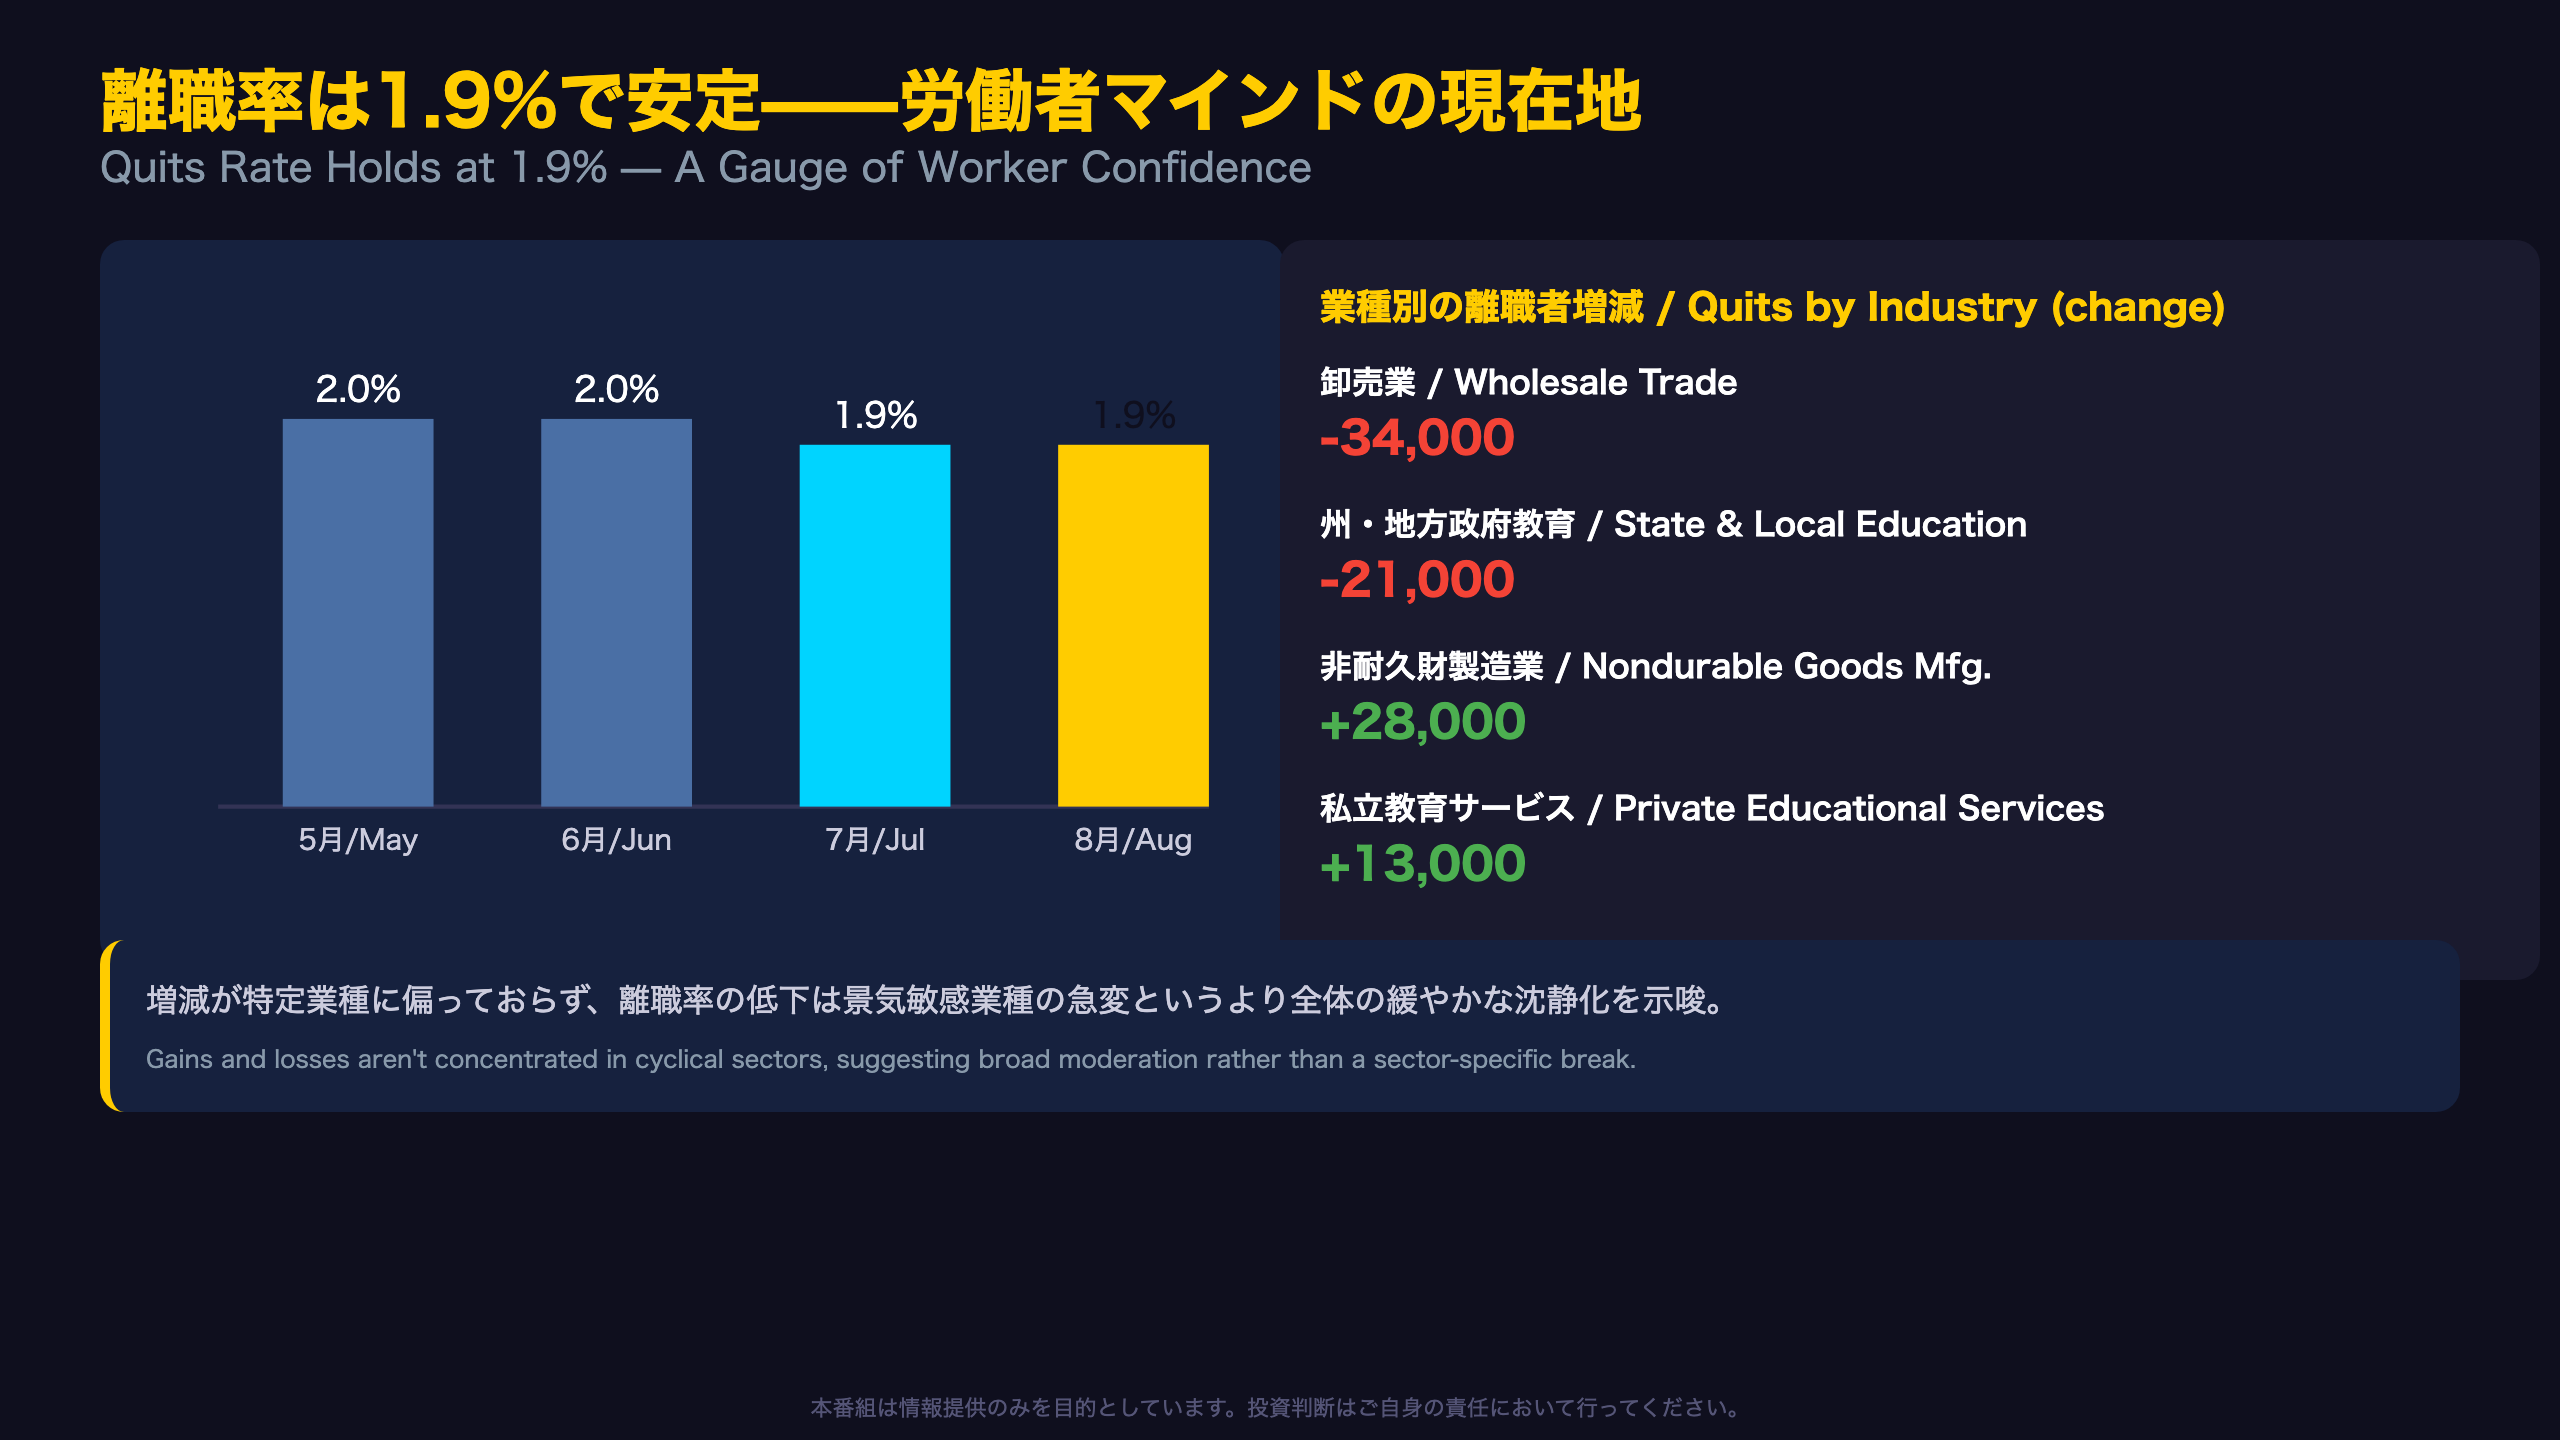
During the 2021-2022 “Great Resignation,” the U.S. quits rate ran near 3%, as workers confidently jumped between jobs amid acute labor shortages. Today’s 1.9% reading sits more than a full percentage point below that peak, marking a structurally different labor market.
The BLS defines the quits rate as a measure of workers’ willingness or ability to leave jobs voluntarily.
An Industry Tug-of-War, Not a One-Way Trend
Quits declined by 34,000 in wholesale trade and 21,000 in state and local government education, while rising by 28,000 in nondurable goods manufacturing and 13,000 in private educational services. Gains and losses aren’t concentrated in obviously cyclical sectors, suggesting a broad, gradual moderation rather than a sector-specific breakdown (Level B inference).
Two Ways to Read a Low Quits Rate
Bears argue a persistently low quits rate reflects workers’ anxiety about job security. Bulls counter that a lower quits rate eases wage-inflation pressure, a welcome development for the Fed as it weighs further rate cuts. Both readings are consistent with the data; the source report doesn’t resolve which dominates. The JOLTS quits rate remains one of the cleanest global proxies for labor market tightness, with no direct equivalent published at this granularity in the Eurozone. The next report, covering September, is due November 3, 2026.
レイオフ率1.0%へ低下——業種間の明暗
A Layoffs Rate Near Historic Lows
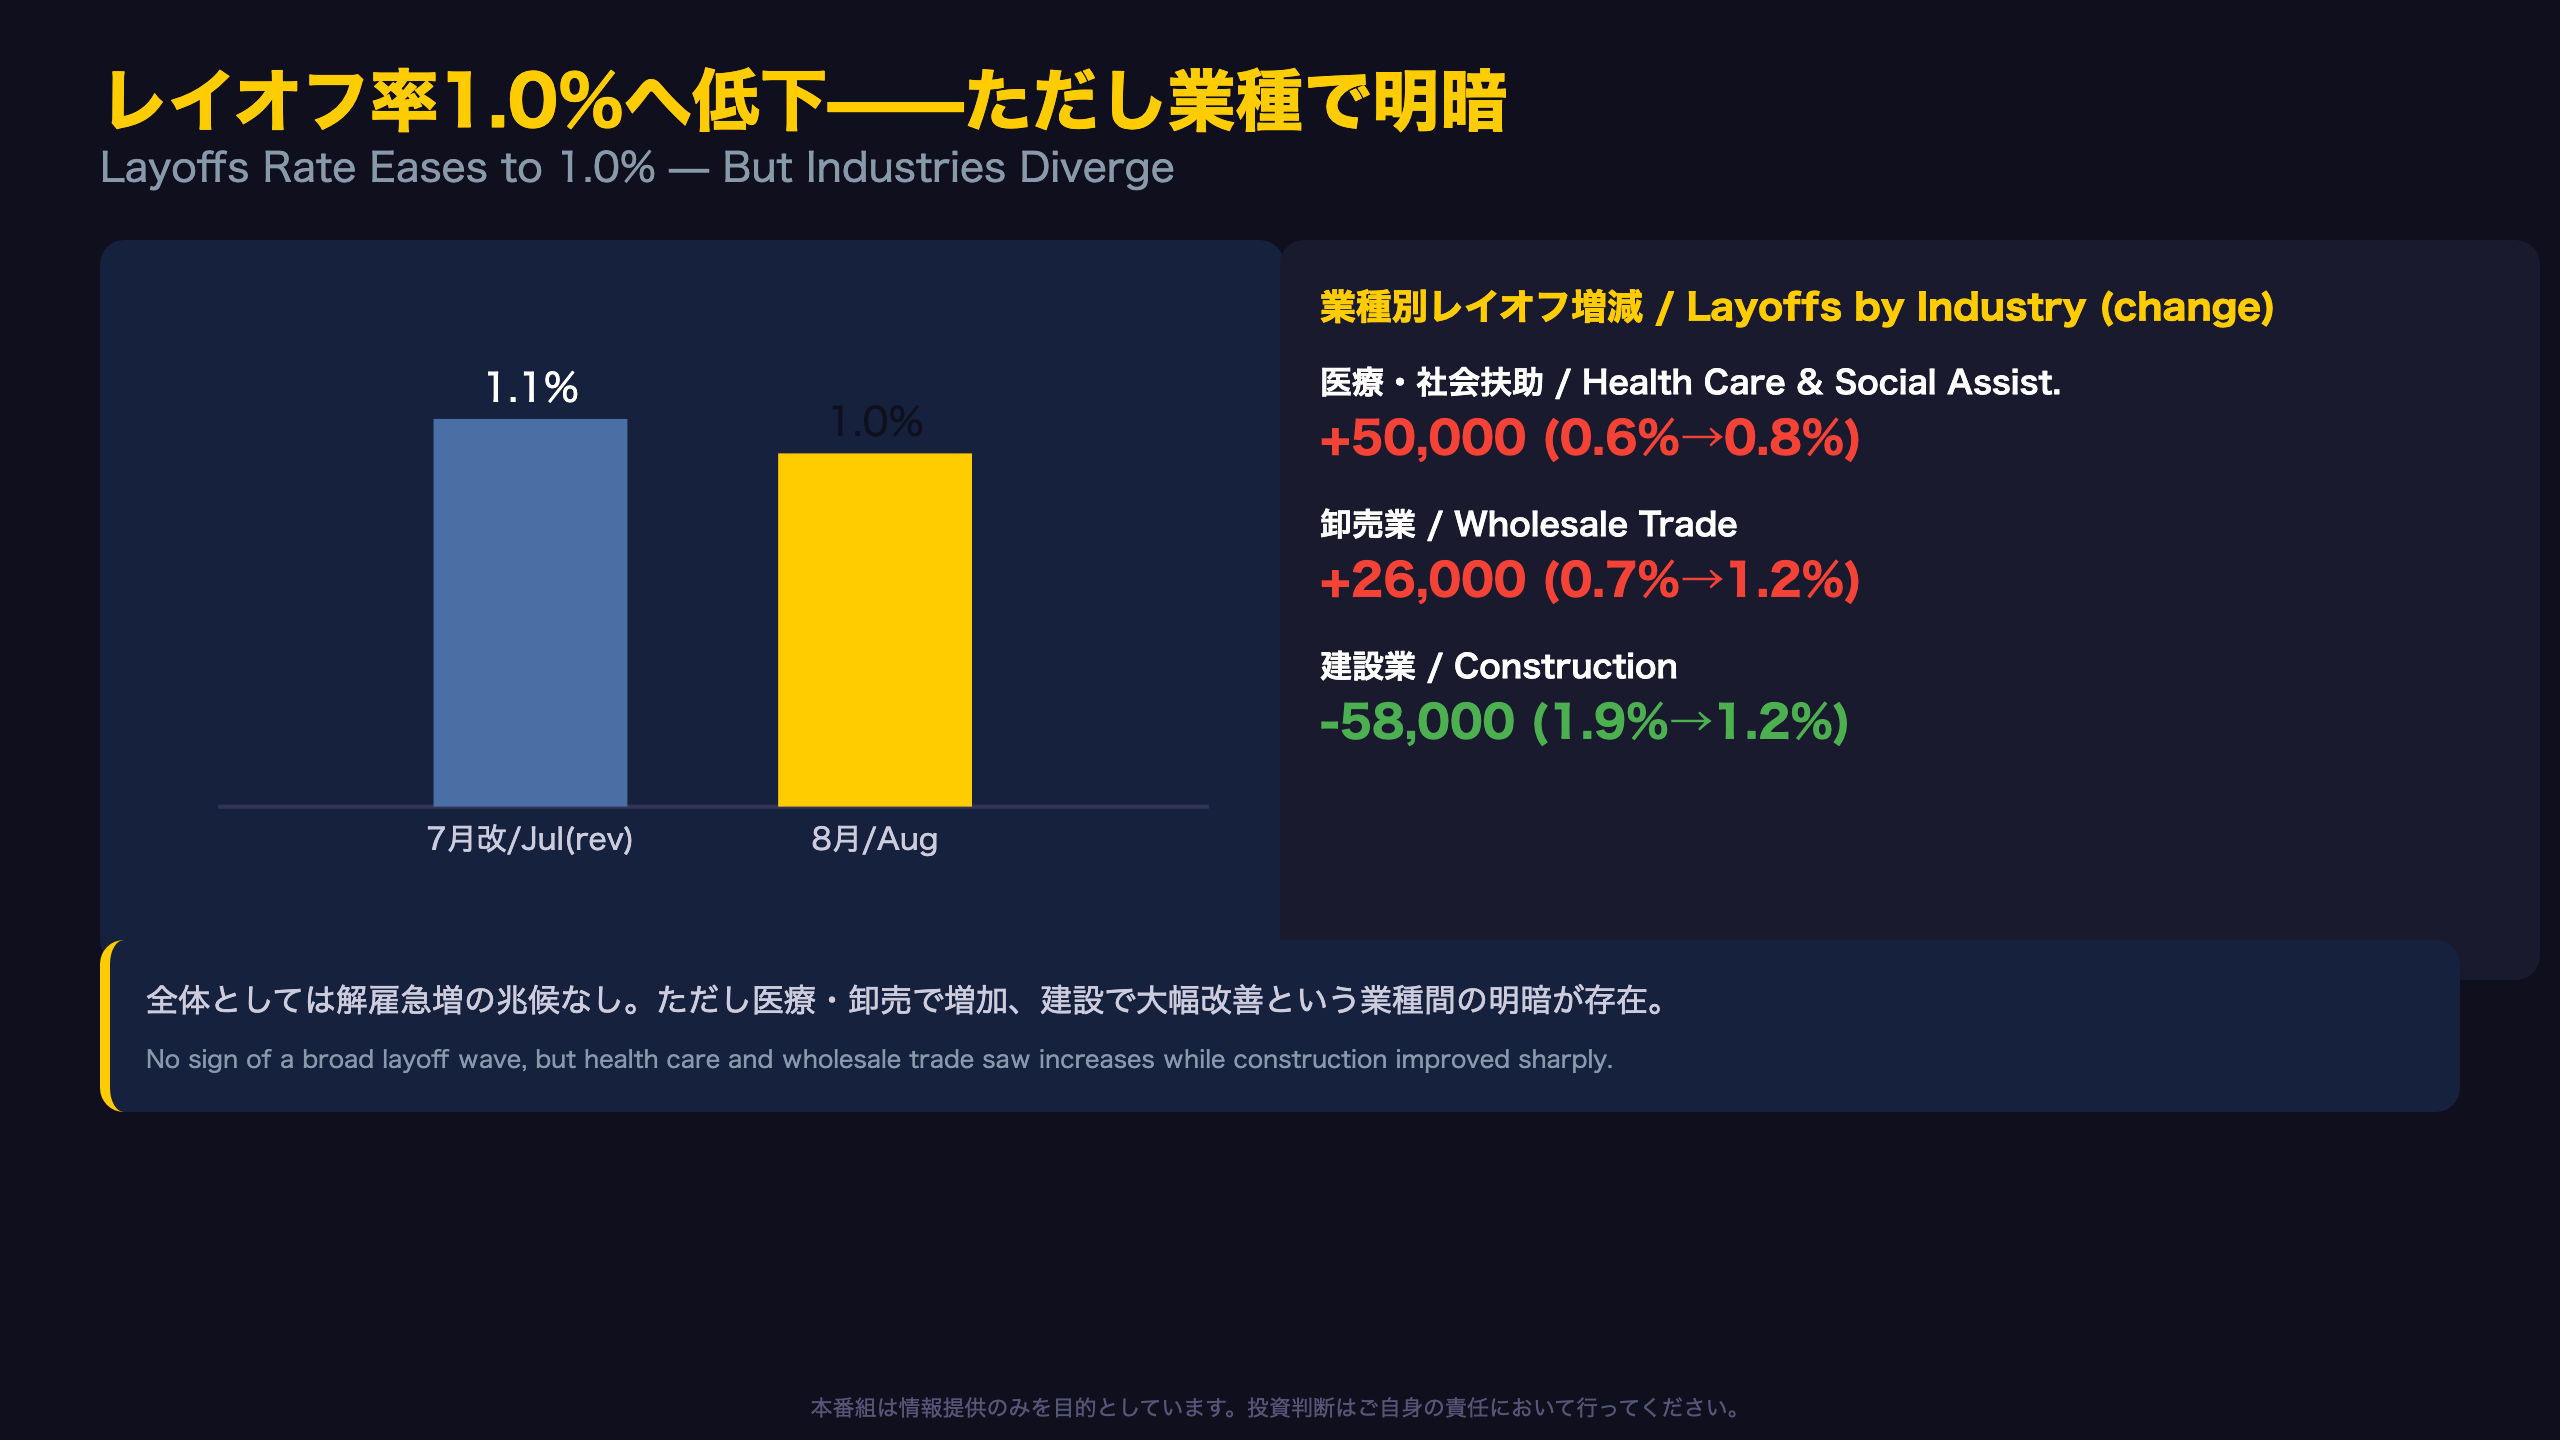
August’s layoffs and discharges rate of 1.0% extended a decline from July’s 1.1%. Historically, employer-initiated separations as a share of employment tend to exceed 1.5% during recessions; the current reading remains well below that threshold, arguing against an imminent layoff wave.
Reading the Health Care Uptick
Layoffs in health care and social assistance rose by 50,000, pushing the sector’s rate from 0.6% to 0.8%. This is a sector that has faced chronic labor shortages tied to an aging population, so the increase could reflect a one-off staffing adjustment rather than a durable trend (Level C inference). Still, a shift in a traditionally counter-cyclical sector is worth tracking over subsequent months.
Construction’s Bright Spot
Construction layoffs fell by 58,000, with the sector’s rate improving sharply from 1.9% to 1.2%. Depending on the trajectory of housing starts and capital investment, this could suggest the sector’s earlier employment-adjustment cycle is winding down.
A Statistical Caveat
The BLS itself characterizes this month’s layoffs data as showing little change across all industries, implying the sector-level swings described above may fall within the survey’s standard error bands. Extrapolating too much from any single industry’s monthly move would be premature.
7月分は軒並み上方修正——速報値の限界
Revisions Are the Rule, Not the Exception
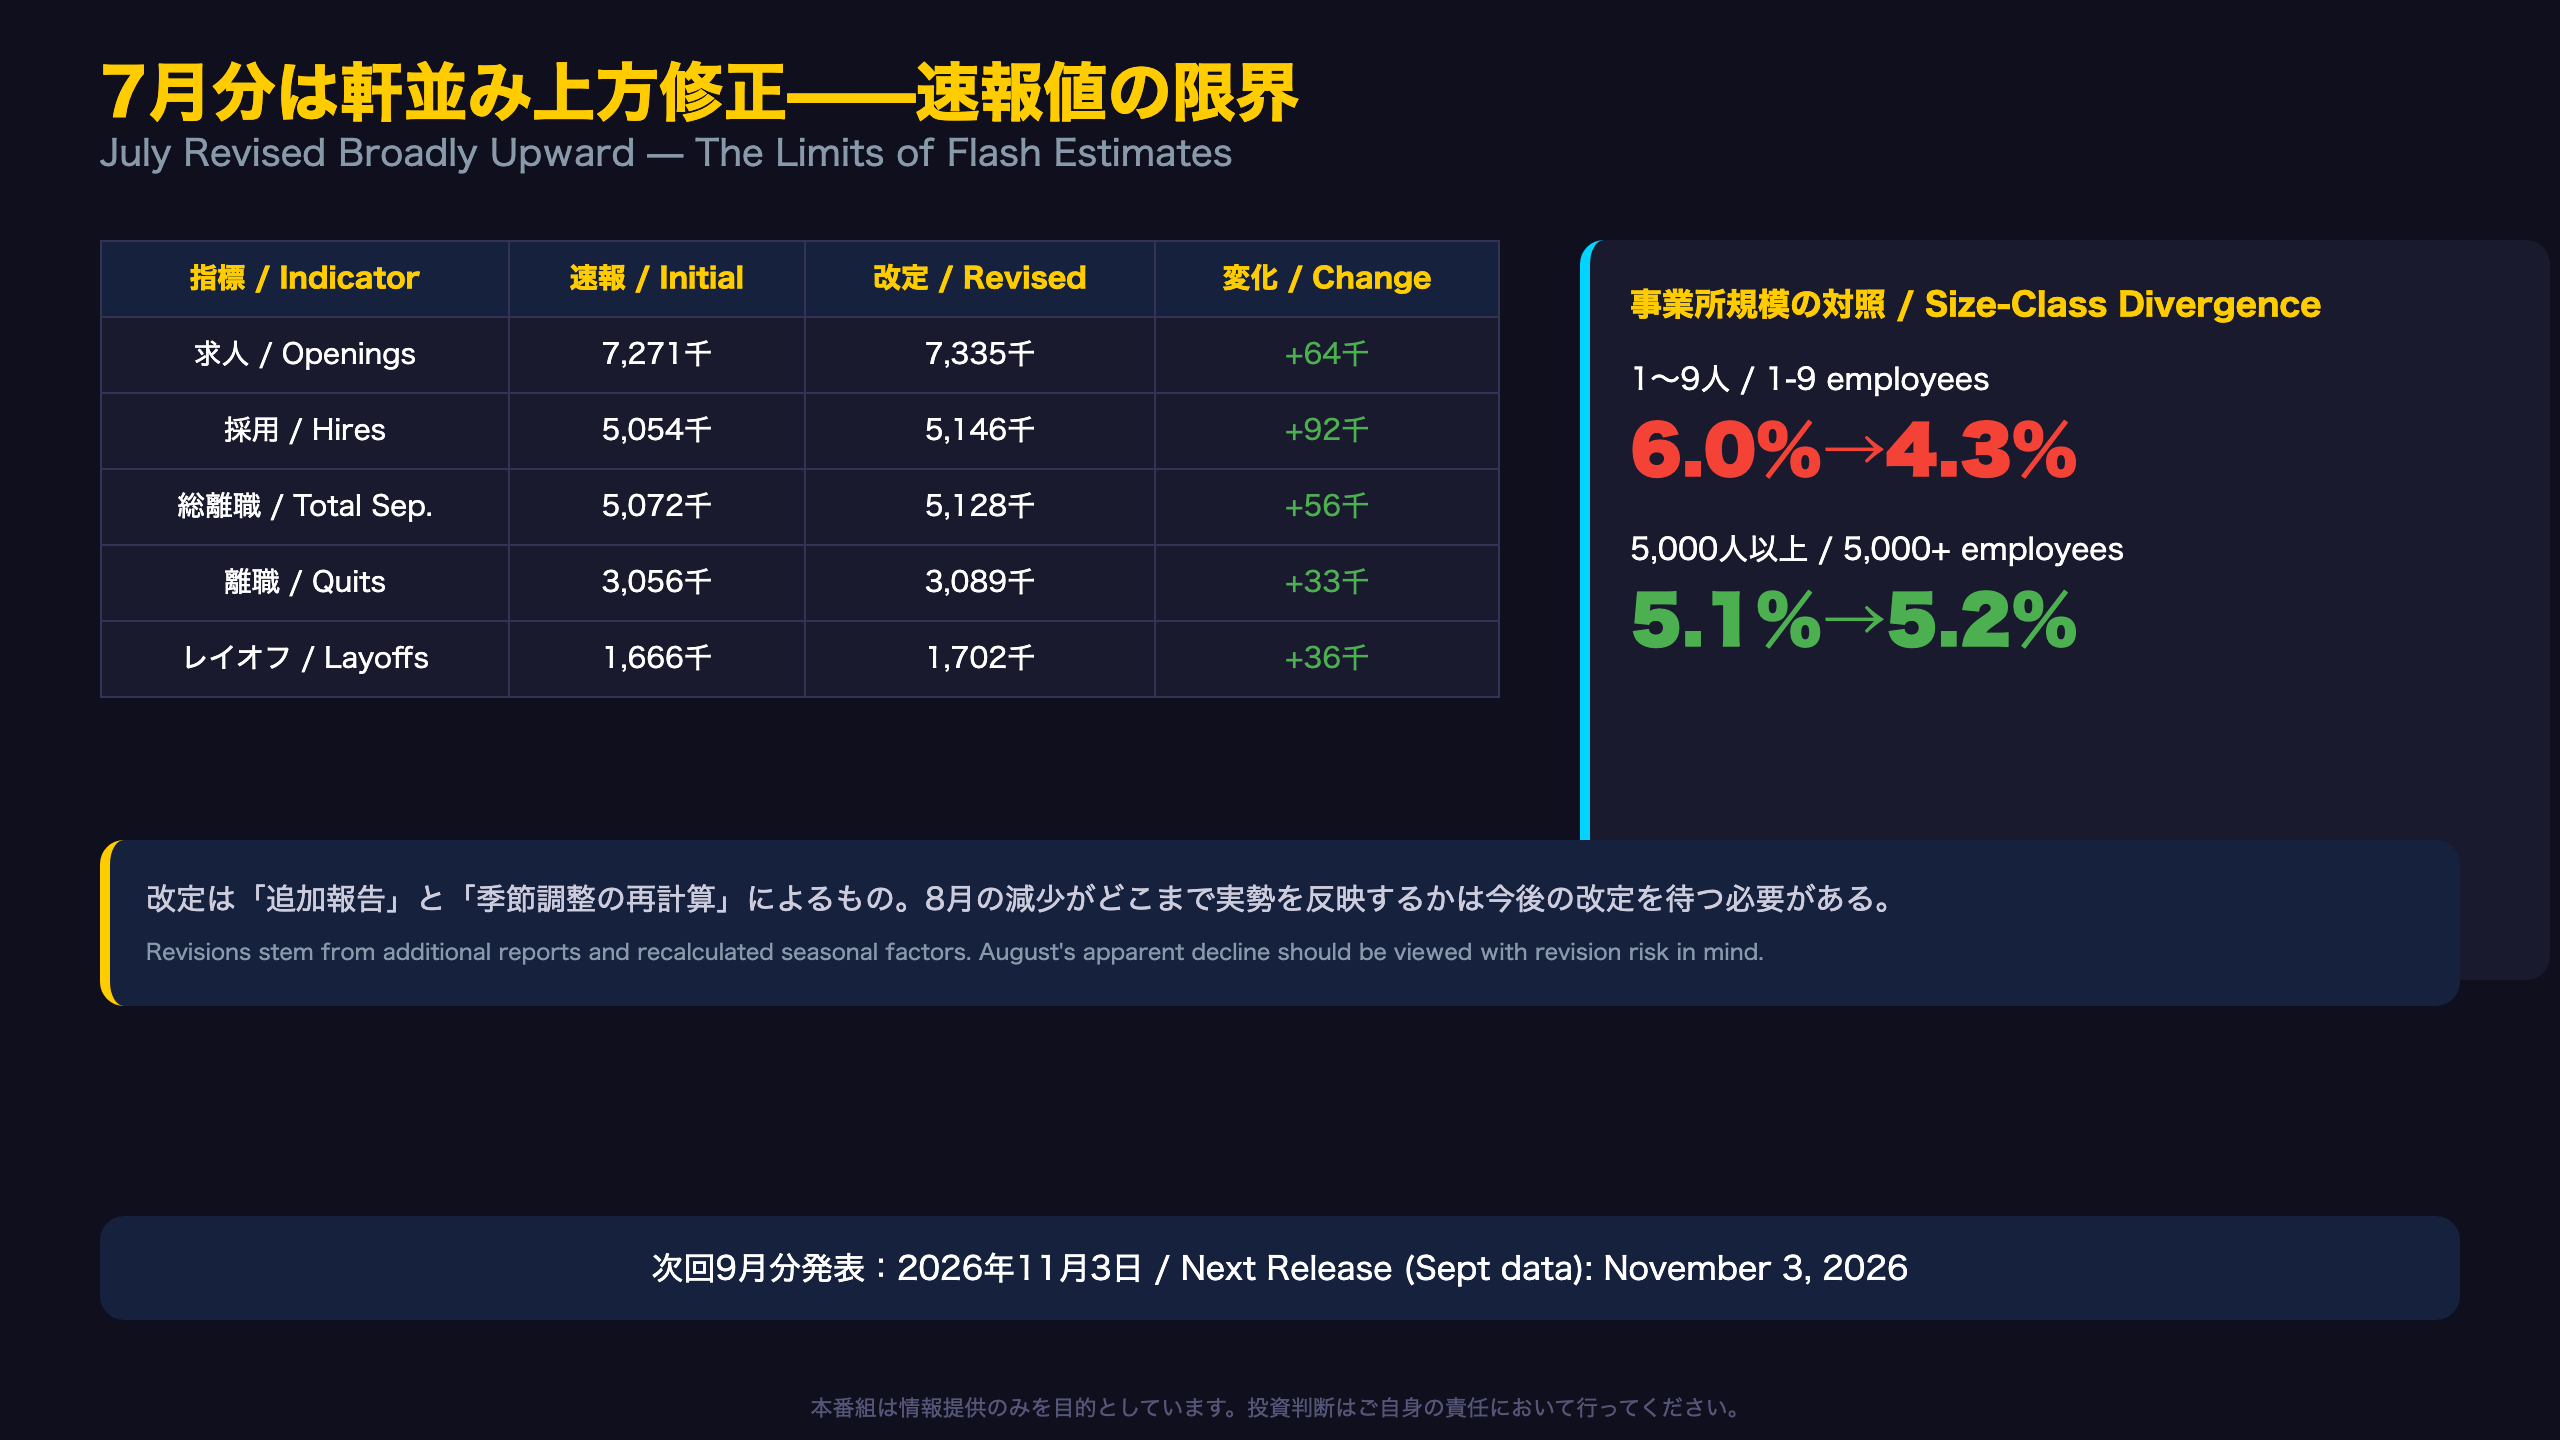
July’s job openings, hires, total separations, quits, and layoffs were all revised upward in this release. JOLTS methodology explicitly builds in monthly revisions driven by additional reports received from businesses and government agencies and recalculated seasonal factors, a structural reminder that first-print JOLTS data should be treated as provisional.
Per the BLS technical note, monthly revisions result from additional reports received since the last published estimates and recalculation of seasonal adjustment factors.
What the Size-Class Data Is Really Telling Us
The job openings rate for establishments with 1-9 employees fell sharply from 6.0% to 4.3%, while the rate for the largest establishments (5,000+ employees) edged up from 5.1% to 5.2%. This divergence is closely watched as a leading indicator of small-business hiring sentiment, distinct from but complementary to surveys like the NFIB small business index.
The Annual Benchmark Risk
JOLTS undergoes a full five-year revision each January, incorporating updated Quarterly Census of Employment and Wages (QCEW) benchmarks. Today’s apparent “trend” could look different once the January 2027 benchmark revision arrives, a caveat applying to nearly all labor-market narratives built on recent JOLTS prints.
The next release, covering September 2026 data, is scheduled for November 3, 2026. Markets will watch whether the upward revision pattern continues and whether the small-business openings slump proves durable.
Disclaimer: This article is for informational purposes only. All investment decisions are made solely at your own risk.