📺 Watch the Full Video Analysis
This article was automatically generated by the NFC Market Live AI analysis system. (Updated: 2026-09-29 21:37 JST)
📄 Primary Source
Statistics Canada
https://www150.statcan.gc.ca/n1/daily-quotidien/260828/dq260828b-eng.htm
Deep dive into Statistics Canada’s Monthly GDP by Industry release for June 2026.
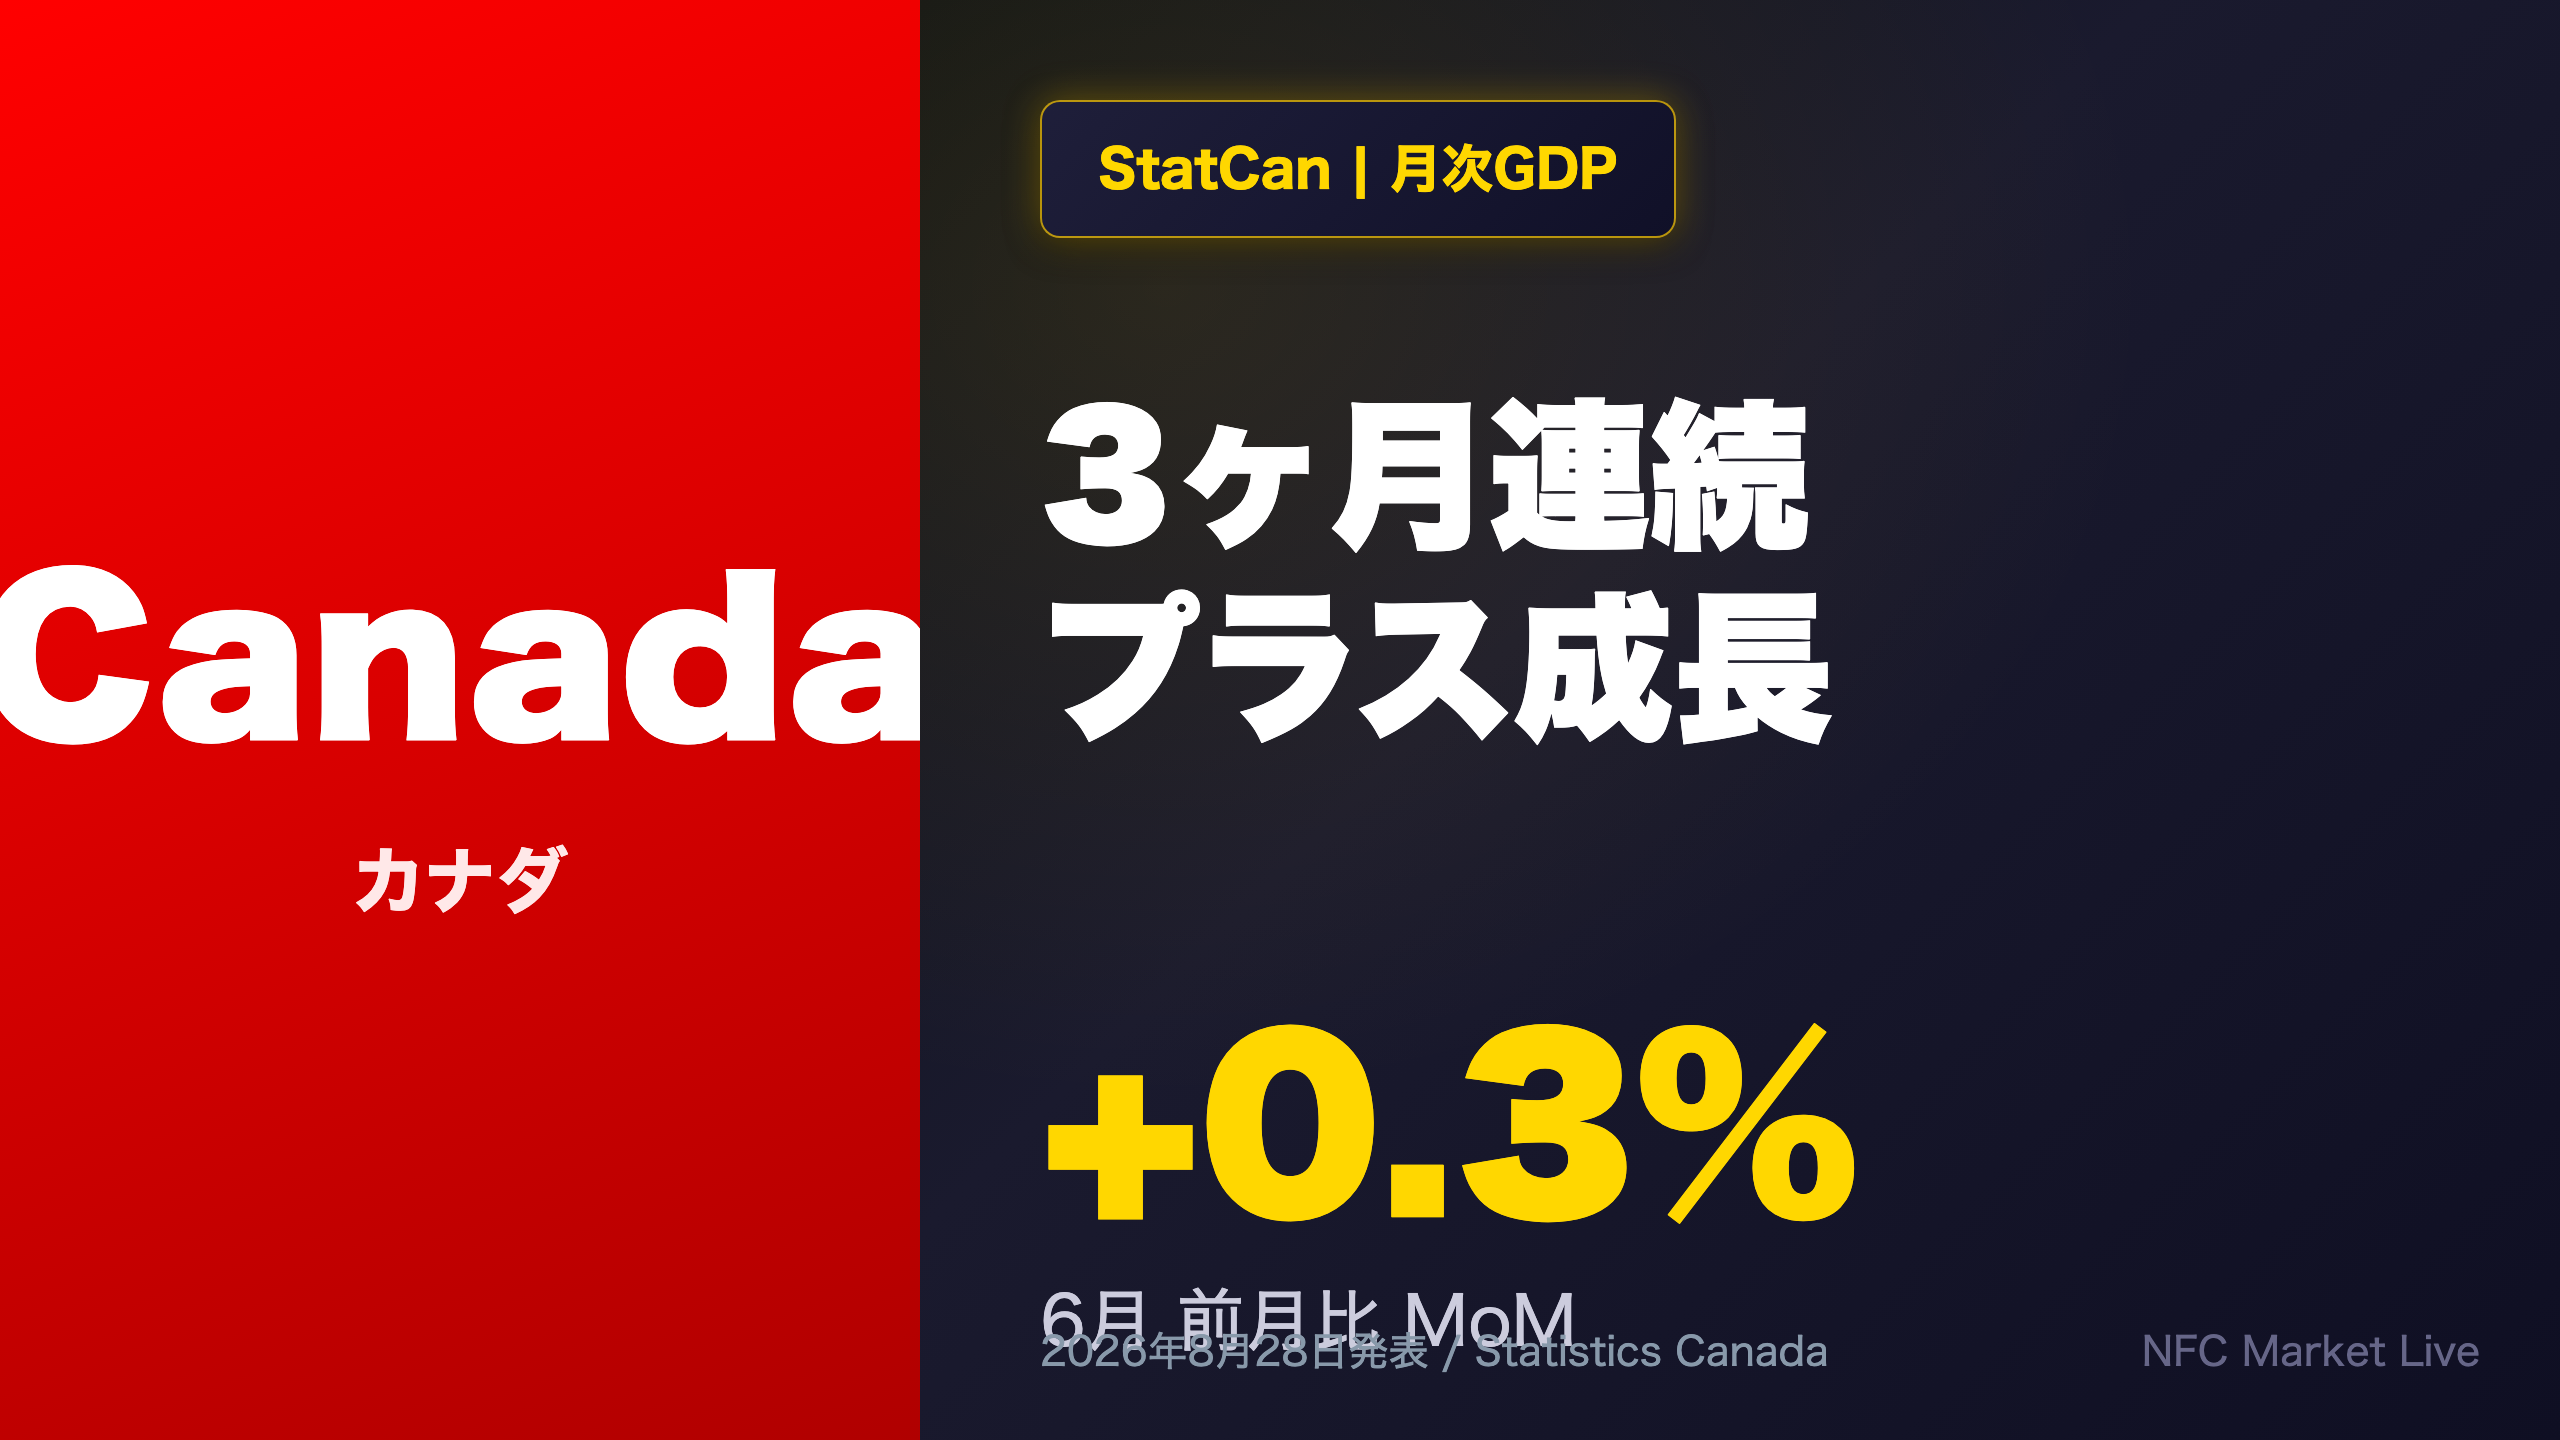
📊 Real GDP rose 0.3% MoM, a third straight monthly gain, with 13 of 20 sectors contributing.
📈 Services (+0.4%) outpaced Goods-producing (-0.1%); quasi-quarterly Q2 growth accelerated to +0.9%.
⚠️ Oil & gas support services plunged -9.3%, and the July advance estimate came in essentially flat.
💡 We break down what this means for Bank of Canada policy and the Canadian dollar.
The Ultimate Summary:3ヶ月連続プラス、しかし内実は二層構造
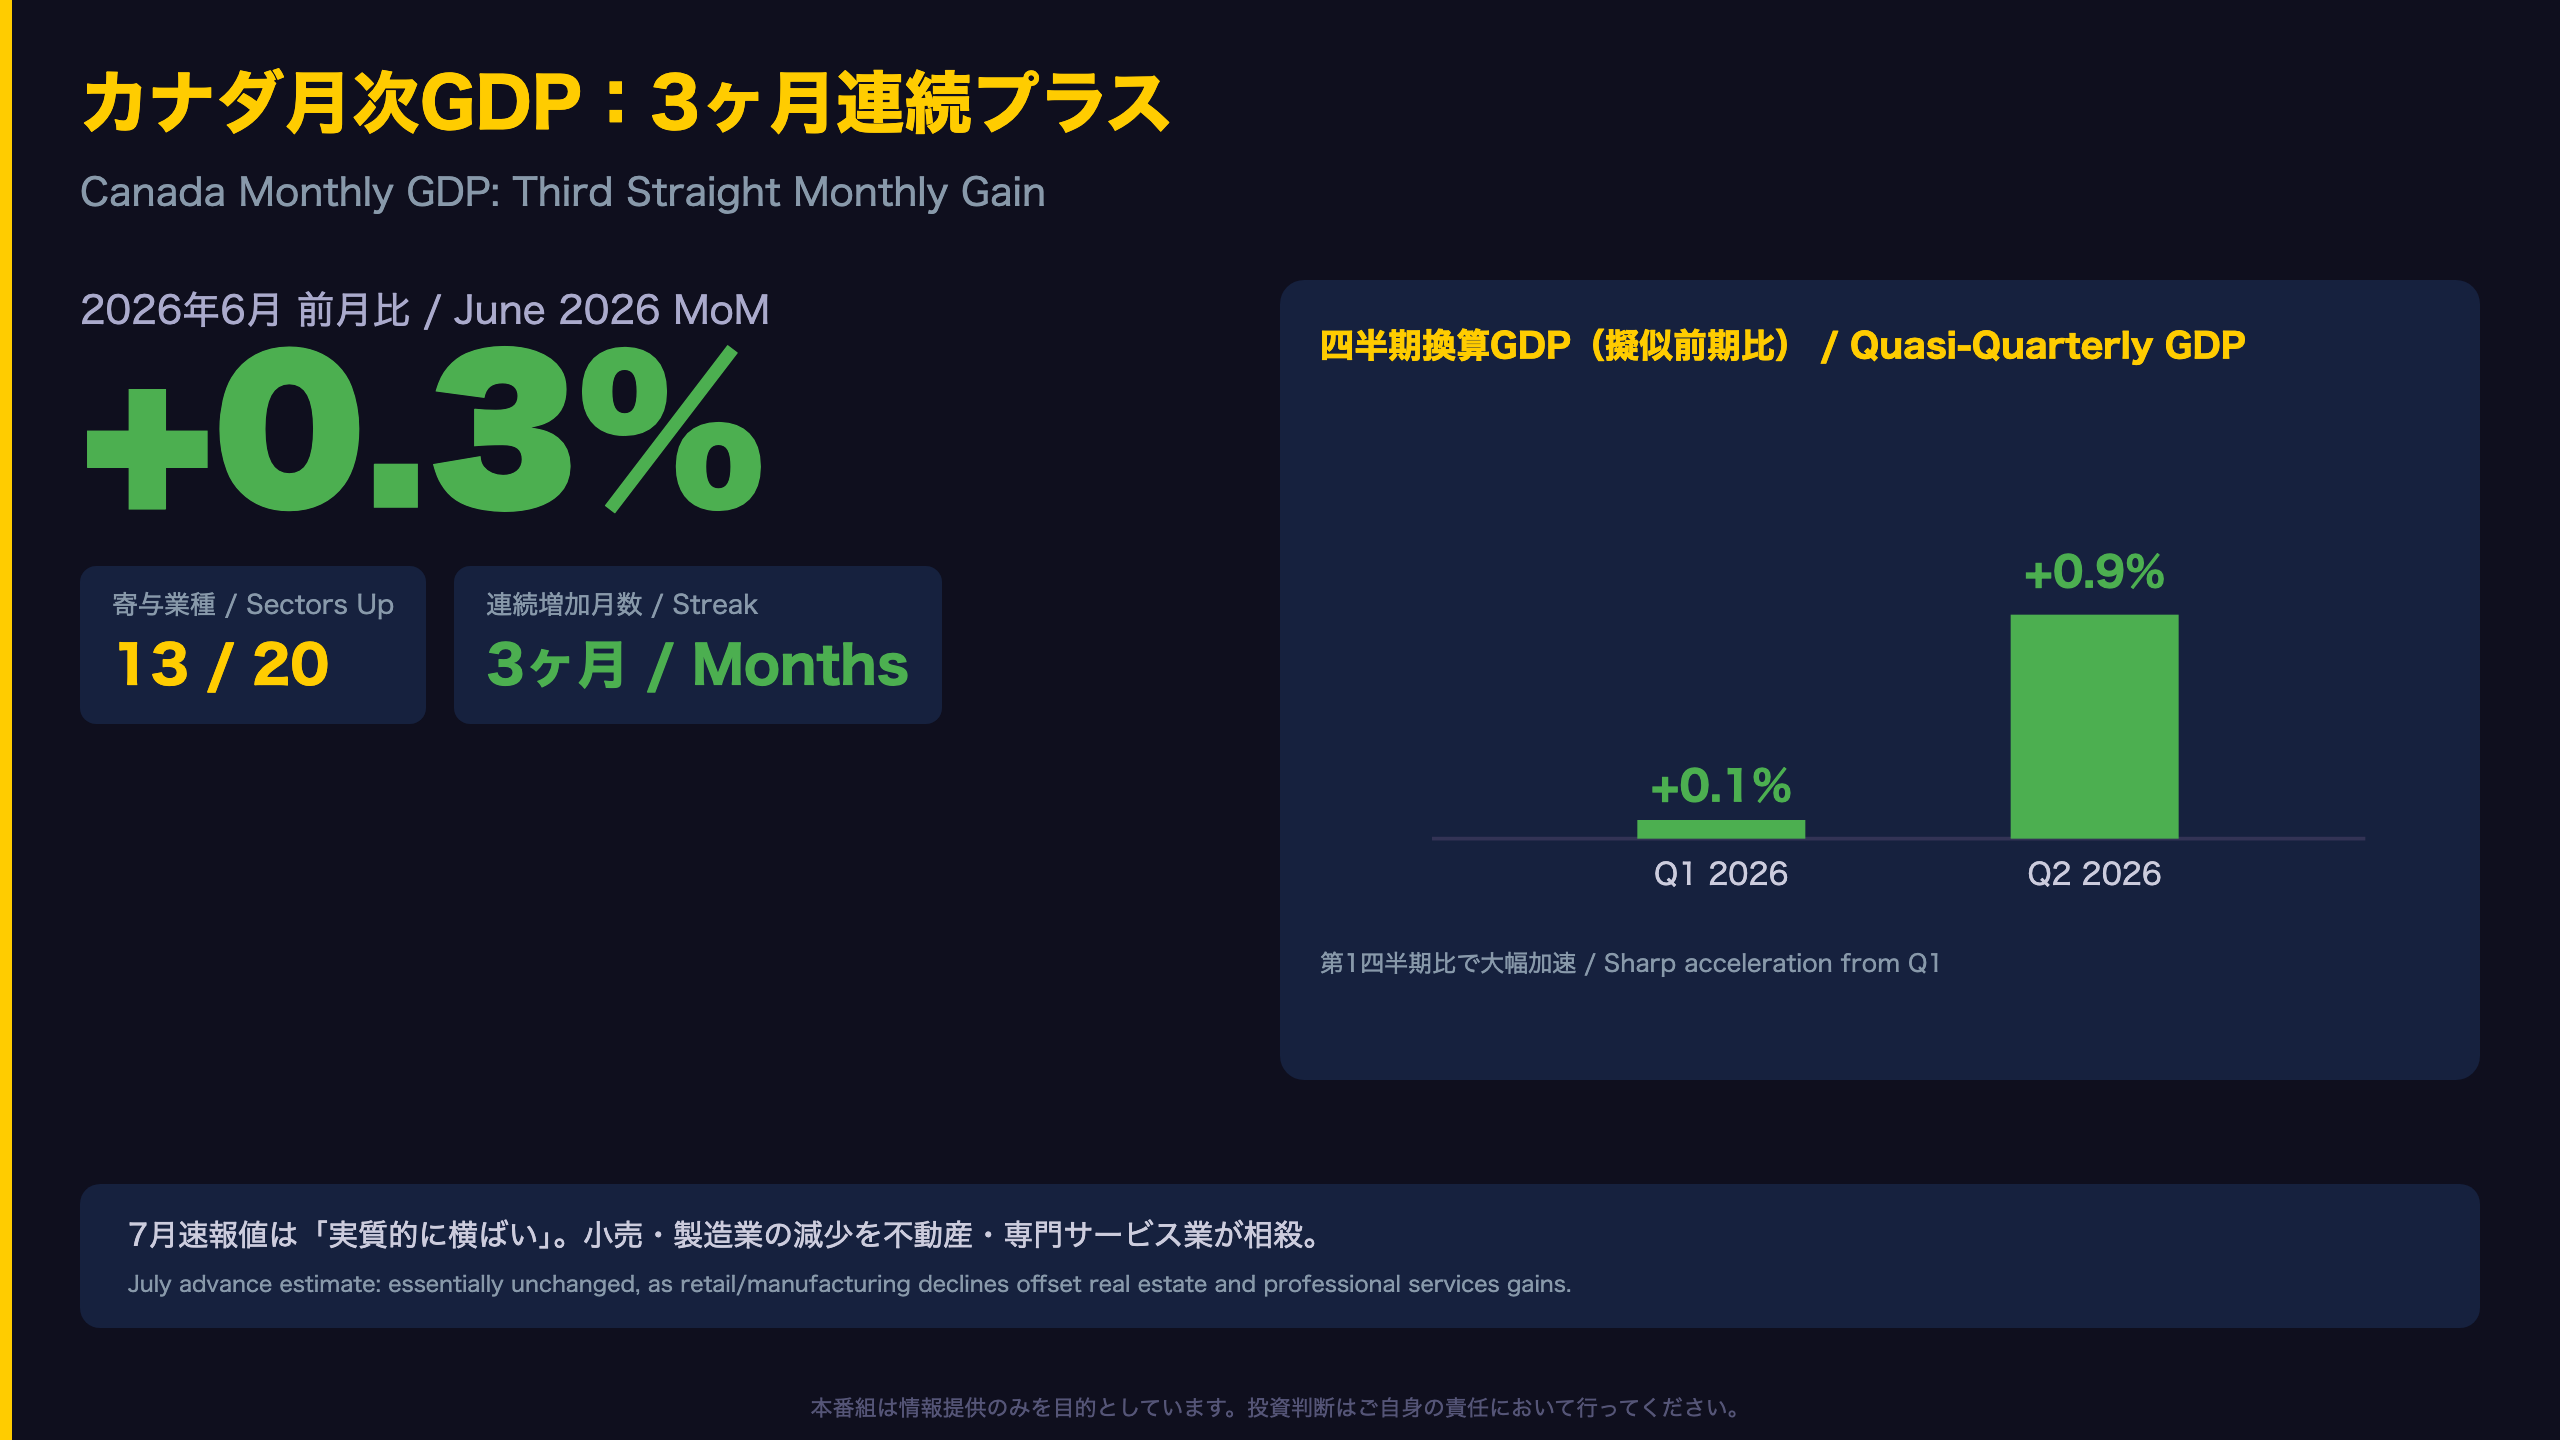
Statistics Canada (StatCan), the country’s national statistical agency, reported that “real gross domestic product (GDP) grew 0.3% in June, increasing for a third consecutive month, with 13 of 20 industrial sectors contributing to the growth.”
Context for International Readers
Unlike the US Bureau of Economic Analysis, which reports GDP primarily on an expenditure basis quarterly, StatCan publishes a monthly GDP by industry series (Table 36-10-0434-01), giving markets a higher-frequency read on economic momentum between official quarterly releases.
Quasi-Quarterly Acceleration
Aggregating the monthly industry data into Q2 2026 shows growth accelerating to +0.9%, up sharply from +0.1% in Q1 2026 — a figure economists often use as an early proxy ahead of the official expenditure-based GDP release.
A Cautionary Signal
The July advance estimate, however, points to output that was “essentially unchanged,” with declines in retail trade and manufacturing offsetting gains in real estate and professional services. This preliminary figure will be finalized on September 29, 2026.
Market Implications
For CAD traders, the combination of a strengthening Q2 print and a flat July advance estimate creates a mixed near-term picture — supportive of the currency on trend growth, but not conclusive enough to firmly shift Bank of Canada rate expectations.
Goods vs Services:内需系サービス業が牽引、財生産業は苦戦
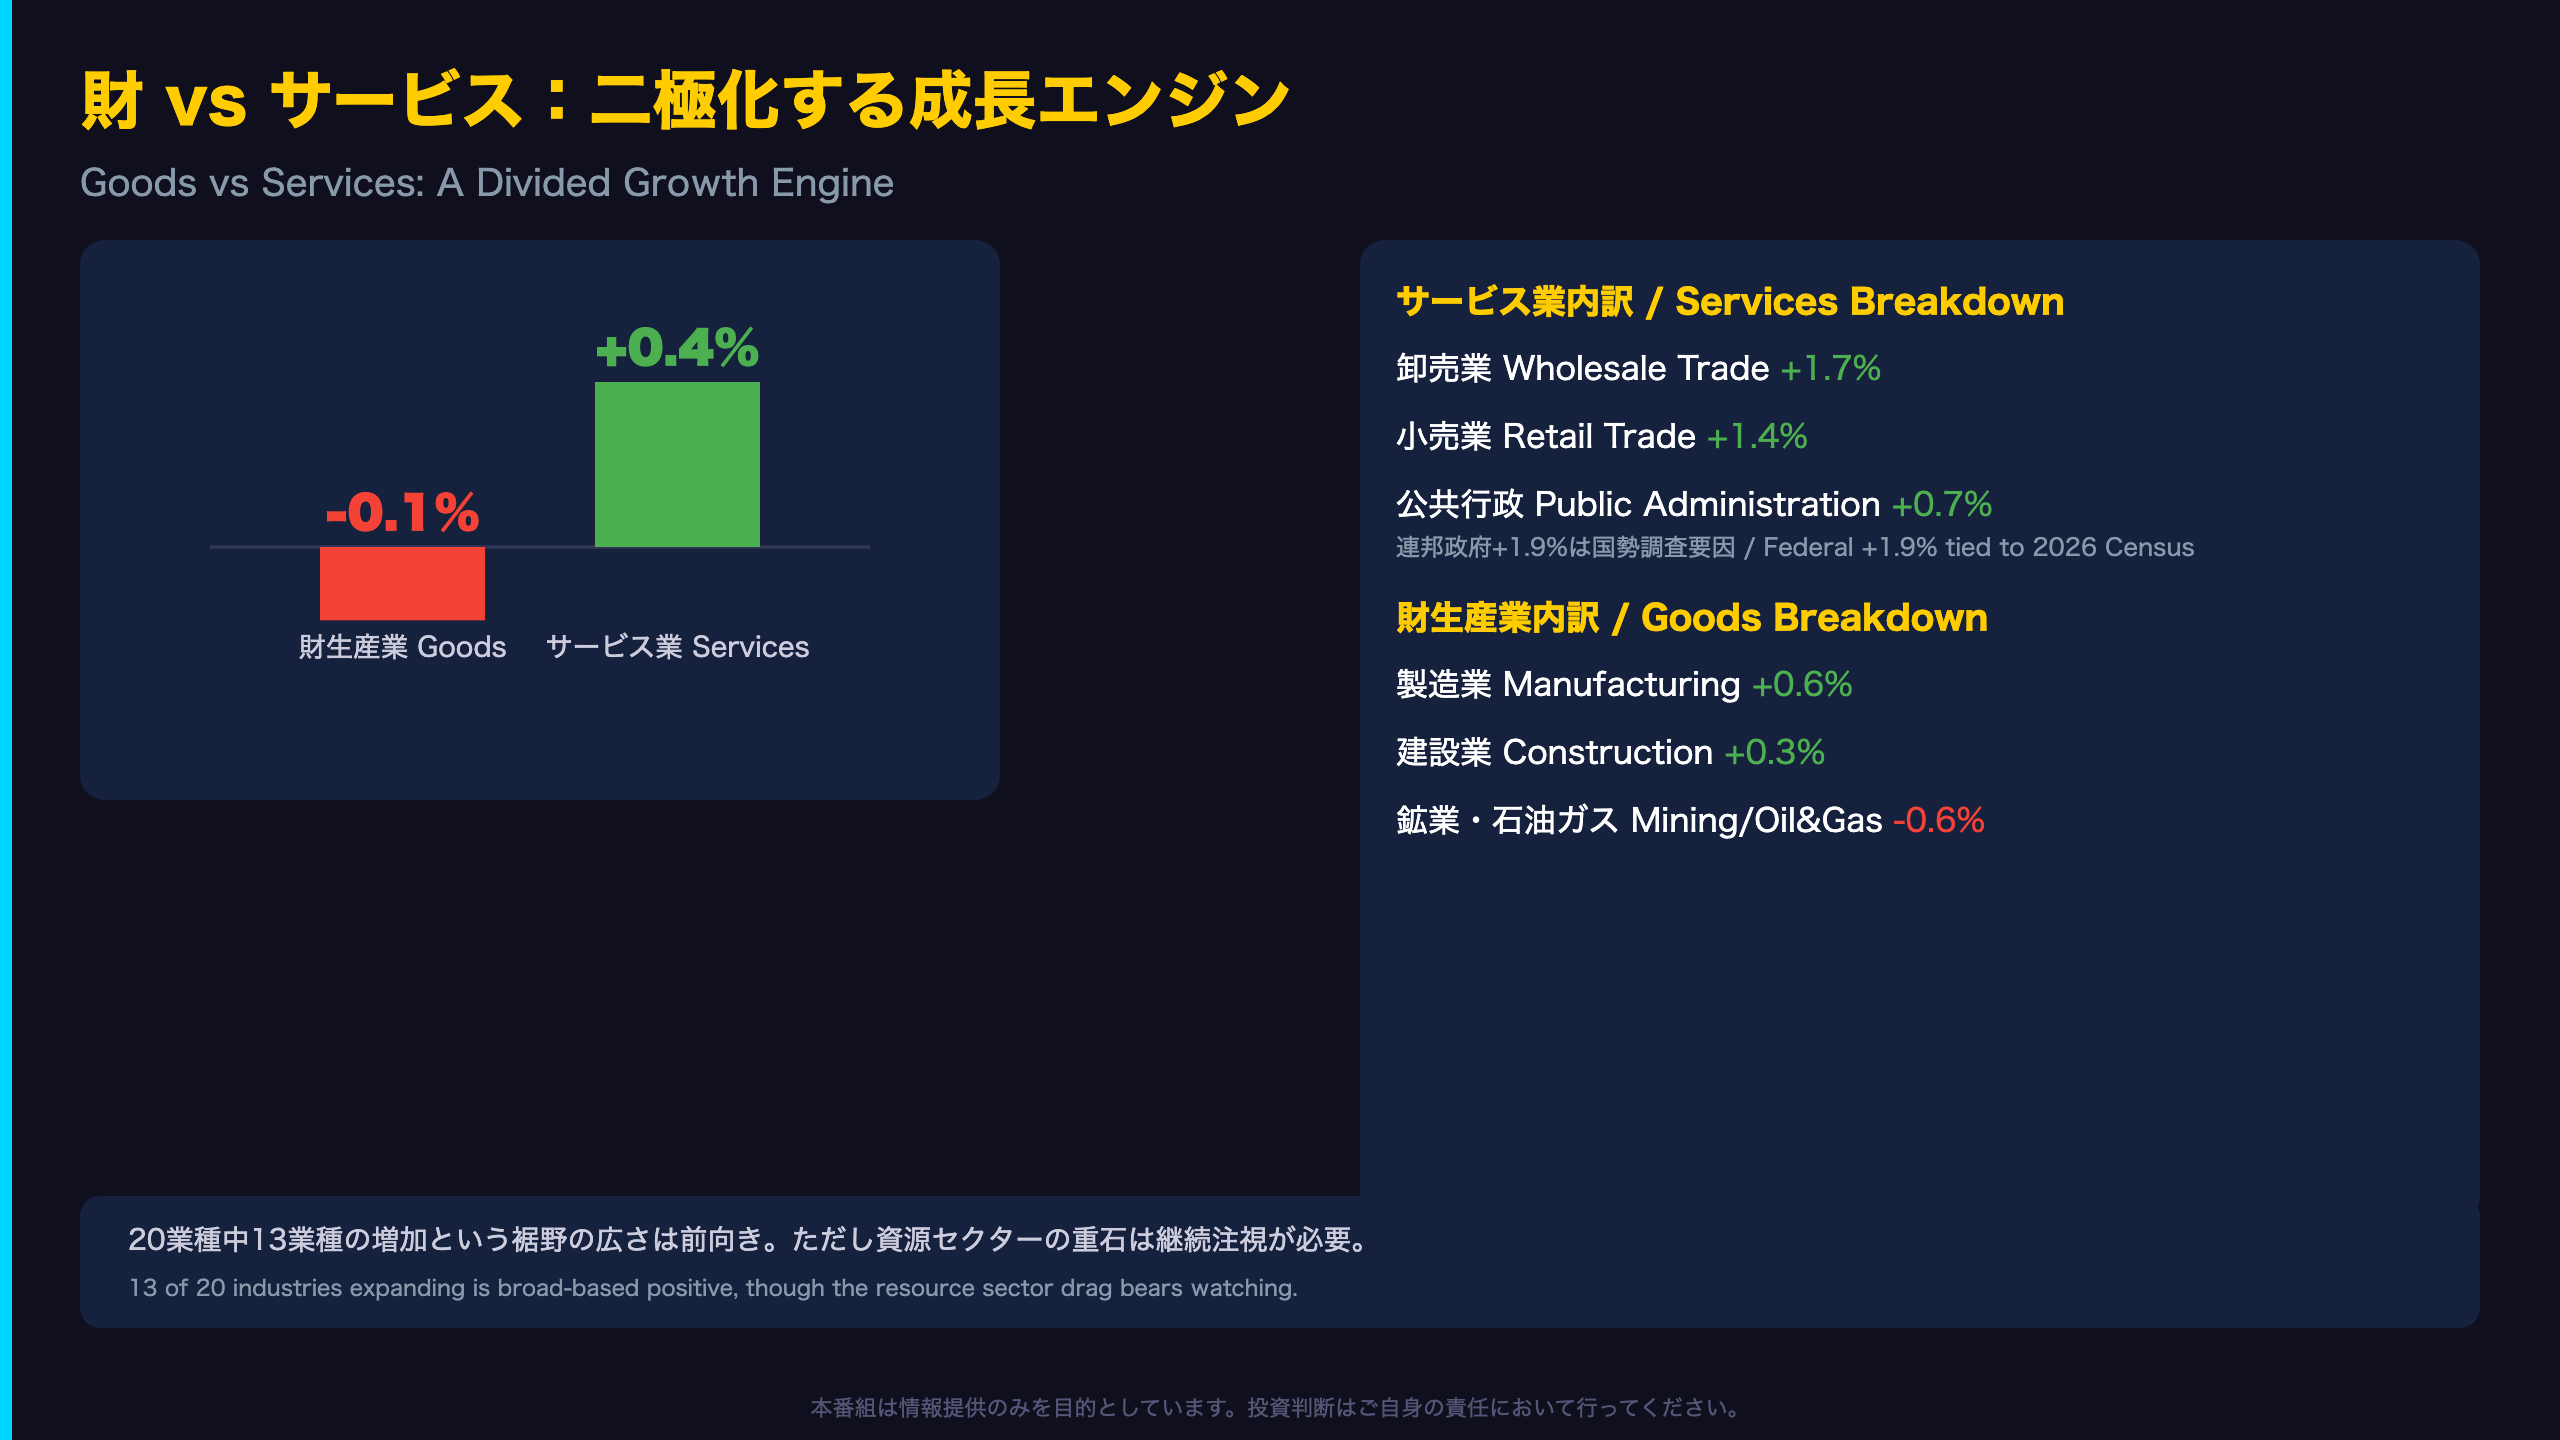
The divergence between services-producing and goods-producing industries highlights a structural feature of the Canadian economy. StatCan’s release states: “Services-producing industries increased 0.4% in June… The goods-producing industries aggregate edged down 0.1%, as expansions in manufacturing and construction were more than offset by contractions in mining, quarrying, and oil and gas extraction and utilities.”
Public Sector Strength
Public administration rose a notable 0.7%, with federal government administration (excluding defence) surging 1.9%, directly attributed to activity tied to the 2026 Census. Readers should note this is a temporary, one-off boost that is likely to fade once Census-related work concludes — a nuance often missed when comparing month-to-month headline GDP prints.
Education & Construction
Educational services rose 0.2% for a third straight month, led by elementary and secondary schools (+0.3%). Construction expanded 0.3%, its third consecutive increase after four straight monthly declines — a sign that the earlier construction downturn may have bottomed.
Market Read
For investors comparing this to the US, where the ISM Services vs Manufacturing PMI split tells a similar goods/services story, Canada’s pattern echoes a broader theme: domestically-oriented services remain the primary growth engine, while resource- and trade-exposed goods sectors stay volatile. This split matters for CAD, which remains highly correlated with commodity and resource sector performance.
業種別ランキング:内需系が上位、資源・エネルギー関連が下位
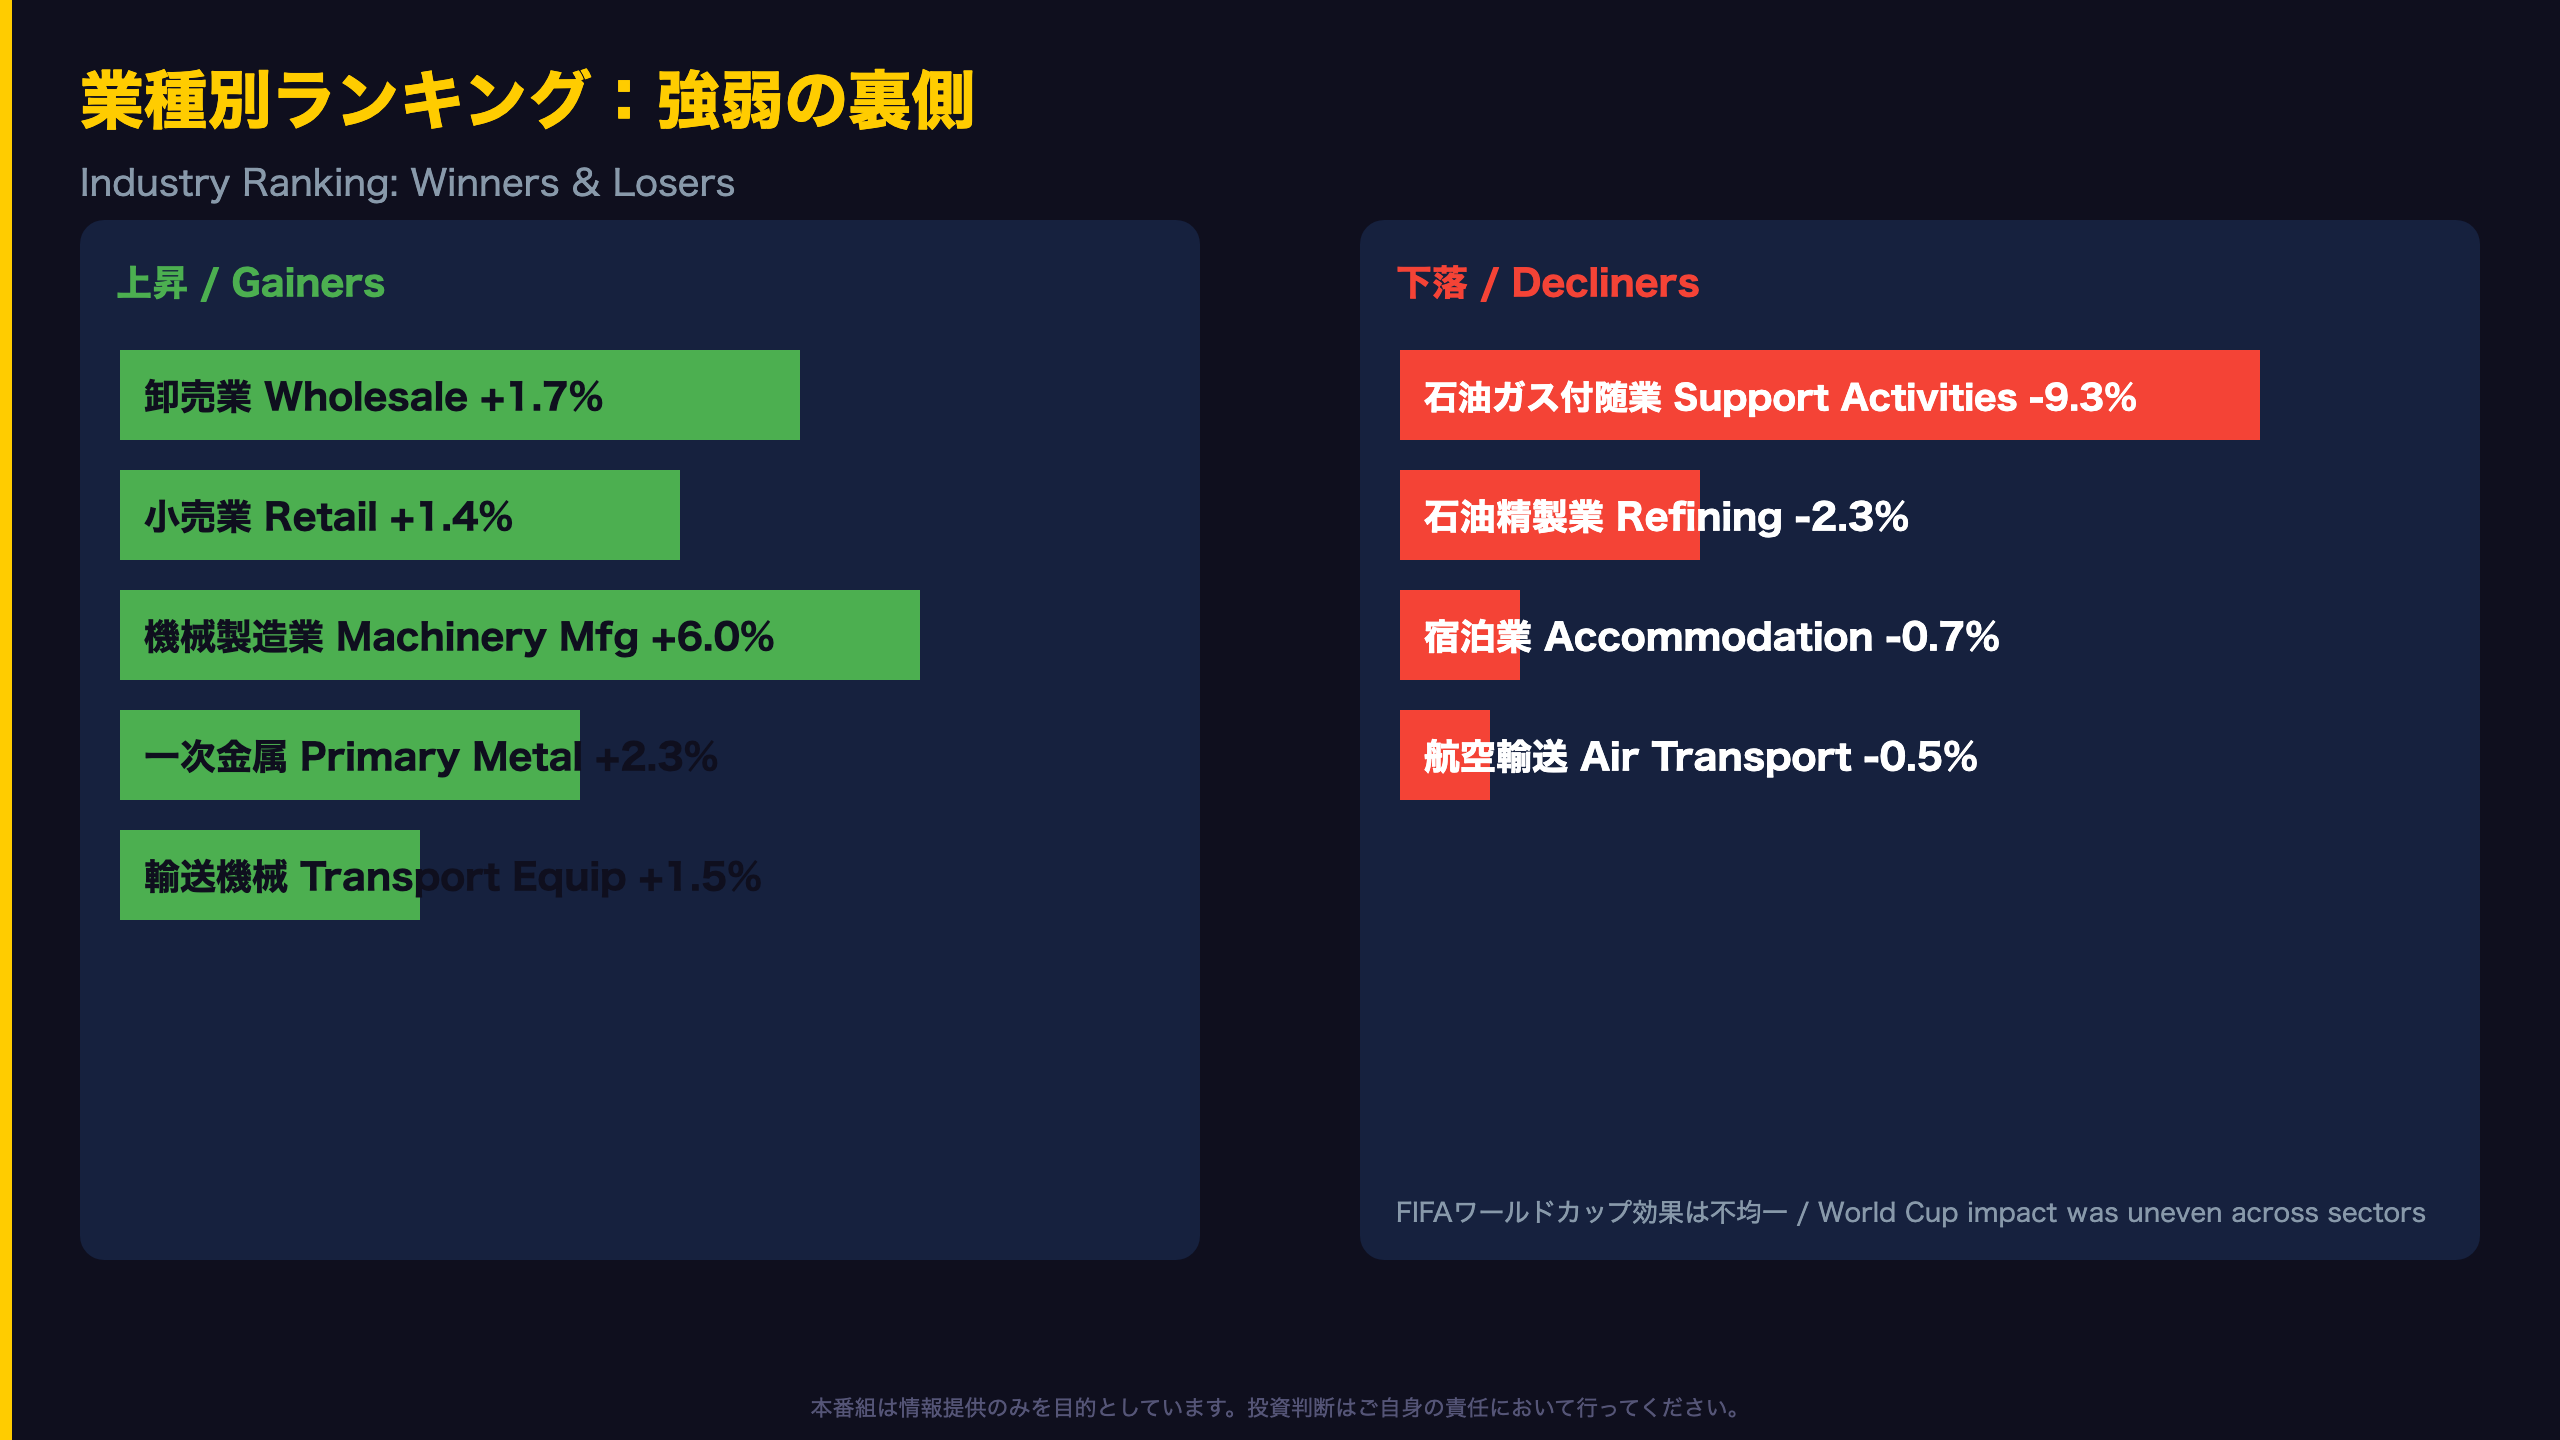
Individual industry performance in June shows domestically-oriented consumer and manufacturing sectors leading gains, while resource/energy-linked and part of the hospitality sector lagged.
Retail Trade Detail
General merchandise retailers (+3.3%), clothing/accessories/footwear (+3.1%), and gasoline stations (+3.8%) were the largest contributors. Motor vehicle and parts dealers rose 1.1%, marking a sixth consecutive monthly increase — a notable streak suggesting resilient consumer durable spending.
Manufacturing Detail
Transportation equipment manufacturing (+1.5%) was driven by motor vehicle parts manufacturing (+3.7%) and motor vehicle body/trailer manufacturing, which surged 17.5%. Primary metal manufacturing (+2.3%) extended a three-month growth streak, led by alumina and aluminum production (+6.8%). However, petroleum and coal product manufacturing fell 2.1%, with petroleum refineries down 2.3% as some Western Canada refineries underwent scheduled maintenance.
The World Cup Effect: A Case Study in Uneven Stimulus
Canada hosted 10 FIFA World Cup 2026 matches in June. As StatCan notes: “increased activity recorded in some industries, but not all hospitality and tourism-related industries expanded in the month.” Broadcasting jumped 8.6% — its best rate since the February Winter Olympics boost of 13.8% — and urban transit rose 1.7%. Yet accommodation fell 0.7% and air transportation dropped 0.5%. This is a useful reminder for investors that major sporting events don’t uniformly lift all consumer-facing sectors, a pattern also observed around past Olympic Games and World Cup host economies globally.
資源セクター特集:カナダ経済特有のリスク要因
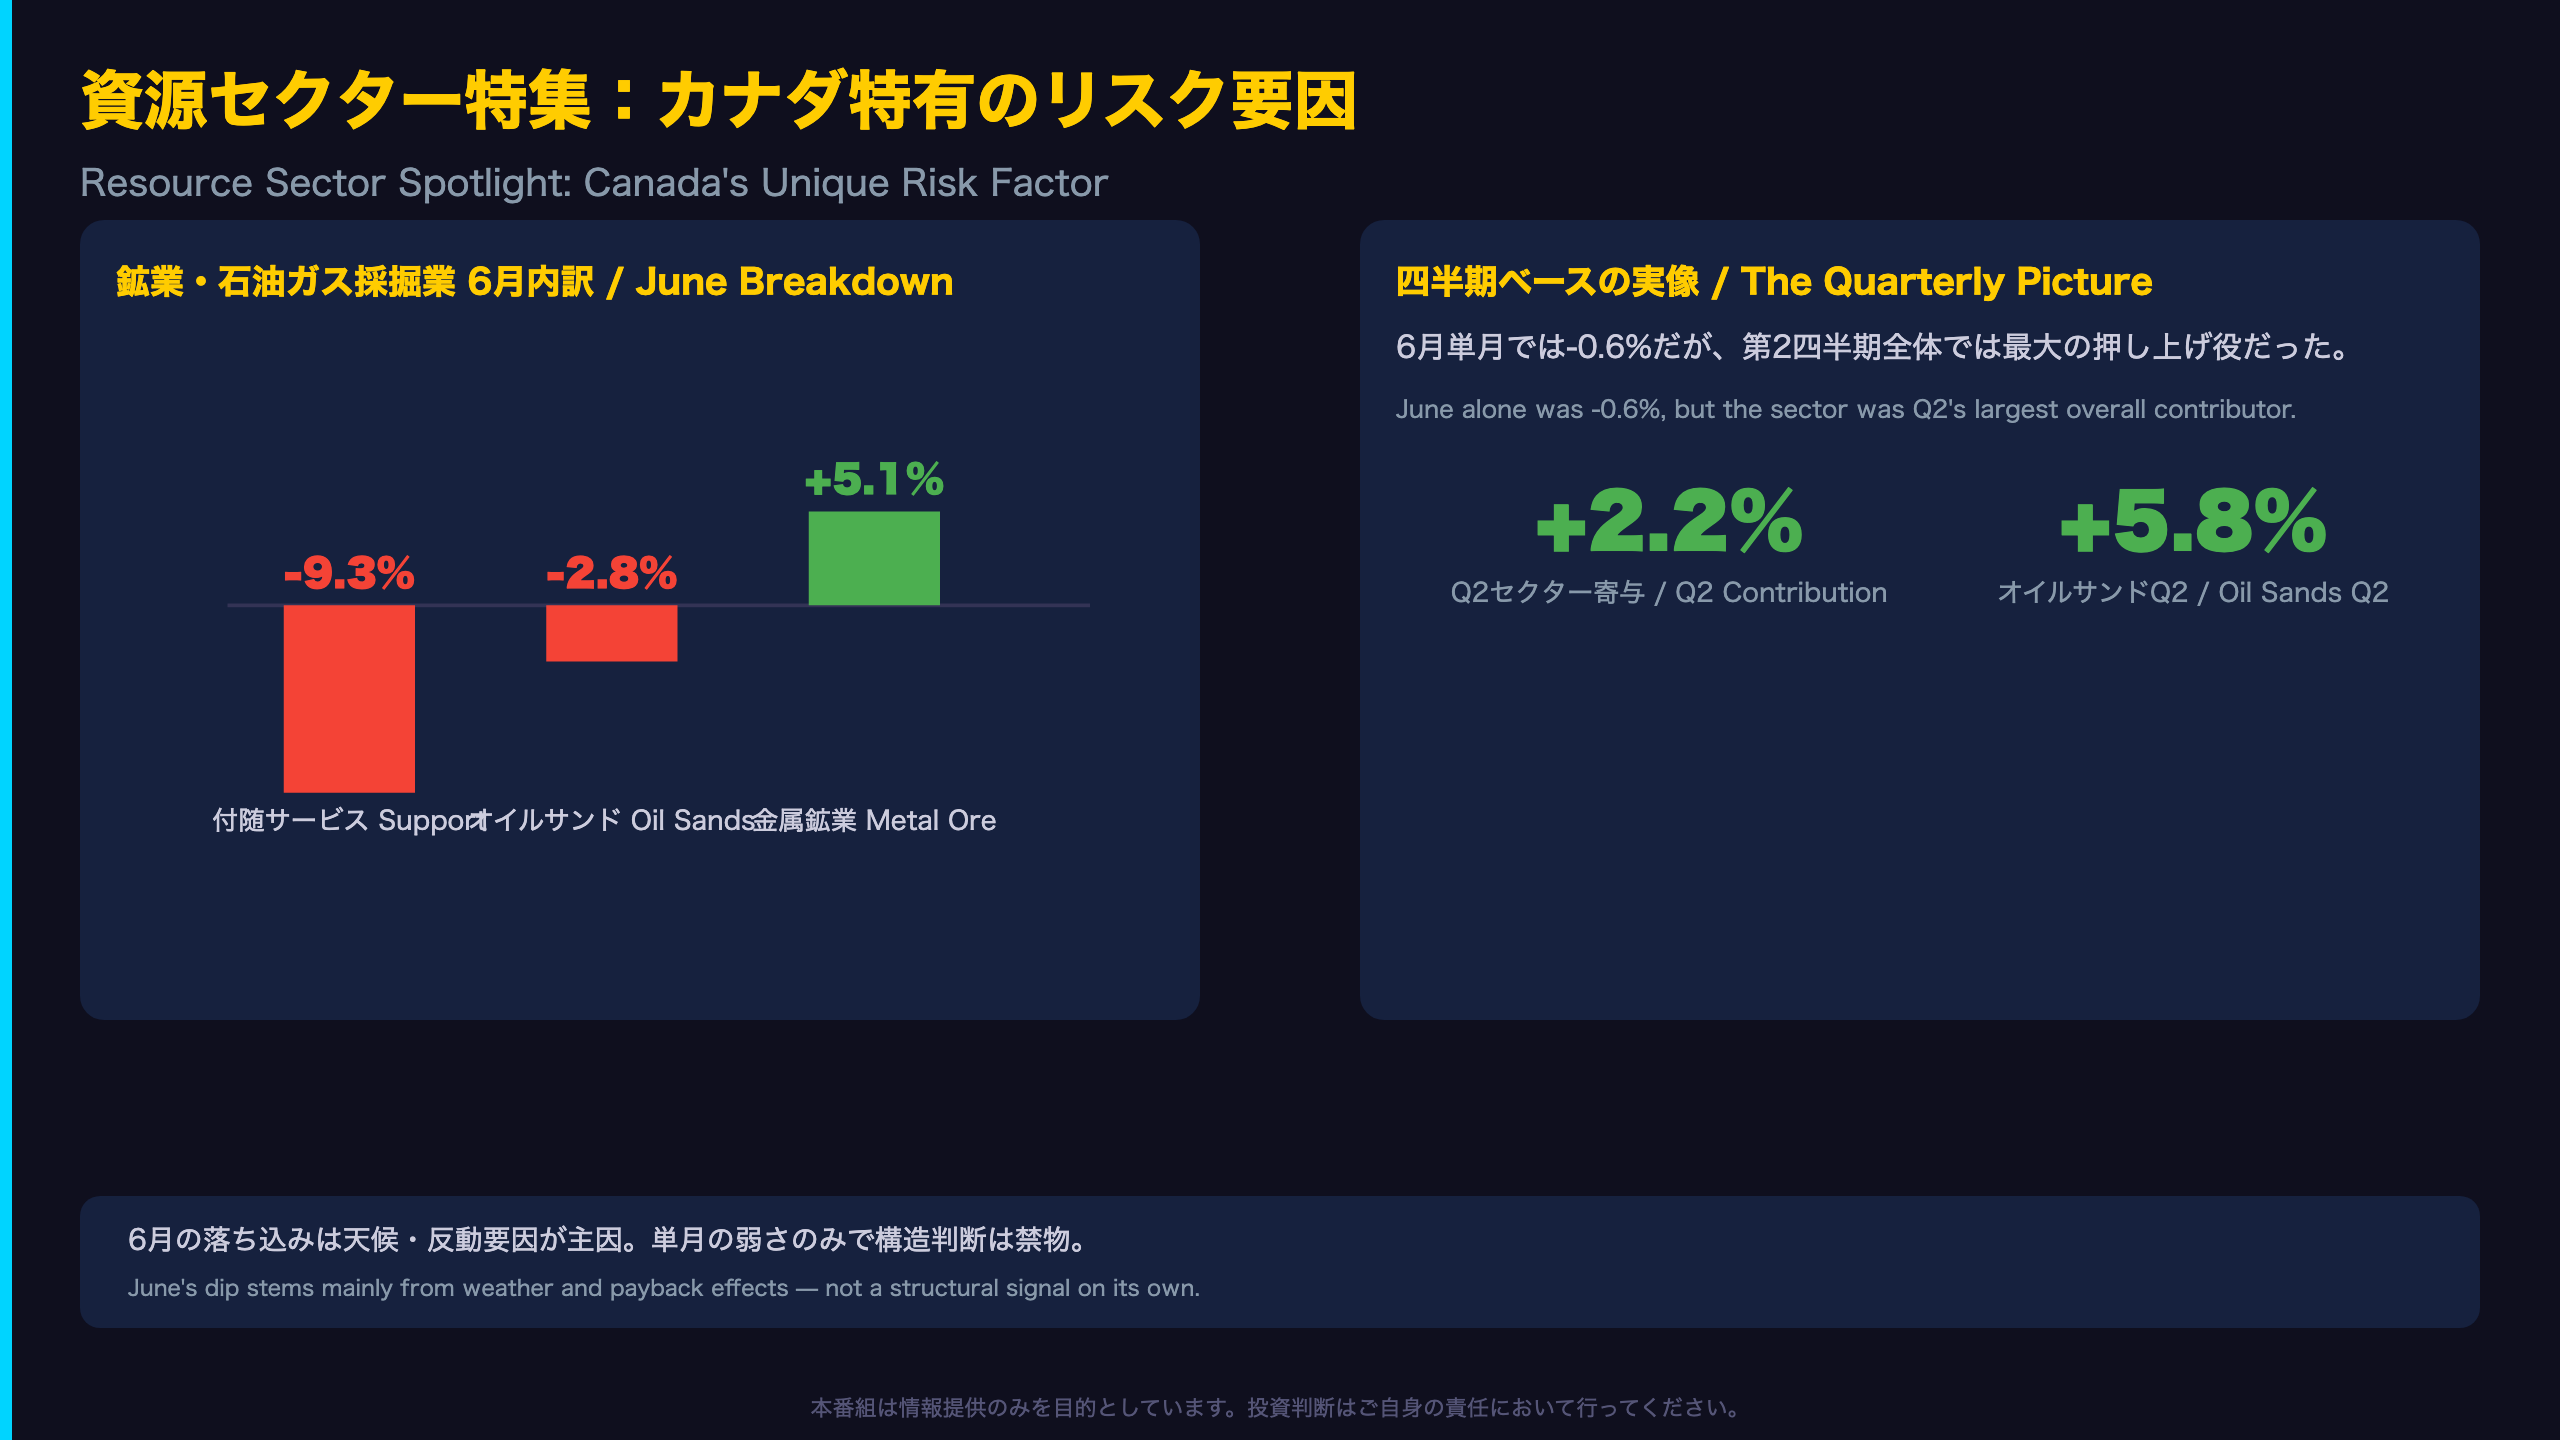
Canada’s mining, quarrying, and oil and gas extraction sector is a critical bellwether given the Canadian dollar’s well-documented sensitivity to commodity prices, particularly crude oil.
Decomposing June’s Weakness
StatCan explains: “Contributing the most to the decline in the sector in June was a 9.3% contraction in support activities for oil and gas extraction. This was the first decline in seven months following a period of atypically high activity in drilling and rigging services.” In other words, June’s drop is largely a payback effect from an unusually strong prior stretch of drilling activity, not necessarily a new deterioration signal.
Weather and Outages, Not Demand
The 2.8% drop in oil sands extraction is attributed to “heavy rains in northern Alberta” that “temporarily slowed the pace of oil sands mining,” along with power outages at other facilities. These are transitory supply-side disruptions rather than evidence of weakening demand.
The Bigger Quarterly Picture
Zooming out, this same sector was actually the largest contributor to Canada’s overall Q2 2026 GDP growth of 0.9%, with the sector up 2.2% for the quarter. Oil sands extraction rose 5.8% and support activities for oil and gas rose 6.8% (a third consecutive quarterly gain), driven by elevated Western Canada drilling. This underscores a key principle for investors: single-month industry data can diverge sharply from the underlying quarterly trend, and headline volatility in resource-linked GDP components should be read alongside quarterly aggregates before drawing conclusions about CAD or Canadian equity market direction.
A Note of Caution
Within the broader mining aggregate, coal mining fell a sharp 11.3% in Q2, driving a 2.1% quarterly decline in mining and quarrying excluding oil and gas — a reminder that “resource sector strength” is not monolithic across commodities.
BOC政策インプリケーション:加速する成長と足踏みの兆し
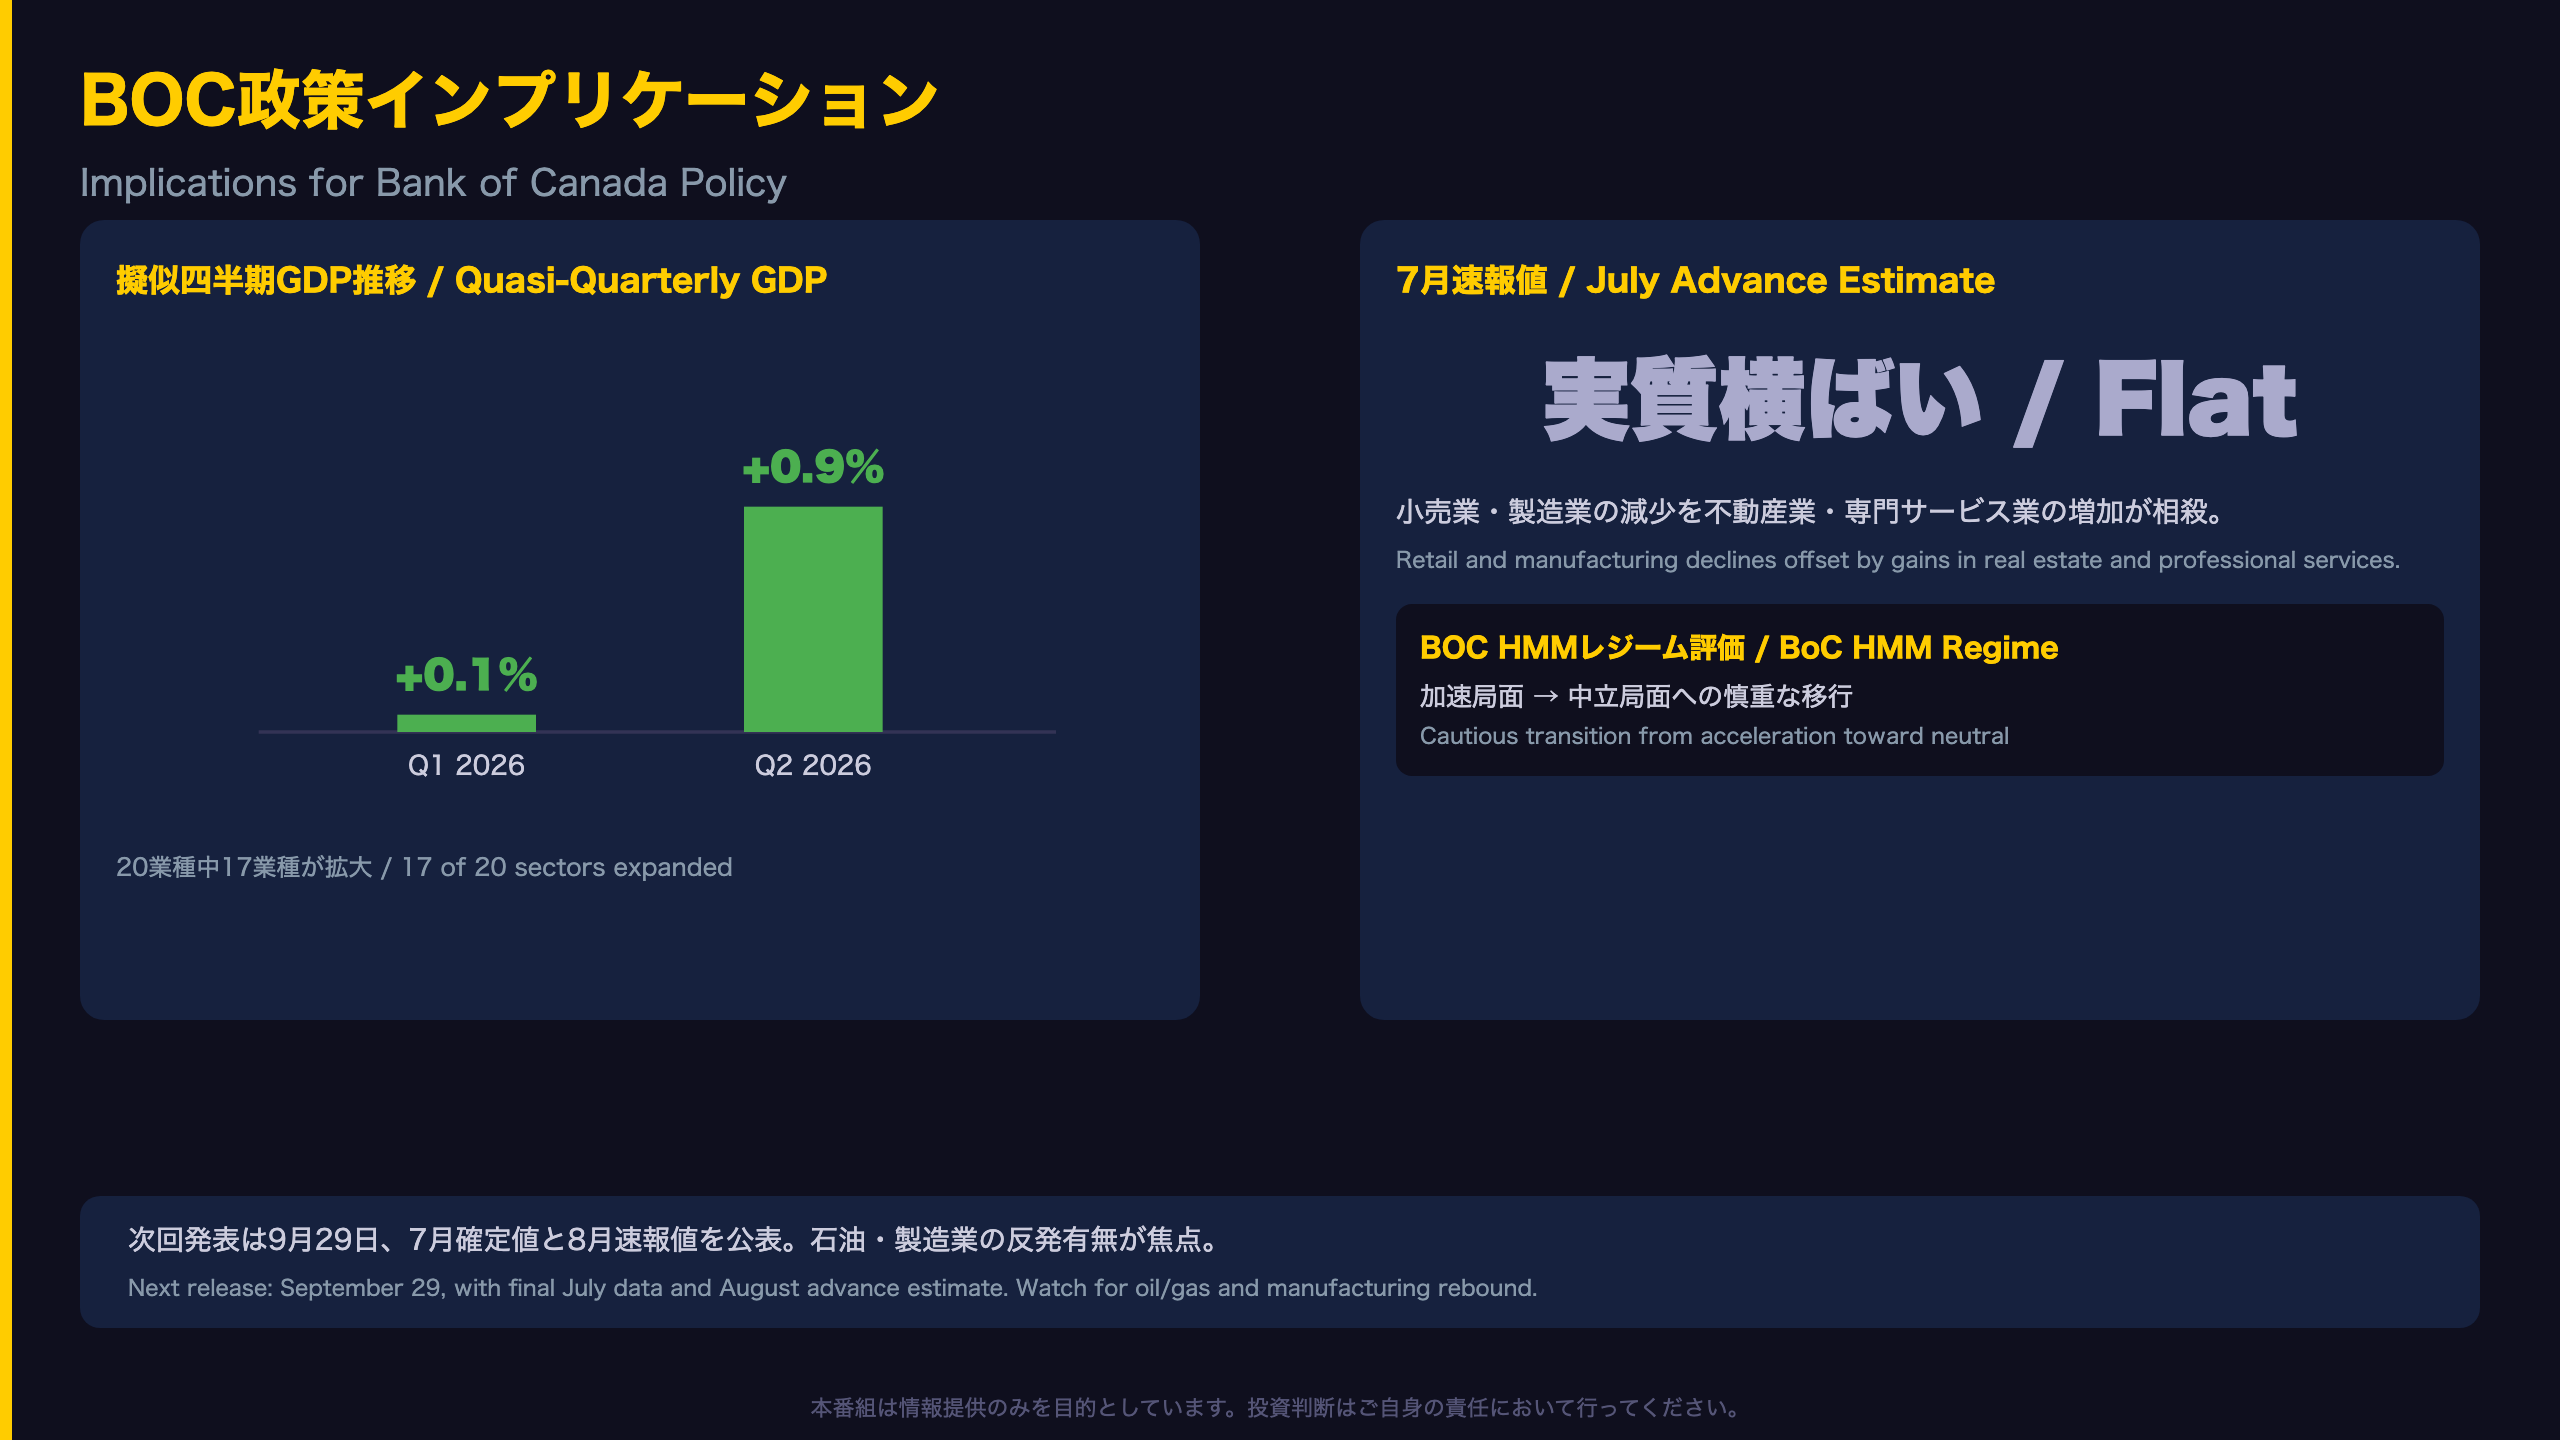
This release feeds directly into the Bank of Canada’s monetary policy assessment framework, and can be interpreted as an update to the observed variable underlying growth-regime models such as Hidden Markov Model (HMM) approaches to Canadian GDP tracking.
The Case for Acceleration
Q2 2026 industry-based GDP grew 0.9%, a clear acceleration from just 0.1% in Q1, with breadth to match: 17 of 20 industrial sectors expanded. StatCan notes that “GDP by industry rose 0.9% in the second quarter of 2026 after edging up 0.1% in the previous quarter, as both goods-producing and services-producing industries expanded in the quarter” — a broad-based, two-sided expansion that central bank watchers typically view favorably.
The Case for Caution
Counterbalancing this, the July advance estimate indicates “real GDP was essentially unchanged,” with retail trade and manufacturing declines offsetting gains in real estate and professional/scientific/technical services. This preliminary figure will be finalized on September 29, 2026.
Two Readings, One Dataset
A bullish reading emphasizes the Q2 acceleration and broad sectoral participation as evidence of underlying domestic demand resilience — relevant context for BoC officials weighing whether current policy settings remain appropriately calibrated. A more cautious reading notes that July’s flat print, following three consecutive monthly gains through June, could reflect the fading of temporary supports (including a modest FIFA World Cup boost to hospitality-adjacent sectors) and a payback in resource-sector activity after an unusually strong drilling season.
What This Means for CAD and Rates Markets
For CAD, the acceleration in headline growth is a moderately supportive data point, but is unlikely on its own to shift the Bank of Canada’s policy stance, given the offsetting signal from the flat July advance estimate. Markets will likely treat this release as consistent with a neutral-to-cautiously-optimistic growth regime rather than a decisive hawkish or dovish trigger.
Next Release
The next release is scheduled for September 29, 2026, featuring finalized July data alongside an August advance estimate. Watch for whether oil and gas activity and manufacturing rebound, which would help confirm whether June’s growth streak resumes or July’s pause proves more durable.
Disclaimer: This article is for informational purposes only. All investment decisions are made solely at your own risk.