📺 Watch the Full Video Analysis
This article was automatically generated by the NFC Market Live AI analysis system. (Updated: 2026-09-27 10:09 JST)
📊 This week’s NFC Programming Review.
Only 6 new videos released (1 short, 5 long-form) — the fewest of the period.
Still, one short on the US current account deficit hit 256 views with a 195% view rate.
Meanwhile the long-form version of the same topic scored just 0.0%.
💰 Weekly production cost: ¥1,936 (¥3.11 per view).
📈 28-day trend shows sharp spikes on Sep 16 & 18 — with no scheduled initiatives behind them.
We examine viewing data and cost efficiency to set direction for next week.
オープニング:今週の全体像
This Week’s Snapshot
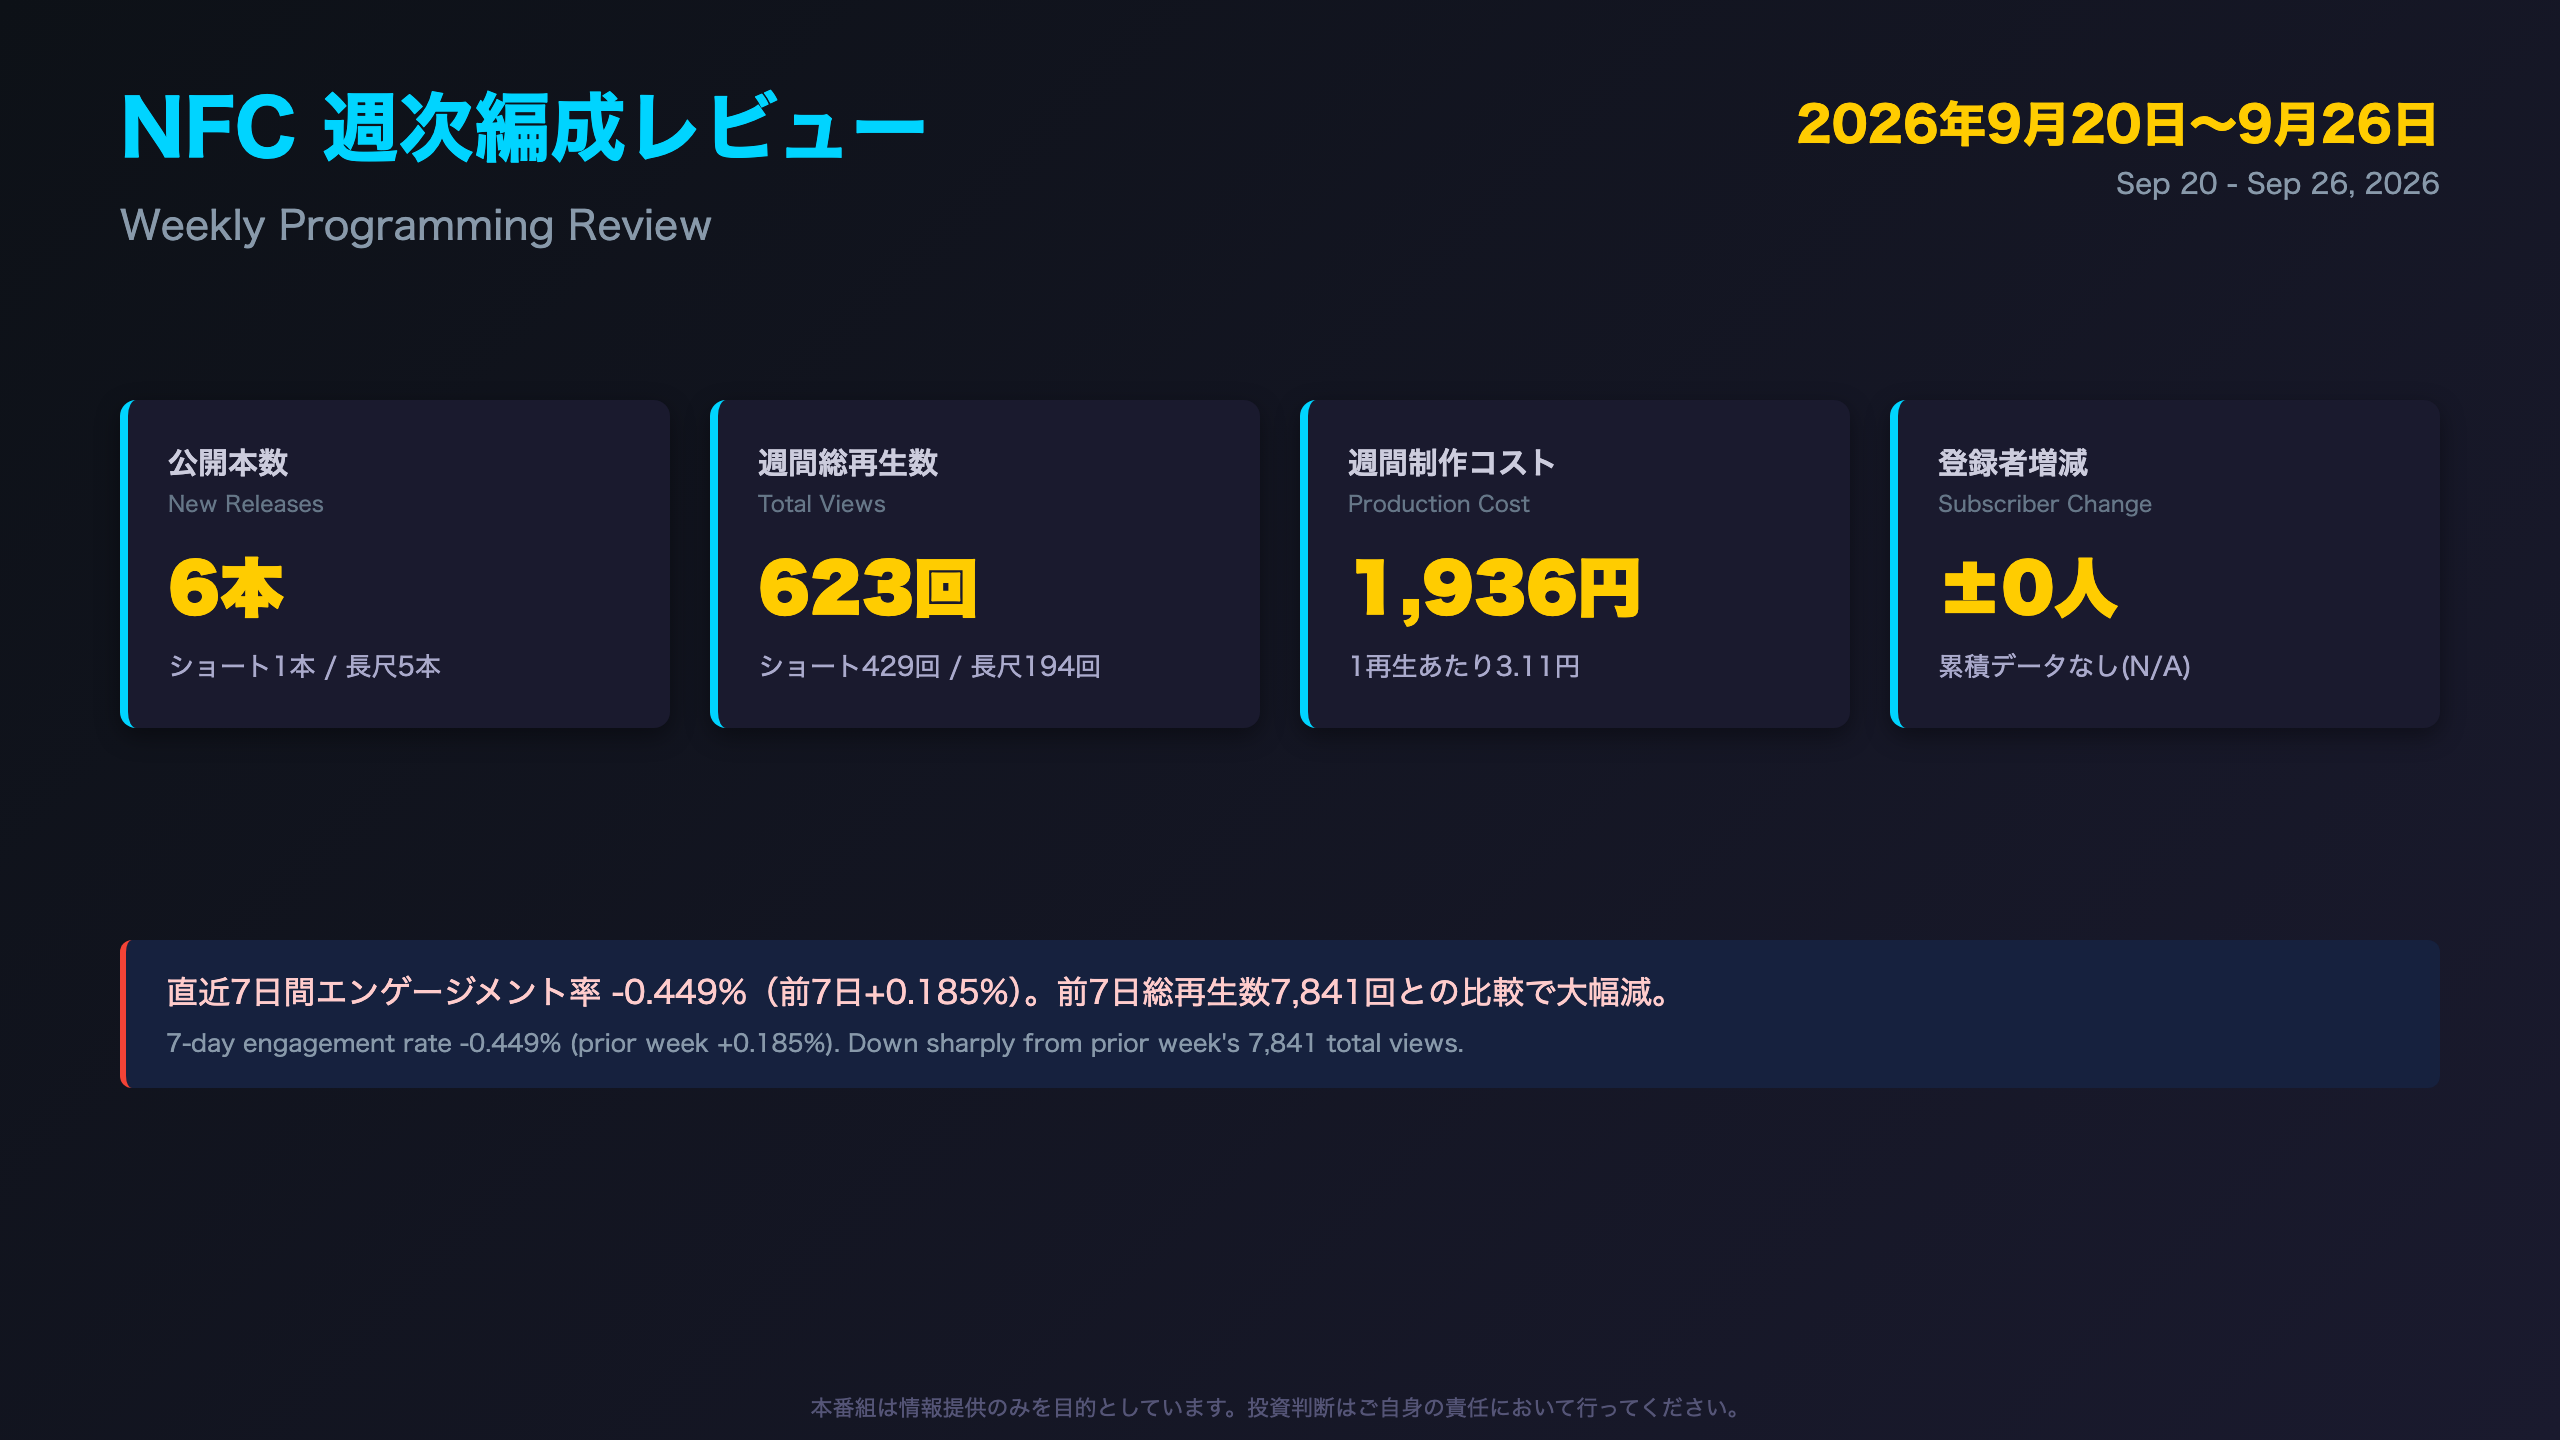
For the review period of September 20-26, 2026, NFC Market Live published just six new videos — one Short and five long-form pieces. This is a notably light release week compared to typical output, suggesting a shift toward recycling existing content rather than heavy new production.
Key Numbers
- Total weekly views: 623 (429 Shorts, 194 long-form)
- Weekly production cost: ¥1,936 (¥3.11 per view)
- Subscriber change: +0
- 7-day engagement rate: -0.449%, down from +0.185% the prior week — a swing into negative territory worth watching
Context for International Readers
Unlike traditional Japanese broadcast metrics, YouTube Analytics (used here) tracks granular retention data down to the second. A negative engagement rate is unusual and typically reflects unsubscribes or negative interactions outweighing likes/comments — a signal channel operators watch closely, akin to a “net promoter score” dipping below zero in Western media analytics.
Week-over-Week Comparison
The prior 7-day period saw 7,841 total views versus this week’s 623 — a roughly 92% drop. However, the prior week likely coincided with major US earnings releases and multiple breaking macro events, meaning the denominators aren’t perfectly comparable. Readers should treat this as directional context rather than a like-for-like decline.
The following slides examine how the handful of new releases performed individually — a small sample that nonetheless offers instructive signal for content strategy.
今週新規ショート動画 成績
What the Only New Short Revealed
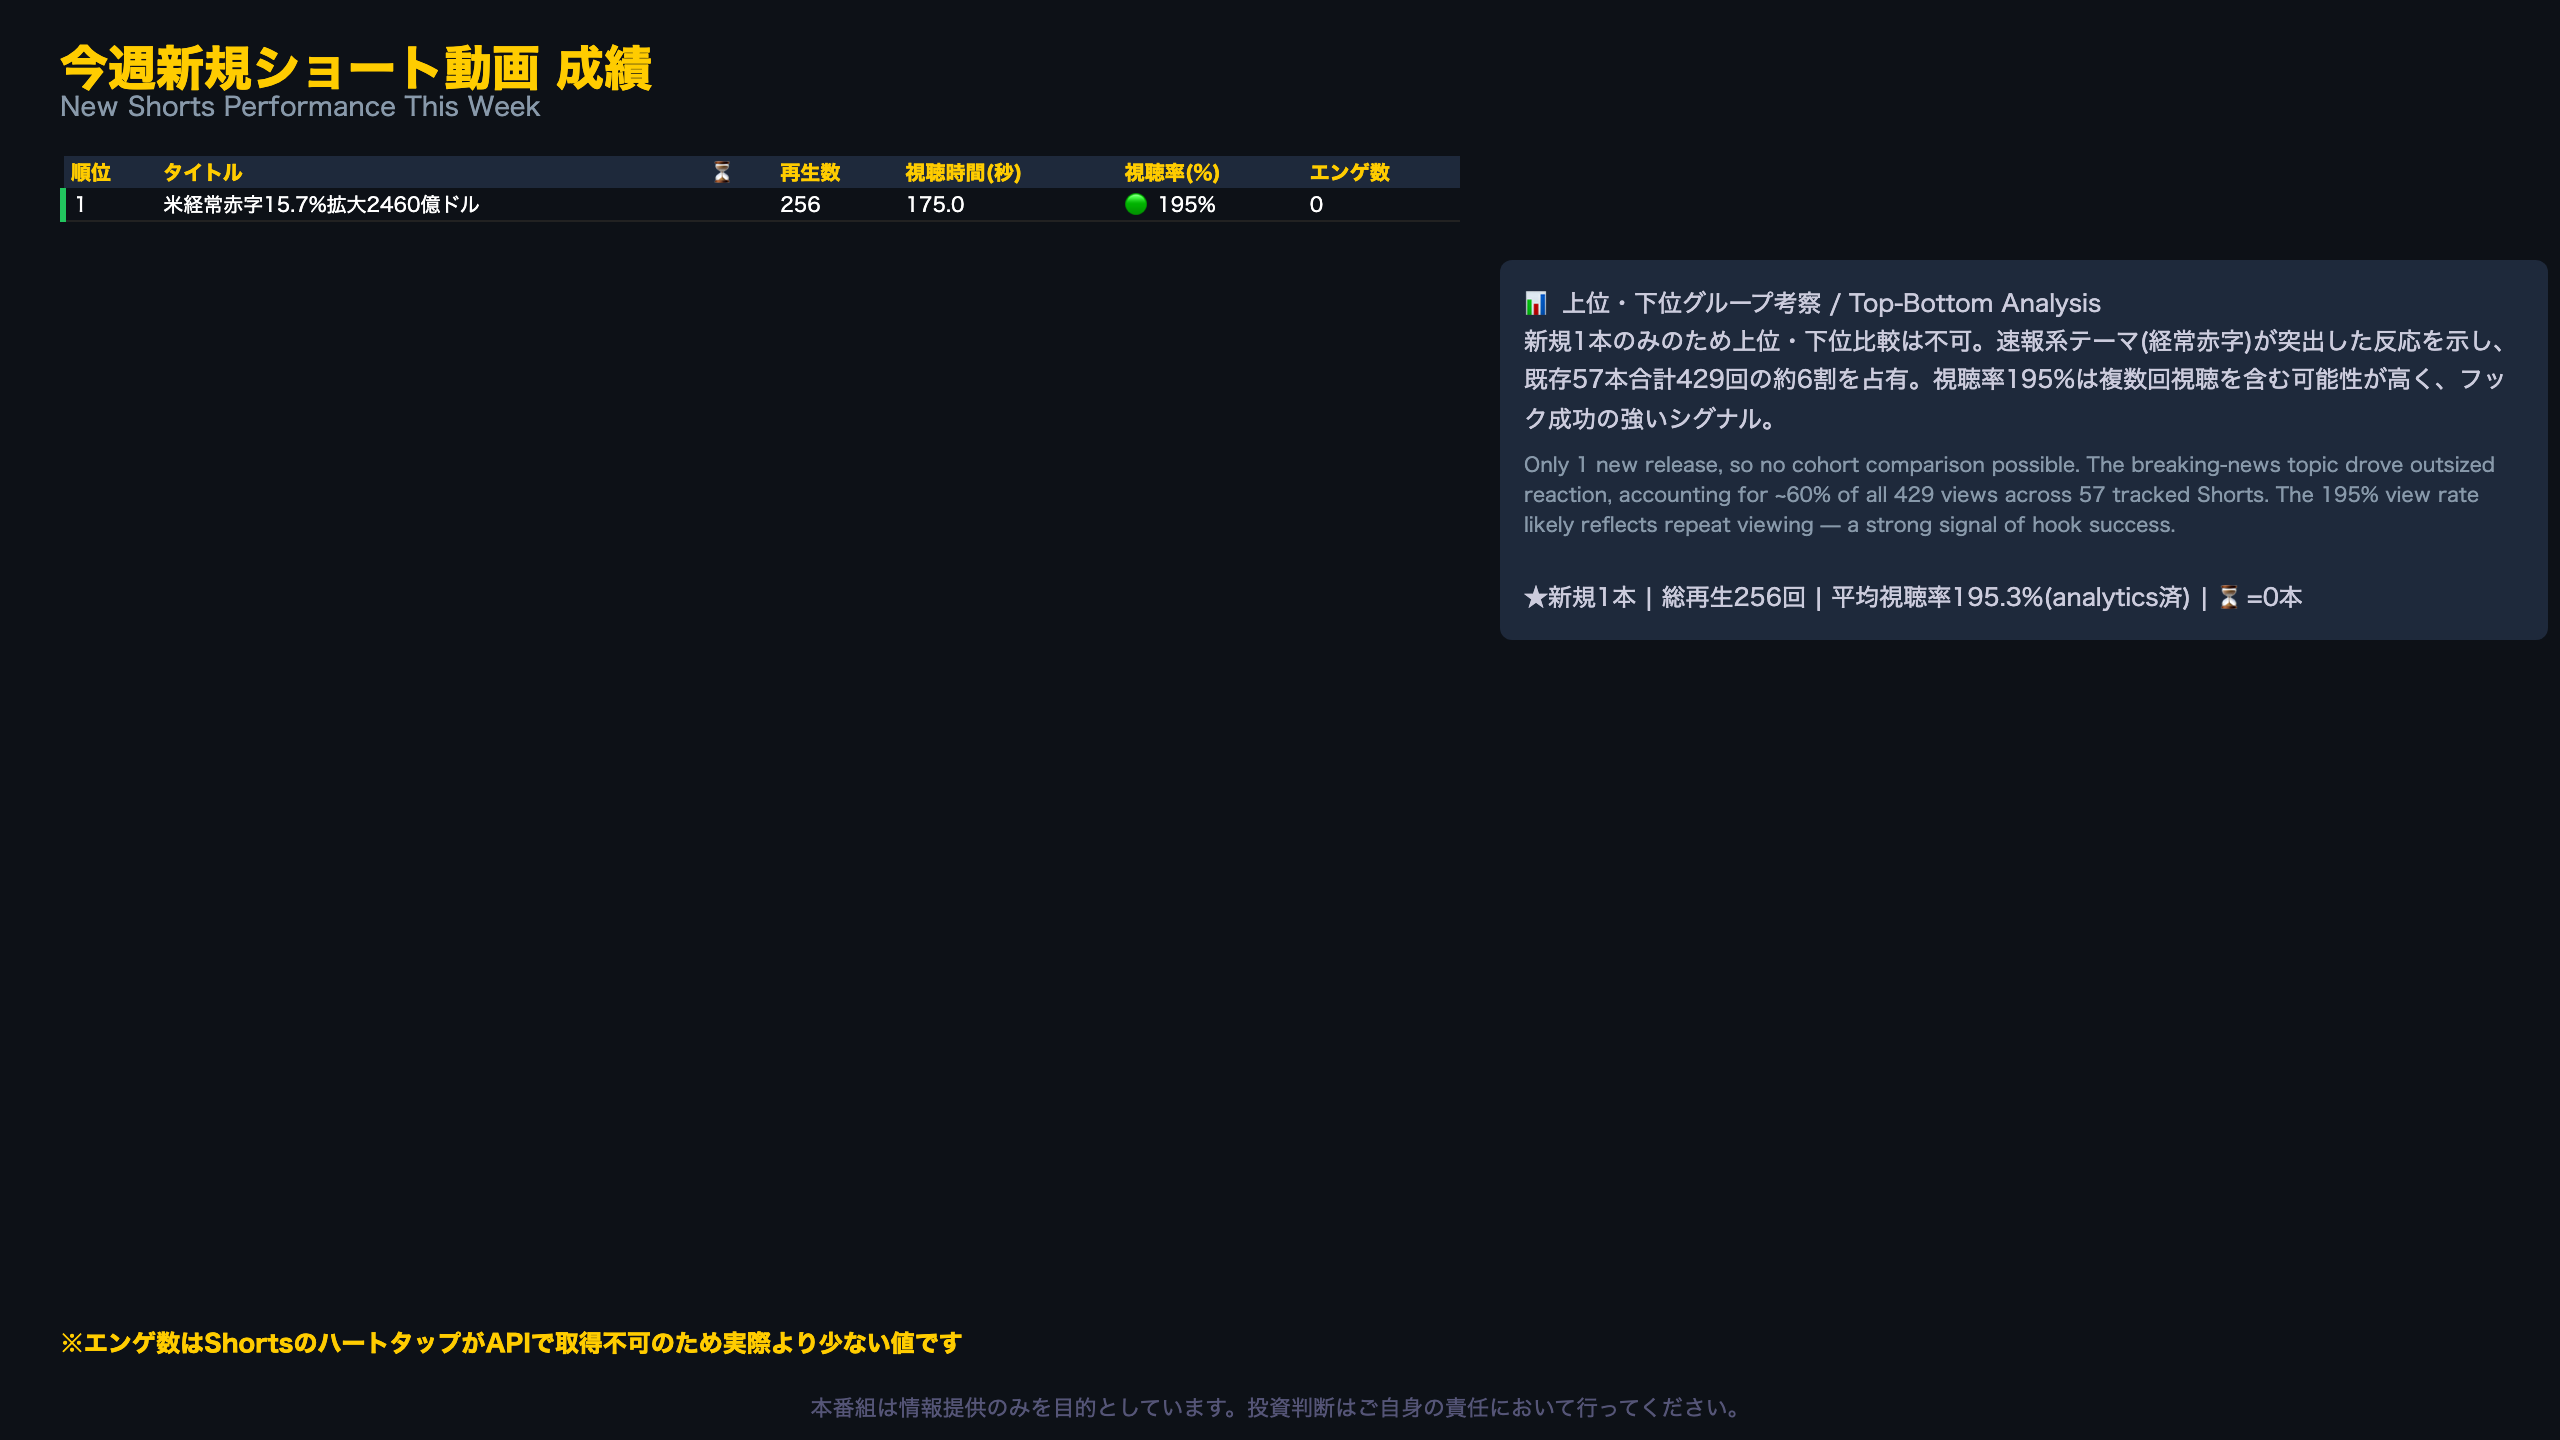
This week produced just one new Short: a breaking-news piece on the US current account deficit widening 15.7% to $246 billion, with NIIP hitting a record deficit. It posted 256 views, an average watch time of 175 seconds, and a 195.3% view rate — an outlier figure worth unpacking.
Understanding a 195% View Rate
YouTube Shorts view rate is calculated as total watch time divided by video length, meaning rates above 100% occur when viewers loop or rewatch the clip. This isn’t simply “completed viewing” — it more likely signals repeat engagement, a stronger retention signal than a single pass-through. For context, US financial news Shorts on channels like Bloomberg or CNBC rarely report such figures publicly, but internal industry benchmarks suggest anything above 100% view rate is considered exceptional.
Benchmarking Against the Library
Across all 57 tracked Shorts (new and existing), total views reached 429. This single new release accounted for roughly 60% of that total — underscoring how concentrated breaking-news appeal can be in a slow release week.
A Limitation Worth Noting
With only one new release, a meaningful top-vs-bottom cohort comparison isn’t statistically possible this week. Among existing Shorts, a Bank of Japan press conference recap drew 90 views but only a 19.7% view rate — suggesting the hook worked but retention did not, a useful contrast case.
Looking Ahead
The key question for next week is whether new Short output rebounds from just one release, and whether the channel leans further into breaking-news formats given this week’s clear demand signal.
今週新規長尺動画 成績
Five New Long-Form Videos, a Tale of Two Outcomes
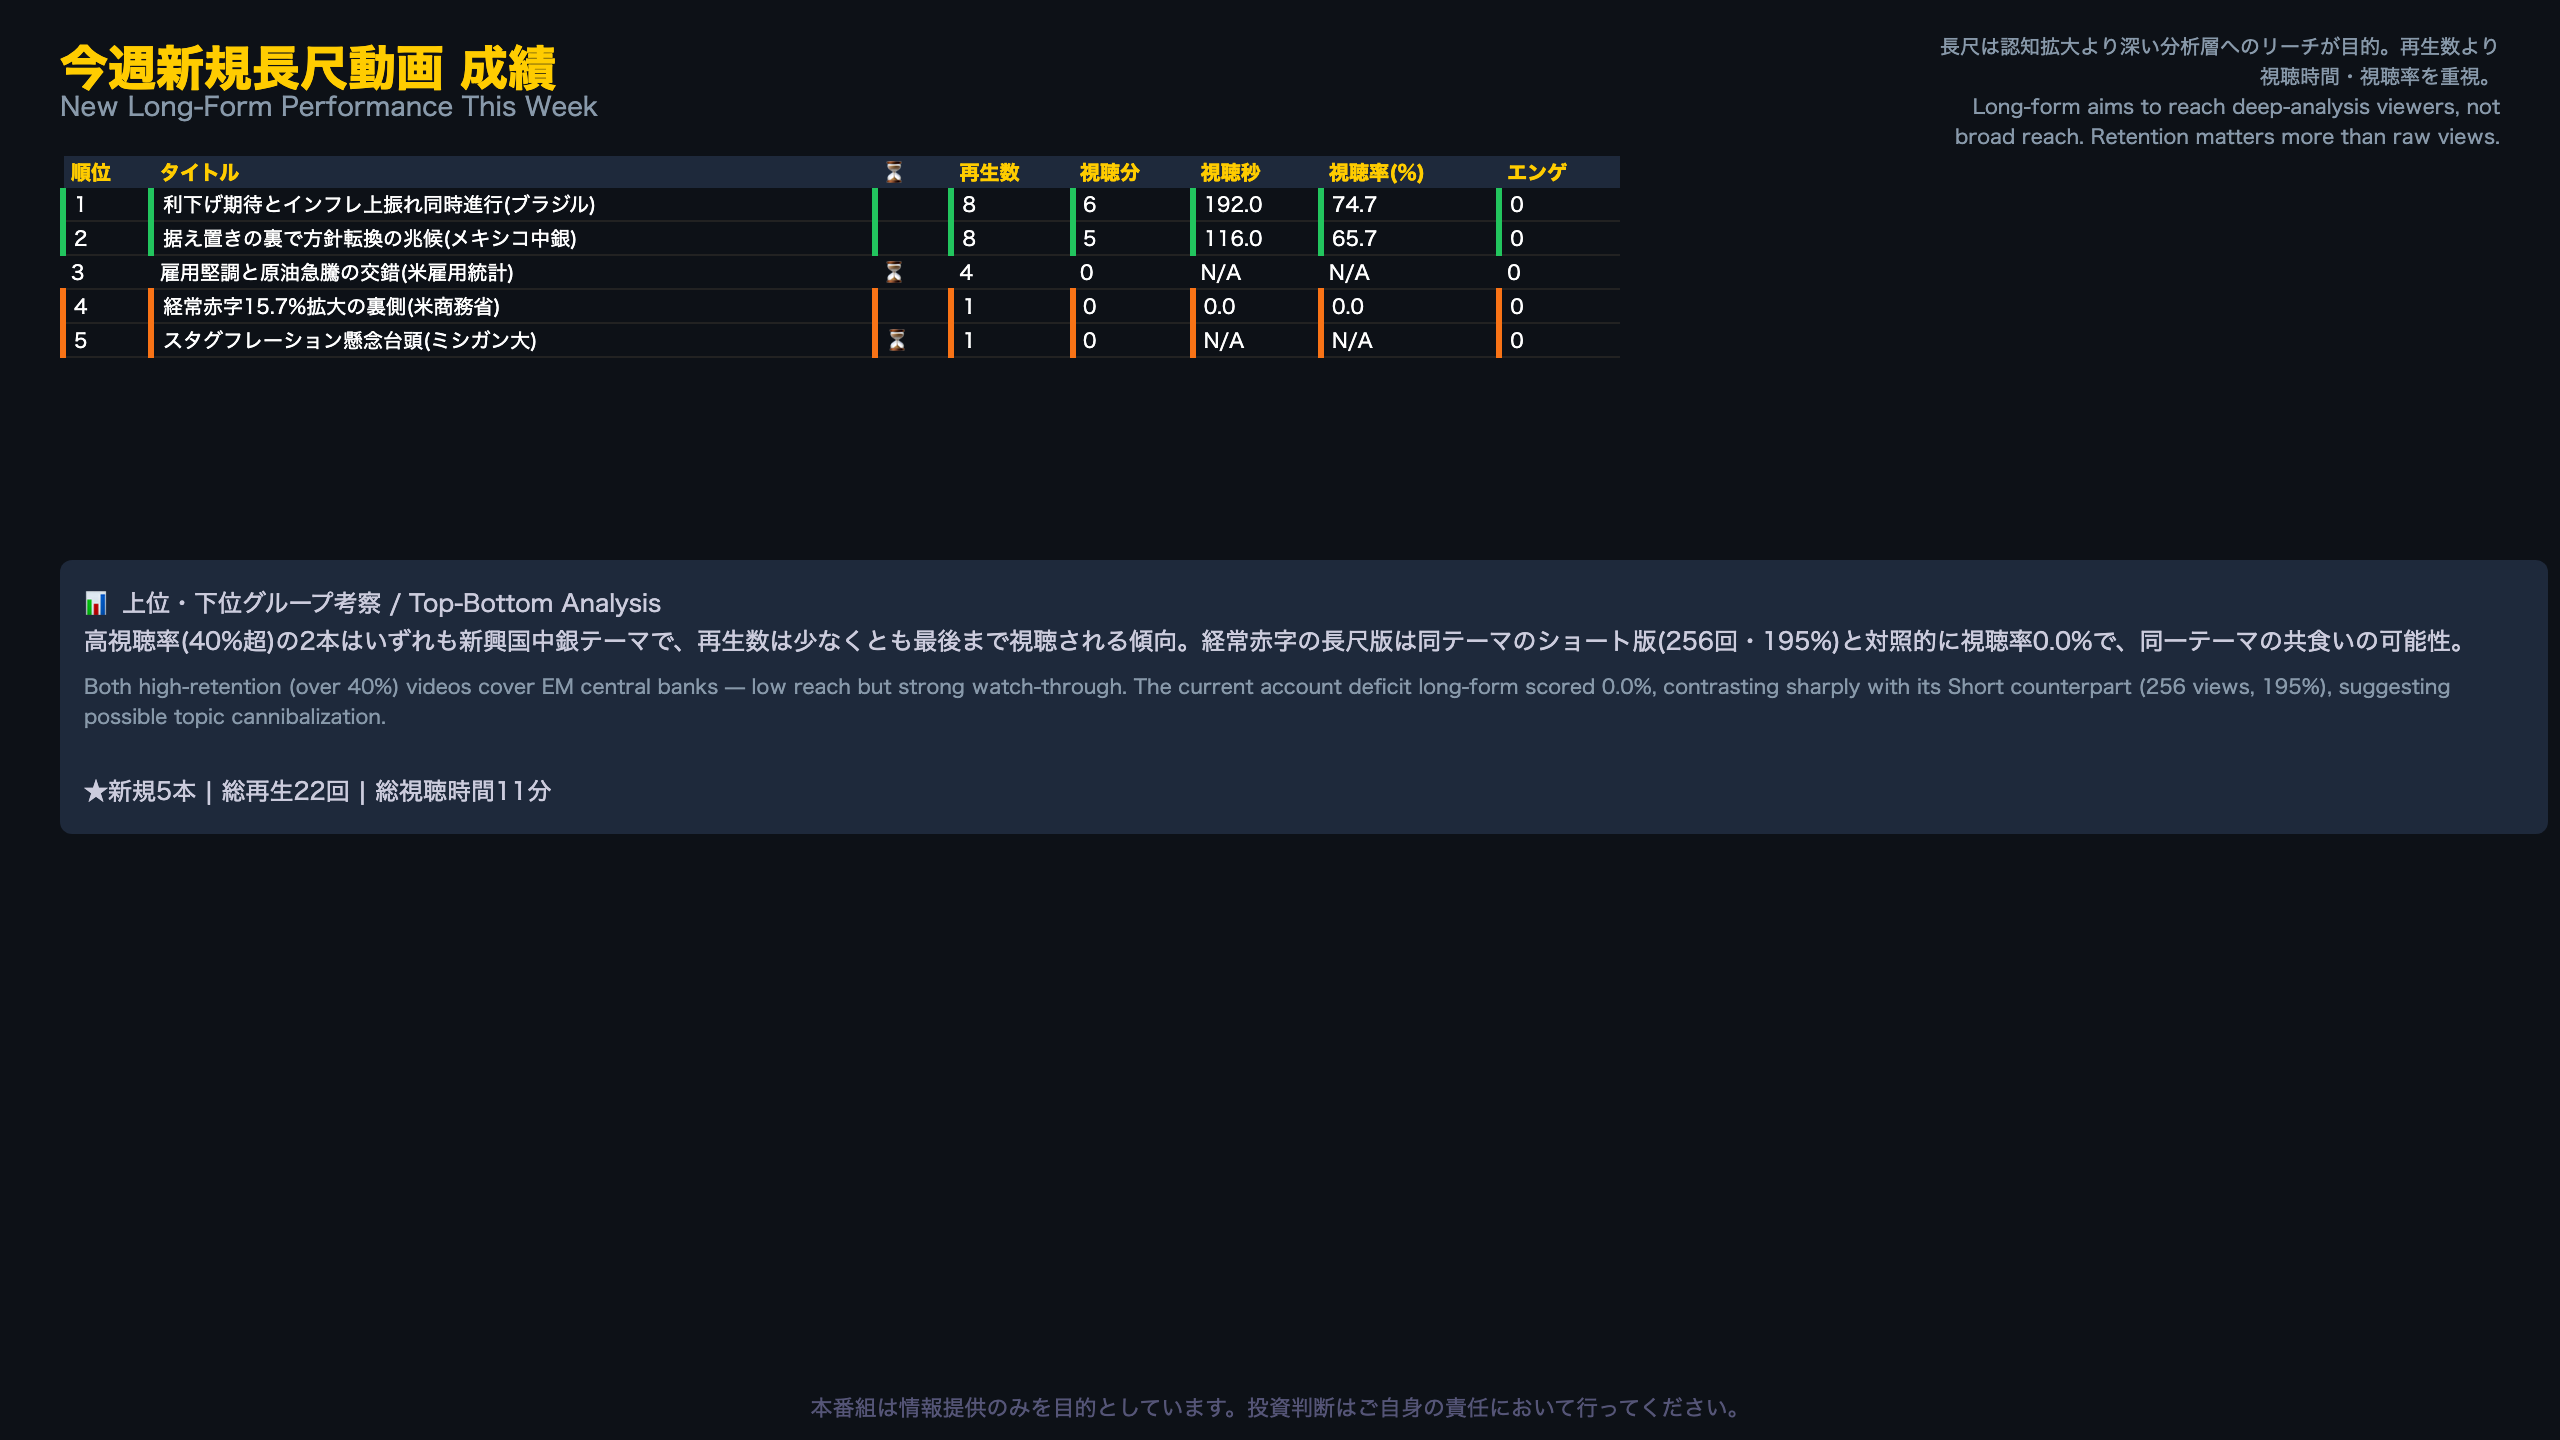
This week’s five new long-form releases totaled just 22 views and 11 minutes of combined watch time. But retention data reveals a clear split between winners and laggards.
High-Retention Winners: Central Bank Deep Dives
- Brazil Central Bank (Selic policy): 8 views, 74.7% view rate
- Mexico Central Bank (Banxico): 8 views, 65.7% view rate
Both videos had single-digit view counts but retention well above 40% — a level rarely seen even among established finance YouTube channels covering emerging-market central banks. This suggests these long-form deep dives are reaching a small but highly engaged niche audience interested in EM monetary policy, comparable to how specialized Bloomberg Terminal-style content retains a narrow but loyal viewership.
The Cannibalization Case
The long-form video on the US current account deficit (“15.7% widening”) managed only 1 view with a 0.0% view rate — a striking contrast to its Short counterpart, which drew 256 views and a 195% view rate in the same week. This pattern suggests breaking macro news may be fully consumed via Shorts, leaving little residual demand for a long-form deep dive on the identical topic — an important content-strategy signal (moderate confidence, single-week observation).
Two Videos Still Pending
Two releases — on US jobs/oil price dynamics and stagflation concerns (Michigan survey) — don’t yet have confirmed analytics due to reporting lag; figures should be available in next week’s review.
Context
The five new releases contributed only about 11% of total long-form views (22 of 194) across the full library of 55 tracked long-form videos this week, underscoring how much of the channel’s traffic still comes from evergreen back-catalog content rather than fresh releases.
28日間 チャンネル成長トレンド
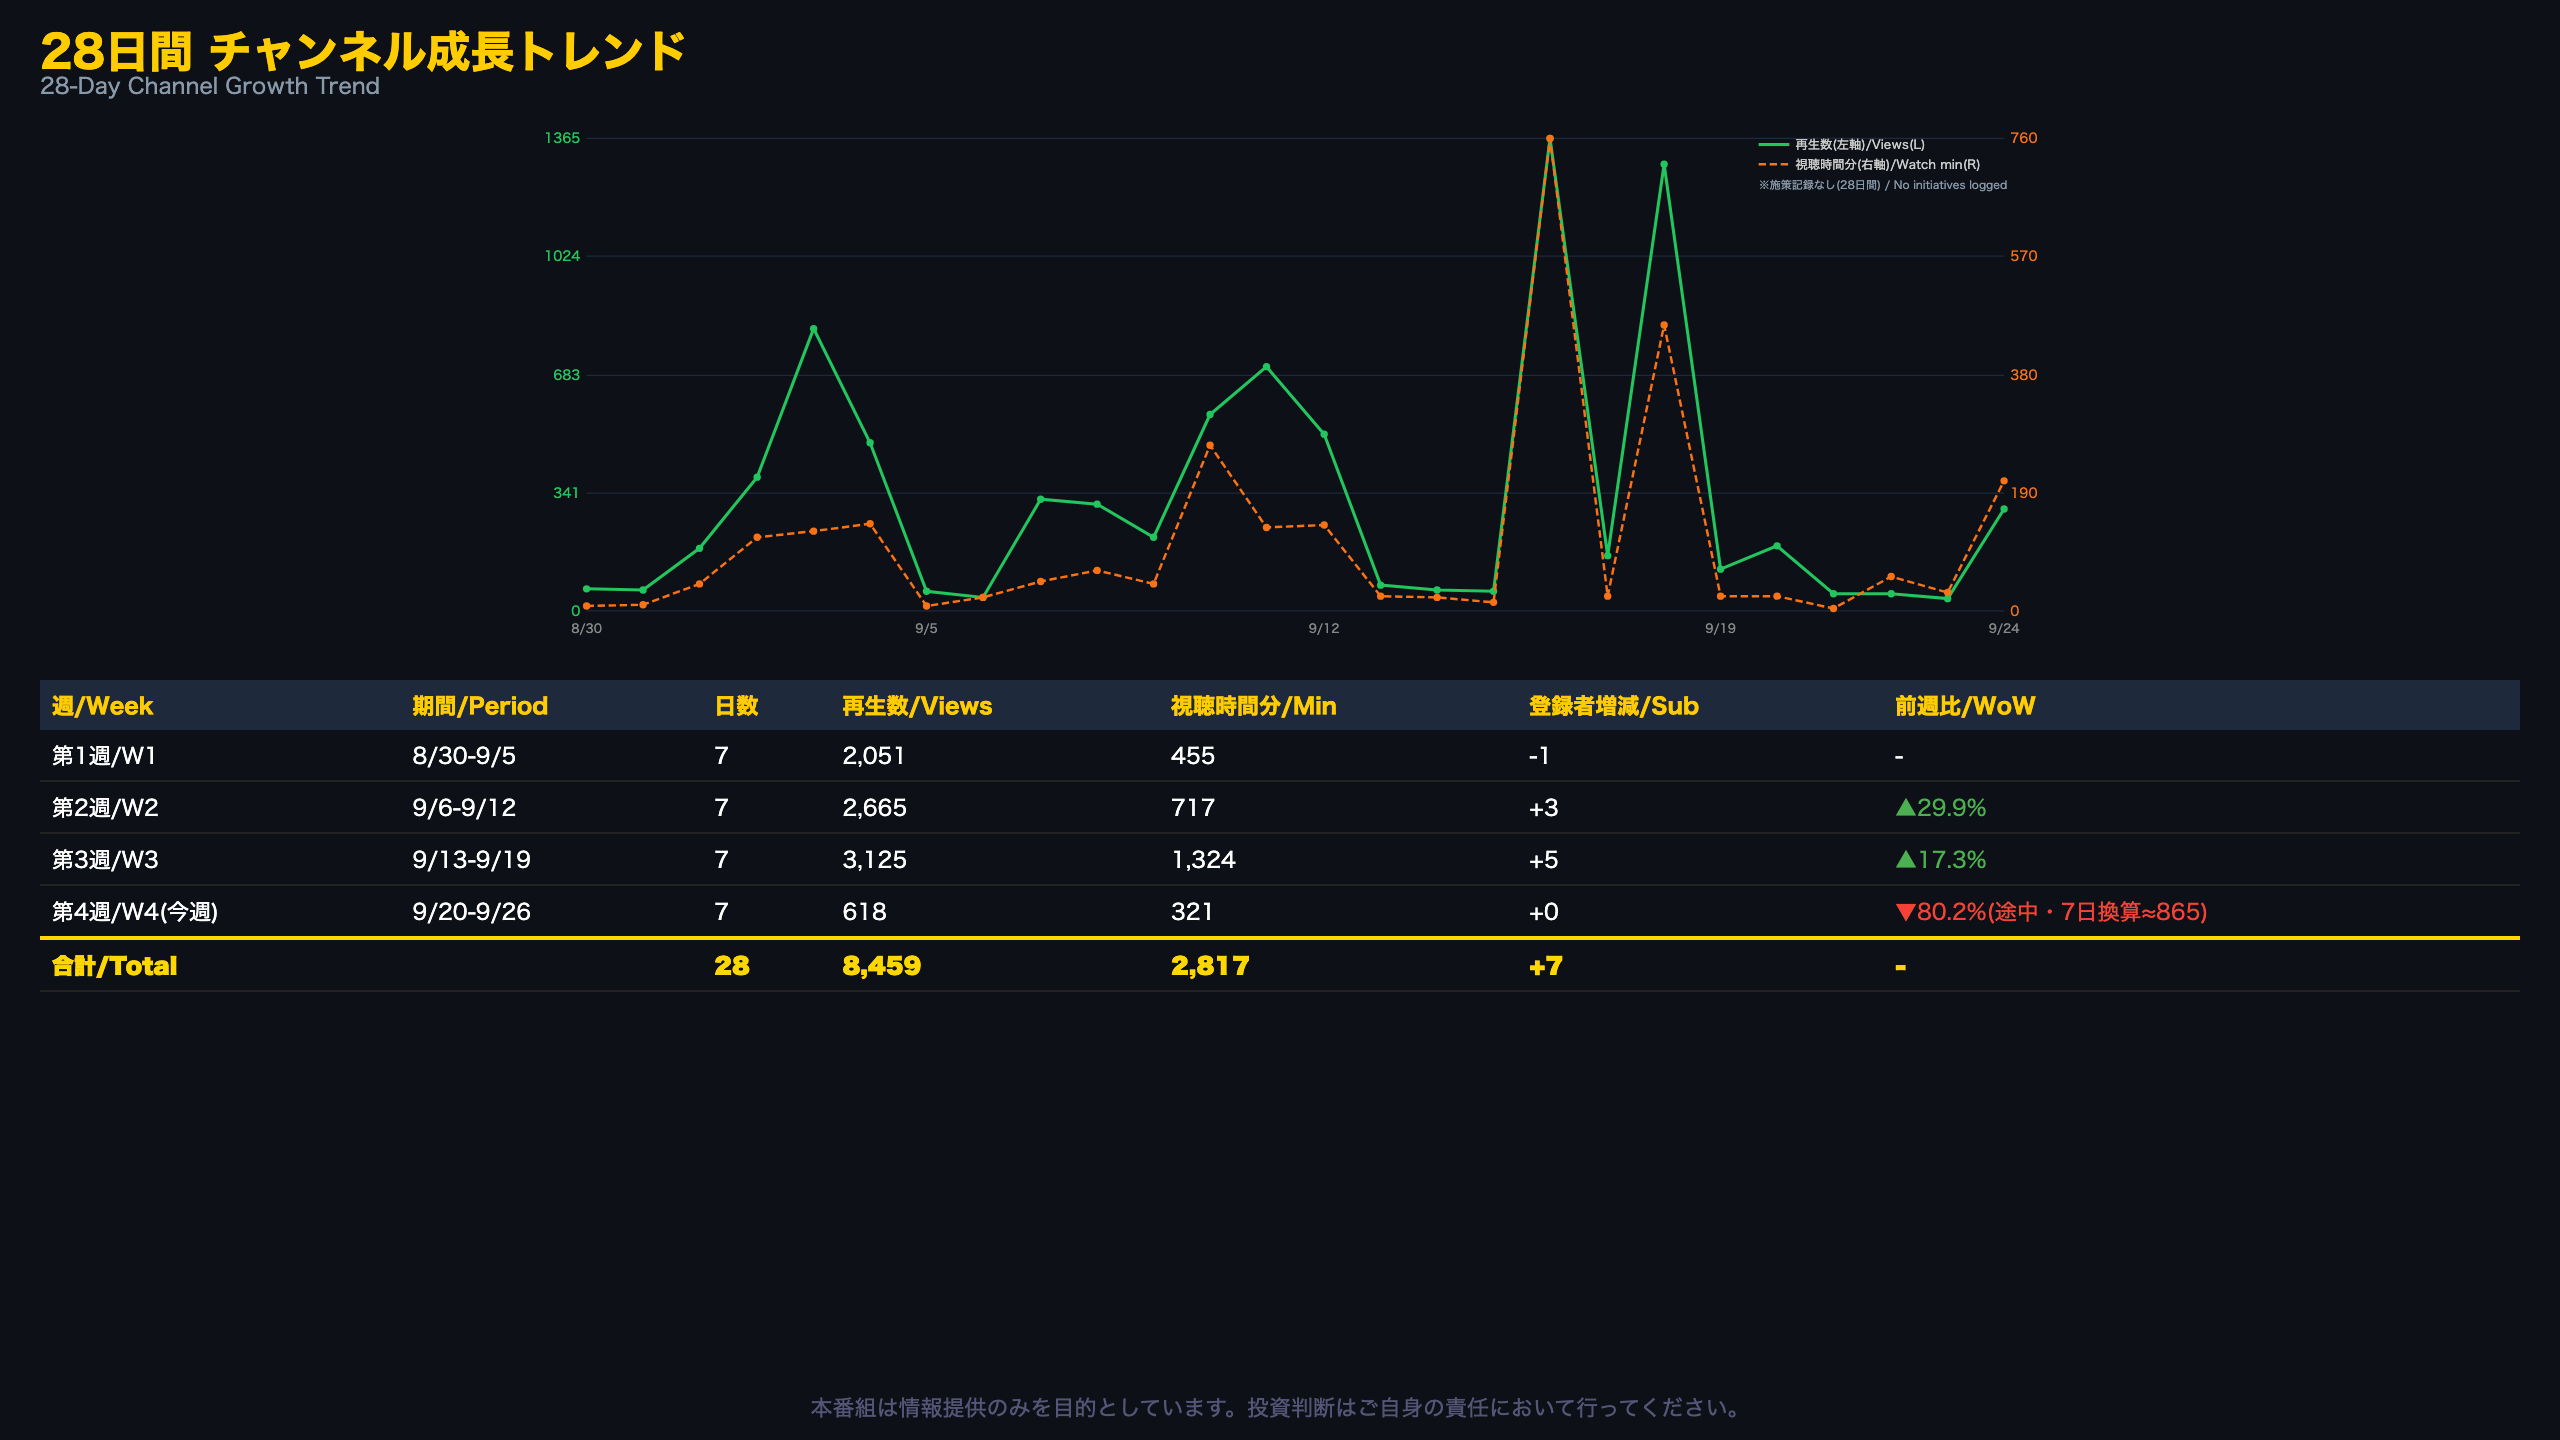
Anatomy of the 28-Day Trend
While the standard reporting window is 28 days, the final two days (Sep 25-26) remain unconfirmed due to analytics reporting lag. This analysis therefore covers 26 of 28 days — a limitation worth flagging upfront, similar to how US economic data (e.g., BEA GDP) is often released as preliminary/advance estimates before final revisions.
Two Notable Spikes
September 16 (1,365 views, 760 minutes) and September 18 (1,289 views, 460 minutes) stand out sharply from the surrounding baseline. Normalizing for views, September 16 averaged roughly 33 seconds of watch time per view versus about 21 seconds on the 18th — suggesting the September 16 content achieved deeper viewer immersion, not just a traffic spike (moderate-confidence, cross-metric observation).
No Scheduled Initiatives Behind the Spikes
Critically, the programming initiative log for this period states explicitly: “no initiatives recorded in this 28-day window.” This means the spikes are best attributed to organic factors — a heavy earnings/macro news calendar or simply strong content-market fit — rather than any deliberate promotional push. This is an important distinction for content strategy: organic spikes are harder to replicate on demand than promotion-driven ones.
Weekly Trend Table
| Week | Views | Watch Time (min) | WoW Change |
|---|---|---|---|
| Week 1 | 2,051 | 455 | – |
| Week 2 | 2,665 | 717 | +29.9% |
| Week 3 | 3,125 | 1,324 | +17.3% |
| Week 4 (this week) | 618 | 321 | -80.2% (partial data, ~865 on a 7-day run-rate basis) |
Views and watch time climbed steadily through Weeks 2-3 before a sharp Week 4 pullback. However, Week 4 data only runs through Sep 24, and the 7-day run-rate estimate of ~865 suggests the apparent decline may be partly a reporting-lag artifact rather than a genuine drop-off.
What to Watch Next
Next week’s review should confirm Sep 25-26 figures and clarify whether the run-rate estimate converges with actuals — a useful check on data reliability going forward.
今週の番組制作コスト分析
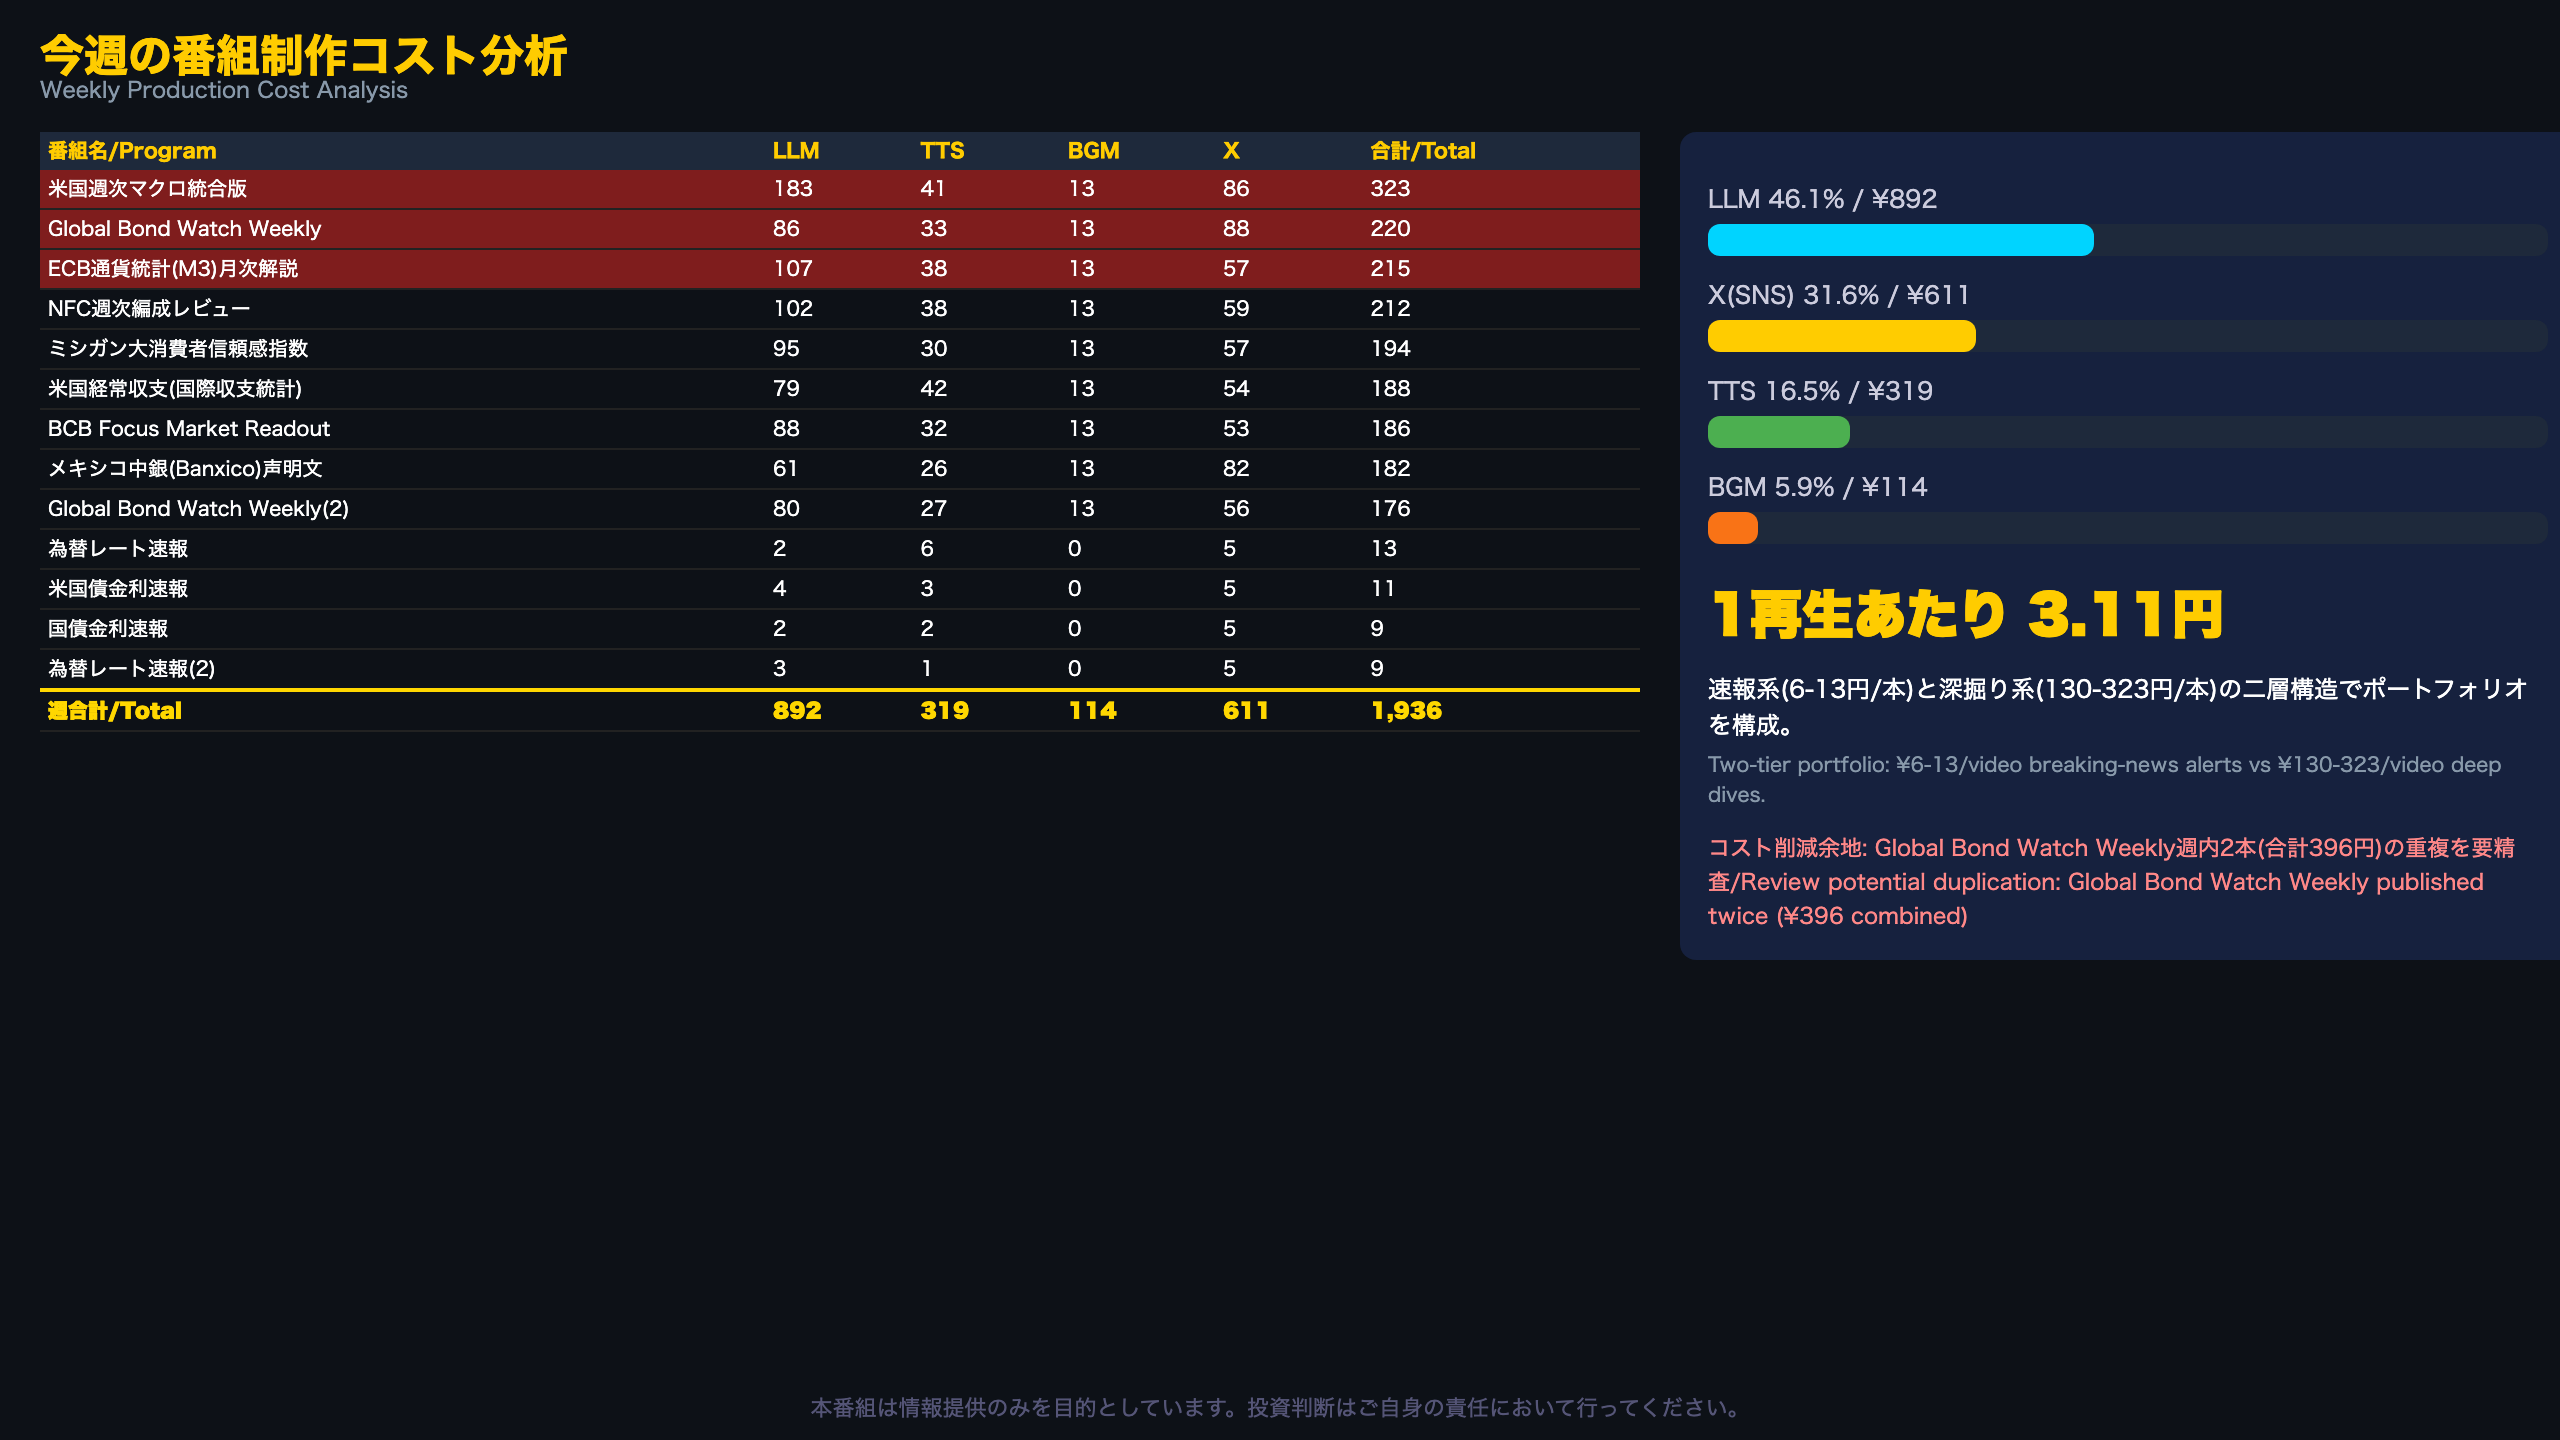
Cost Structure Overview
Total production cost across 13 programs this week reached ¥1,936. The breakdown: LLM ¥892 (46.1%), X/social posting ¥611 (31.6%), TTS ¥319 (16.5%), and BGM ¥114 (5.9%) — meaning LLM and social distribution costs alone account for nearly 78% of total spend, a useful benchmark for content-ops teams thinking about where automation costs concentrate.
Top 3 Costliest Programs
- Weekly Macro Pulse (US): ¥323
- Global Bond Watch Weekly: ¥220
- ECB M3 Monetary Statistics Deep Dive: ¥215
All three are “weekly/monthly roundup” formats that synthesize large volumes of information, naturally driving up LLM processing costs — comparable to how a Bloomberg weekly wrap-up requires more editorial synthesis than a single data-point alert.
The Low-Cost Counterweight
By contrast, four breaking-news alert programs (FX rate flash, US Treasury yield flash, JGB yield flash) cost just ¥6-13 each — less than one-twentieth the cost of the deep-dive tier. This two-tier structure suggests a deliberate portfolio strategy: cheap, scalable breaking-news alerts paired with costlier, higher-value deep dives for niche audiences.
A Duplication Worth Flagging
Global Bond Watch Weekly was published twice this week (¥220 + ¥176 = ¥396 combined) — unusual for what is typically framed as a single weekly release. This warrants a review of whether the duplicate publication was an intentional editorial decision or an operational oversight, similar to how media outlets audit redundant wire-service republishing.
Cost Efficiency Snapshot
Against 623 total weekly views, the blended cost-per-view came to ¥3.11. Without a prior-week cost-per-view baseline in this dataset, it’s not possible to determine whether this represents an improvement or deterioration — a gap worth closing in future reviews by tracking this metric over time.
来週の番組制作方針
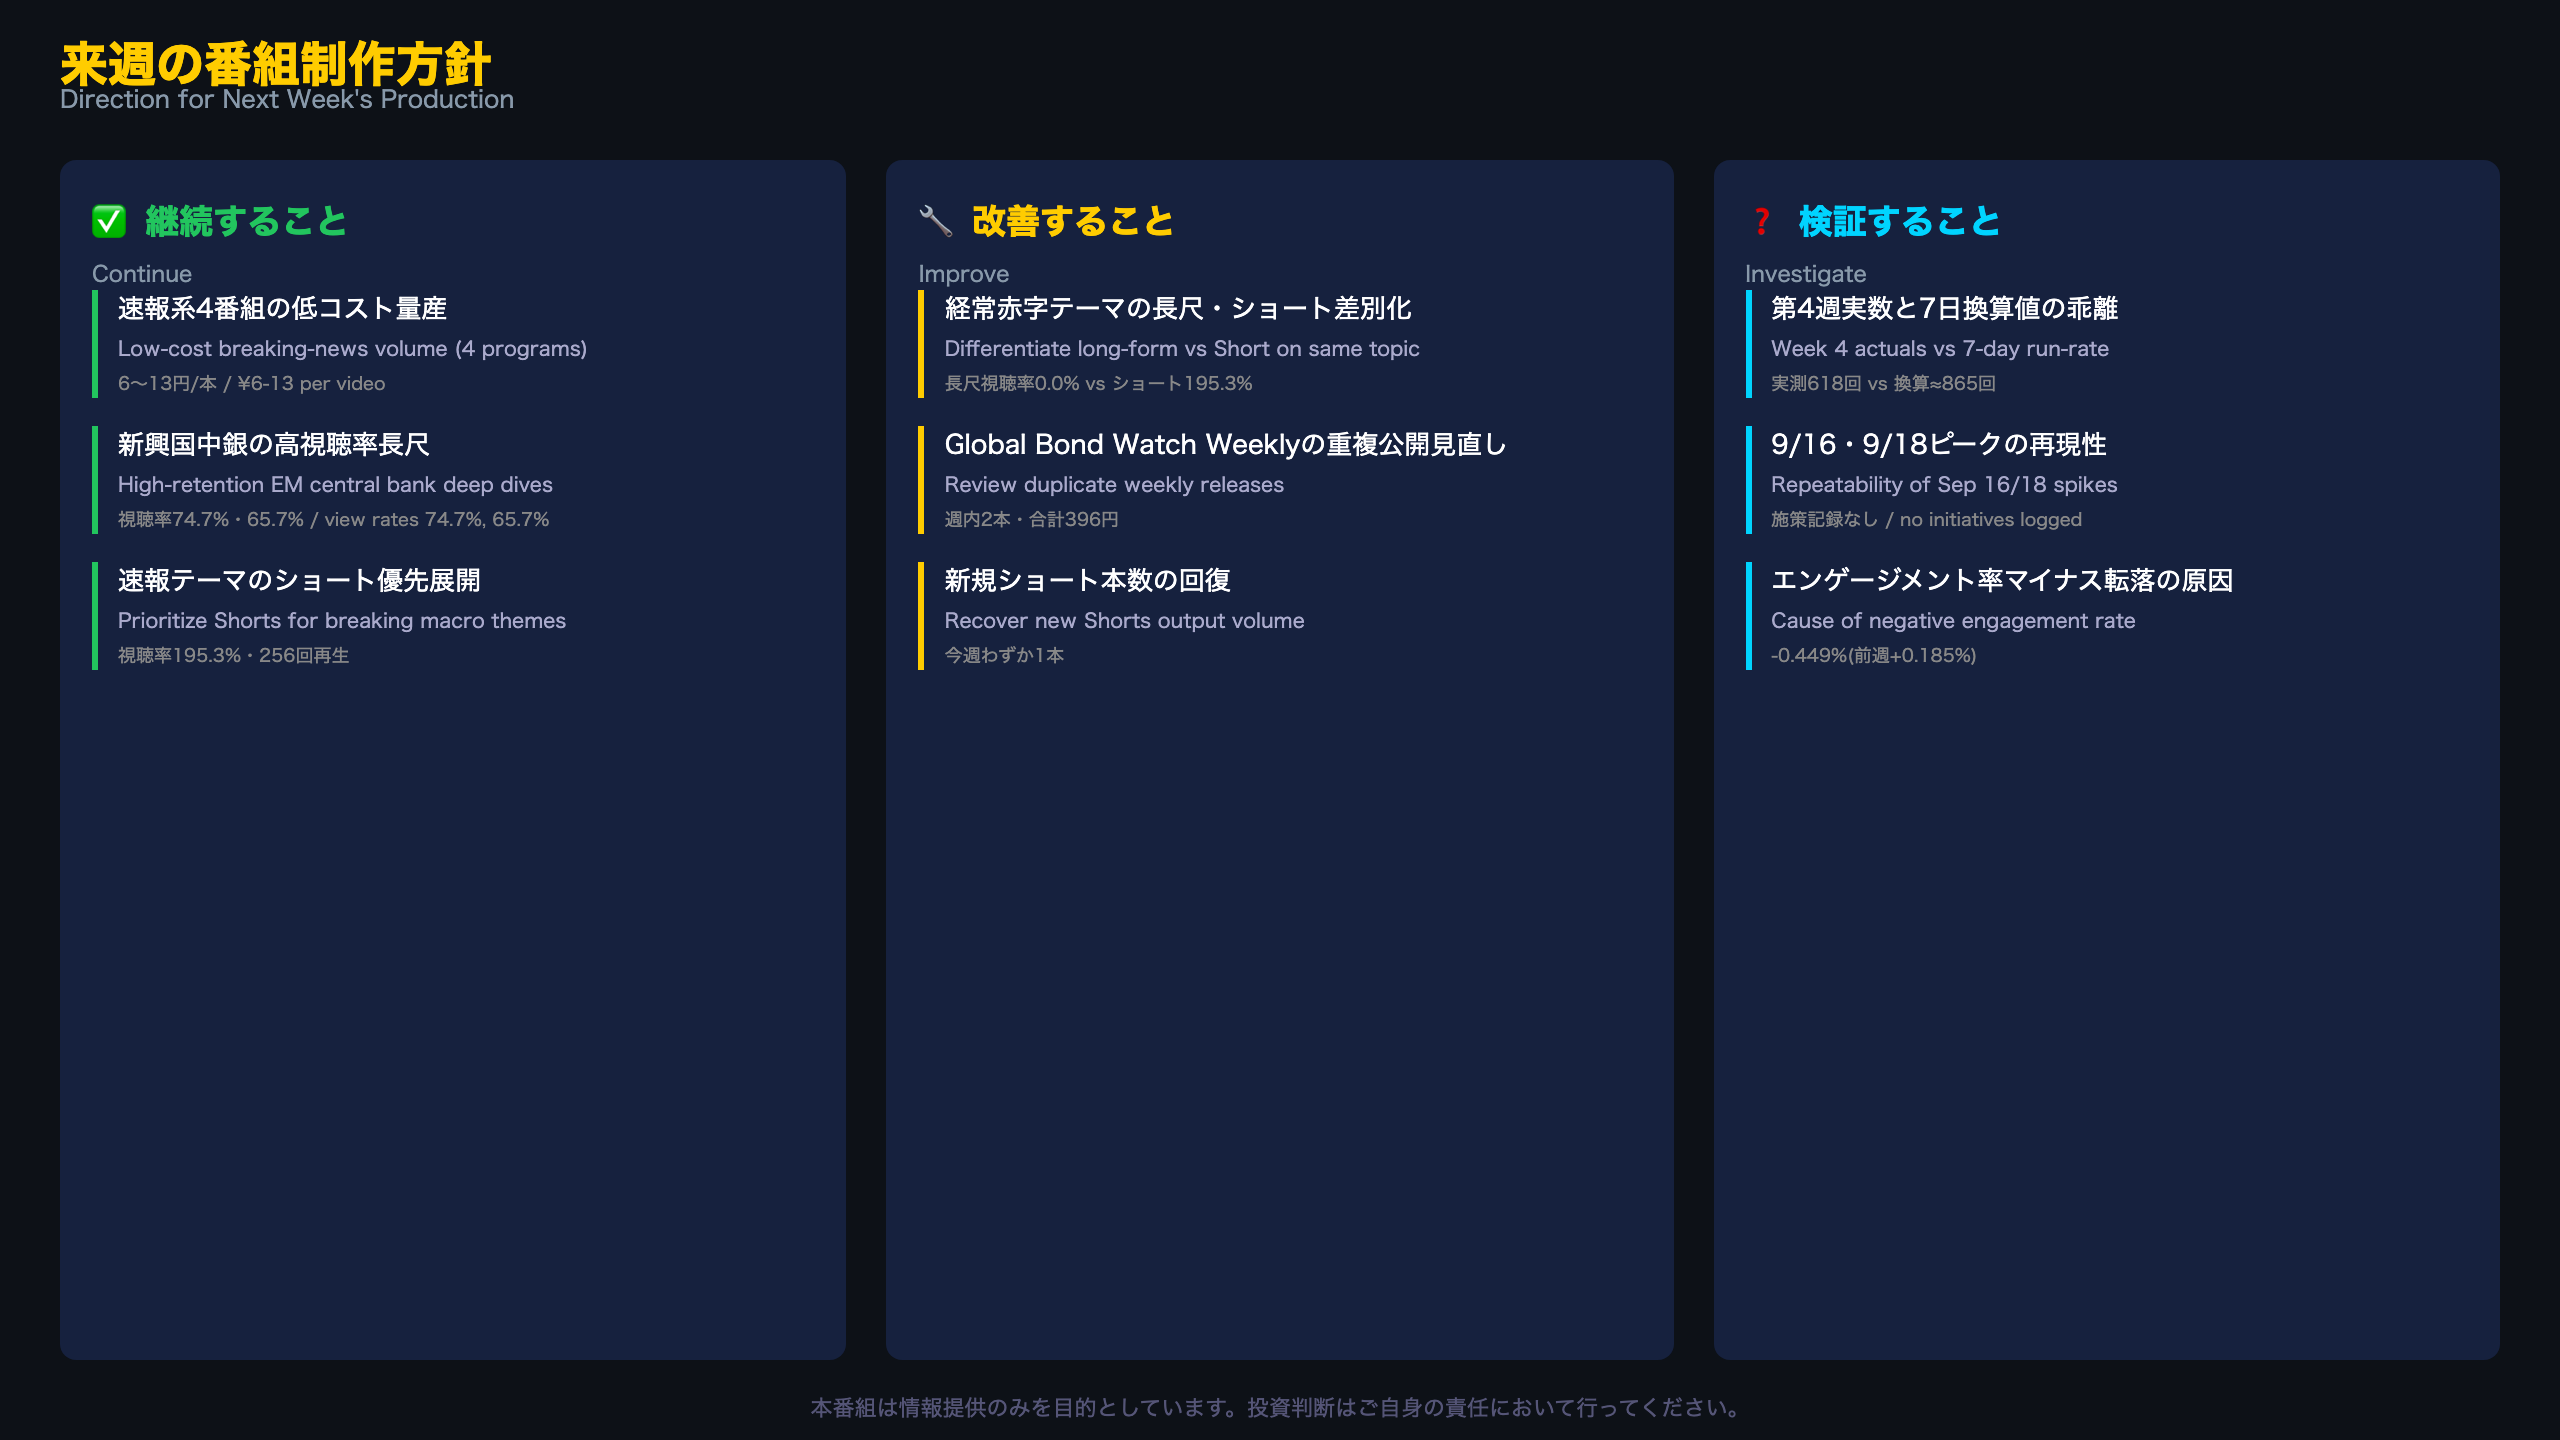
Three Lenses for Next Week
Based on this week’s data, we frame next week’s programming direction across three axes: continue, improve, and investigate.
What to Continue
- The low-cost breaking-news production line (¥6-13 per video across 4 programs)
- Long-form deep dives on emerging-market central banks like Brazil and Mexico (74.7% and 65.7% view rates)
- Prioritizing breaking macro themes like the current account deficit for Shorts (backed by a 195.3% view rate)
What to Improve
- Differentiate long-form treatment of breaking-news topics like the current account deficit, given its 0.0% view rate versus the Short’s success
- Reassess whether Global Bond Watch Weekly needs multiple releases per week (¥396 combined cost this week)
- Address the shortfall in new Short output — just one released this week
What to Investigate
- Whether the Week 4 shortfall closes once Sep 25-26 data is confirmed, versus the ~865 run-rate estimate
- Whether the Sep 16 and Sep 18 spikes reflect a repeatable content pattern, given no scheduled initiatives were behind them
- The root cause of the engagement rate turning negative (-0.449%) this week
As with any content-operations review, these directional calls should be treated as hypotheses to test next week rather than settled conclusions — the kind of iterative, data-driven approach common among digital media newsrooms adjusting to real-time audience feedback.
Viewer comments and feedback will directly inform the “investigate” list in next week’s review.
Disclaimer: This article is for informational purposes only. All investment decisions are made solely at your own risk.