📺 Watch the Full Video Analysis
This article was automatically generated by the NFC Market Live AI analysis system. (Updated: 2026-08-28 08:45 JST)
📄 Primary Source
総務省統計局
https://www.stat.go.jp/data/roudou/sokuhou/tsuki/pdf/gaiyou.pdf
Deep dive into Japan’s July 2026 Labour Force Survey from the Statistics Bureau.
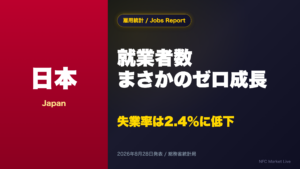
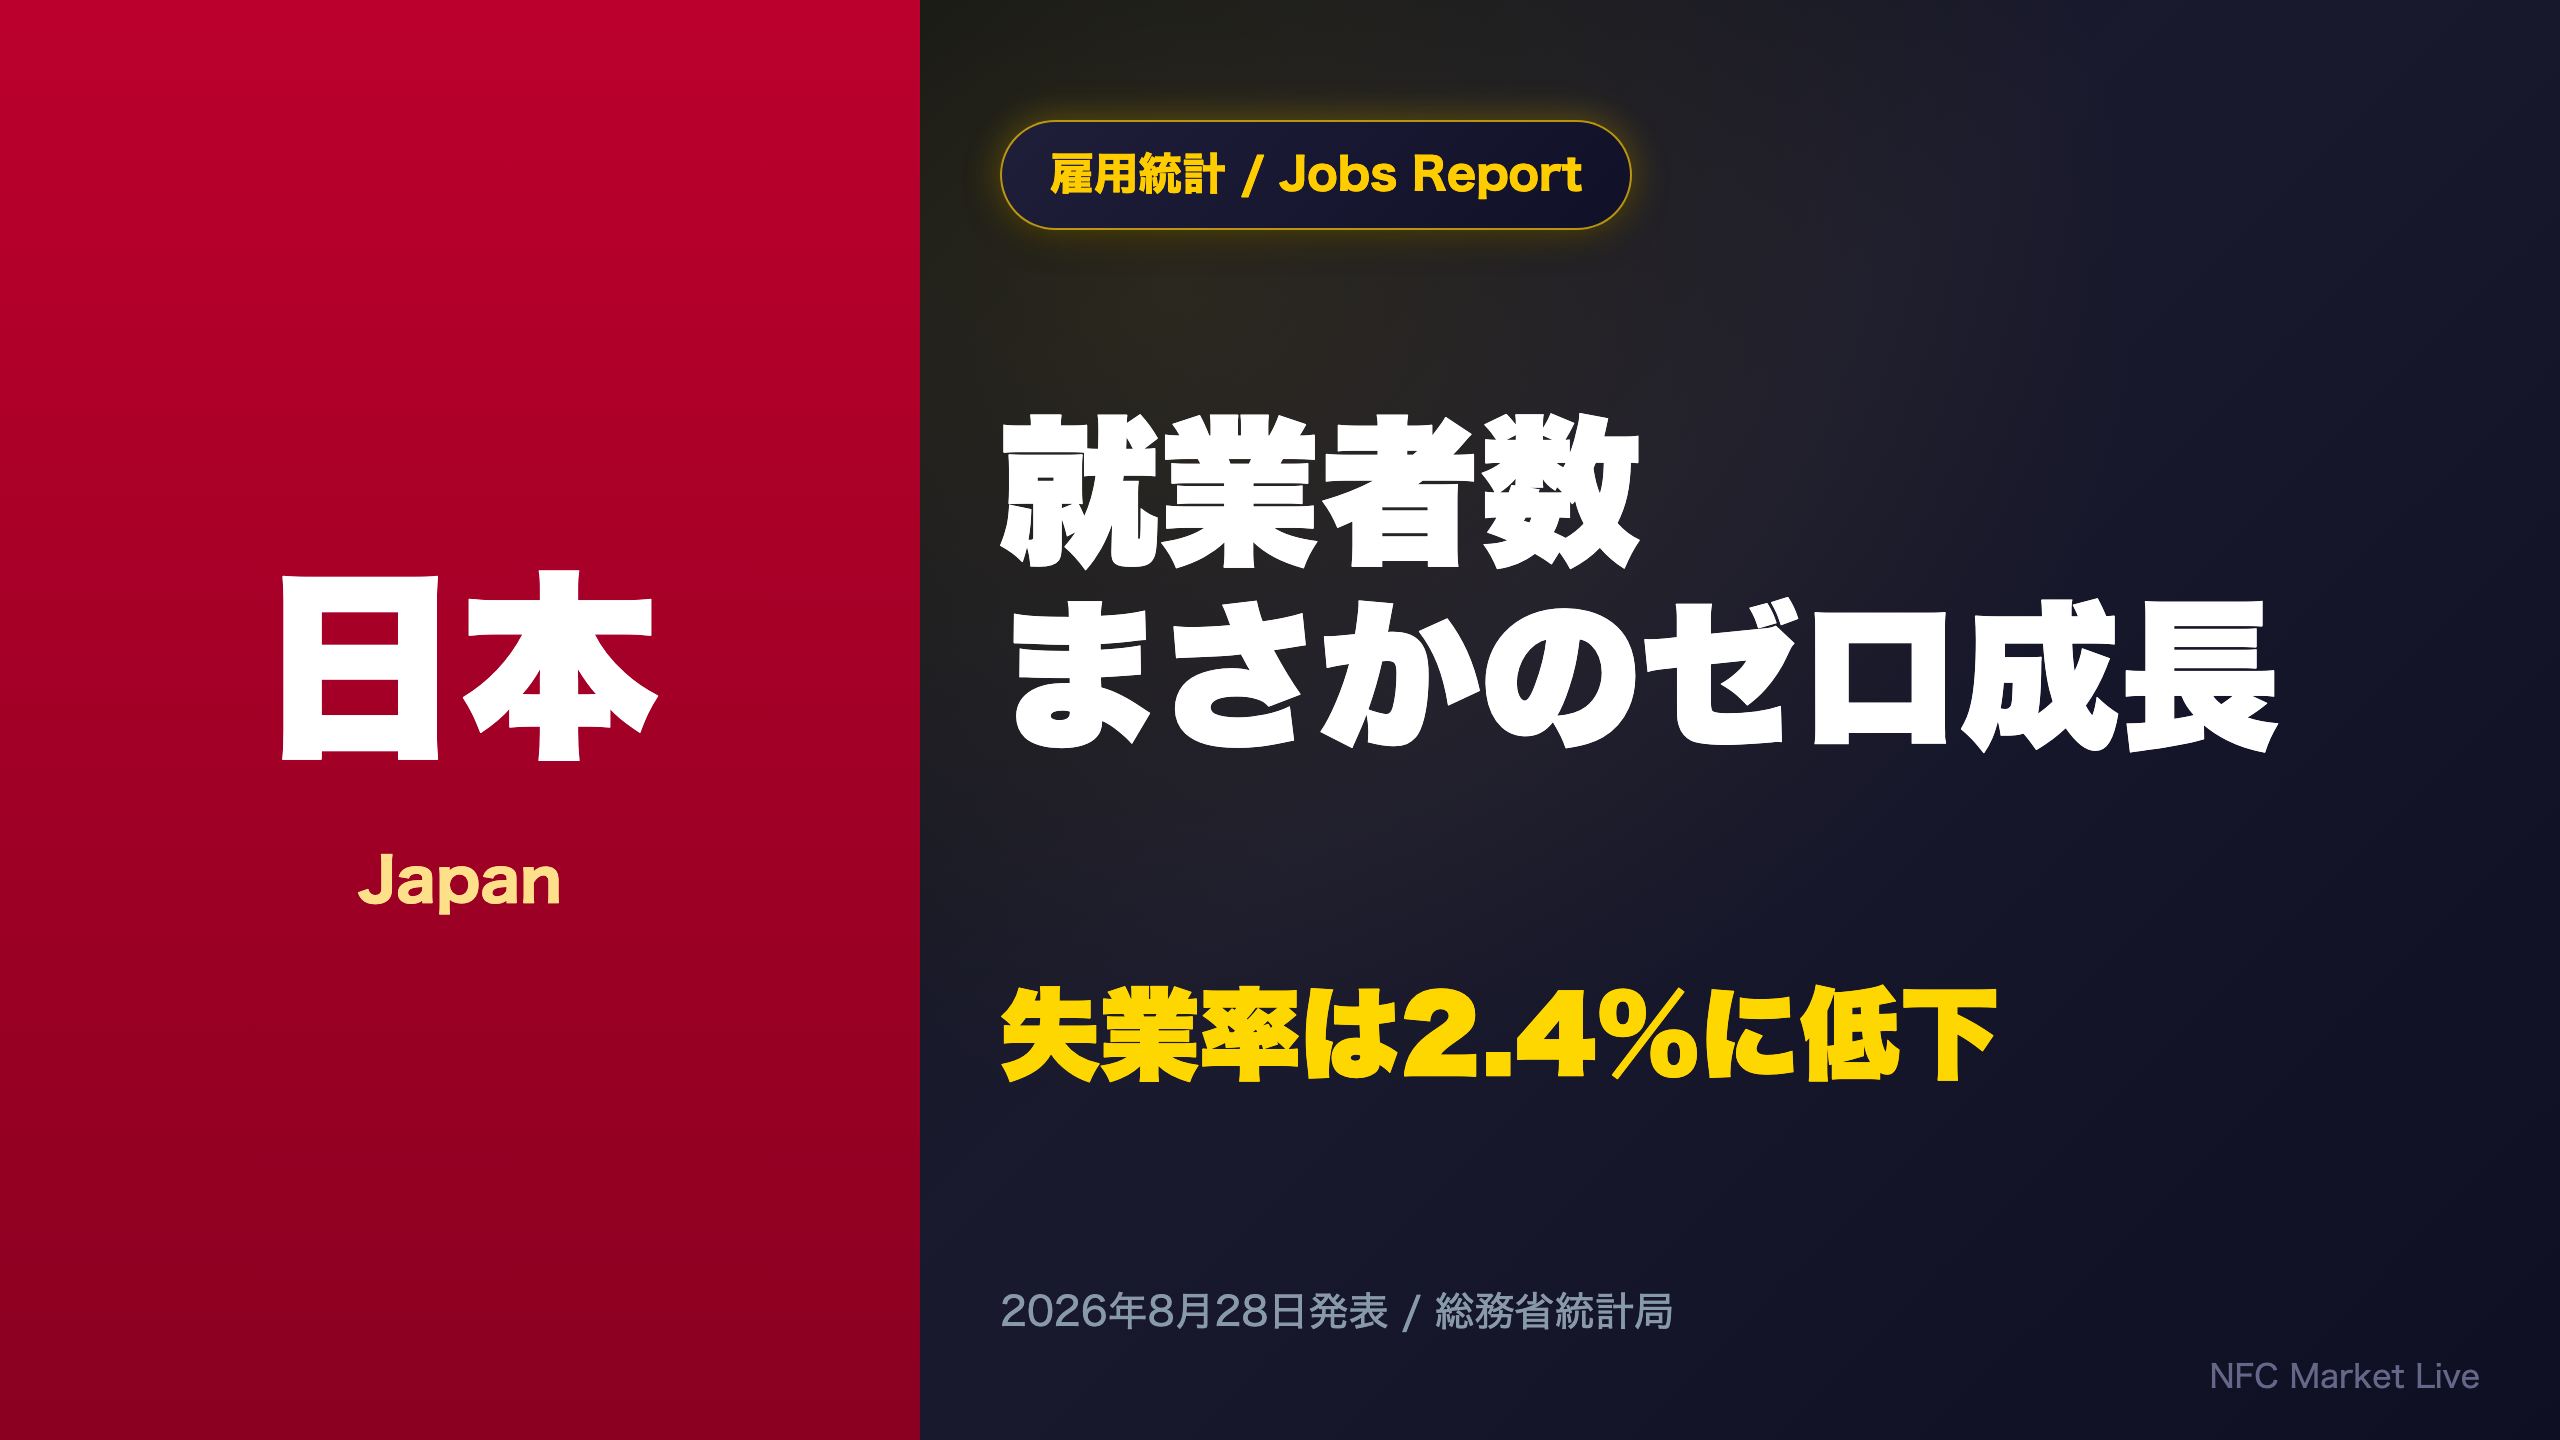
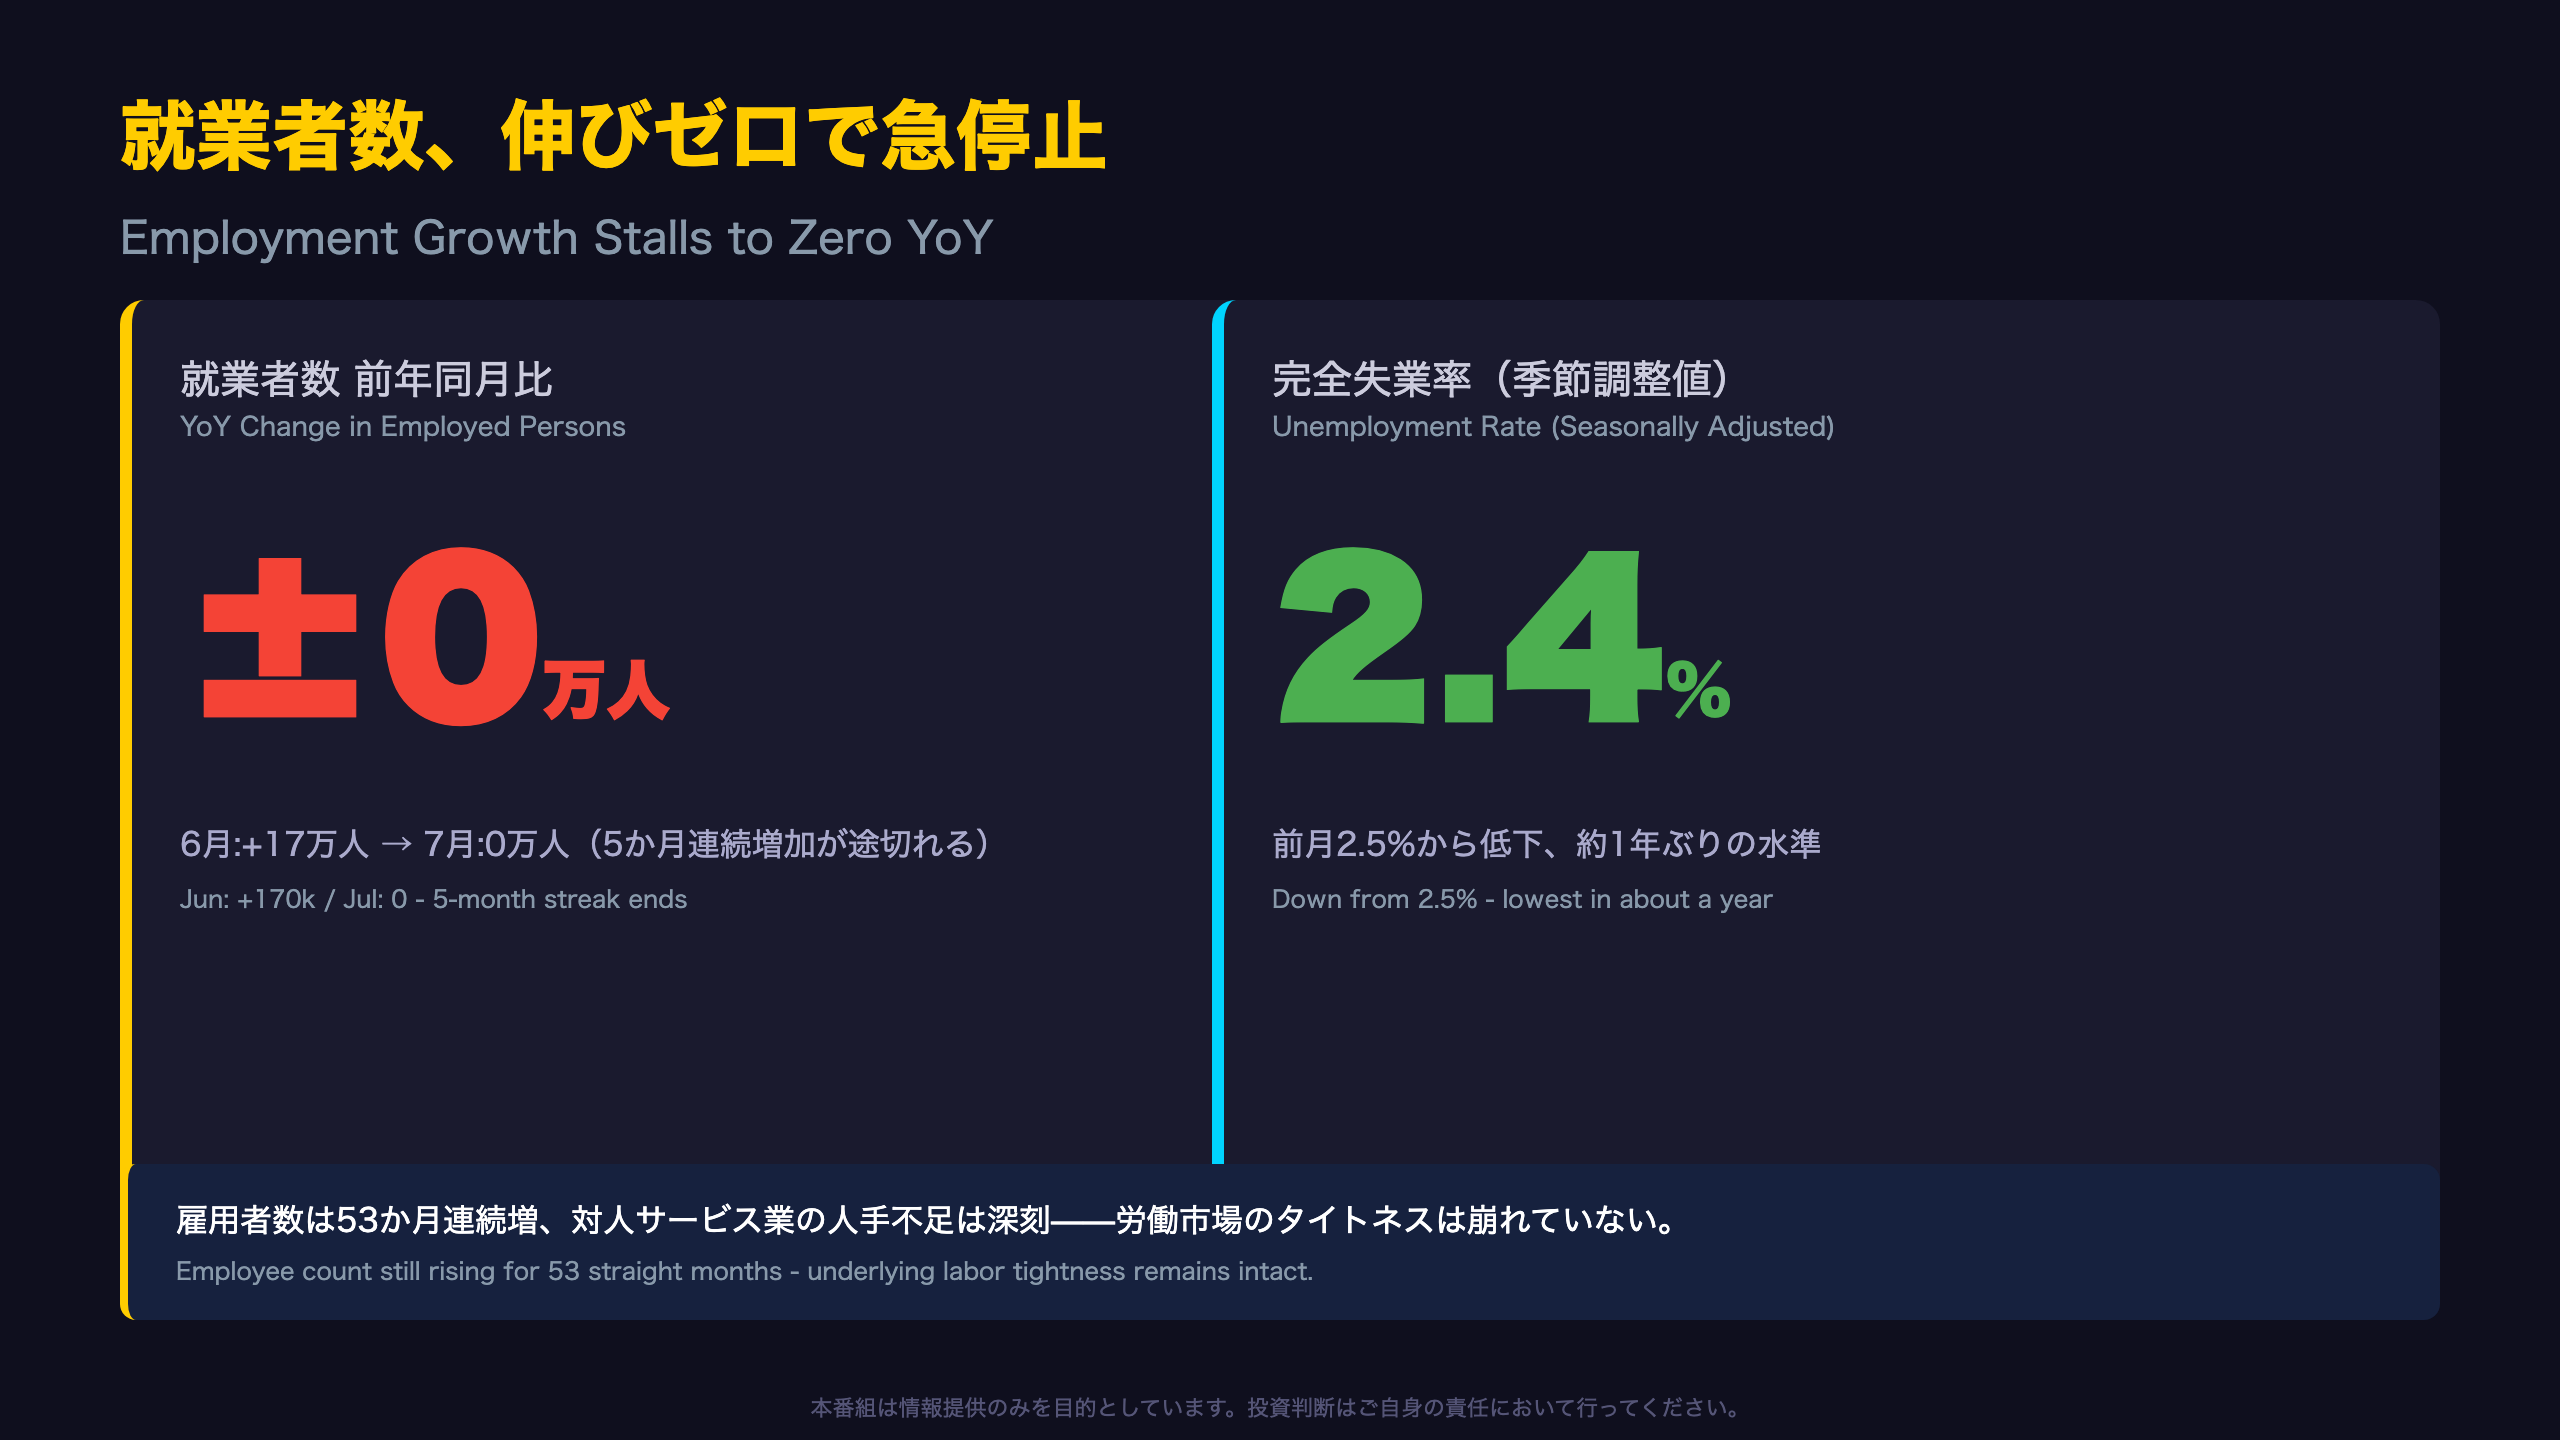
📊 Employed persons flat YoY at 68.5M, ending a 5-month growth streak.
📉 Yet the seasonally-adjusted unemployment rate fell to 2.4%, its best level in about a year.
💡 Employees (雇用者) kept rising for a 53rd straight month, with hospitality and personal services facing intensifying labor shortages.
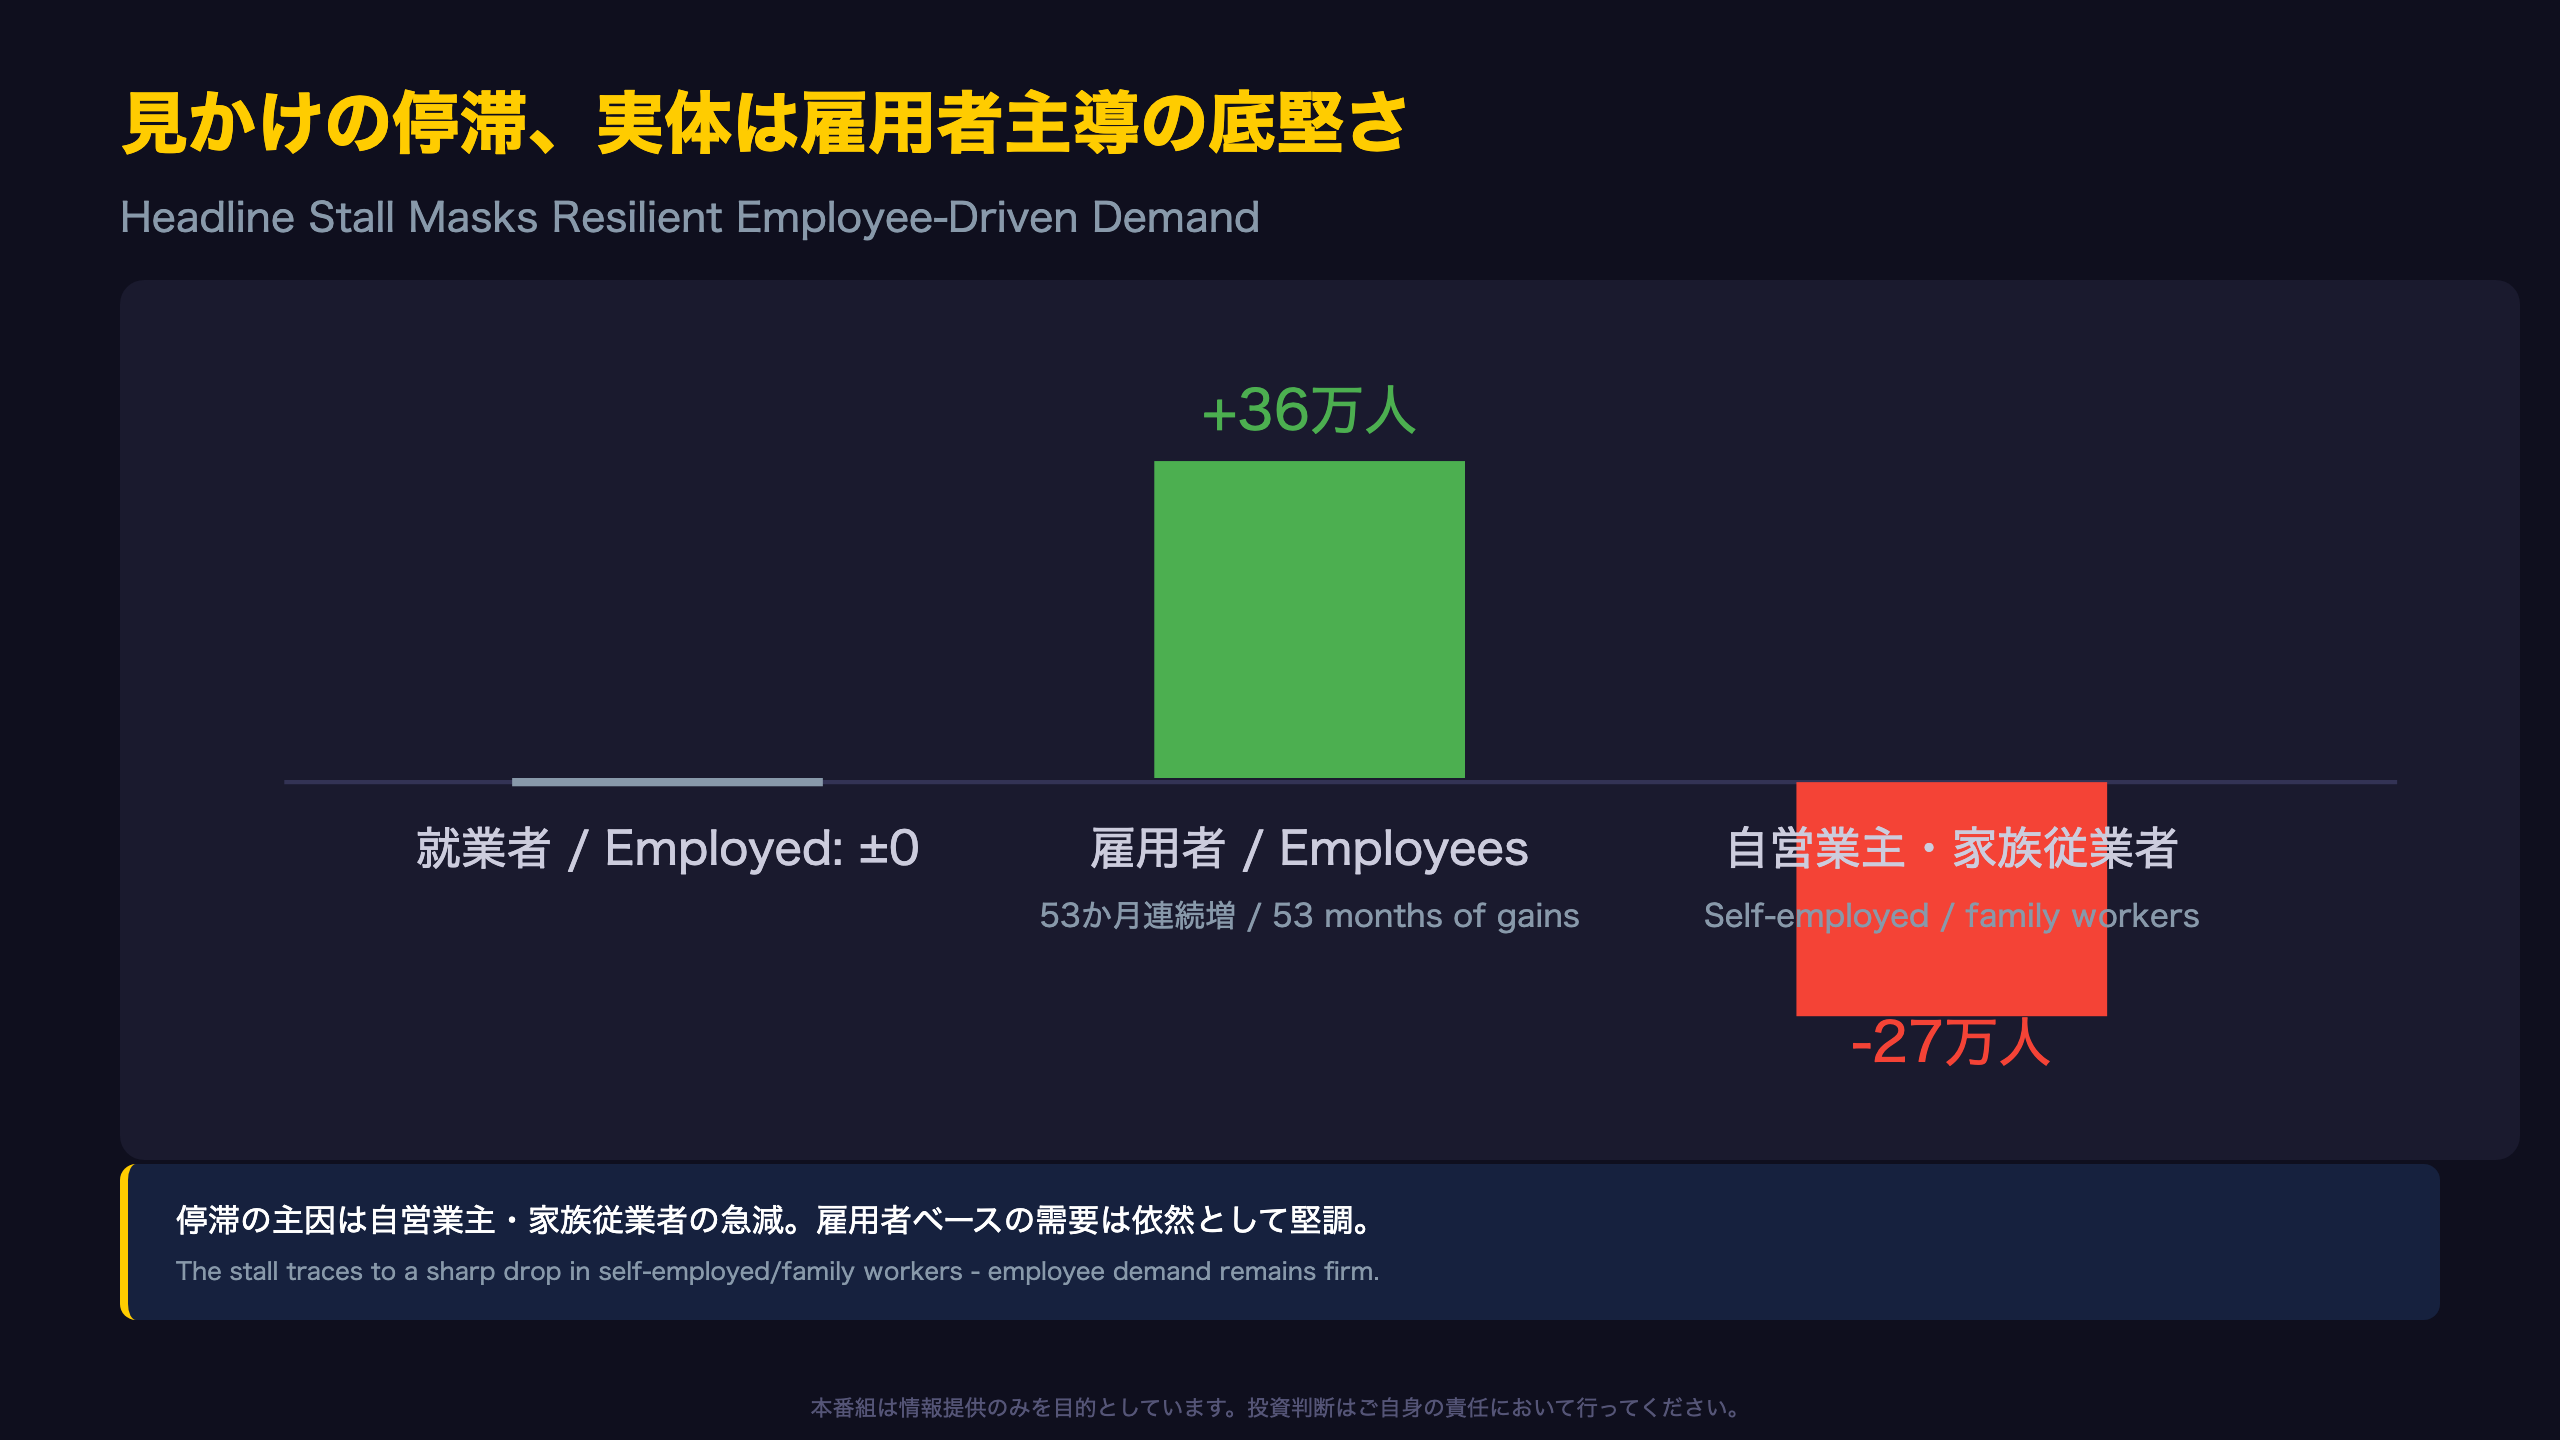
⚠️ The stall in headline employment was driven by a sharp drop in self-employed/family workers, not weaker employee demand.
We break down what this means for the BOJ’s wage-price virtuous cycle, weighing strength and weakness fairly.
The Ultimate Summary:伸びゼロの就業者数、それでも失業率は改善
A Tale of Two Signals in Japan’s Labor Market
Japan’s July 2026 Labour Force Survey, released by the Statistics Bureau of Japan (総務省統計局), delivered two seemingly contradictory headlines. Total employed persons (就業者数) came in at 68.50 million, unchanged year-on-year — ending a five-month streak of gains. Yet the seasonally-adjusted unemployment rate fell to 2.4% from 2.5%, its best reading in roughly a year.
The Bureau’s release states: \”Employed persons stood at 68.50 million, the same as a year earlier,\” and \”The seasonally adjusted unemployment rate was 2.4%, down 0.1 point from the previous month.\”
For readers unfamiliar with Japanese labor statistics: the Labour Force Survey (労働力調査) is Japan’s equivalent of the U.S. Bureau of Labor Statistics’ monthly jobs report, but it separates \”employees\” (雇用者, salaried/wage workers) from \”self-employed and family workers\” (自営業主・家族従業者) — a distinction rarely emphasized in Western labor data.
That distinction is the key to reconciling the paradox. Employees alone rose 360,000 YoY to 62.33 million, extending an extraordinary 53-month winning streak — comparable to the U.S. nonfarm payrolls’ longest expansion cycles. Self-employed and family workers, however, plunged 270,000 (-4.4%), the sharpest such decline in recent memory, effectively canceling out employee gains in the headline figure.
Market Implications
For USD/JPY and JGB traders, the key takeaway is that wage-relevant labor demand (employees) remains structurally tight even as the self-employed segment shrinks — a dynamic quite different from a broad-based labor market slowdown. This nuance matters for the BOJ’s policy calculus, since employee wage growth — not self-employment trends — is the primary channel into Japan’s \”virtuous cycle\” of wages and prices.
The next release (August 2026 data) is scheduled for October 2, 2026.
見かけの停滞、実体は雇用者主導の粘り強さ
Two Very Different Stories Inside One Headline
At first glance, Japan’s flat employment headline invites a bearish read. But breaking down Table 1 of the Statistics Bureau’s release tells a very different story. Employees (雇用者 — a category roughly equivalent to the U.S. \”nonfarm payroll\” concept of wage-earners) rose 360,000 YoY to 62.33 million, marking a 53rd consecutive month of growth — over four straight years without a single monthly YoY decline.
Meanwhile, self-employed and family workers (自営業主・家族従業者), a category with no direct U.S. equivalent but broadly comparable to \”non-employer businesses,\” fell 270,000 (-4.4%) — a sharper drop than the roughly -160,000 pace seen in April and May 2026.
Historical Context
Looking back over the past year, YoY employee growth has generally ranged from the high-30,000s to over 50,000 (in tens of thousands) — this month’s +360,000 sits near the low end of that range but remains solidly positive, not a reversal.
As the source states directly: \”Employees numbered 62.33 million, up 360,000 from a year earlier — a 53rd consecutive month of increase.\”
What Investors Should Watch
Whether the self-employed decline is transitory (e.g., business succession issues, incorporation shifts) or structural matters for BOJ policy. If self-employment continues shrinking structurally, Japan’s wage-price dynamics will increasingly hinge on employee-side wage negotiations (Shunto and beyond) rather than broader self-employment income trends — arguably making the labor market signal cleaner, not murkier, for policymakers.
対人サービス業の人手不足は深刻化——インフレへの示唆
Why Service-Sector Staffing Is the Real Inflation Signal
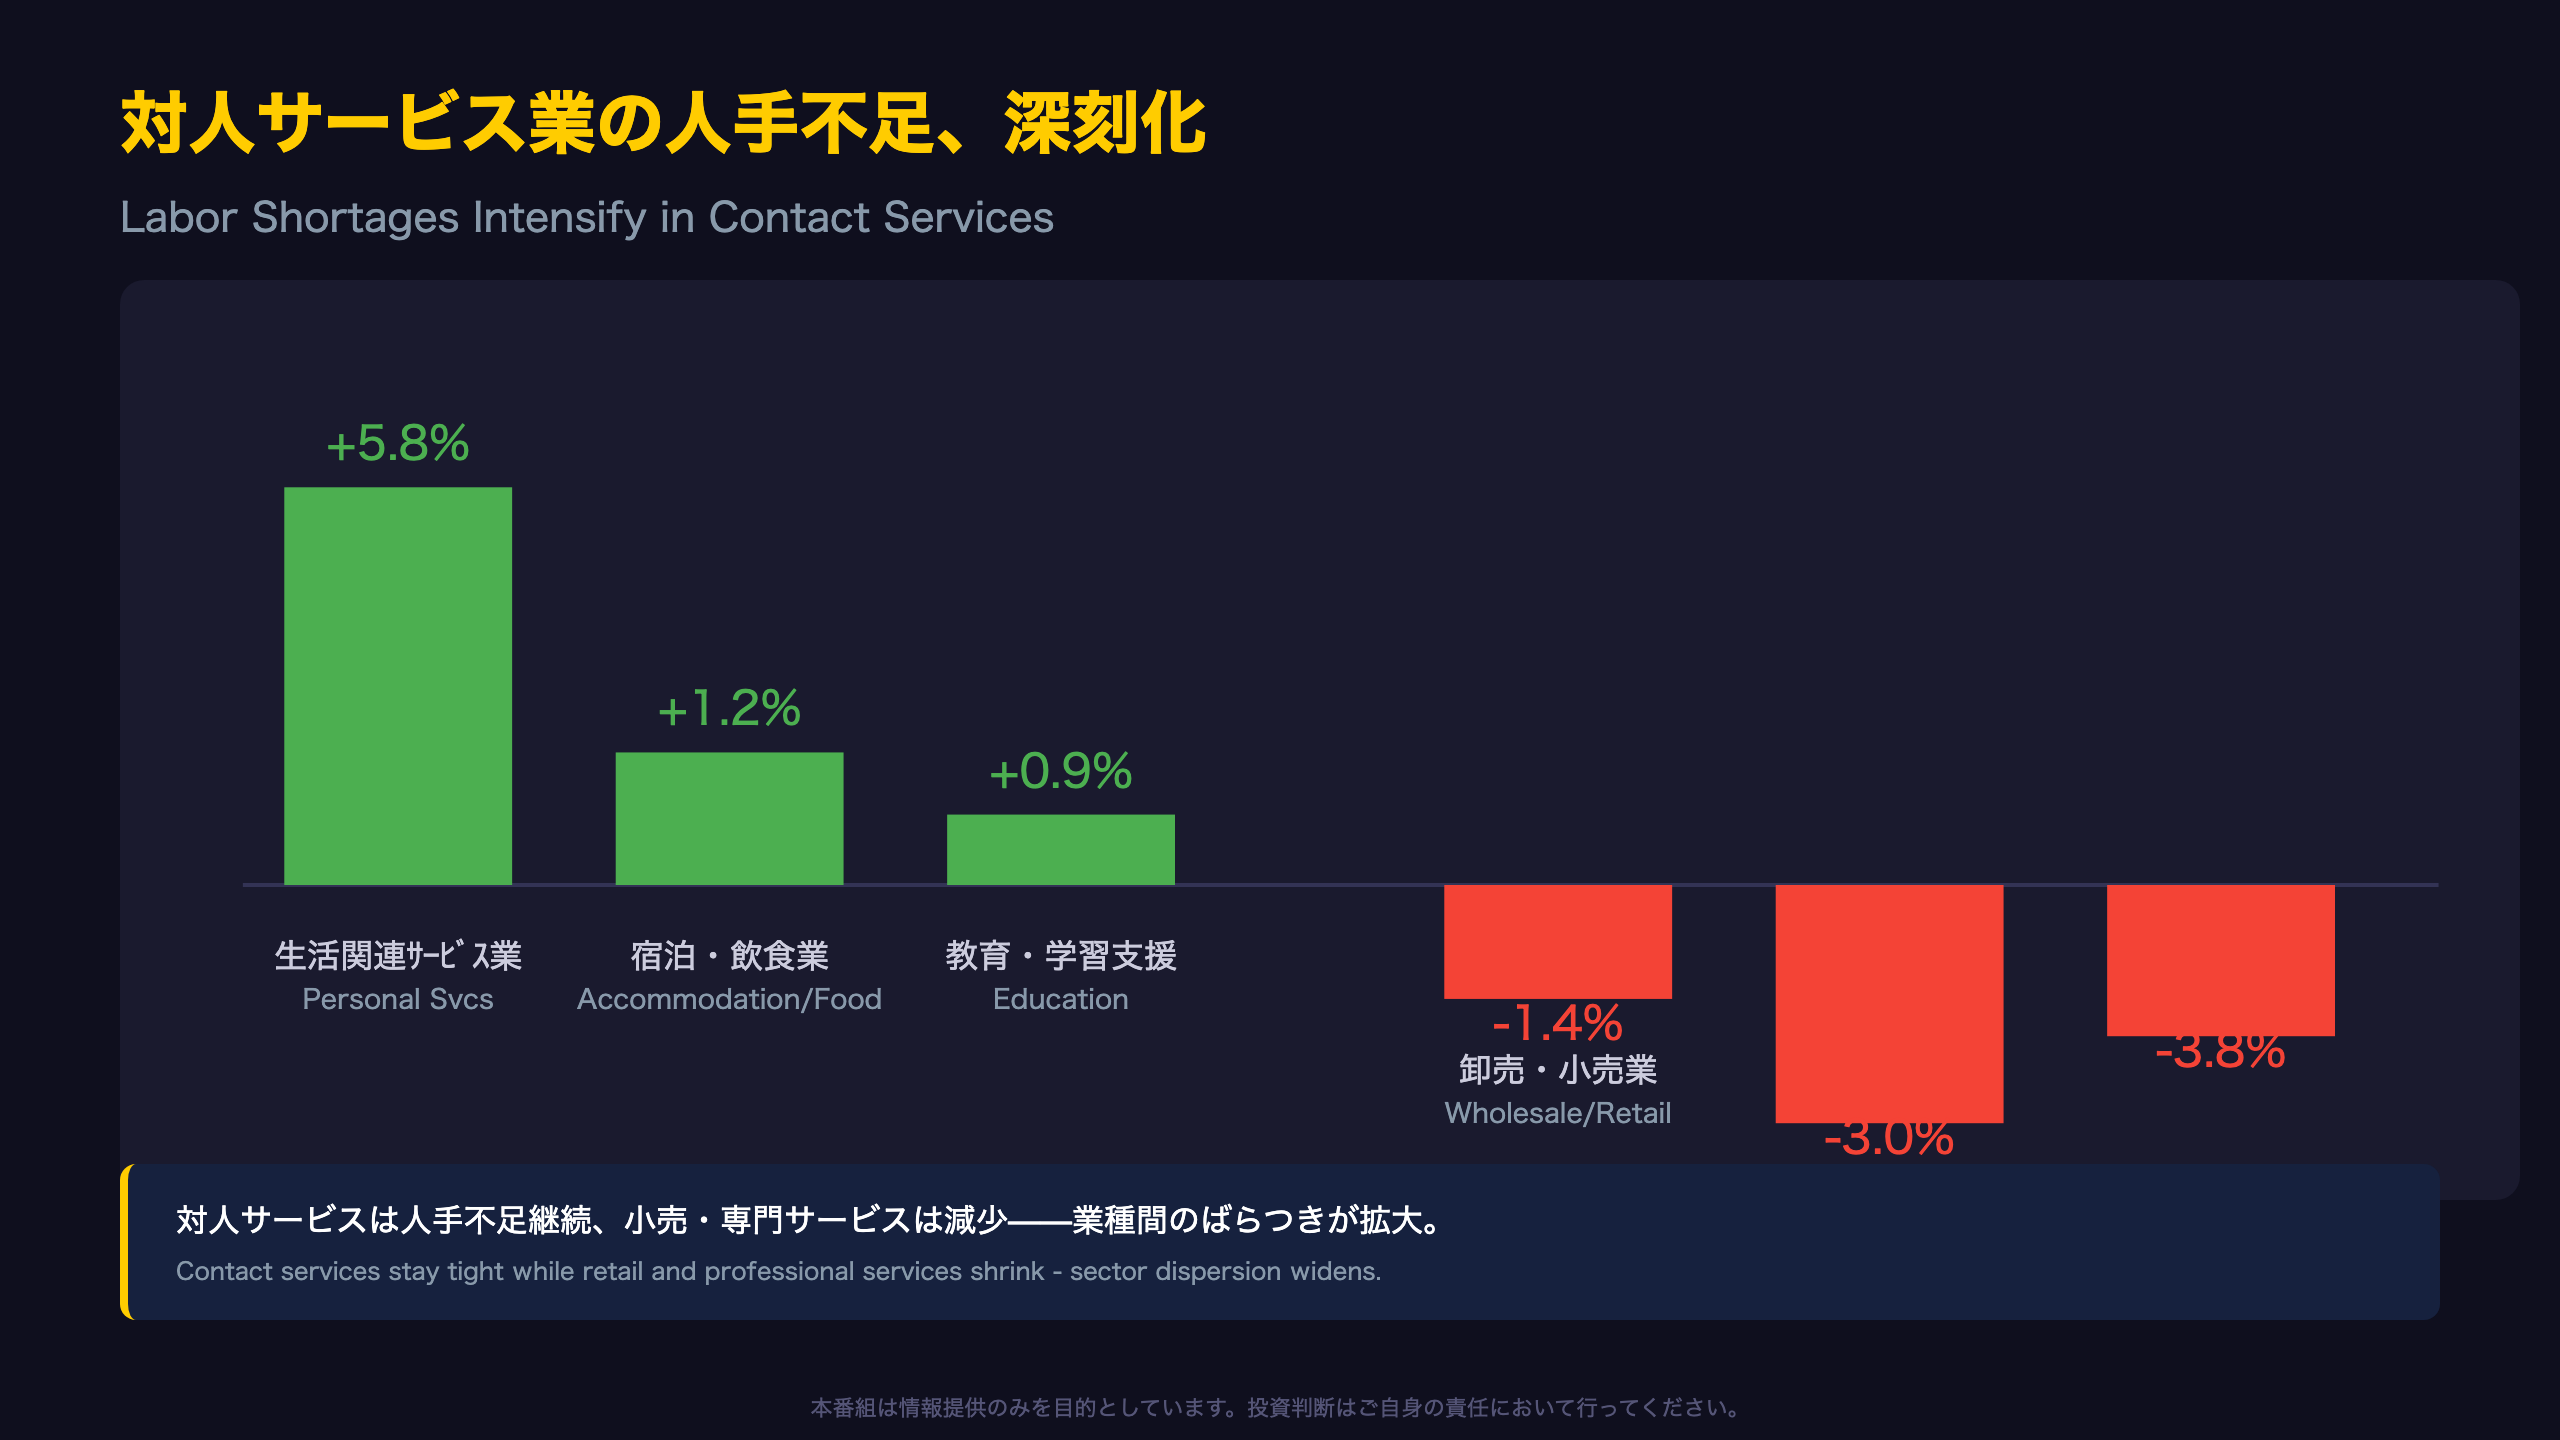
For investors tracking the Bank of Japan’s (BOJ) much-discussed \”virtuous cycle of wages and prices,\” employment trends in high-contact service industries are arguably the most important leading indicator available. This month’s data showed \”Personal Services and Entertainment\” (生活関連サービス業,娯楽業 — covering beauty salons, fitness clubs, and entertainment facilities) surging 5.8% YoY (+130,000), the strongest gain of any sector tracked.
\”Accommodation and Food Services\” (宿泊業,飲食サービス業 — Japan’s hospitality/restaurant sector) rose 1.2% (+50,000), reflecting persistent hiring needs tied to inbound tourism recovery and resilient domestic consumption.
As stated in the source data: \”Personal services and entertainment\” totaled 2.39 million workers, +5.8% YoY; \”Accommodation and food services\” totaled 4.14 million, +1.2% YoY.
The Flip Side: Sectors in Decline
Wholesale and retail trade (卸売業,小売業) fell 1.4% (-150,000) — the largest sector decline in absolute terms — while professional/technical services (学術研究,専門・技術サービス業) dropped 3.0% (-80,000). One plausible (though single-month, unconfirmed) explanation is accelerating automation and e-commerce substitution in retail, though this should not be treated as a confirmed structural trend from a single data point.
Two Ways to Read This
Bullish case: Persistent staffing shortages in contact-intensive services should keep upward pressure on service prices, aligning with the BOJ’s inflation target and supporting continued policy normalization.
Bearish/alternative view: Employment declines in retail may also reflect productivity-enhancing automation investment, which could eventually dampen wage pressure economy-wide even as service-sector hiring stays tight.
The next sector-level breakdown (August 2026 data) is due October 2, 2026.
正規・非正規ともに伸び鈍化——勢いの陰り
Regular and Non-Regular Employment: Growing, But Losing Steam
The growth of \”regular employees\” (正規の職員・従業員 — permanent, typically full-benefit staff) versus \”non-regular employees\” (非正規の職員・従業員 — part-timers, temp/dispatch staff, and contract workers) is a closely watched quality indicator for Japan’s labor market, since regular positions typically carry stronger wage growth and job security.
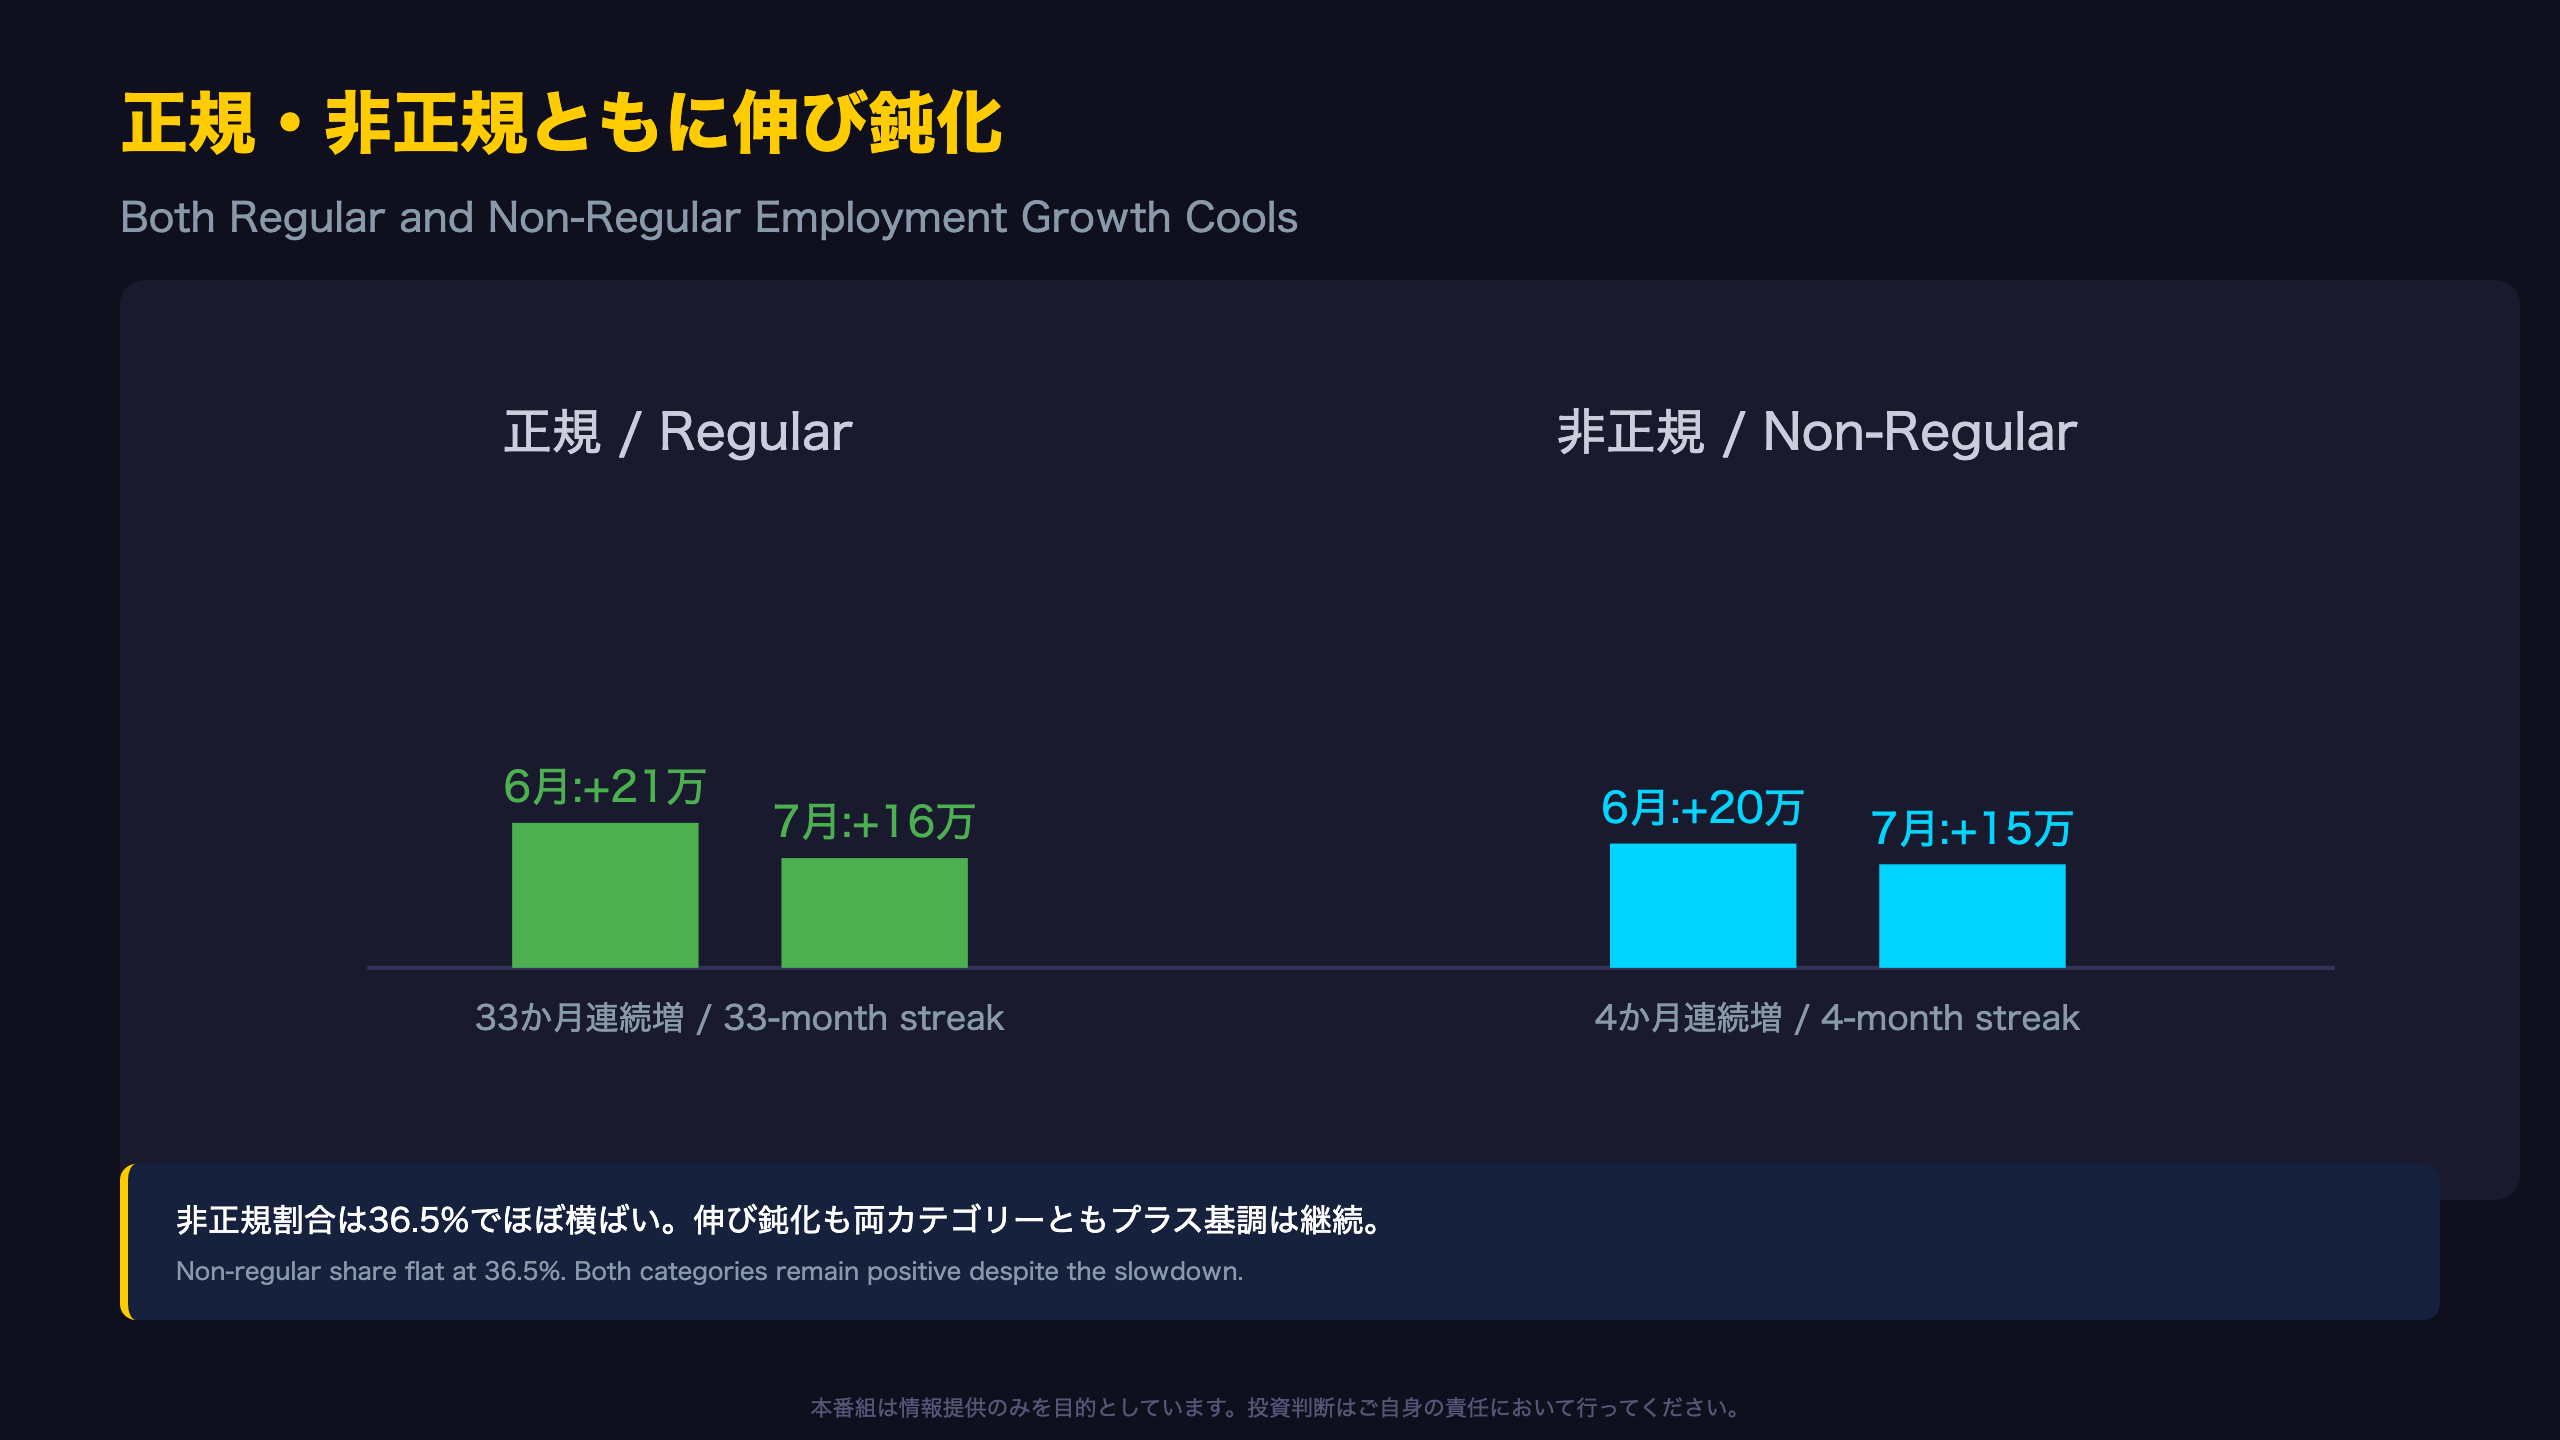
Regular employees rose to 37.36 million, up 160,000 YoY — a 33rd consecutive month of gains. However, that’s a deceleration from June’s +210,000. Non-regular employees reached 21.43 million, up 150,000 (a 4th straight monthly increase), also down from June’s +200,000.
The source directly states: \”Regular employees numbered 37.36 million, up 160,000 from a year earlier, a 33rd consecutive month of increase,\” and \”Non-regular employees numbered 21.43 million, up 150,000, a 4th consecutive month of increase.\”
Composition Stability
The share of non-regular workers among employees excluding executives held nearly flat at 36.5% (+0.1pt YoY) — there is no sign of an accelerating shift toward or away from non-regular employment. For context, U.S. investors should note Japan has historically carried a structurally higher share of part-time/contract labor (~35-37%) than the U.S., a legacy of postwar employment practices, though this gap has narrowed considerably since 2010.
Two Interpretations
One reading: the simultaneous slowdown in both categories may hint that labor market tightness has passed its peak intensity. Another equally valid reading: both categories remaining firmly positive suggests bargaining power still favors workers heading into the next wage round (Shunto).
Detailed August 2026 data is due October 2, 2026, with part-time/temp breakdowns worth monitoring closely.
自発的離職の増加——強気シグナルか、警戒シグナルか
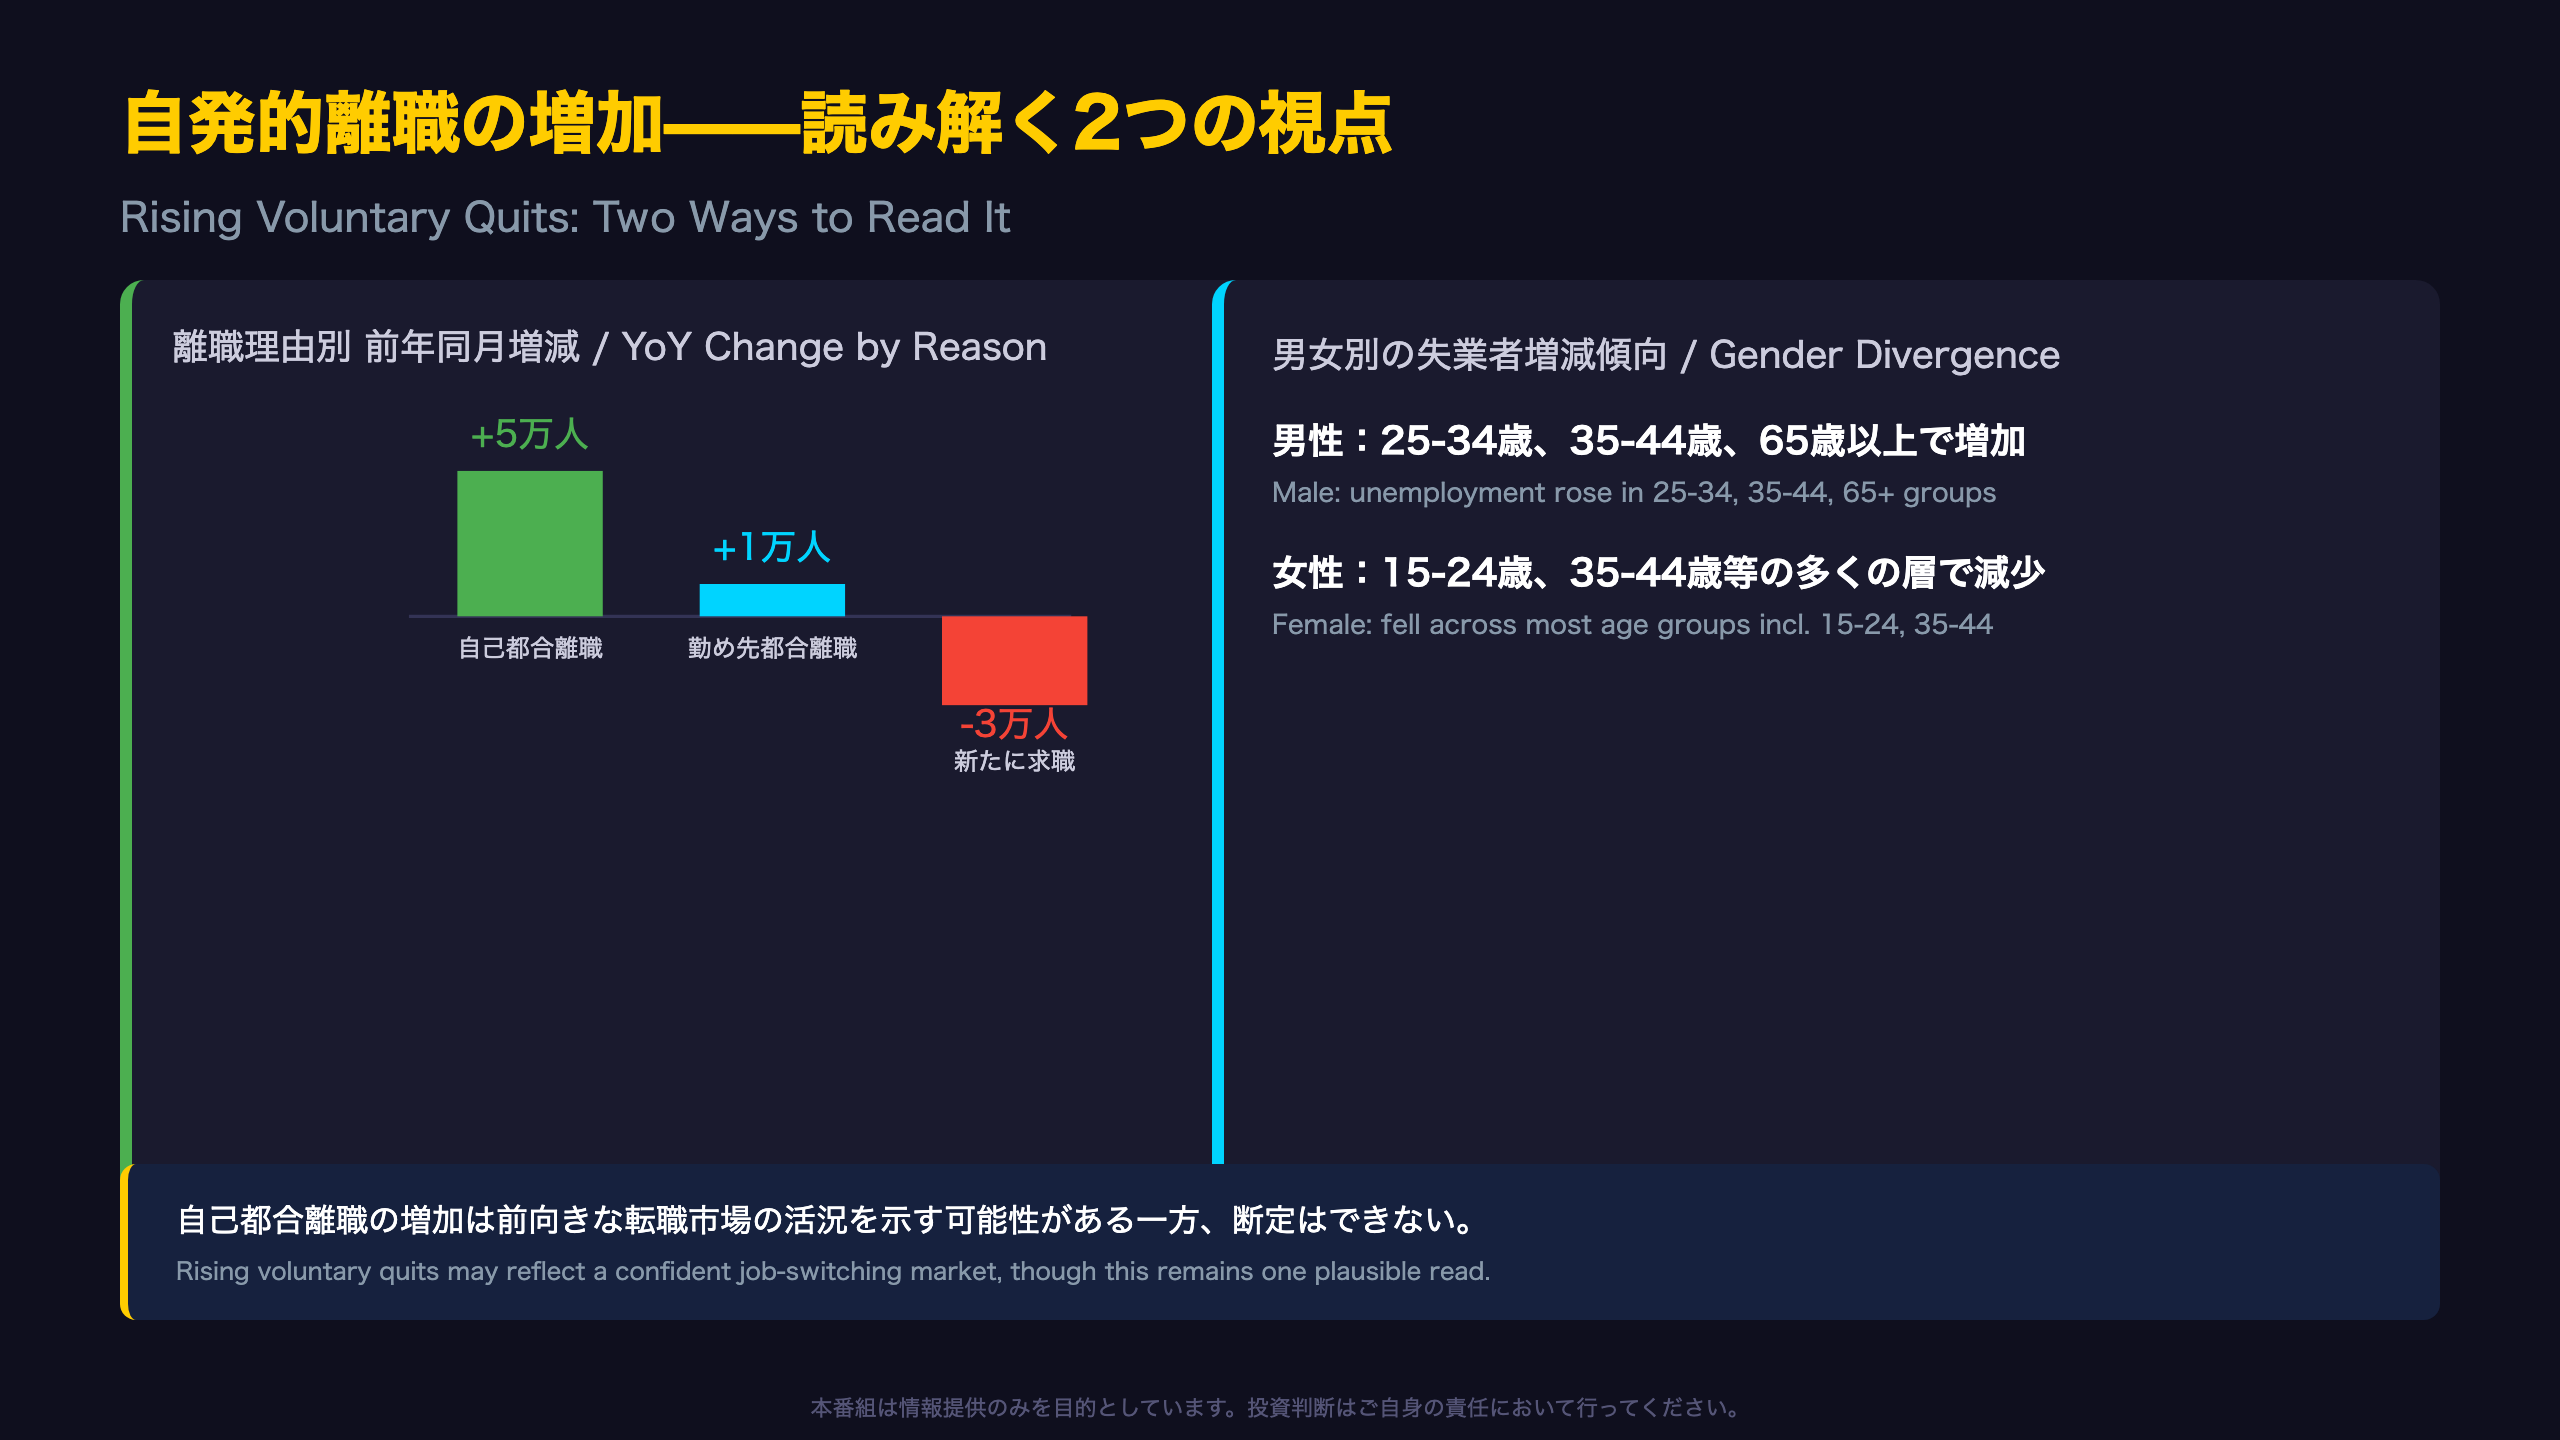
Rising Voluntary Quits: A Sign of Worker Confidence?
While the headline unemployment count held flat at 1.69 million, the breakdown by reason for job search reveals a notable shift. Those unemployed due to \”voluntary resignation\” (自発的な離職(自己都合)) rose 50,000 YoY to 760,000 — the most significant increase among all categories. By contrast, those citing \”employer-driven separation\” (勤め先や事業の都合による離職, roughly equivalent to layoffs) rose just 10,000 to 210,000, while \”new job seekers\” (新たに求職 — including new graduates and returning homemakers) fell 30,000 to 430,000.
As stated in the source: \”‘Voluntary resignation’ totaled 760,000, up 50,000 from a year earlier,\” while \”‘new job seekers’ totaled 430,000, down 30,000.\”
For English-speaking readers, this dynamic parallels the U.S. \”Quits Rate\” tracked in the JOLTS report — a rising quits rate is typically read as a sign of worker confidence and a tight labor market, since employees are more willing to voluntarily leave jobs when they’re confident about finding better opportunities elsewhere. That said, this remains a single-month observation and should be treated as one plausible interpretation (Level C confidence) rather than a confirmed structural trend.
Uneven Impact by Gender and Age
Male unemployment rose in the 25-34, 35-44, and 65+ age brackets, while female unemployment declined across most age groups including 15-24, 35-44, 55-64, and 65+. The rise in unemployment among men aged 65+ may hint at reemployment friction for older workers, even as broader female labor force participation trends remain constructive.
For traders, watch whether the voluntary-quit uptrend persists and whether male 65+ unemployment continues rising in the next release.
4-6月期平均と地域差——次回発表への視点
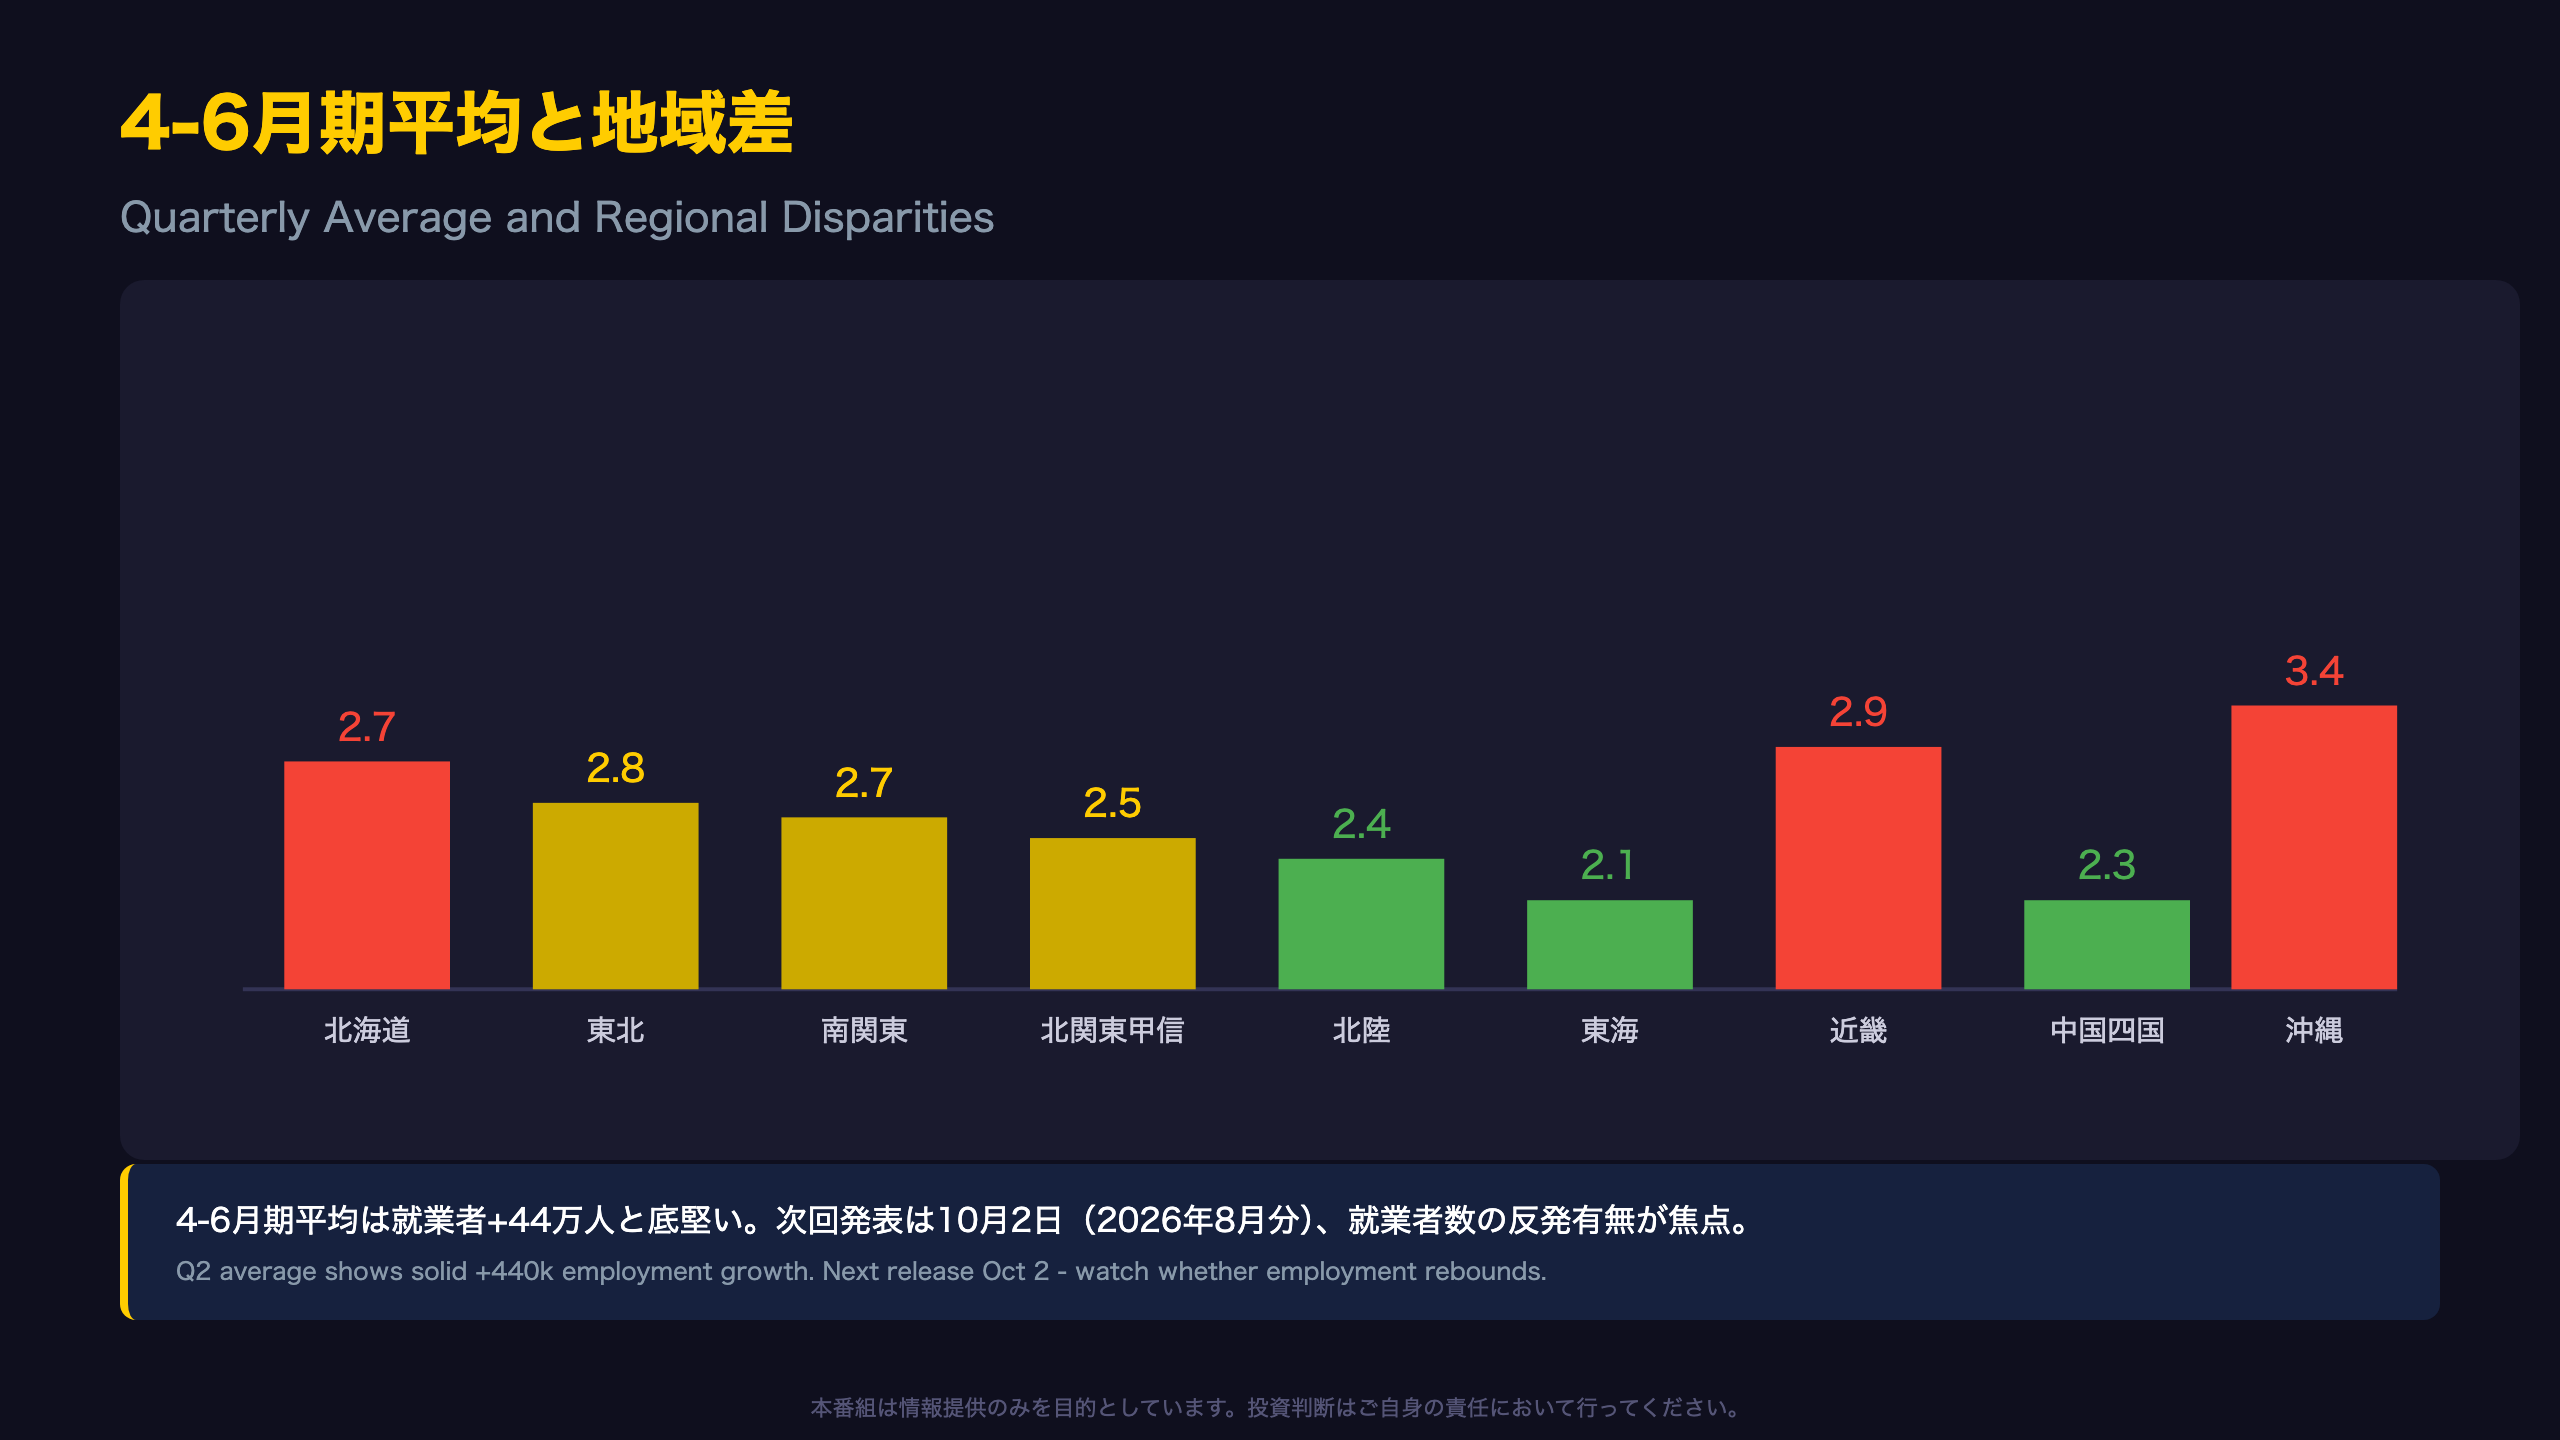
The Quarterly Picture: Steady Growth, but Regional Divergence
To smooth out single-month noise, it’s worth examining the April-June 2026 quarterly average. Employed persons averaged 68.80 million, up 440,000 YoY, while the raw (non-seasonally-adjusted) unemployment rate held flat at 2.6% — a much less dramatic picture than July’s standalone \”zero growth\” headline, suggesting the July stall (driven largely by the self-employed decline) may be partly a one-month anomaly rather than a clean trend break.
Regional Disparities
Regional unemployment rates (Apr-Jun 2026 average) ranged widely: Okinawa posted the highest at 3.4% (+0.1pt YoY), followed by Hokkaido at 2.7% (+0.2pt) and Kinki (Osaka/Kyoto region) at 2.9% (+0.2pt). Tokai (Nagoya region, Japan’s manufacturing heartland) posted the lowest at 2.1% (-0.1pt) — a regional gap of roughly 1.3 percentage points, reflecting Japan’s persistent structural divide between manufacturing-heavy regions and tourism/services-dependent regions like Okinawa.
The source states directly: \”Hokkaido: 2.7% (up 0.2pt),\” \”Tokai: 2.1% (down 0.1pt),\” \”Okinawa: 3.4% (up 0.1pt).\”
Looking Ahead
The next Labour Force Survey release (August 2026 data) is scheduled for October 2, 2026. Three questions frame the outlook: (1) whether July’s zero-growth reading in headline employment persists or reverses; (2) whether the sharp decline in self-employed/family workers is structural or transitory; and (3) whether service-sector labor shortages (hospitality, personal services) continue feeding into wage negotiations ahead of Japan’s next Shunto cycle.
How these evolve will likely shape the tone of the BOJ’s labor market assessment at its upcoming policy meetings, an important input for USD/JPY and JGB positioning.
Disclaimer: This article is for informational purposes only. All investment decisions are made solely at your own risk.