This article was automatically generated by the NFC Market Live AI analysis system. (Updated: 2026-08-25 15:20 JST)
📄 Primary Source
Statistics Norway
https://www.ssb.no/en/arbeid-og-lonn/sysselsetting/statistikk/arbeidskraftundersokelsen
📊 Statistics Norway’s latest Labour Force Survey shows July’s trend unemployment rate falling to 4.5%, with employment holding at 69.9%.
⚠️ But a closer look reveals June’s figures were quietly revised down from the original release—meaning the real month-on-month improvement was minimal.
📉 Meanwhile, youth male unemployment surged to 17.5%, and the quarterly rate has held at a cycle-high 4.8% for two straight quarters.
💡 A resilient headline masking emerging labor market slack—full breakdown inside.
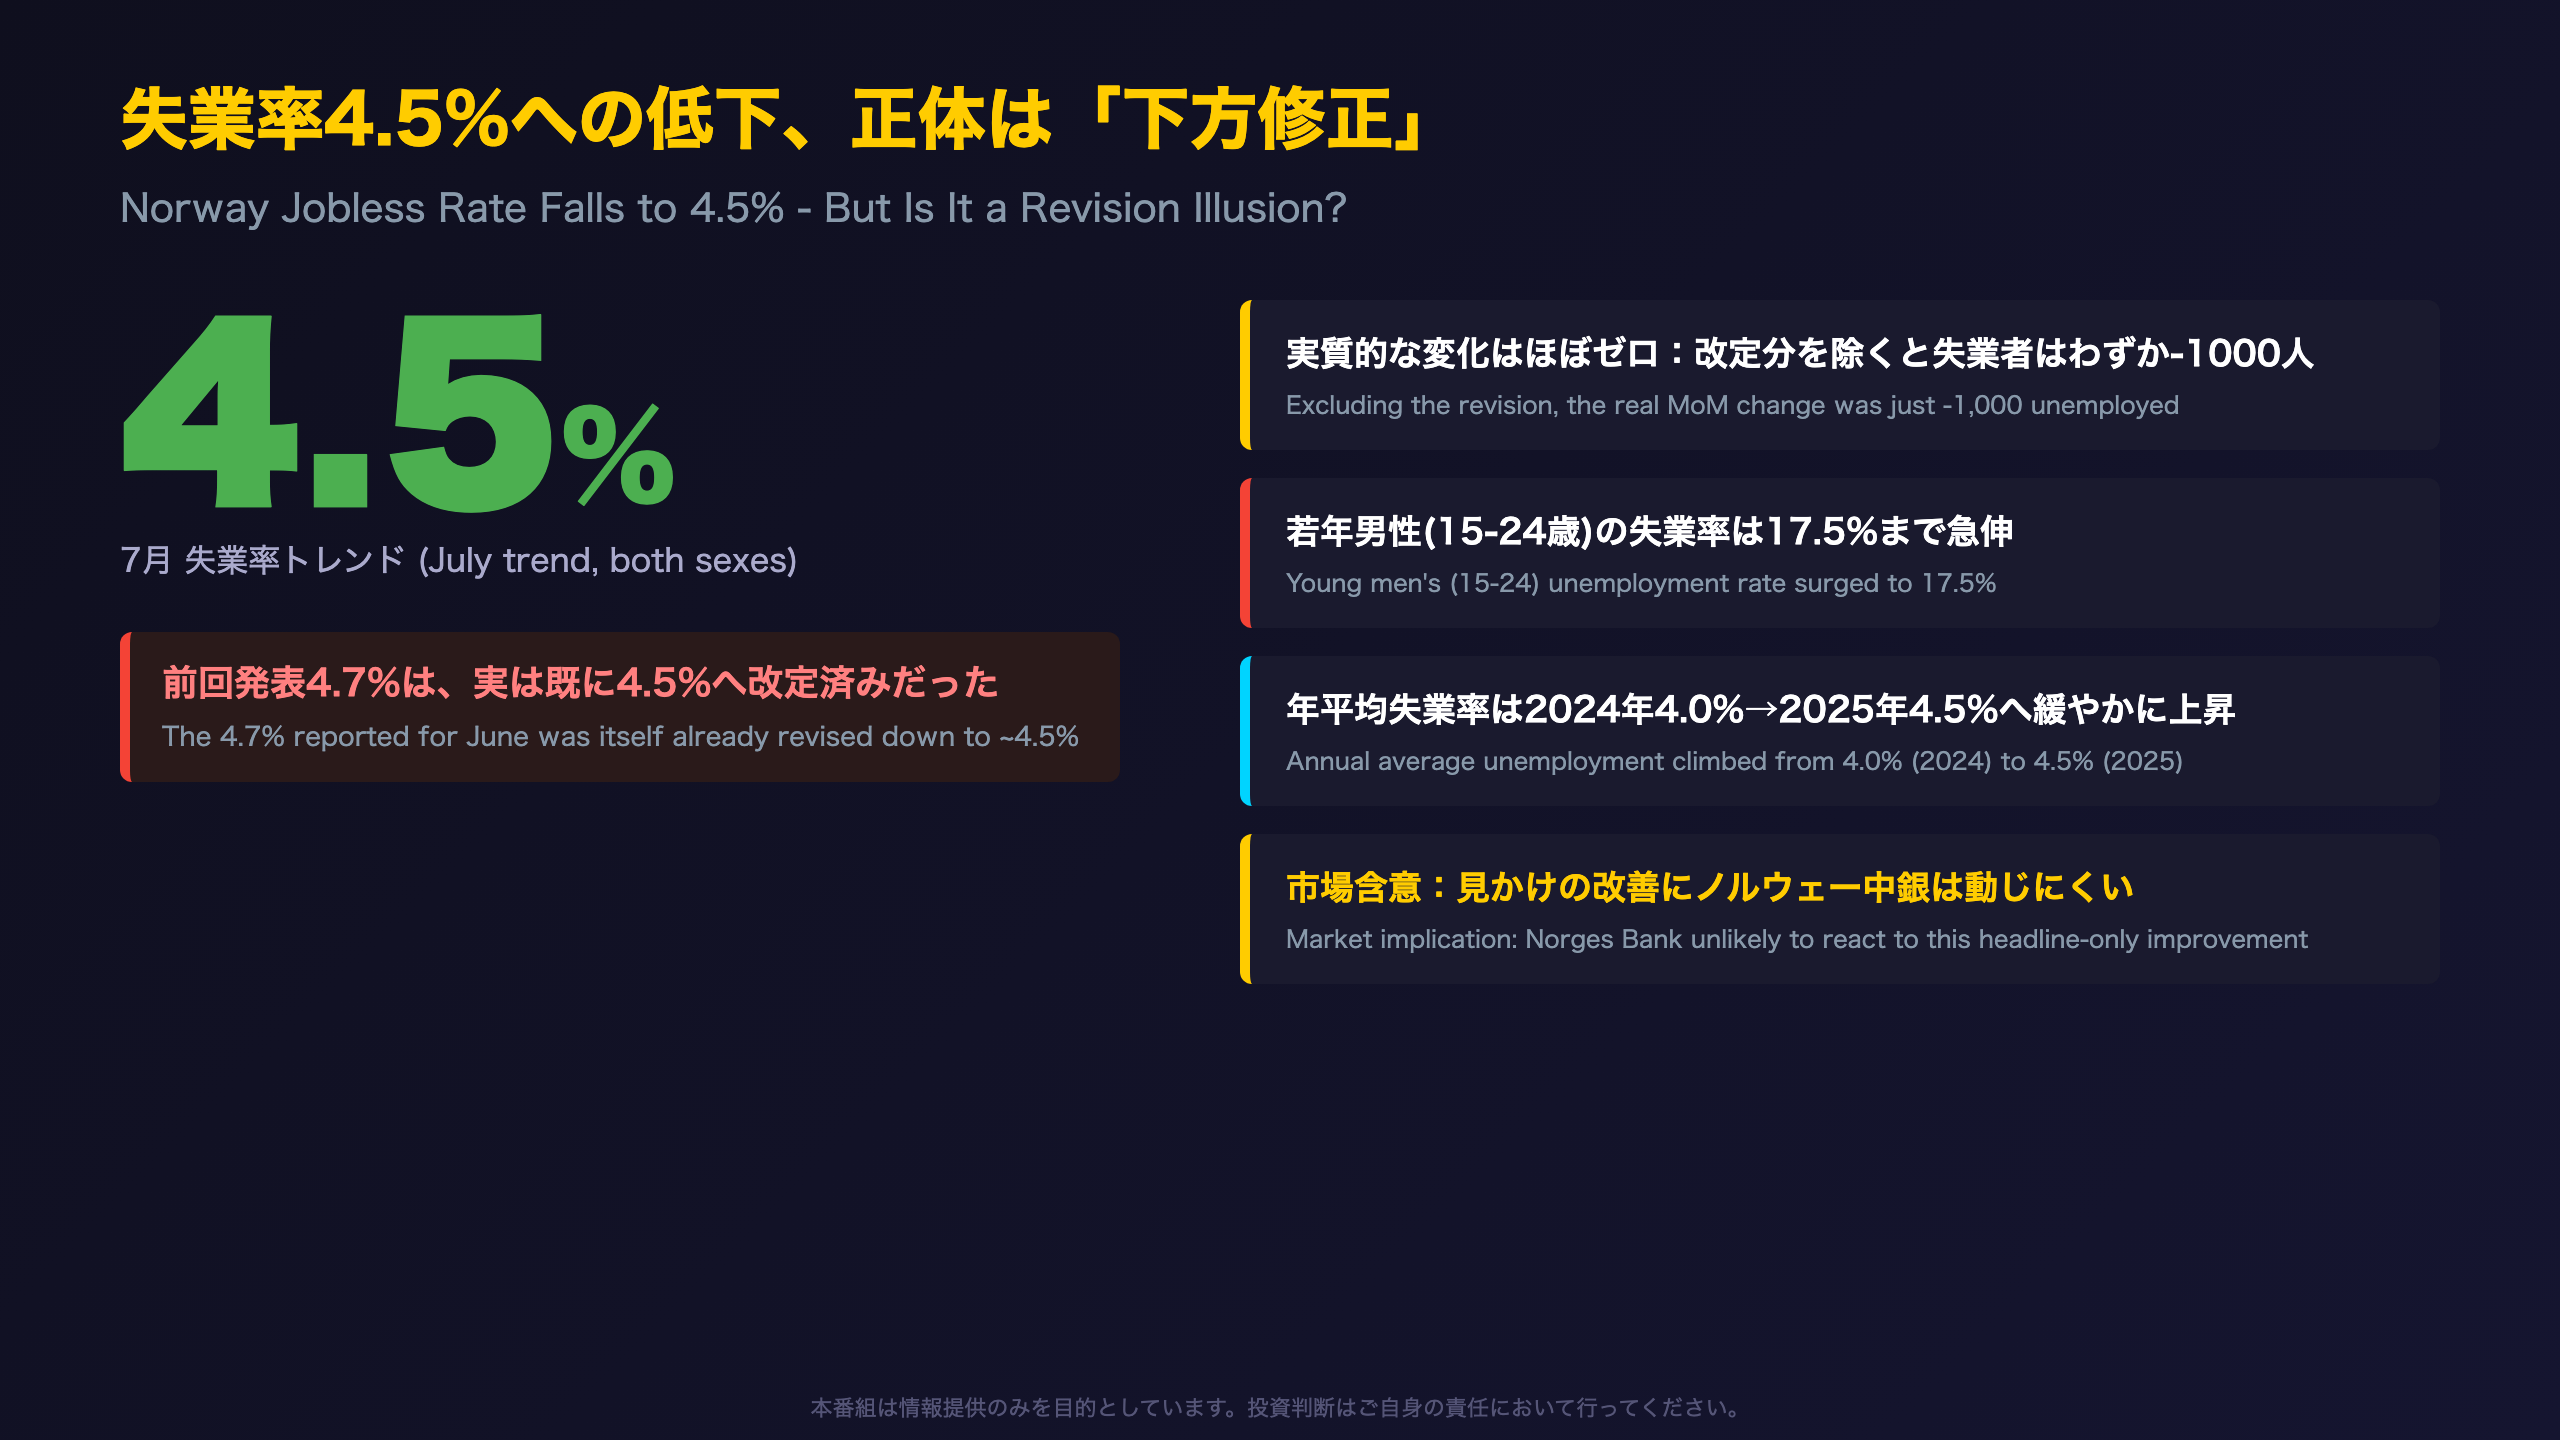
The Ultimate Summary:失業率4.5%への低下、正体は「下方修正」
Why “Improvement” Needs an Asterisk
Statistics Norway (SSB) publishes monthly trend estimates for its Labour Force Survey (LFS) using X-13-ARIMA-SEATS seasonal adjustment combined with Henderson moving averages. SSB’s own methodology notes explicitly warn that “the trend can often be slightly revised when new observations are incorporated, especially towards the end of the time series” — a phenomenon known as revision uncertainty, similar to the “flash vs. final” gap seen in U.S. nonfarm payrolls or GDP.
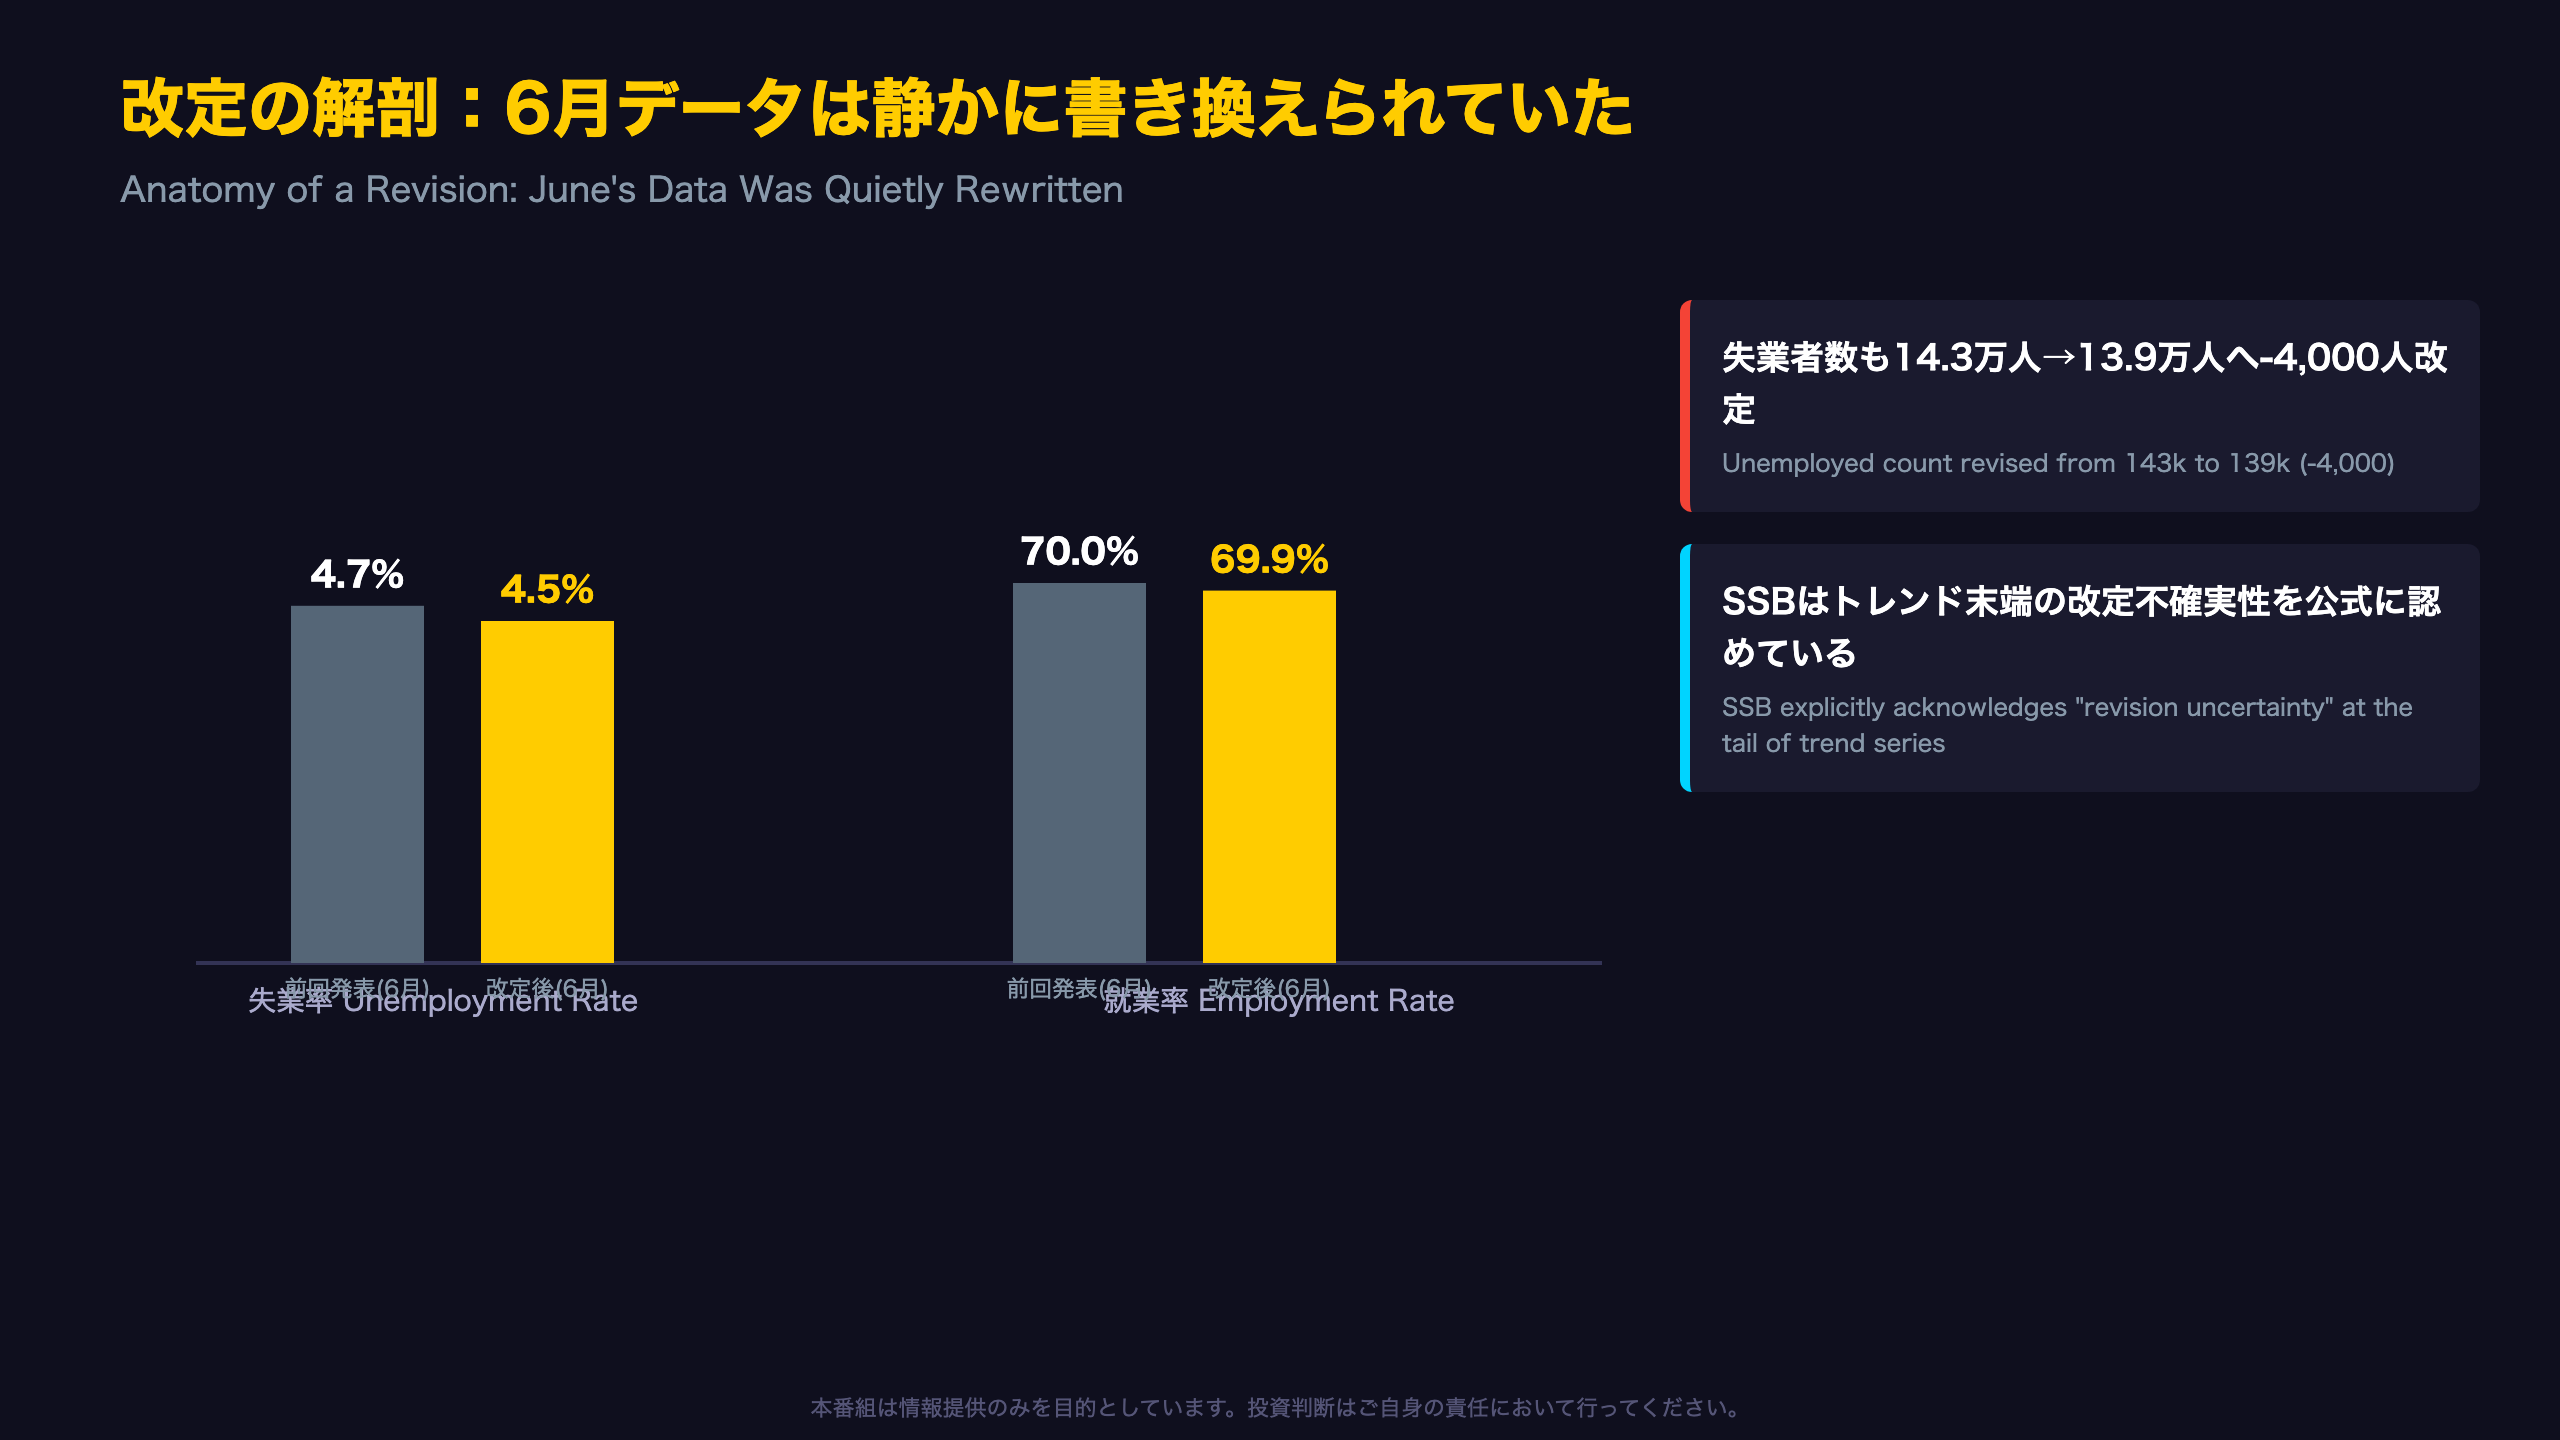
That is exactly what happened here: comparing this release to the prior one shows June’s unemployment rate quietly revised from 4.7% to 4.5%, and employment from 2,931,000 to 2,928,000 — all before the July figure was even added.
For context, this is analogous to a scenario where the U.S. BLS revises last month’s payroll print by tens of thousands of jobs in the same breath as releasing the new number — a routine but easily overlooked technical feature of trend-based statistics.
Market implication: Norges Bank, like most central banks, is trained to look through single-month noise and revision effects. A headline “drop” to 4.5% is unlikely to materially shift the policy rate path on its own, and NOK reaction should be limited unless confirmed by subsequent releases.
7月のトレンド値:静かな安定
The Numbers Behind a “Quiet” Labor Market
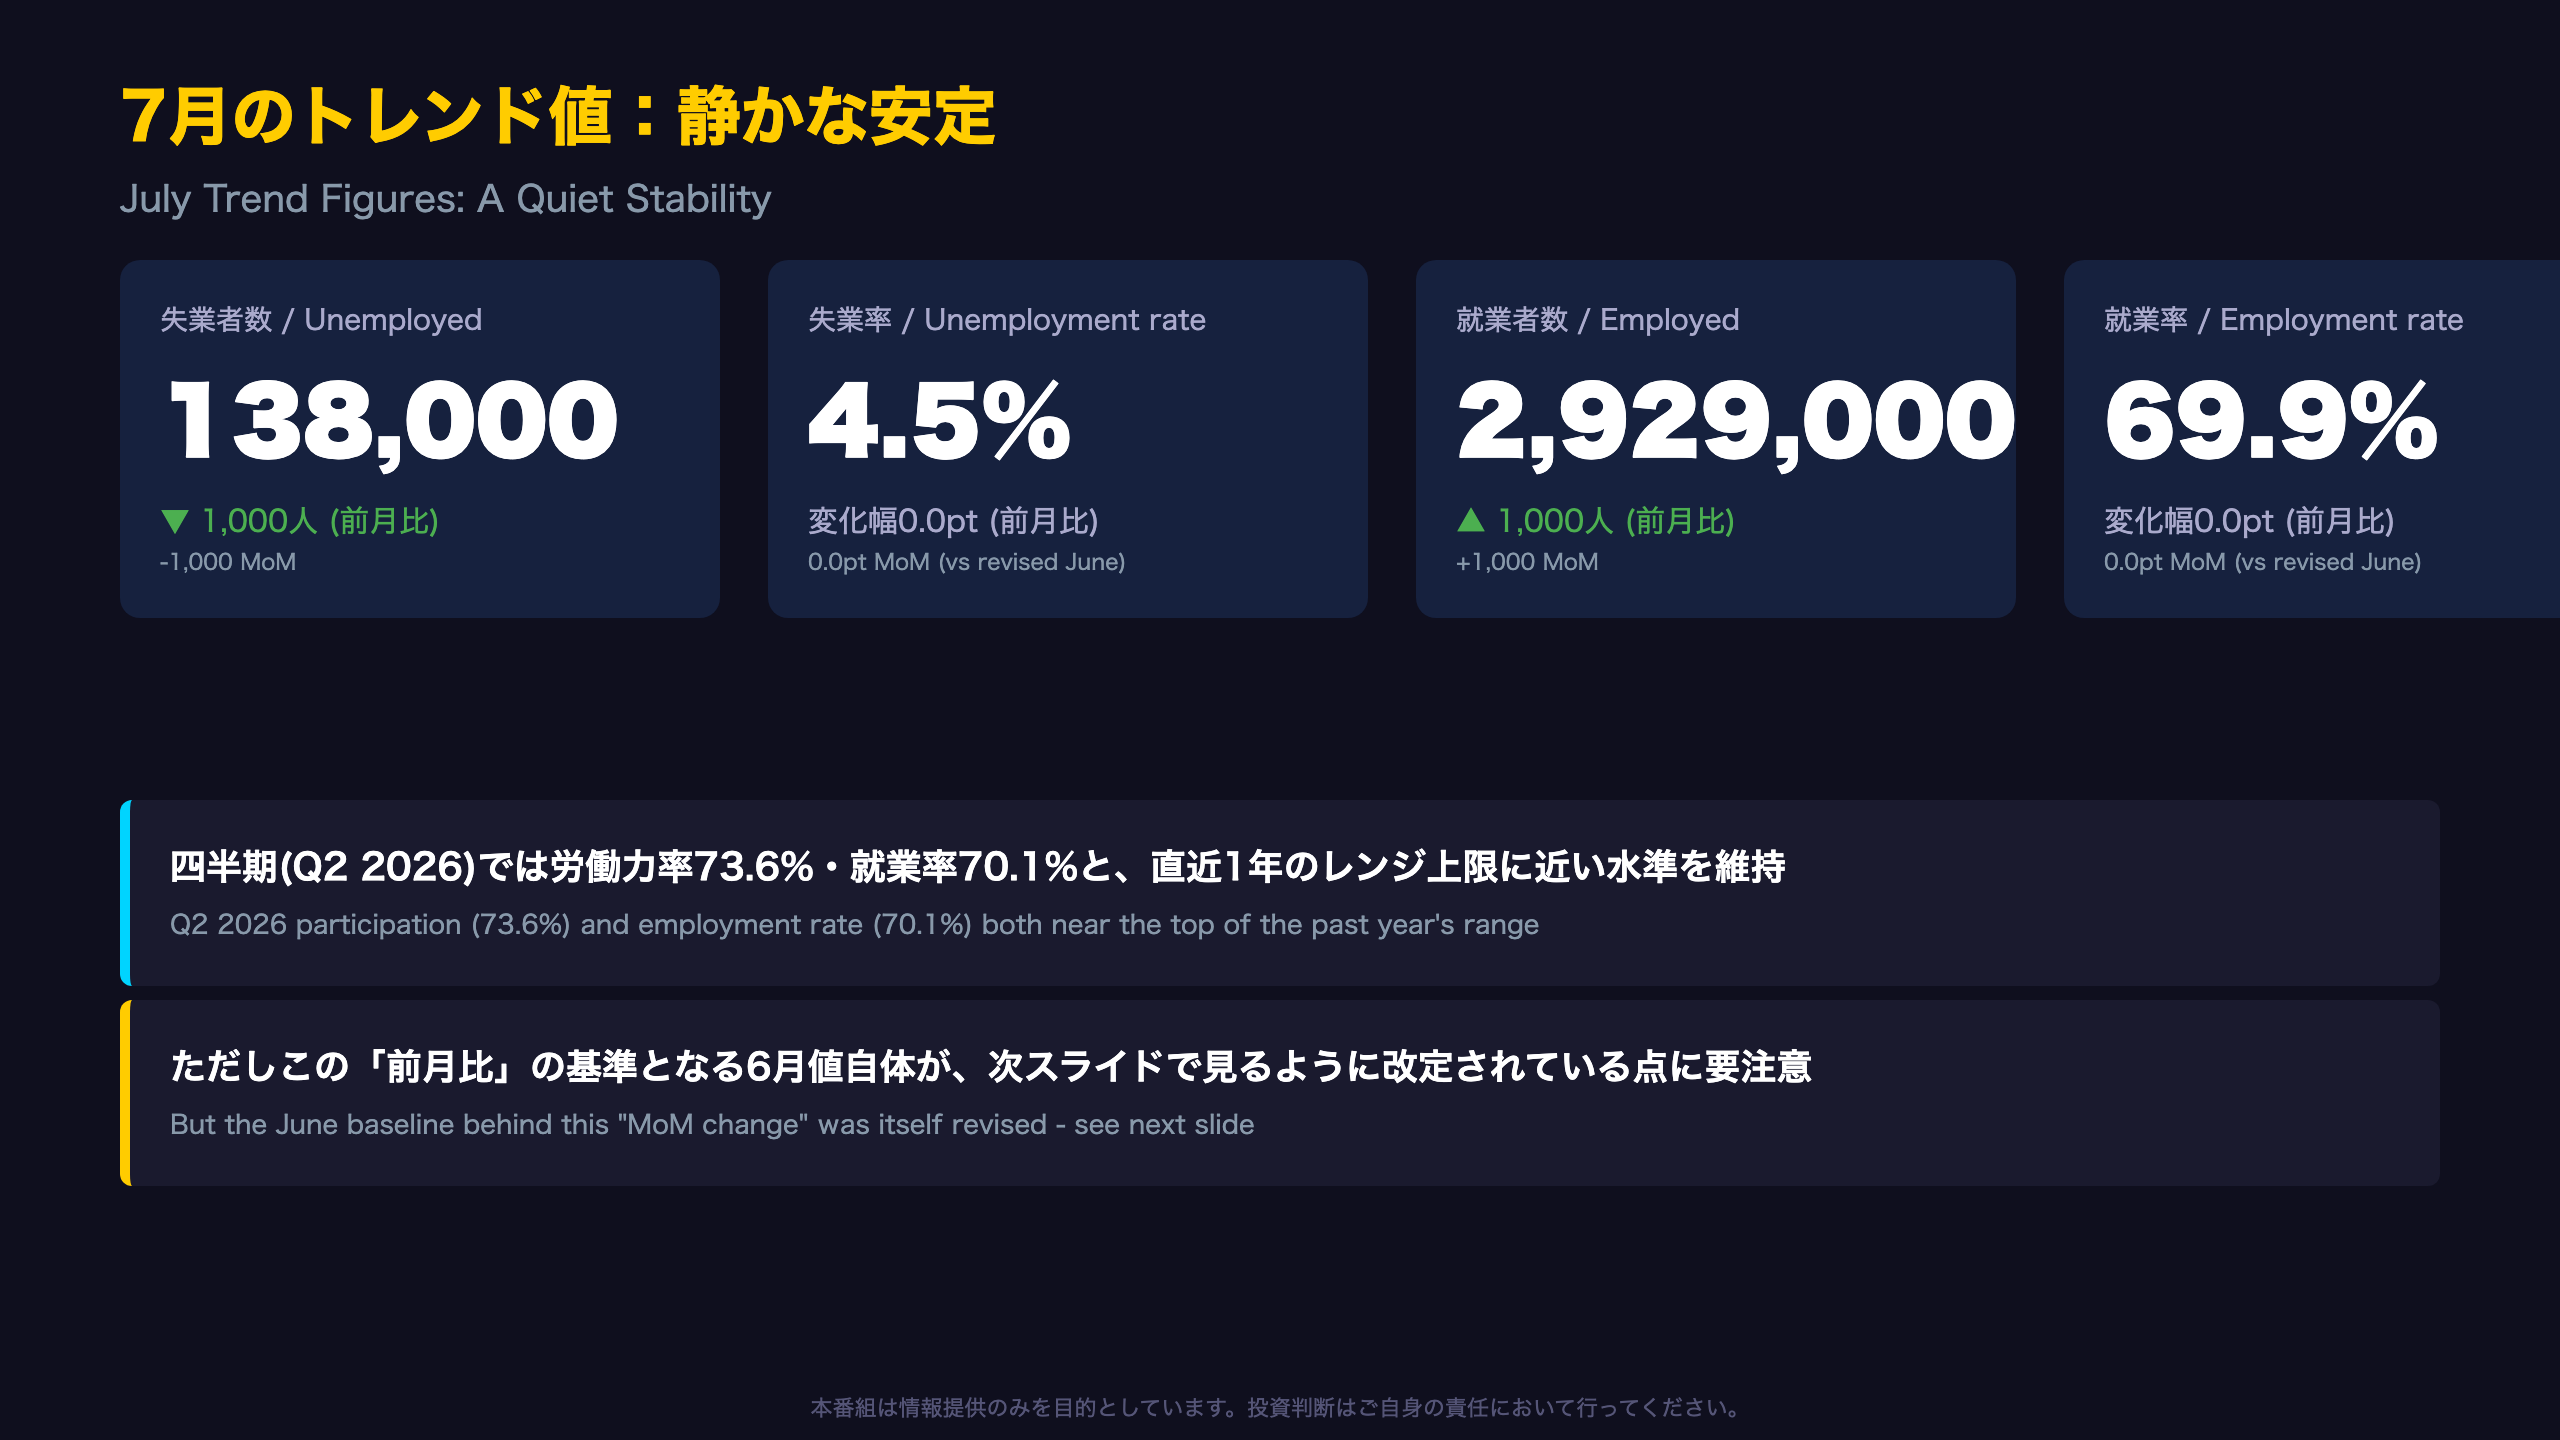
July’s trend estimates: 138,000 unemployed (4.5% of the labor force) and 2,929,000 employed (69.9% of the population aged 15-74). Month-on-month, that’s a modest -1,000 in unemployment and +1,000 in employment — hardly dramatic.
For readers unfamiliar with Nordic labor statistics: Norway’s LFS follows the EU/Eurostat harmonized definition, comparable to the U.S. Current Population Survey (CPS) that produces the headline U-3 unemployment rate. Unlike the U.S., Norway’s furloughed workers (“permittering”) are only counted as unemployed after three continuous months of leave — a structural quirk that can smooth out short-term layoff spikes relative to how U.S. data would capture them.
Quarterly figures (Q2 2026) show the labor force at 3,083,000, participation at 73.6%, and the employment rate at 70.1% — both near the top of the past year’s range, suggesting underlying labor supply remains robust even as the unemployment rate ticks around.
Why it matters for markets: A stable-to-firm participation rate reduces the risk of a sudden “hidden slack” surprise that could force Norges Bank into an abrupt policy shift.
改定の解剖:6月データは静かに書き換えられていた
Dissecting the Revision: A Data Detective Story
| Metric | Originally Reported (June) | Now Implied Revised (June) | Change |
|---|---|---|---|
| Unemployed | 143,000 | 139,000 | -4,000 |
| Unemployment rate | 4.7% | 4.5% | -0.2pt |
| Employed | 2,931,000 | 2,928,000 | -3,000 |
| Employment rate | 70.0% | 69.9% | -0.1pt |
SSB’s methodology confirms this is structural: “For monthly series, either a 9-, 13-, or 23-term Henderson moving average will be selected, and associated asymmetric variants towards the end” — meaning the most recent data points always carry the highest revision risk, comparable to how U.S. ADP or ISM PMI flash readings differ from final prints.
Alternative read: this revision isn’t necessarily bad news — it means the initial June estimate was too pessimistic (higher unemployment than reality), not that July genuinely collapsed. Investors should treat the July print’s month-on-month “improvement” with a wide confidence interval.
Bridge to next release: the September 23 update will show whether July’s 4.5%/2,929,000 print itself gets revised — the first real test of this trend’s durability.
若年層で割れる明暗:男性17.5%、女性10.8%
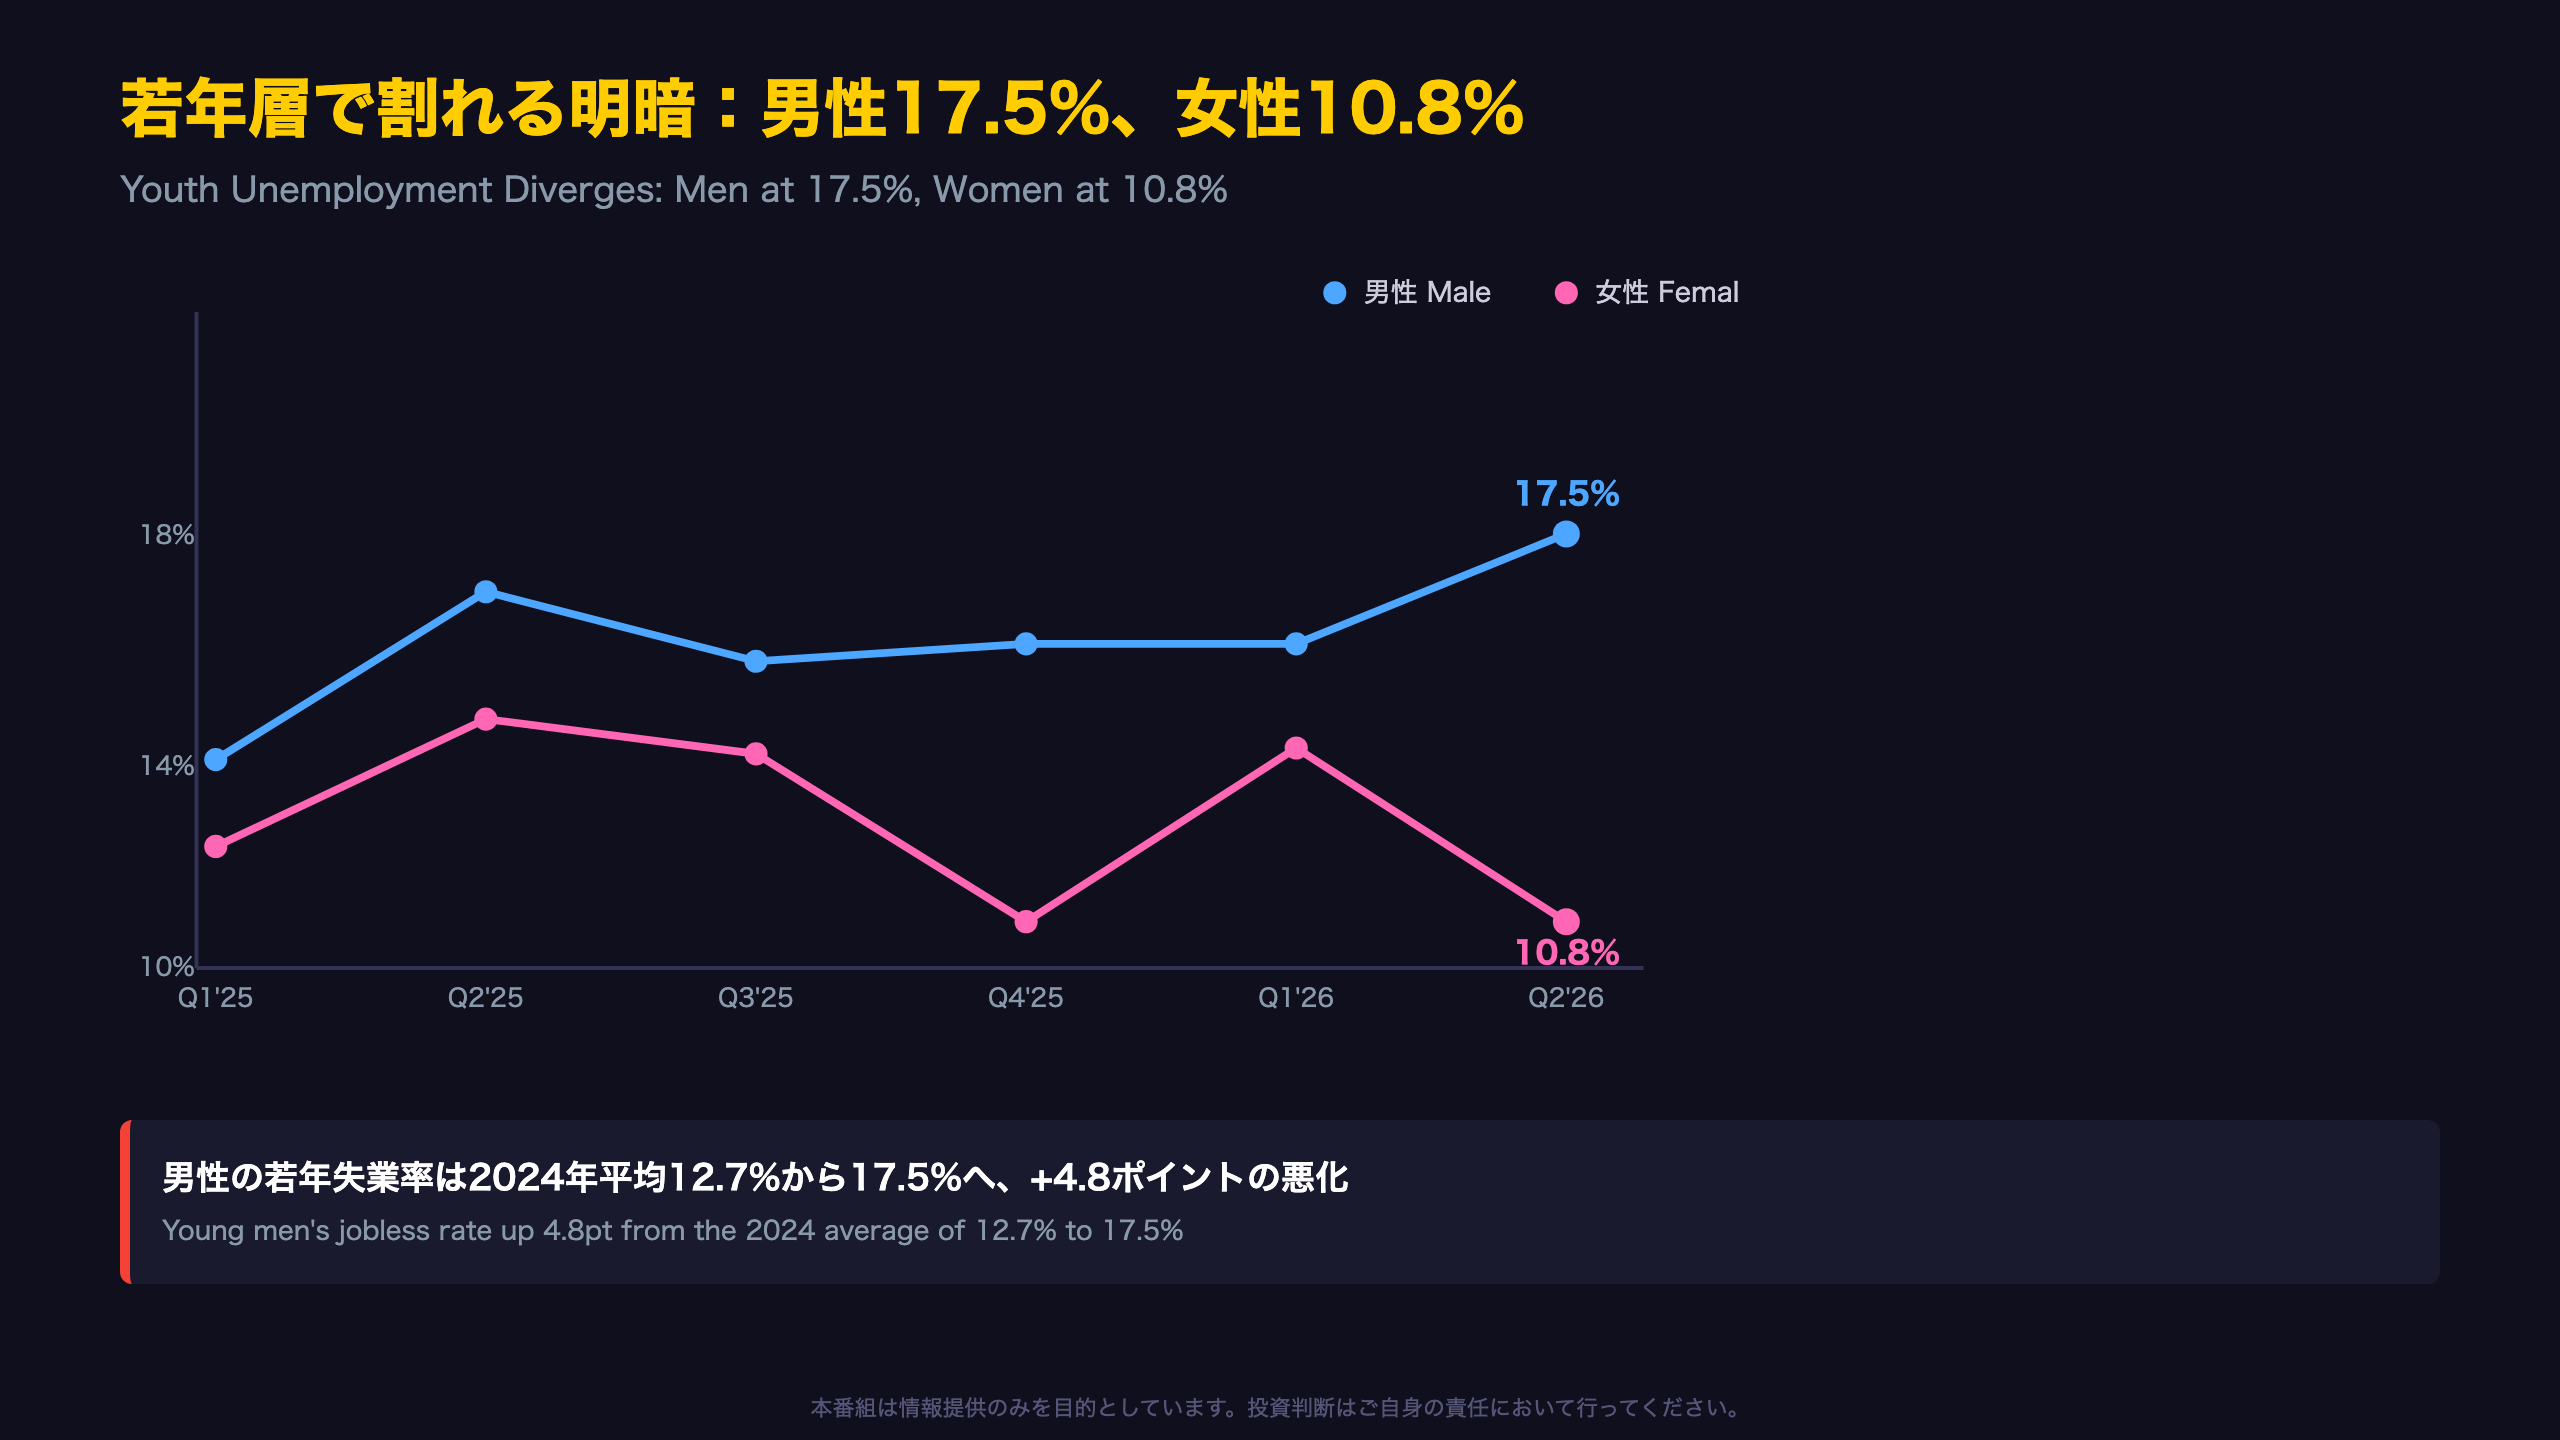
A Widening Gender Gap in Youth Unemployment
Tracking Table 4’s quarterly series from Q1 2025 through Q2 2026, young men’s (15-24) unemployment rate rose from 13.6% to 17.5% — a 3.9-point climb, and a full 4.8 points above the 2024 annual average of 12.7%. That’s a sharp deterioration by any standard, comparable in magnitude to swings seen during past European youth-employment stress episodes.
By contrast, young women’s unemployment fell to 10.8% in Q2 2026, below their 2024 average of 11.4%, despite high quarter-to-quarter volatility (small sample sizes make youth breakdowns statistically noisy, so caution is warranted).
For international readers: Norway’s youth unemployment (14.3% overall in Q2 2026) sits below the EU average but still runs roughly three times the headline national rate (4.5-4.8%) — a common pattern across developed labor markets, including the U.S., where teen/young-adult unemployment structurally exceeds the headline U-3 rate.
Possible driver (unconfirmed): hiring slowdowns in male-dominated sectors like construction and manufacturing could be a contributing factor, though the LFS data alone cannot confirm causation.
四半期ベースは2期連続4.8%、月次との温度差
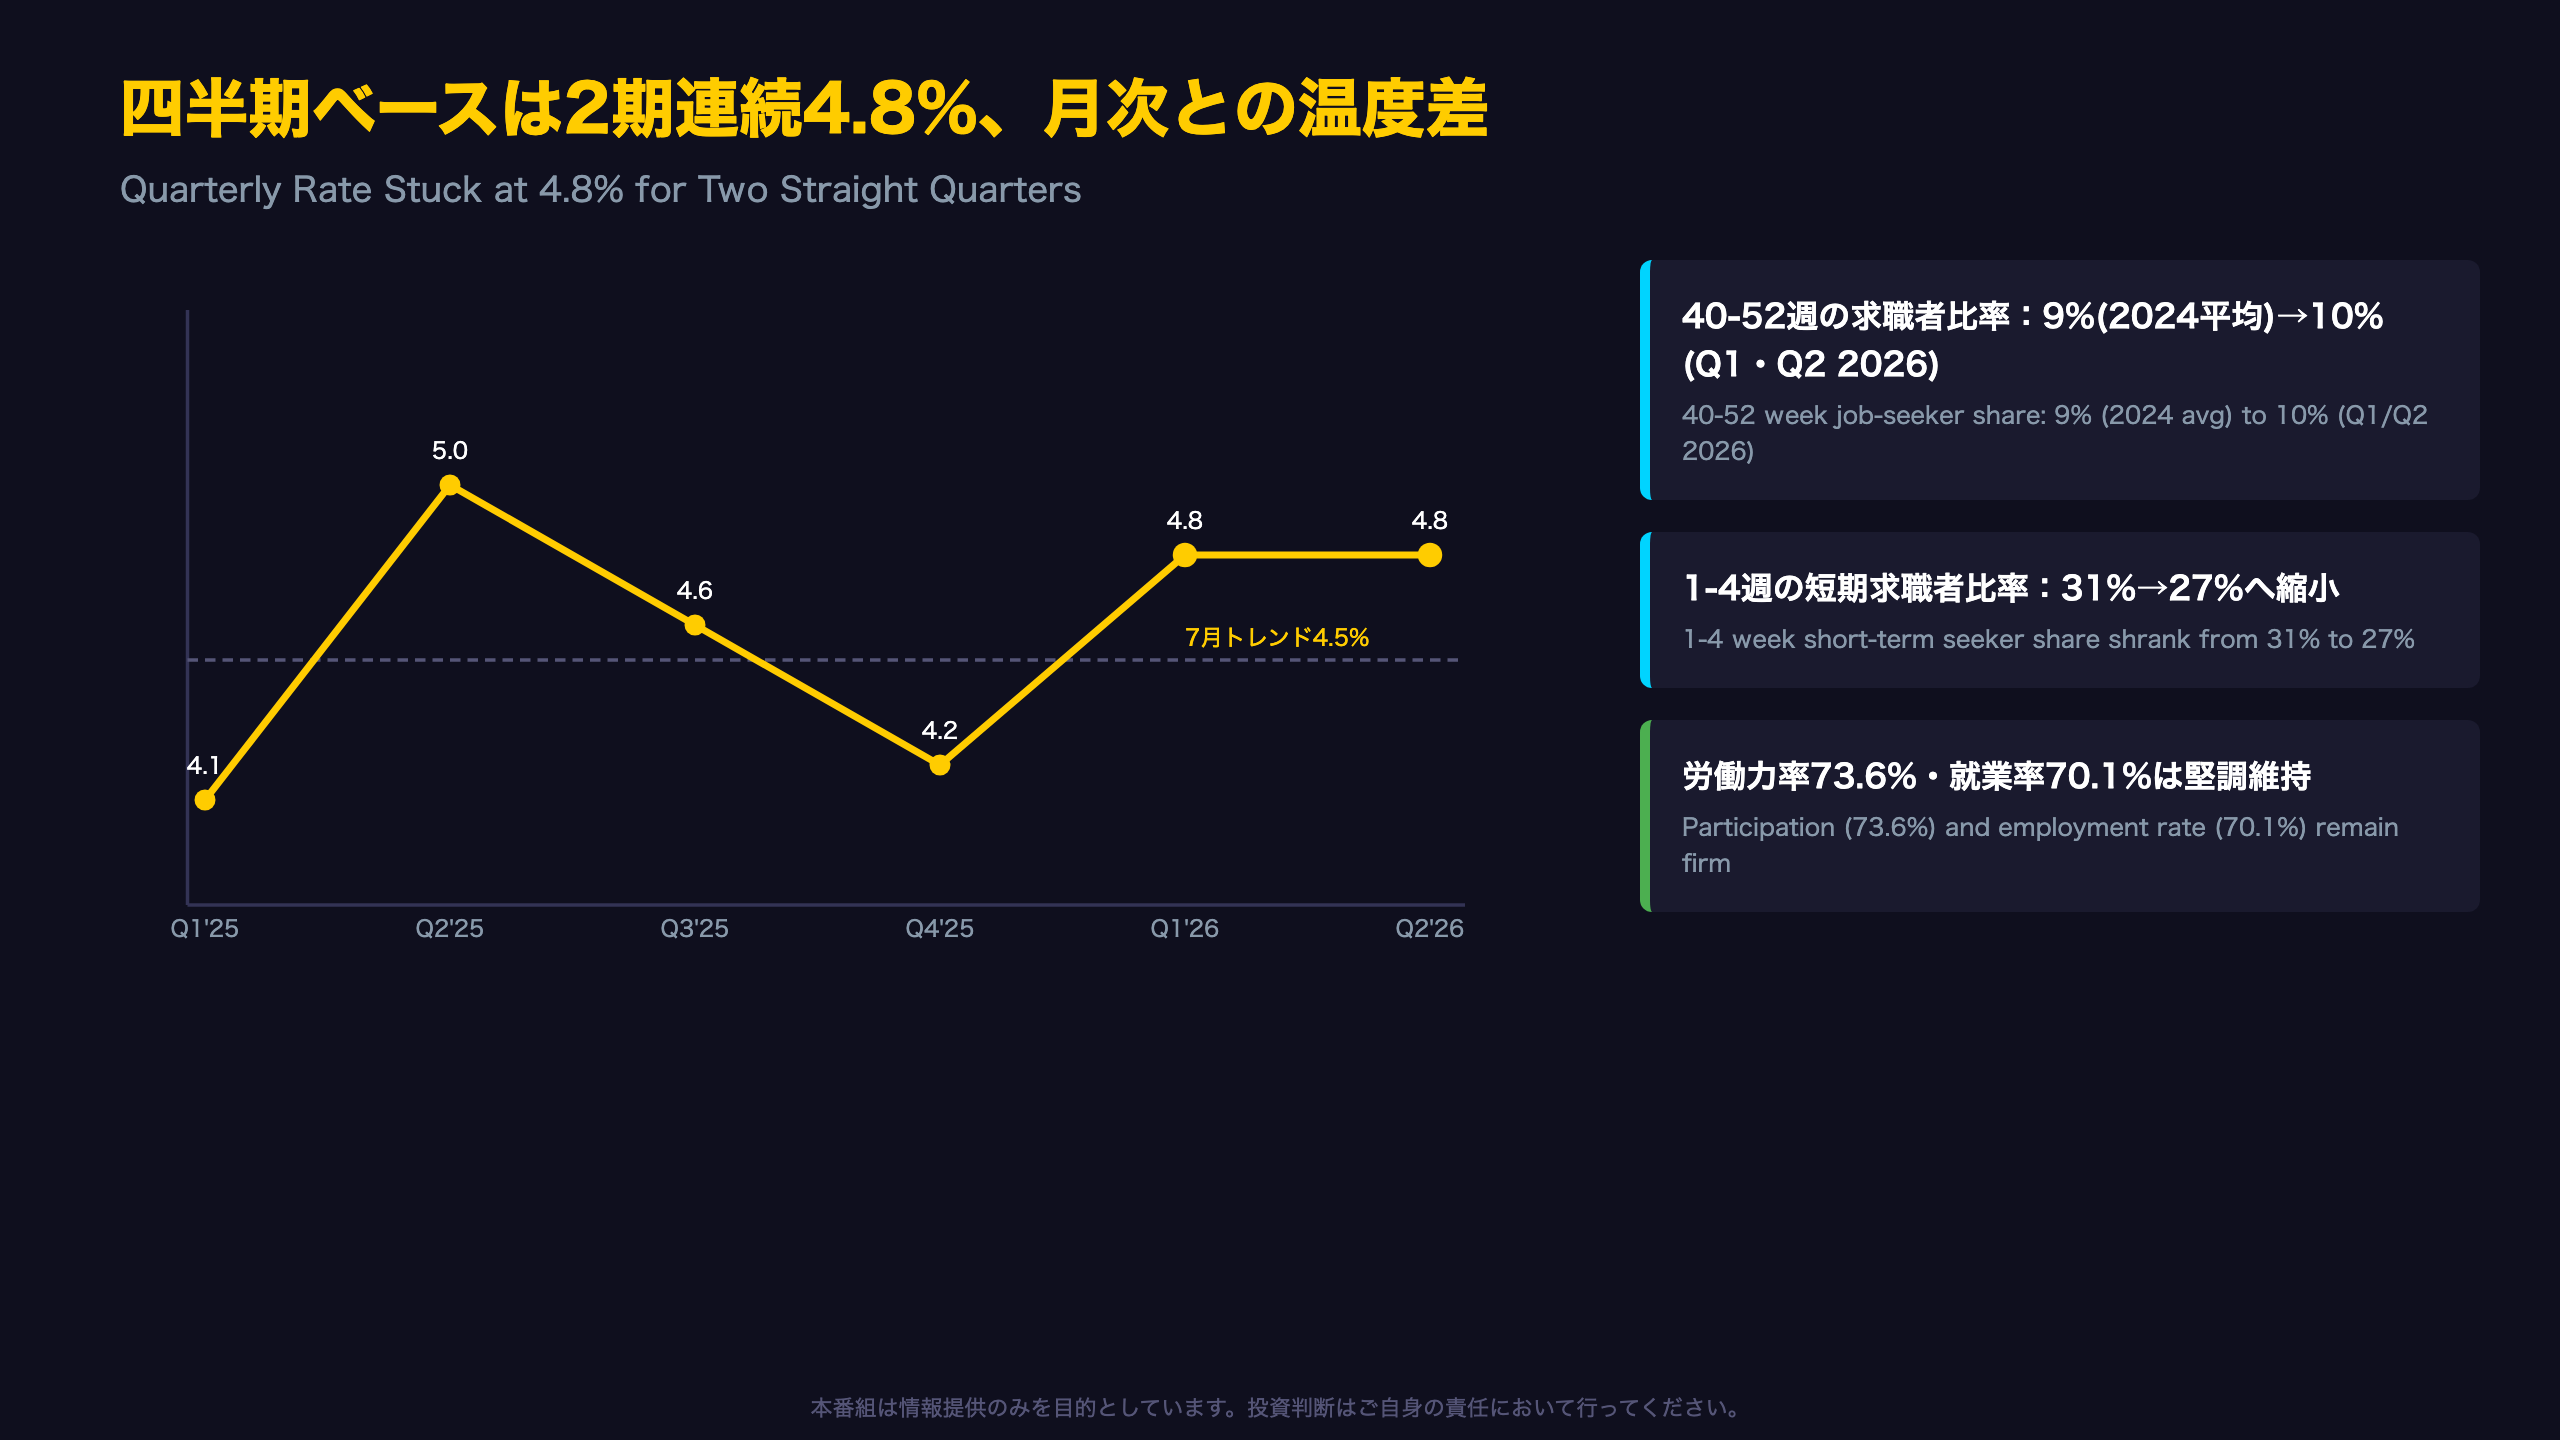
Duration Mix and the Quarterly Reality Check
Comparing 2024’s annual average to Q2 2026, the share of job seekers unemployed for just 1-4 weeks fell from 31% to 27%, while the 40-52 week bracket grew from 9% to 10% — a modest but real lengthening of average search duration.
Quarterly unemployment rates tell a more cautious story than the monthly trend: after peaking at 5.0% in Q2 2025 and dipping to 4.2% in Q4 2025, the rate has held at a cycle-high 4.8% for two consecutive quarters (Q1 and Q2 2026) — notably higher than the monthly trend’s 4.5% headline.
SSB itself advises users to “use the trends and the three-month gliding averages” rather than single-month figures — a caution that applies doubly here given the revision pattern uncovered in this release.
Market takeaway: With participation (73.6%) and employment rates (70.1%) still firm, this isn’t a labor-market breakdown story. But between revision risk and youth-male softening, Norges Bank has enough ambiguity to justify a patient, data-dependent stance rather than reacting to the July headline alone. Next release: September 23, 2026.
Disclaimer: This article is for informational purposes only. All investment decisions are made solely at your own risk.







