📺 Watch the Full Video Analysis
This article was automatically generated by the NFC Market Live AI analysis system. (Updated: 2026-08-19 15:09 JST)
📄 Primary Source
Office for National Statistics
https://www.ons.gov.uk/economy/inflationandpriceindices/bulletins/producerpriceinflation/july2026
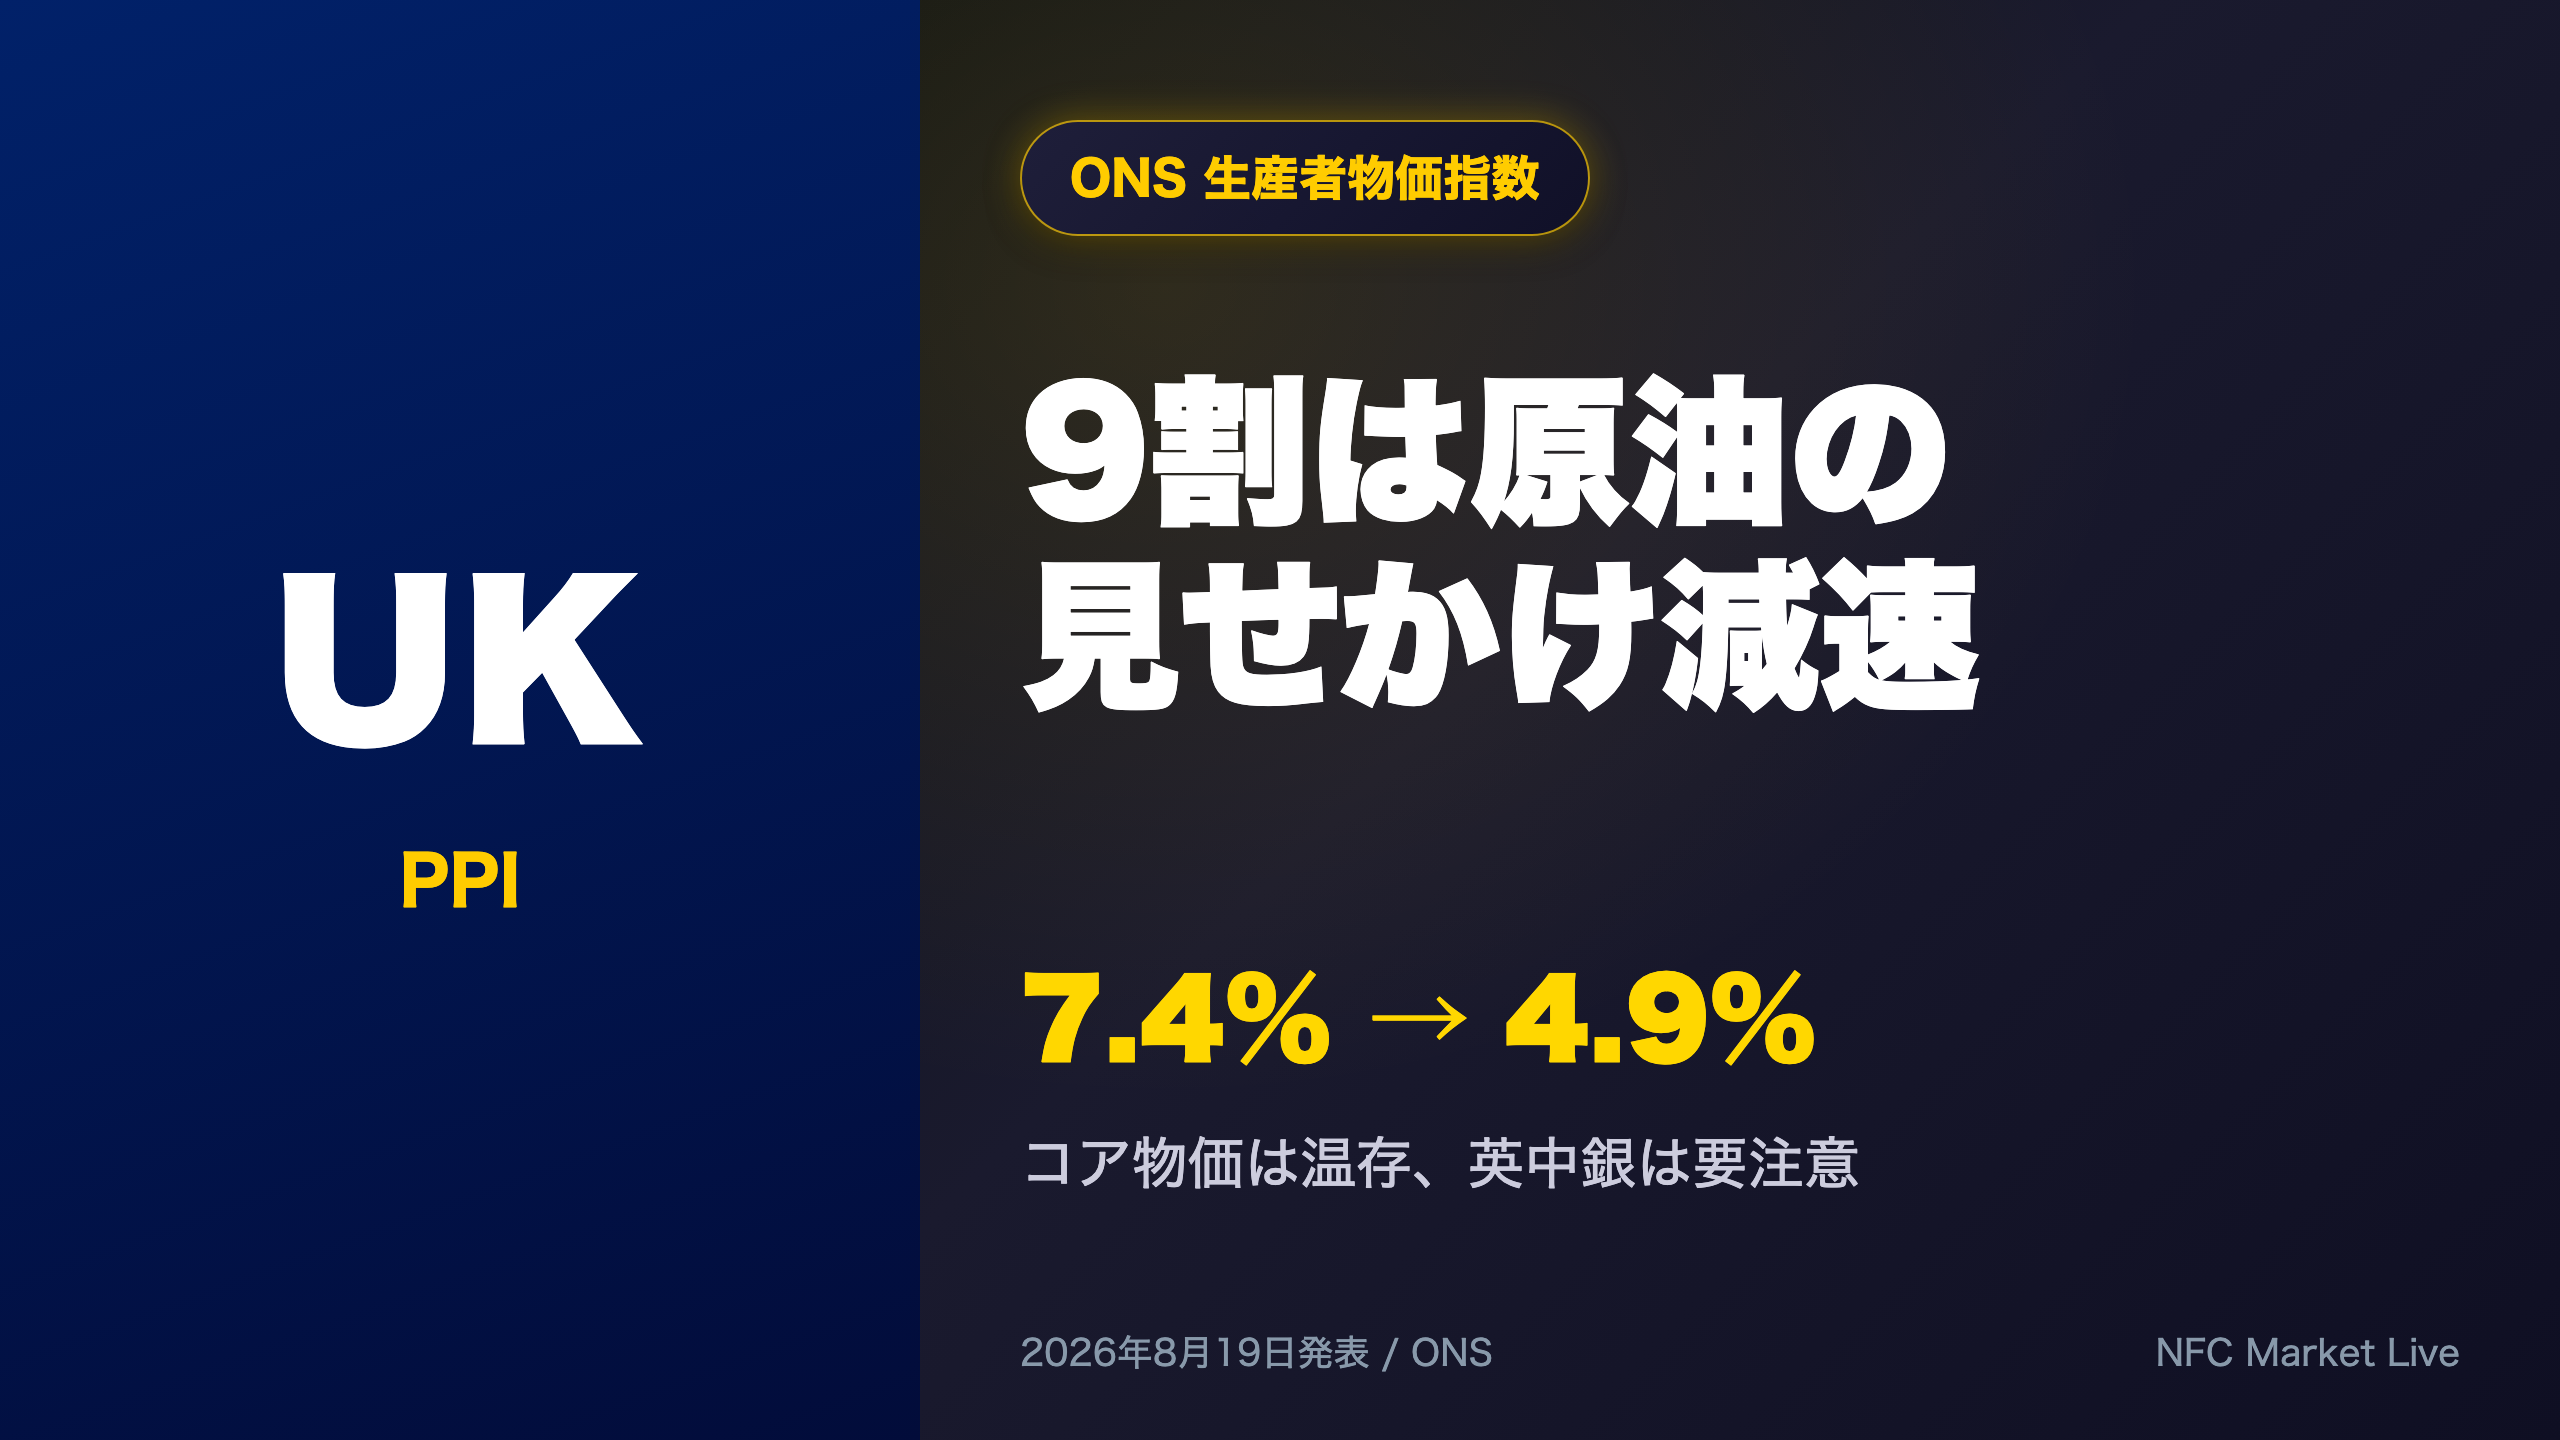
📊 UK PPI: Input price inflation plunged from 7.4% to 4.9% YoY.
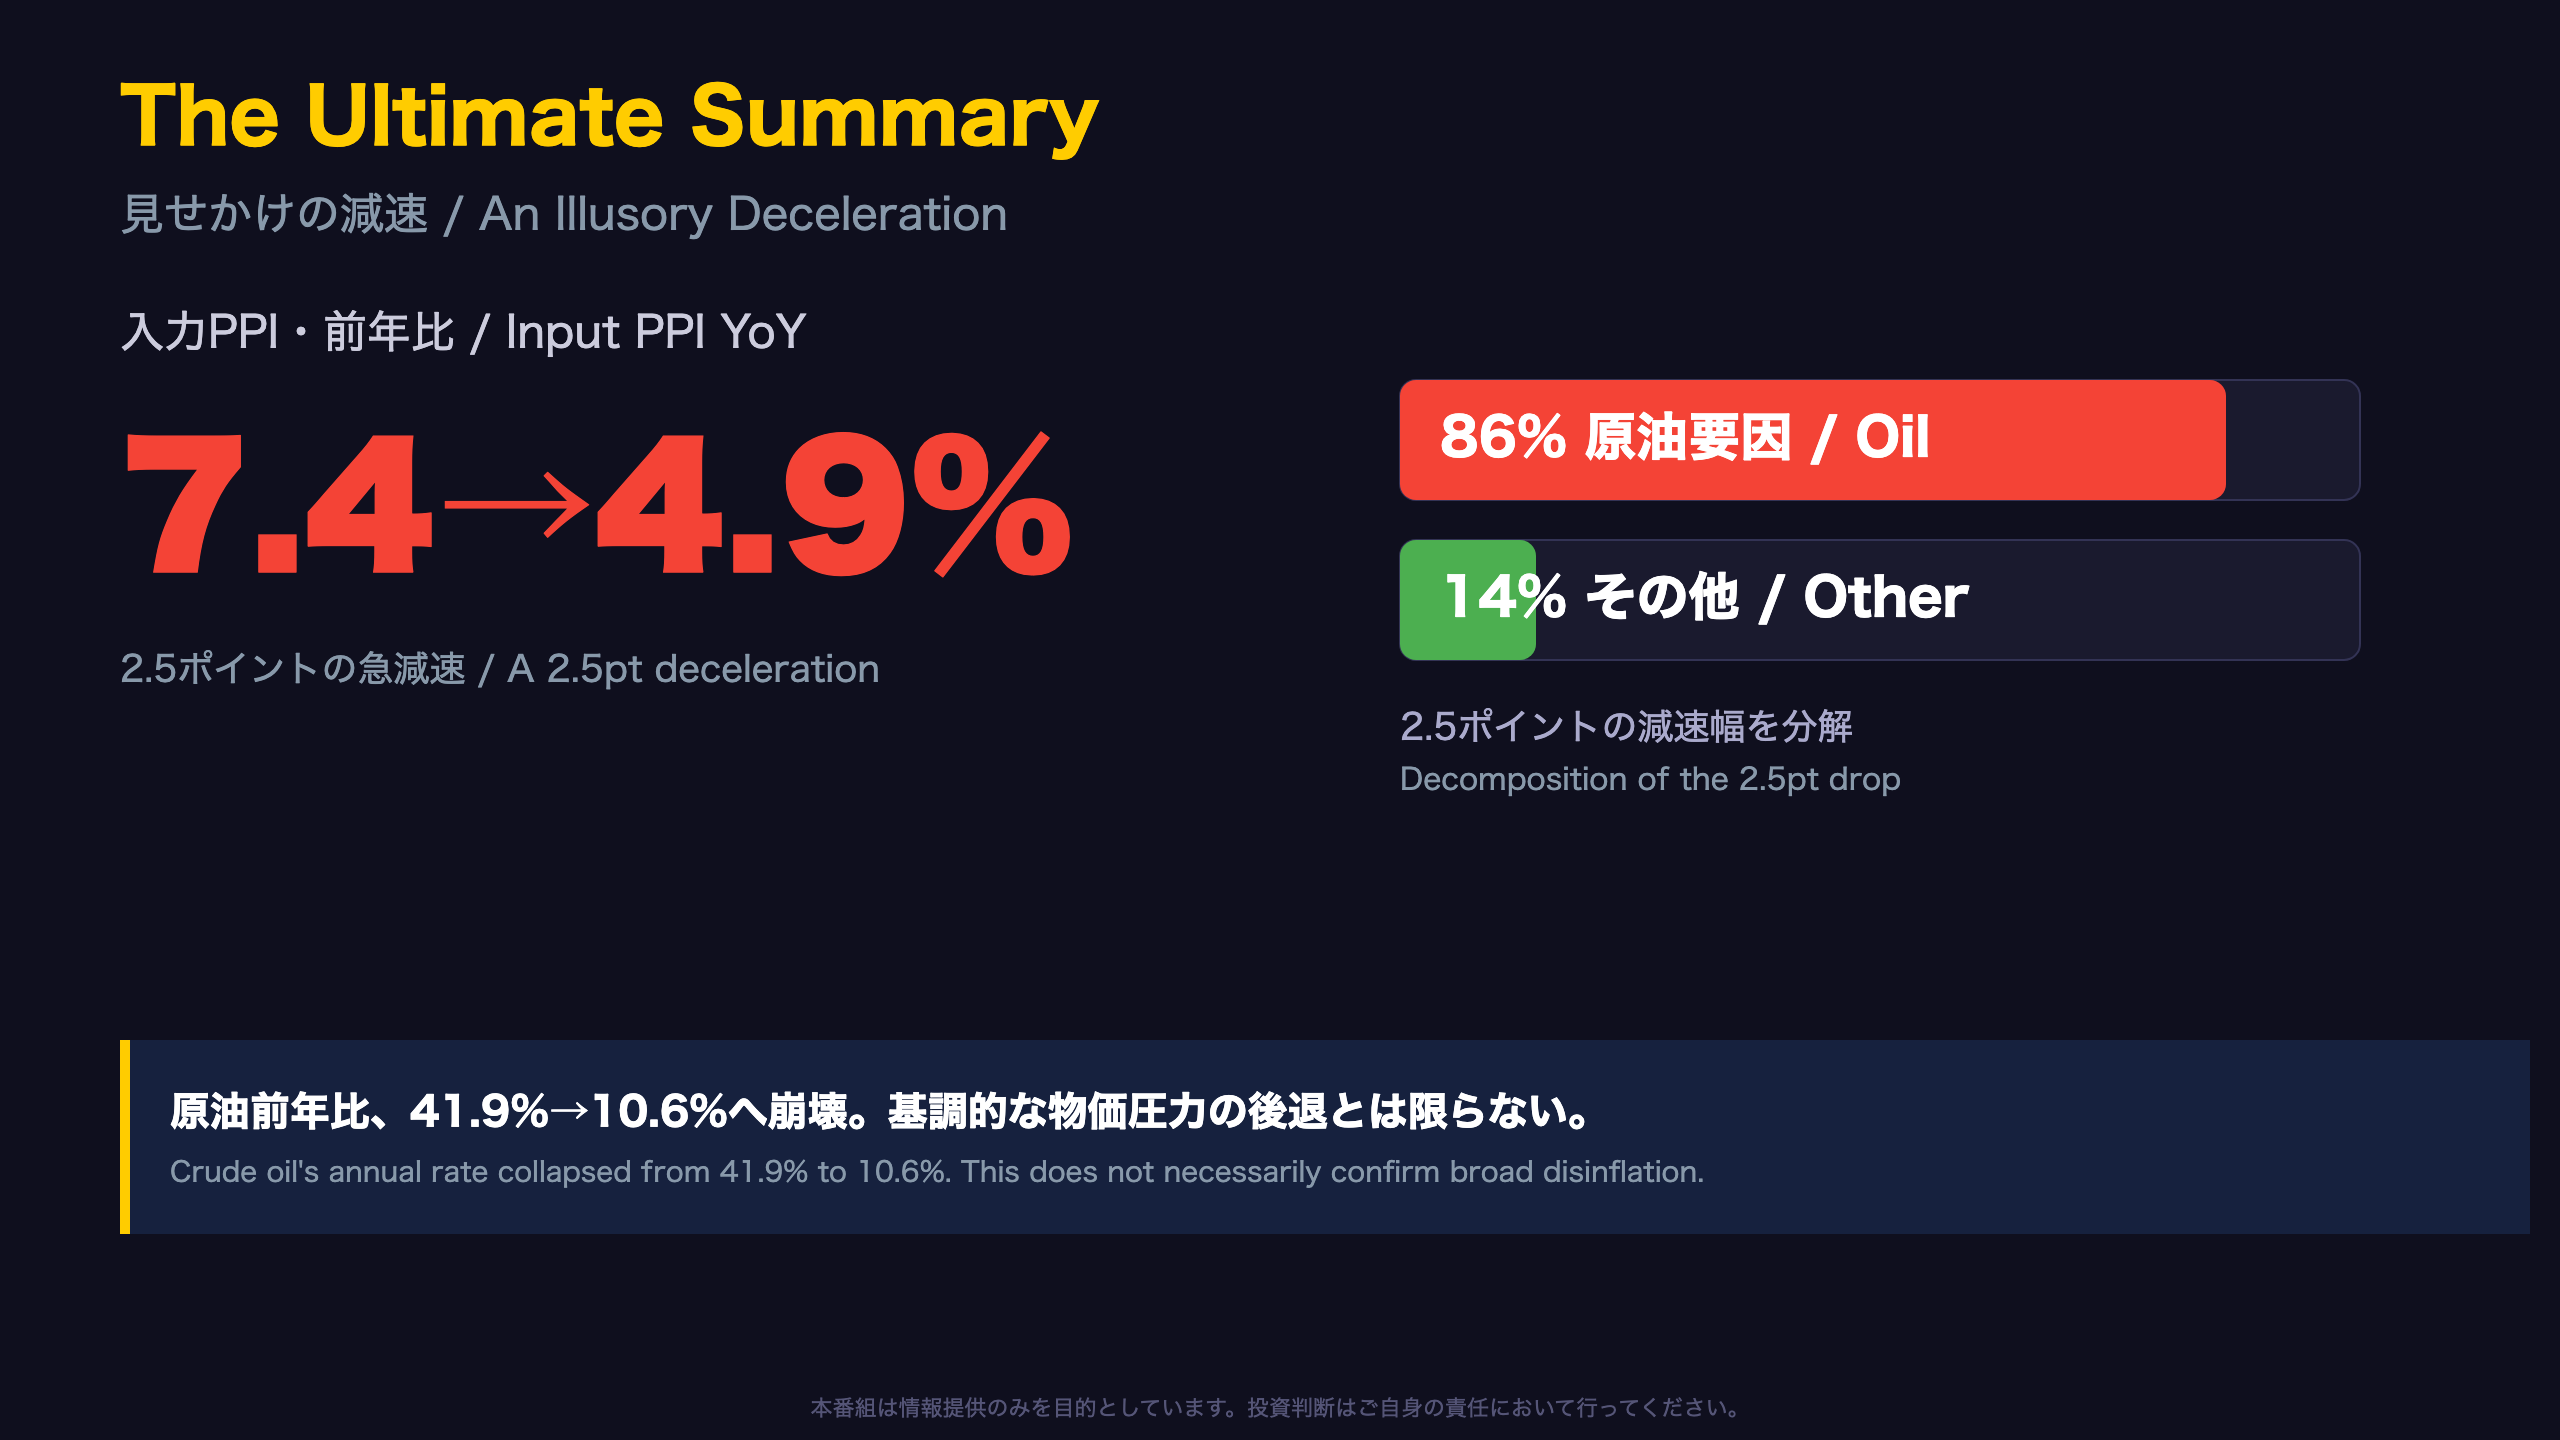
⚠️ But nearly 86% of that drop traces to a single crude oil base effect.
📈 Core categories—metals, chemicals, electronics—stayed sticky, some even accelerated.
🥛 Domestic food deflation deepened, a rare bright spot for consumers.
💷 Sterling’s effective exchange rate turned positive for the first time this year.
🏦 We break down what this really means for the Bank of England and GBP.
The Ultimate Summary:見せかけの減速
The “90% Rule” Behind the Headline
The UK’s Producer Price Index (PPI), published monthly by the Office for National Statistics (ONS), tracks costs paid by manufacturers (input prices) and prices they charge (output/factory-gate prices). It functions similarly to the US Producer Price Index published by the Bureau of Labor Statistics, serving as an early warning gauge for pipeline inflation before it reaches consumers via the CPI.
July’s release showed input price inflation falling from 7.4% (June, revised) to 4.9% — a 2.5 percentage point drop. But decomposing the move reveals something crucial: crude oil, which carries just a 6.9% weight in the input basket, saw its annual rate collapse from 41.9% to 10.6% in a single month. Using simple weighted arithmetic, oil alone explains roughly 2.16 of the 2.5-point deceleration — about 86% of the entire headline move.
“Crude oil provided the largest contribution to the fall in the annual inflation rate for input prices in July 2026, with prices falling by 18.0% on the month.”
This matters because oil prices fell -20.9% and -18.0% month-on-month in June and July respectively — the sharpest two-month drop since the COVID crash of April 2020 — driven by the unwinding of a Middle East conflict-related spike earlier in 2026.
Market implication: Traders should be cautious about reading this deceleration as broad-based disinflation. If it’s overwhelmingly a base-effect mirage, the Bank of England (BOE) may find less comfort here than headline numbers suggest, with implications for GBP and gilt yields once the energy effect fades by autumn.
Next release: September 16, 2026.
非対称な減速:入力 vs 出力
A Two-Speed Deceleration
Comparing the last four months of annual PPI readings reveals a striking asymmetry:
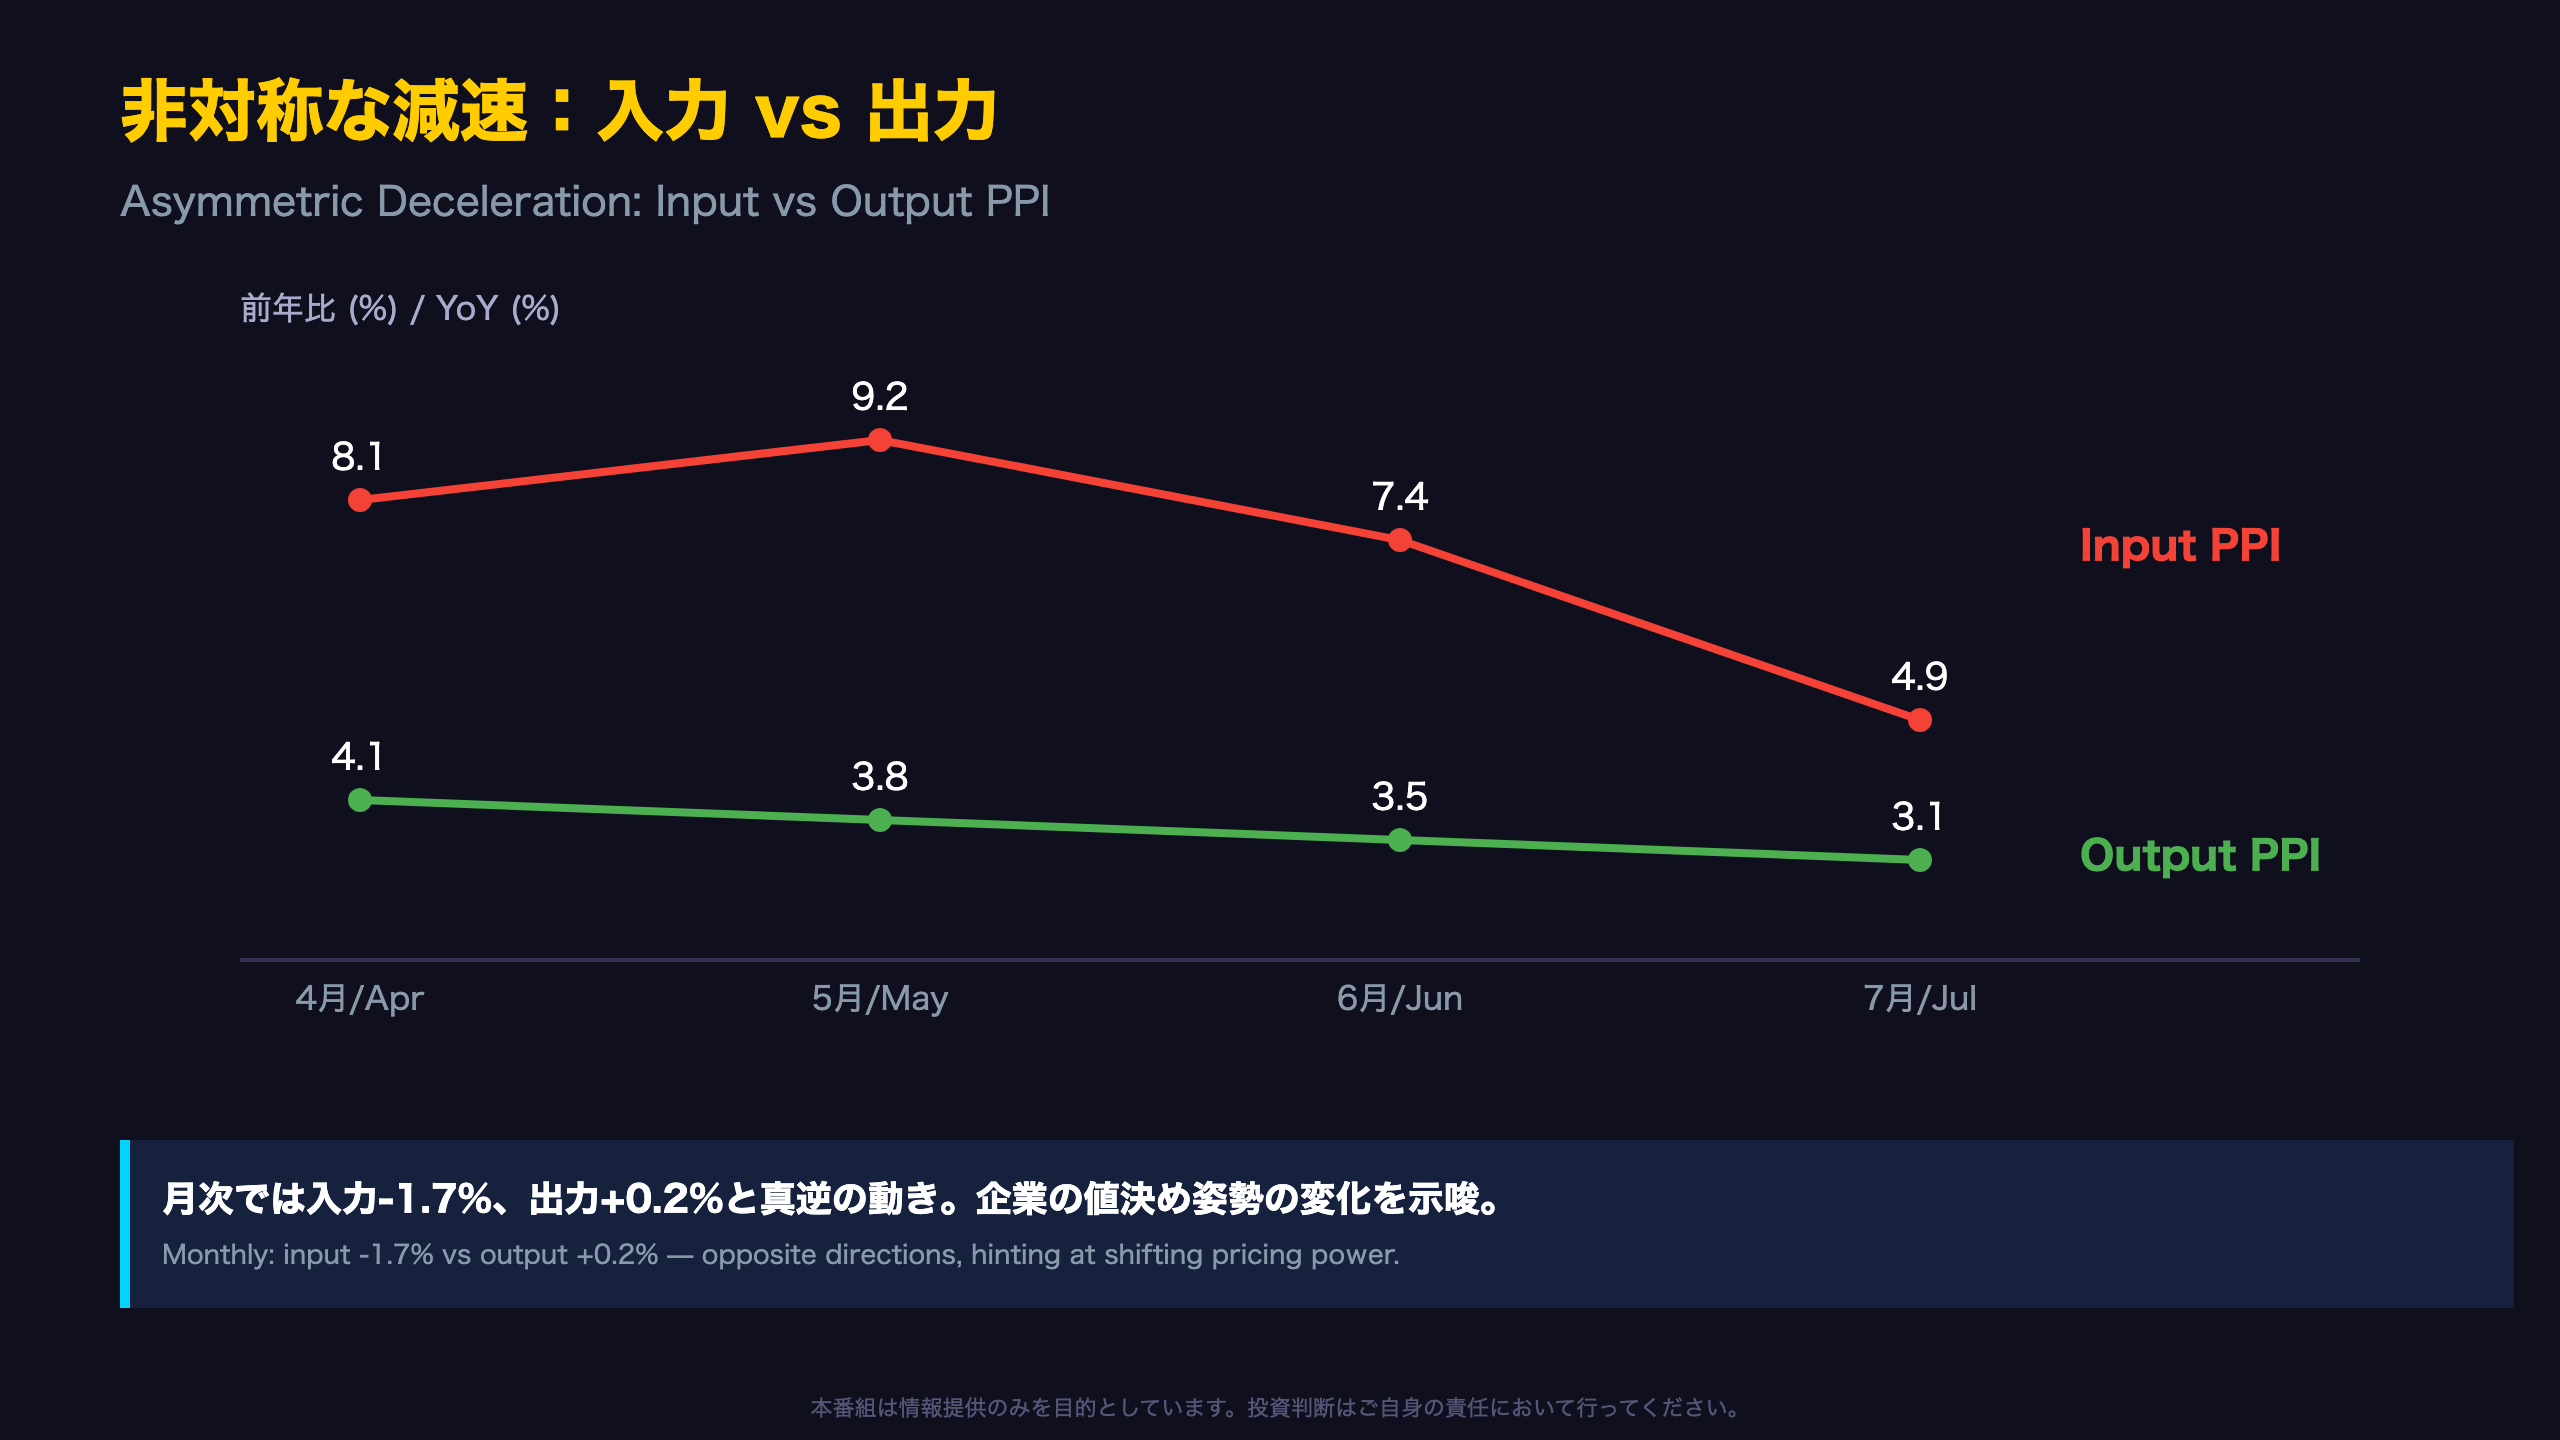
- Input prices: Apr 8.1% → May 9.2% (revised) → June 7.4% (revised) → July 4.9%
- Output prices: Apr 4.1% → May 3.8% (revised) → June 3.5% → July 3.1%
Input prices swung by 4.3 percentage points from their May peak to July, while output prices moved just 0.7 points over the same span. In a textbook pass-through model, sharp swings in input costs eventually show up in factory-gate prices with a lag. Here, the swing is barely visible on the output side.
The monthly data sharpens this picture. Input prices fell for a second straight month (-1.9% in June, revised; -1.7% in July), while output prices flipped from flat/negative (-0.1% in June, revised) to positive (+0.2%) in July. In other words, even as manufacturers’ raw material costs kept falling, businesses raised — not cut — their selling prices last month.
This dynamic somewhat parallels debates in US PPI and Eurozone PPI data, where analysts distinguish between “cost-push” (input-driven) and “margin-driven” (output-driven) inflation phases. A widening input-output gap typically signals margin rebuilding by producers — a lagging but persistent inflationary force even as headline cost pressures ease.
One caveat: monthly output price moves have ranged roughly ±1.4% over the past year, so a single +0.2% print is not statistically extreme. Watch whether this reverses or persists in the September 16 release.
原油の乱高下:なぜ一項目で説明できるのか
The Arithmetic of a One-Item Story
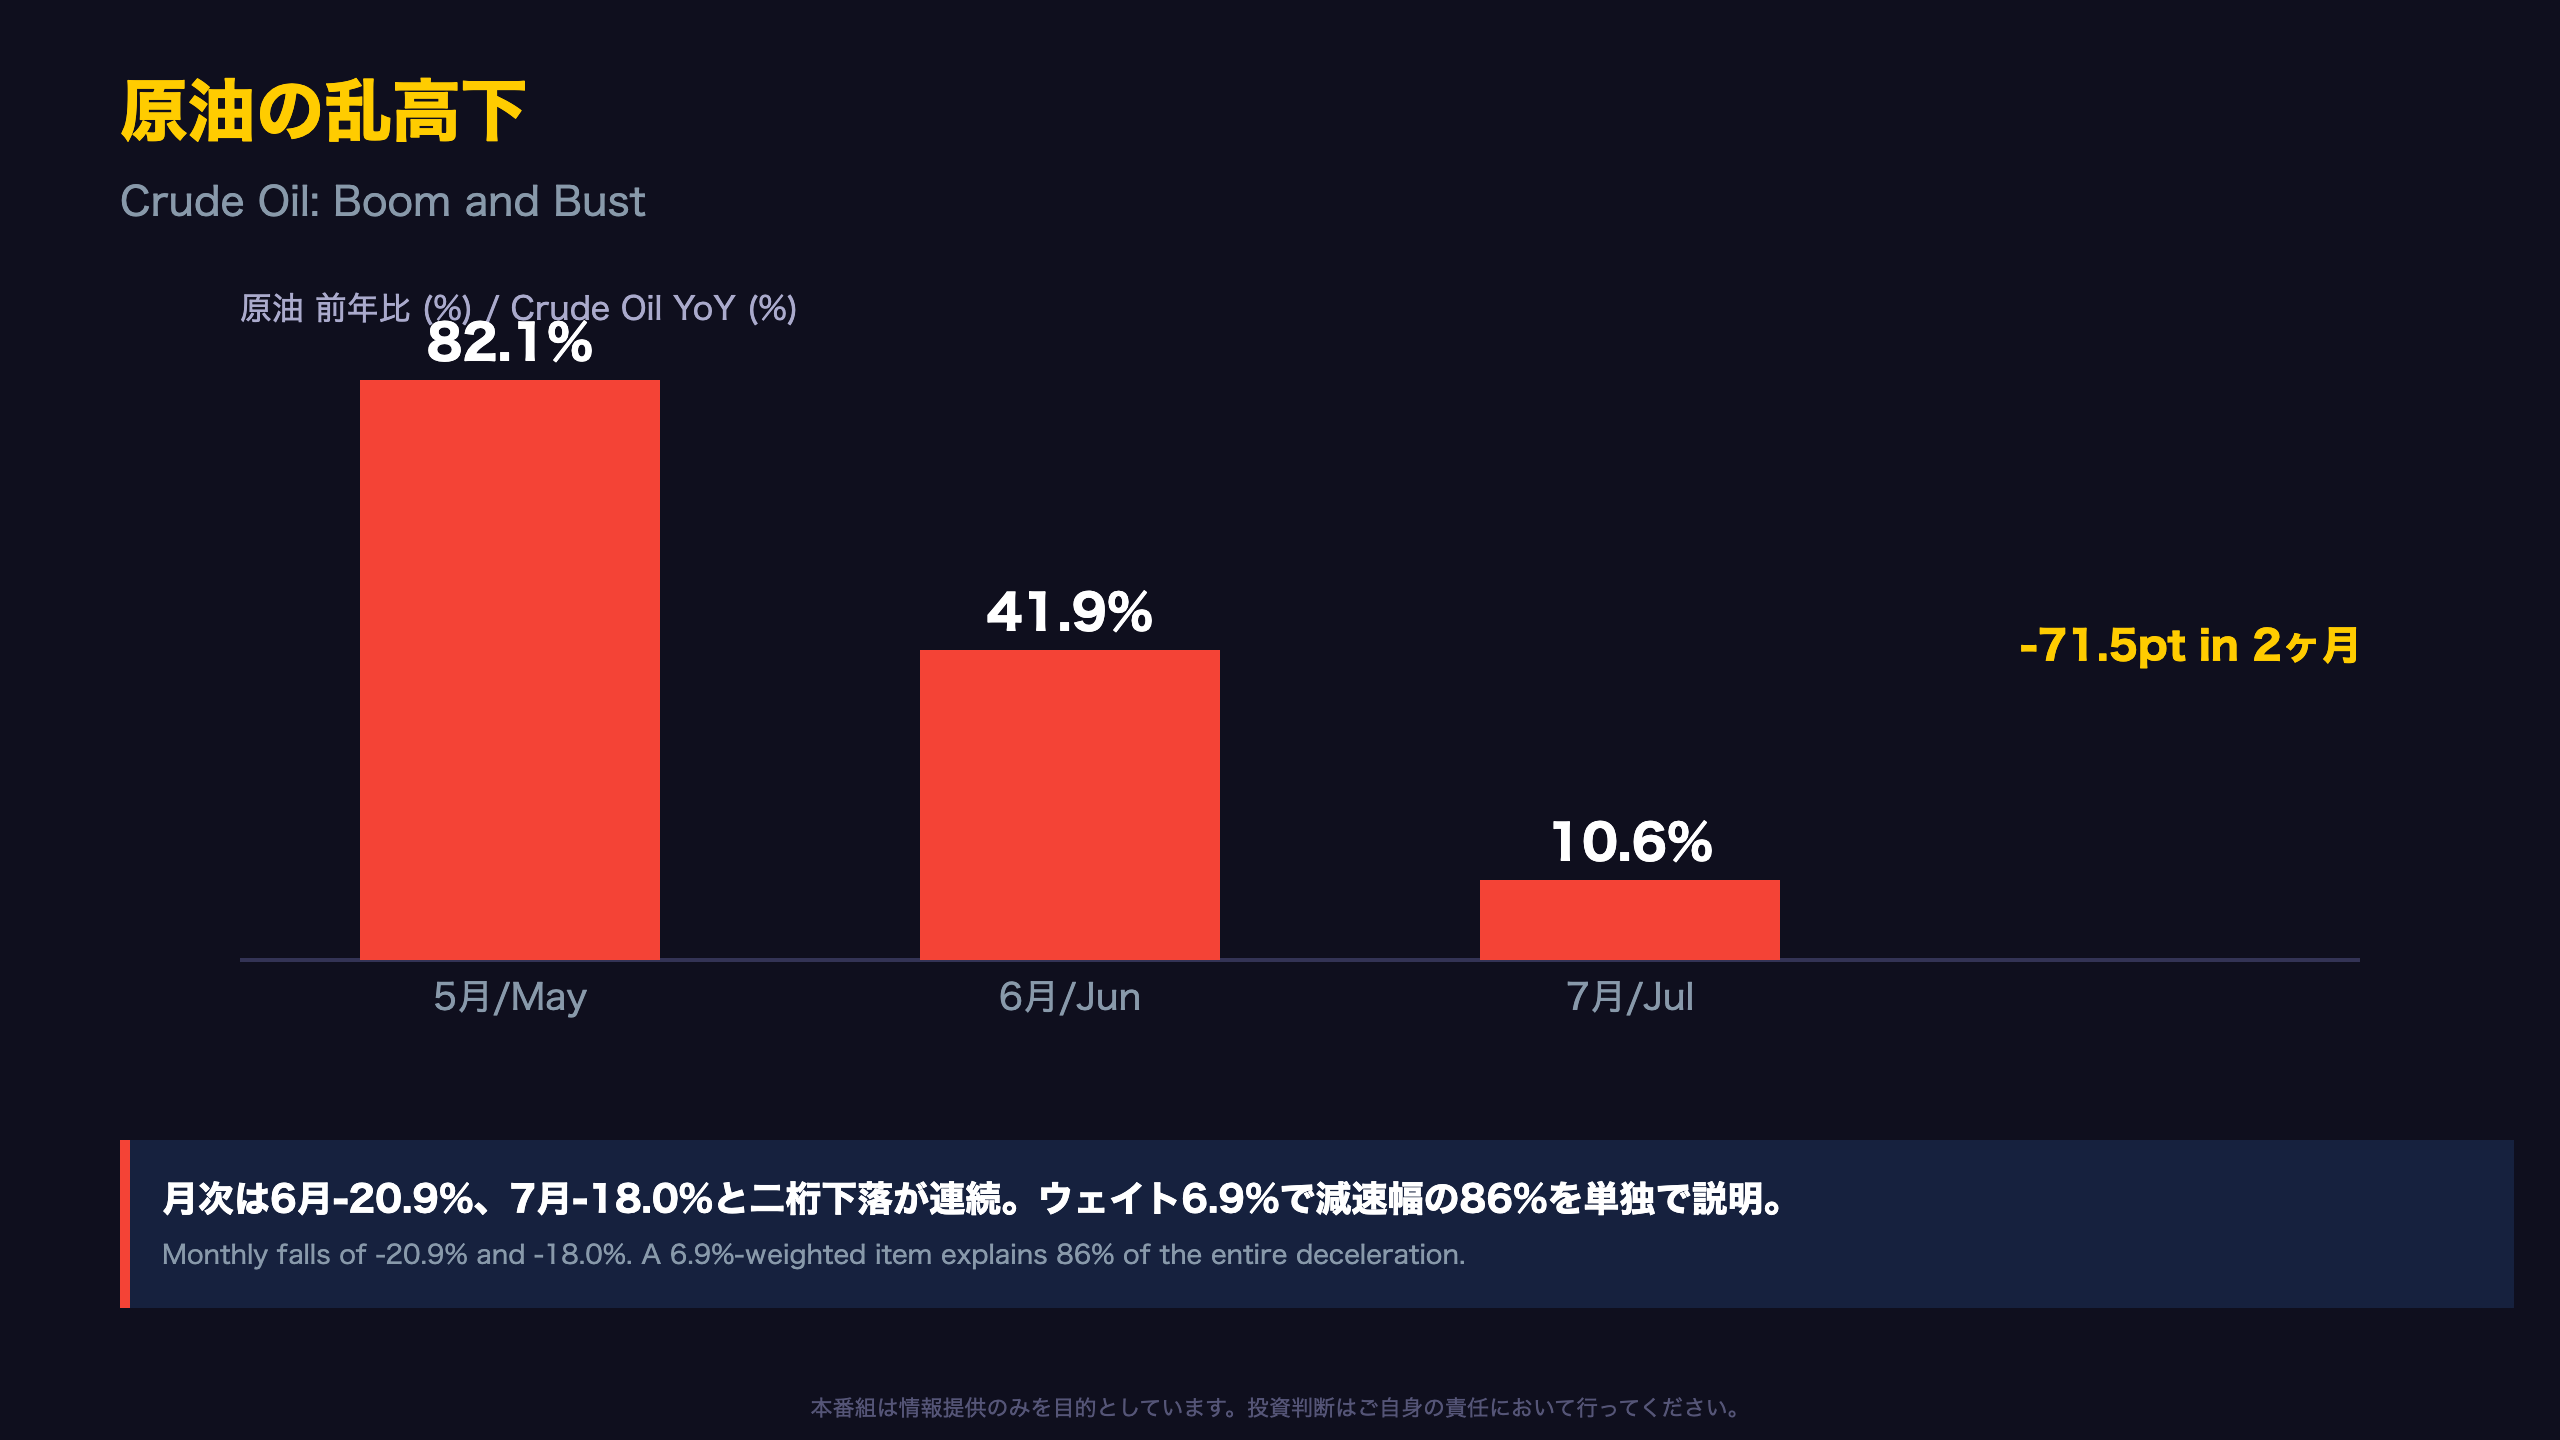
The math here is straightforward: multiply an item’s index weight by its year-on-year rate change to approximate its contribution. Crude oil, weighted at just 6.9% of the input basket, saw its annual rate swing by 31.3 percentage points (41.9% → 10.6%). That translates to roughly 2.16 percentage points of contribution — about 86% of the entire 2.5-point deceleration in headline input PPI.
Tracing the oil numbers over three months tells a boom-bust story:
- May: +82.1% YoY (revised), -0.2% MoM (revised)
- June: +41.9% YoY (revised), -20.9% MoM (revised)
- July: +10.6% YoY, -18.0% MoM
ONS had already flagged June’s monthly decline as the largest since the COVID crash of April 2020 — and July’s drop extended that historic slide. The bulletin again attributes this to the ongoing effects of the Middle East conflict, suggesting a geopolitically-driven price spike earlier in 2026 is now unwinding at a similarly dramatic pace.
For US and European PPI readers, note that UK producer price series can be far more volatile around energy components than headline CPI, given oil and gas’s direct weight in manufacturing inputs versus a more diluted weight in consumer baskets — analogous to how US PPI energy components can swing far more than core PCE.
That said, dismissing this as pure noise may be too simplistic — falling cash input costs genuinely reduce near-term cost burdens across supply chains (transport, chemicals, plastics). The key uncertainty: once the oil base effect fully washes out (likely by autumn 2026), will core categories like metals (+8.4%) and chemicals (+6.1%) decelerate meaningfully, or hold firm? That is the true test of underlying disinflation.
コアの粘着性と、数少ない朗報
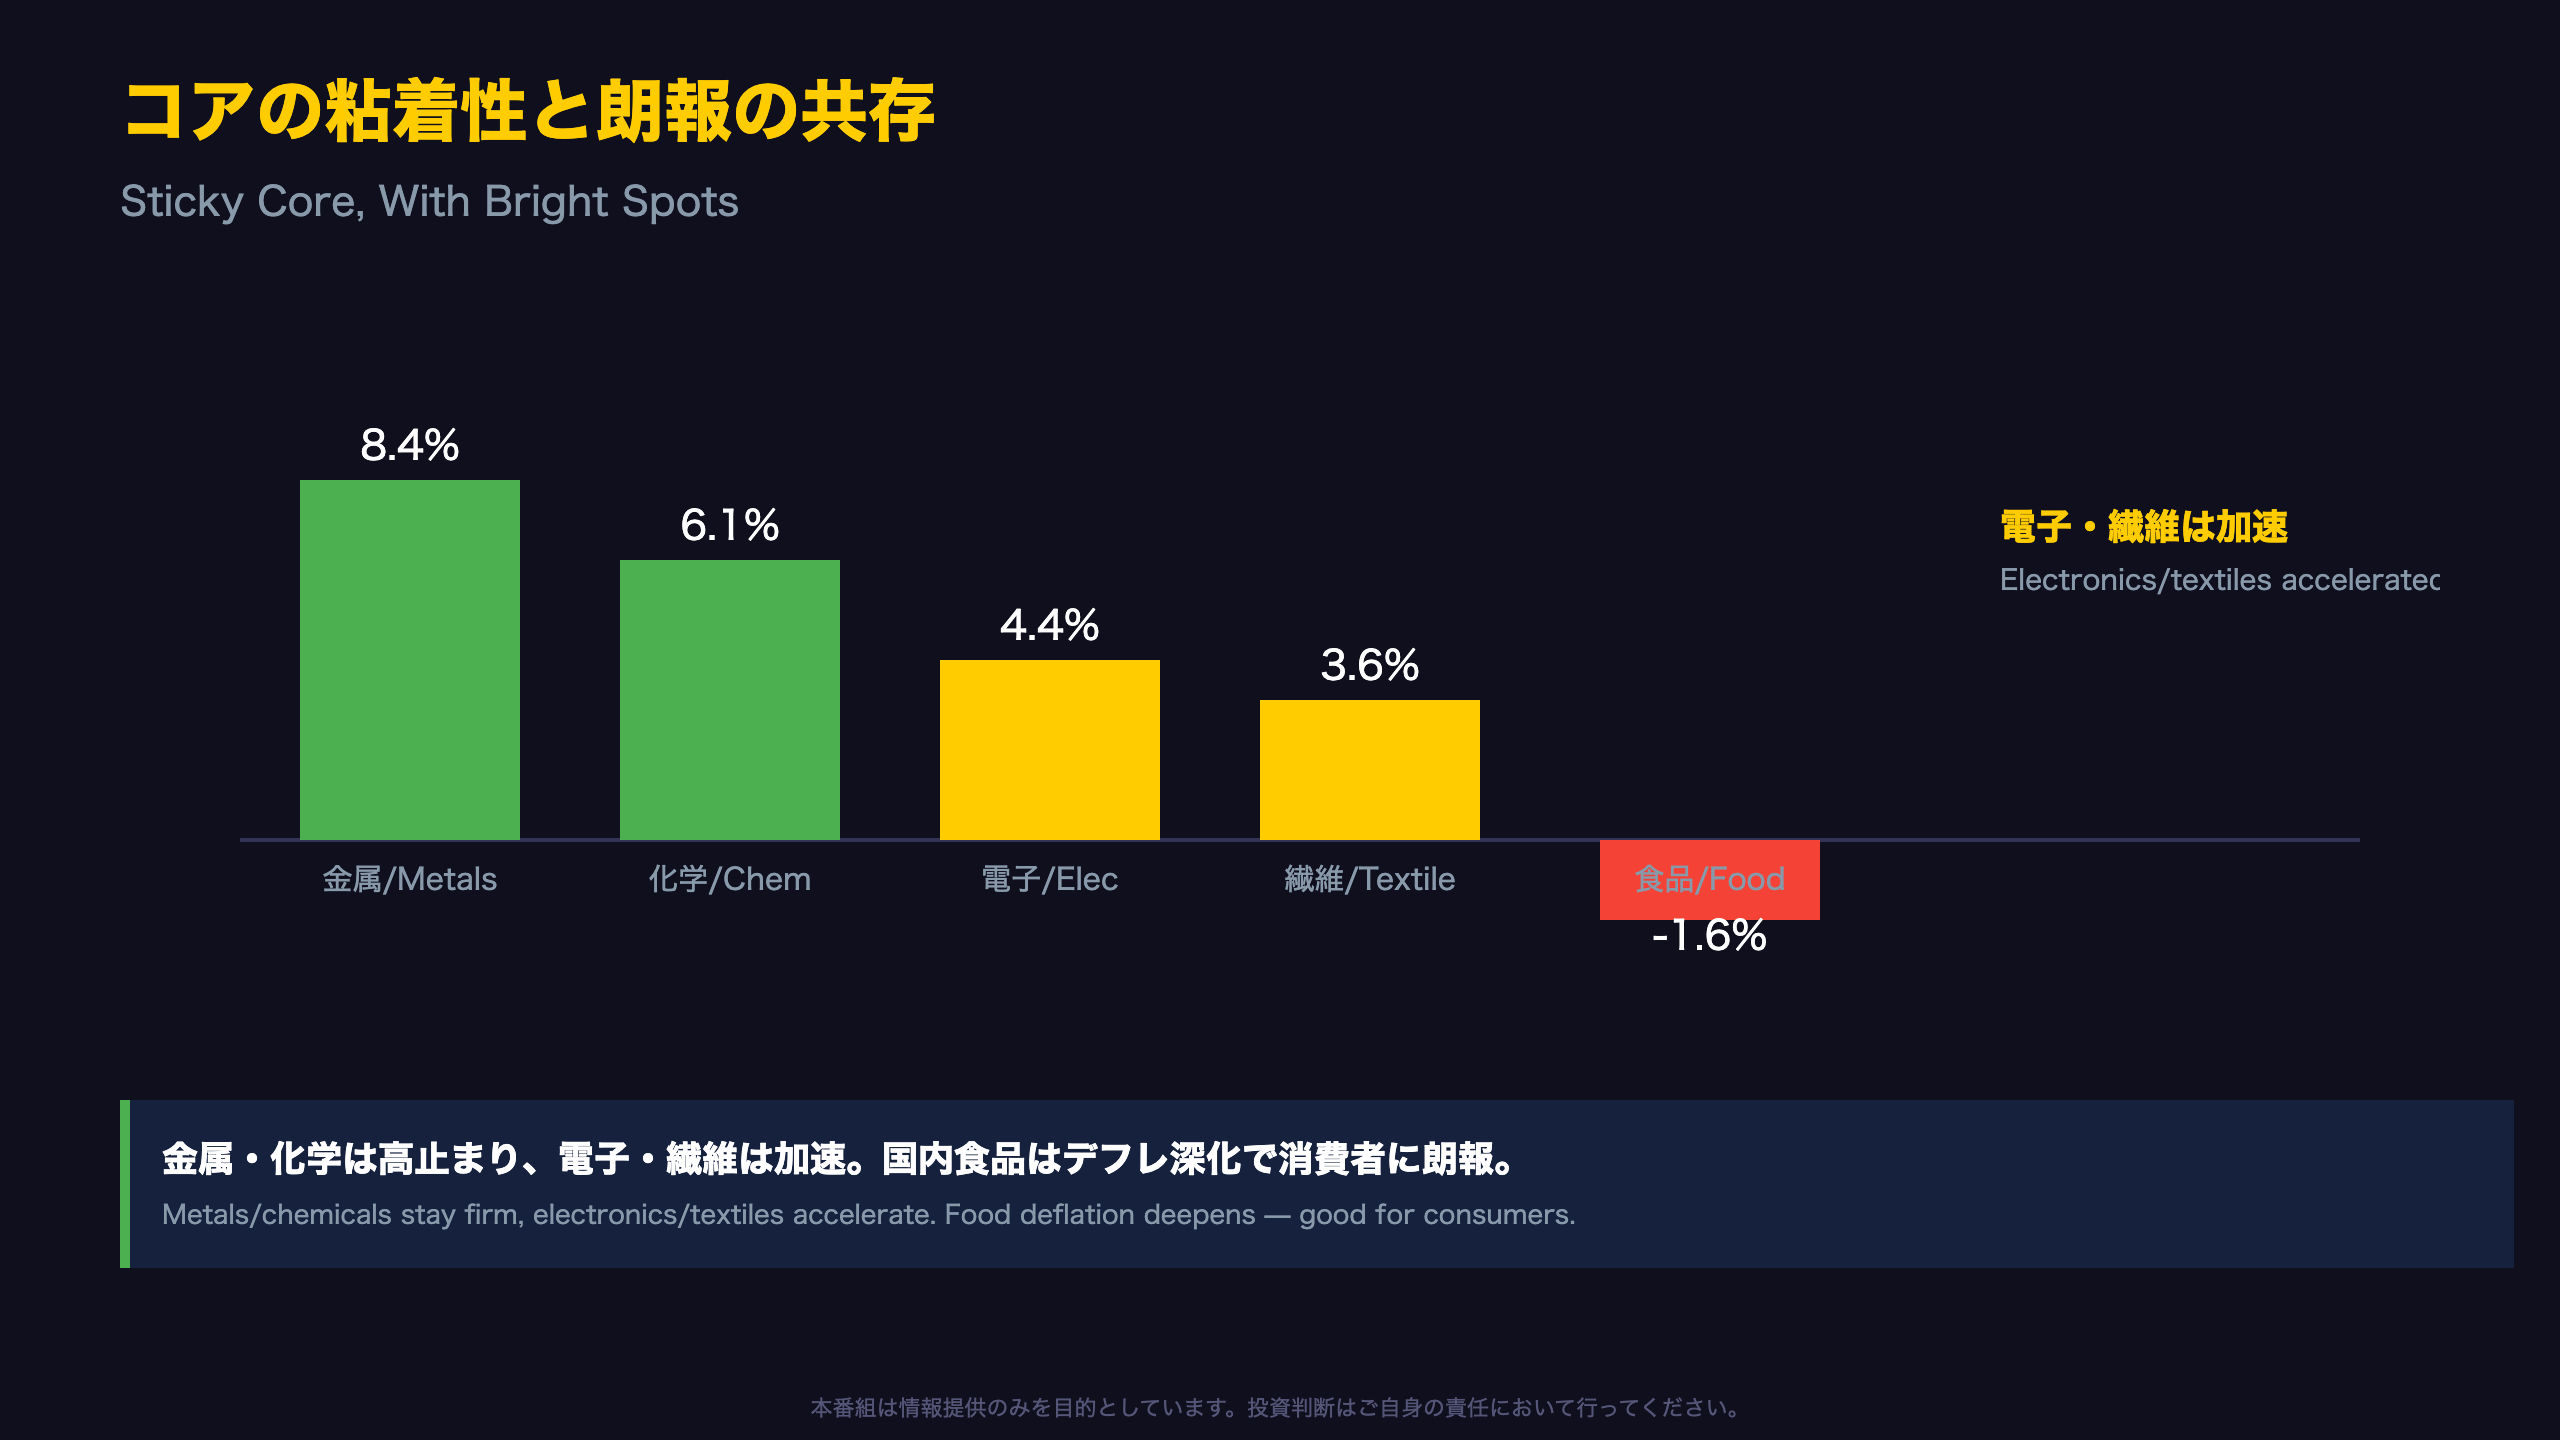
Sticky Core, With a Few Bright Spots
Stripping out crude oil, the deceleration across most core categories is far more modest:
| Category | June (revised) | July | Direction |
|---|---|---|---|
| Metals & non-metallic minerals | 9.0% | 8.4% | Gradual easing |
| Chemicals | 6.7% | 6.1% | Gradual easing |
| Computer & electronic products (output) | 3.1% | 4.4% | Accelerating |
| Textiles (output) | 2.6% | 3.6% | Accelerating |
| Domestic food (input) | -1.3% | -1.6% | Deepening deflation |
The standout is computer and electronic products, which accelerated by 1.3 percentage points — a meaningful move for a category with a 3.2% weight. ONS attributed part of the metals/machinery strength to rising repair and machining service prices, suggesting cost pressure isn’t confined to raw goods but is bleeding into service-like components of the industrial supply chain, echoing similar “services stickiness” debates in US and Eurozone core inflation.
On the encouraging side, ONS specifically cited falling milk and dairy prices as a driver of deepening deflation in domestic food inputs. While this is an input-cost measure — not a guarantee of retail pass-through — persistent upstream food deflation is one of the more consumer-relevant signals in this release, and could eventually feed into softer UK grocery inflation.
Why this matters for markets: the weight of these “sticky” categories in the basket (metals: 20.6%, chemicals: 17.2%) is large, but their month-to-month rate changes are small — unlike oil’s outsized swing. If metals and chemicals inflation plateaus around 6-8% into Q4 rather than continuing to fall, that would validate concerns about underlying stickiness beyond the energy base effect.
出力価格:石油以外は押し上げ要因
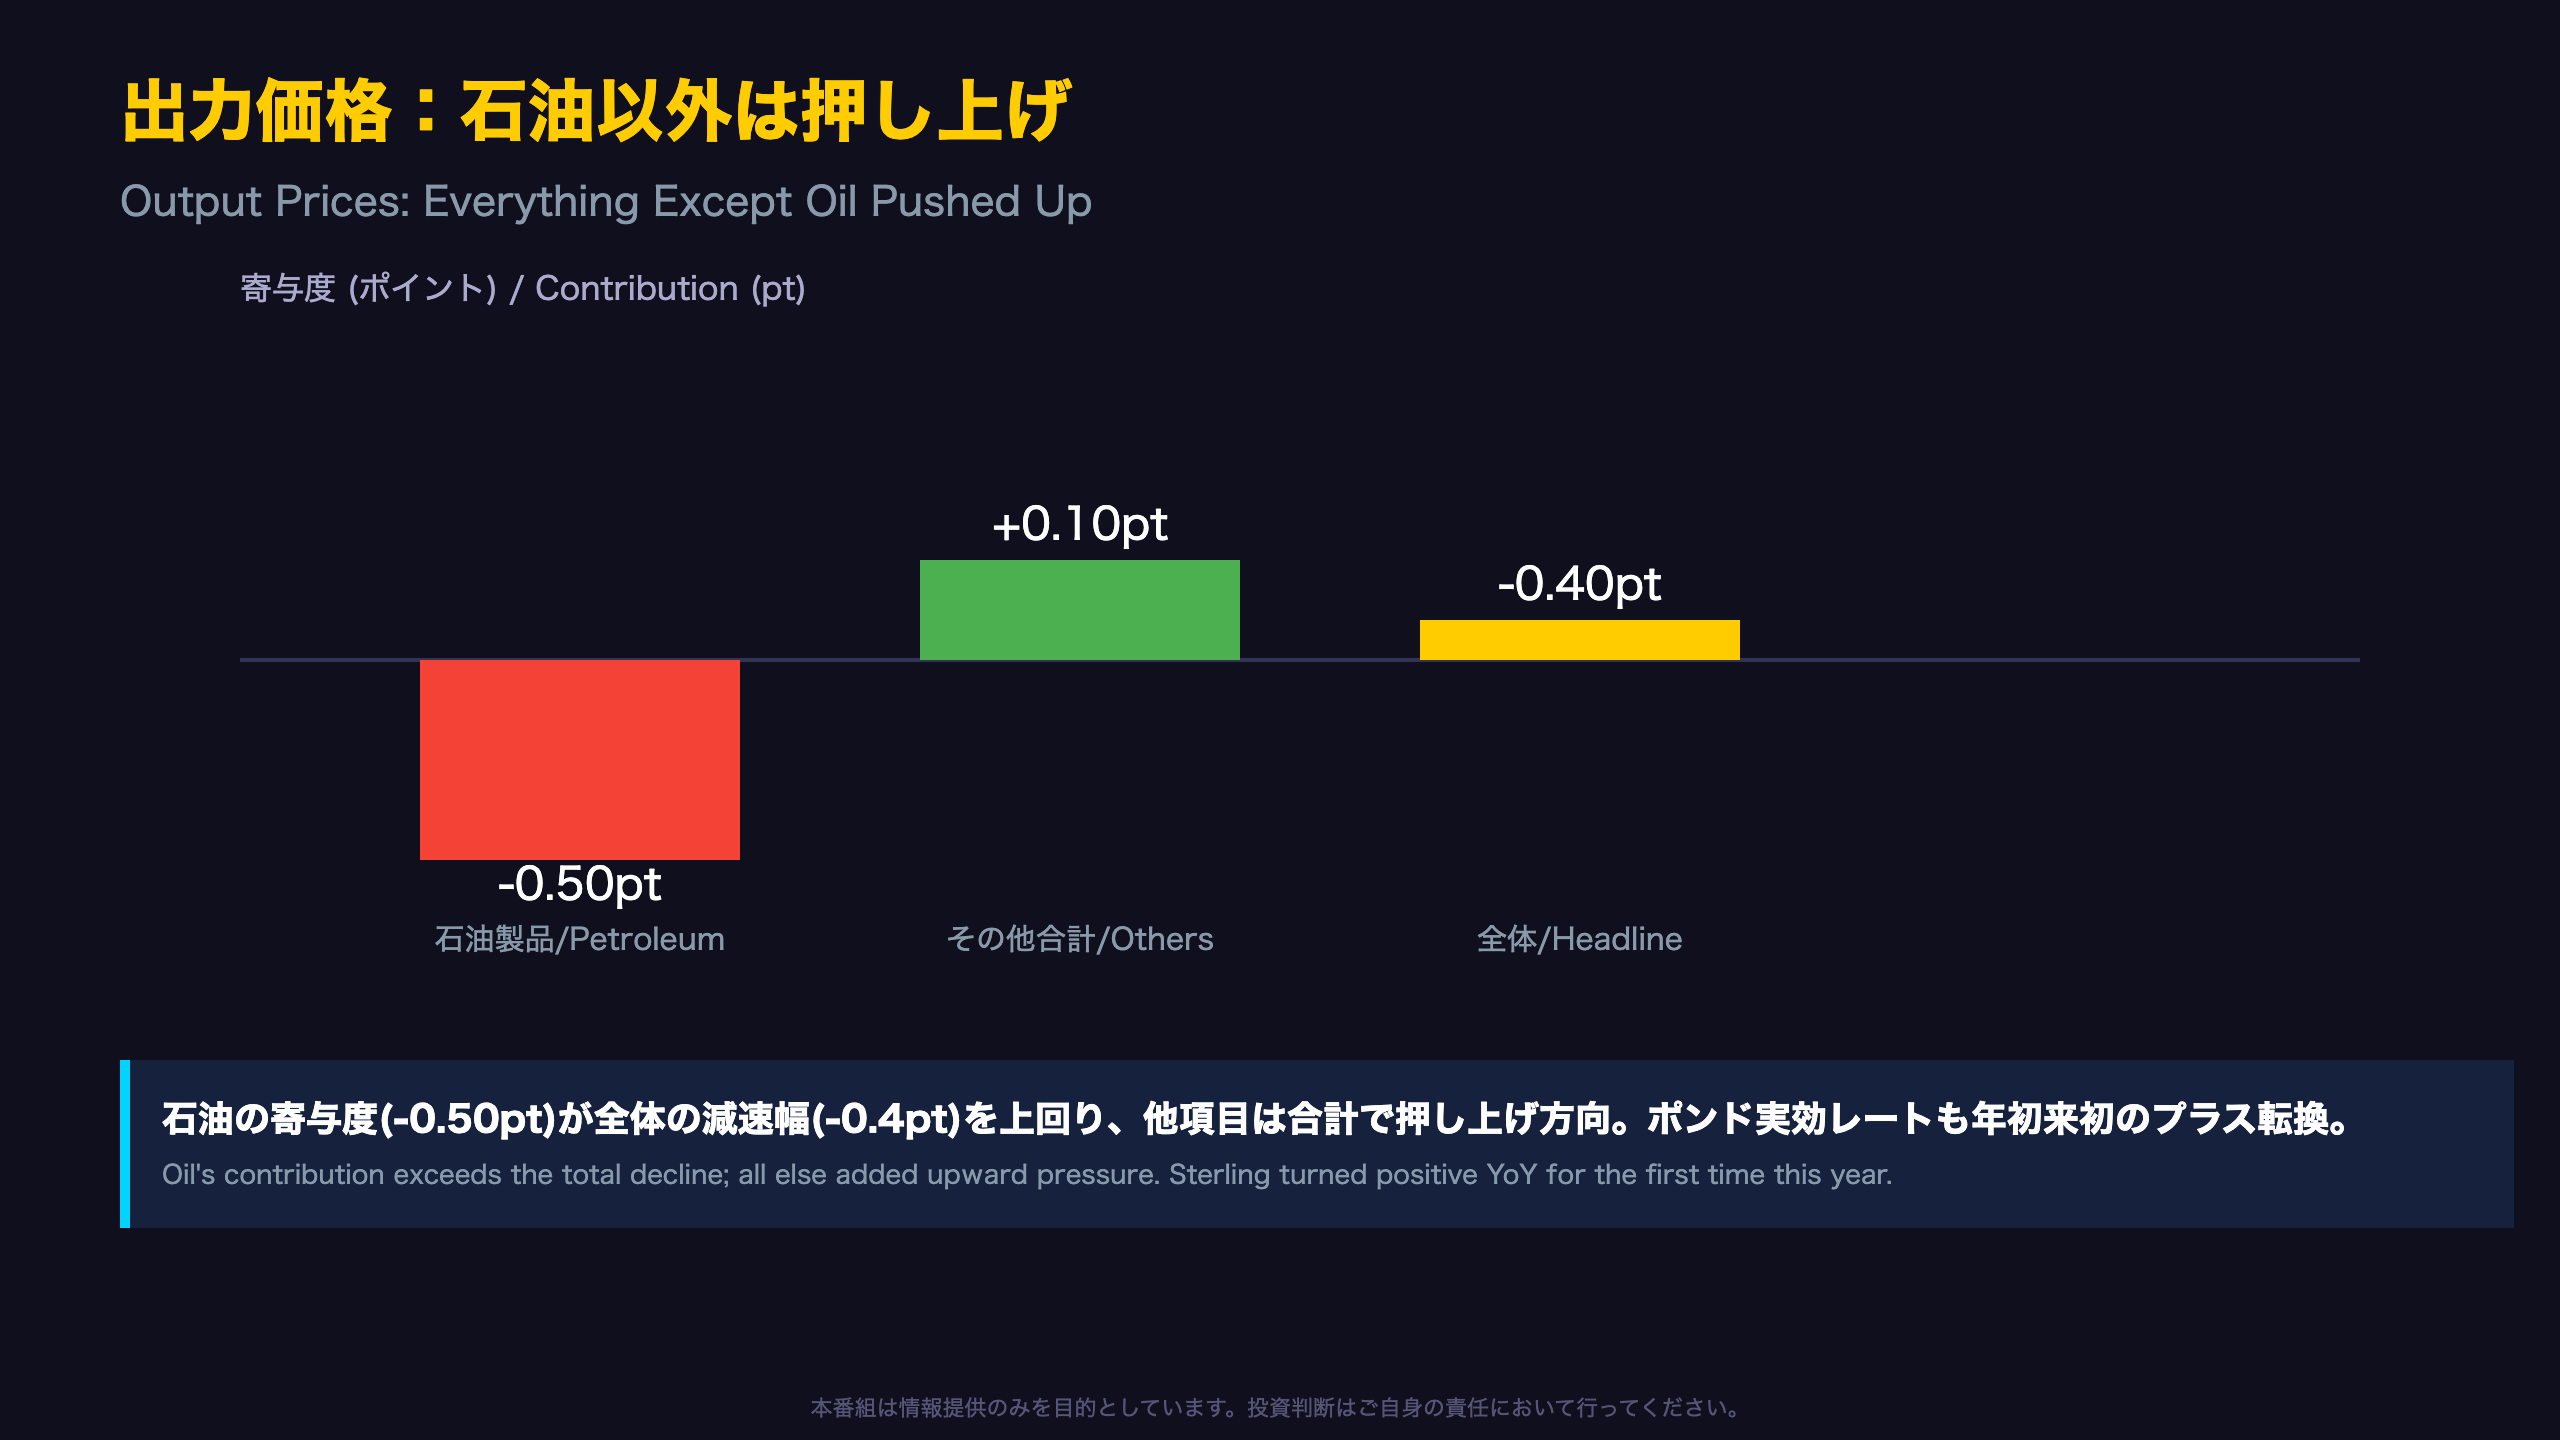
Everything Except Oil Was Pushing Prices Up
Decomposing output prices tells an even sharper story. Coke and refined petroleum products (4.5% weight) saw an 11.2-point swing in their annual rate (41.3% → 30.1%), contributing roughly -0.50 percentage points to the headline. That single downward contribution actually exceeds the entire 0.4-point deceleration in headline output PPI — arithmetically implying every other category combined added about +0.1 percentage point on net.
The Import Price Index (IPI) also decelerated sharply, from 9.0% to 5.2%, though ONS again attributes this “mainly” to non-EU imports of refined petroleum products — the same oil story wearing a different hat.
On the currency side, the sterling effective exchange rate (Bank of England data) flipped from -1.4% to +0.6% year-on-year — its first clear positive reading so far in 2026. A stronger pound mechanically dampens imported inflation, and if sustained, could compound the disinflationary effect from falling global energy prices. That said, this is a single month’s data point and should not yet be read as an established trend.
The Export Price Index (EPI) decelerated from 10.5% to 8.5%, still elevated, with precious metals exports cited as a continuing upward driver — indirect corroboration of strength in metals markets that mirrors the “sticky core” seen on the input side.
Bottom line for markets: July’s UK PPI print is a study in contrasts — a dramatic headline deceleration sitting atop a stickier, more resilient core. Investors positioning around Bank of England rate expectations, GBP, or gilts should weigh both signals rather than reacting to the headline number in isolation.
Next release: September 16, 2026. Watch whether metals and chemicals inflation continues to ease once the crude oil base effect has largely washed out of the annual comparison.
Disclaimer: This article is for informational purposes only. All investment decisions are made solely at your own risk.







