📺 Watch the Full Video Analysis
This article was automatically generated by the NFC Market Live AI analysis system. (Updated: 2026-08-18 21:42 JST)
📄 Primary Source
U.S. Census Bureau
https://www.census.gov/construction/nrc/pdf/newresconst.pdf
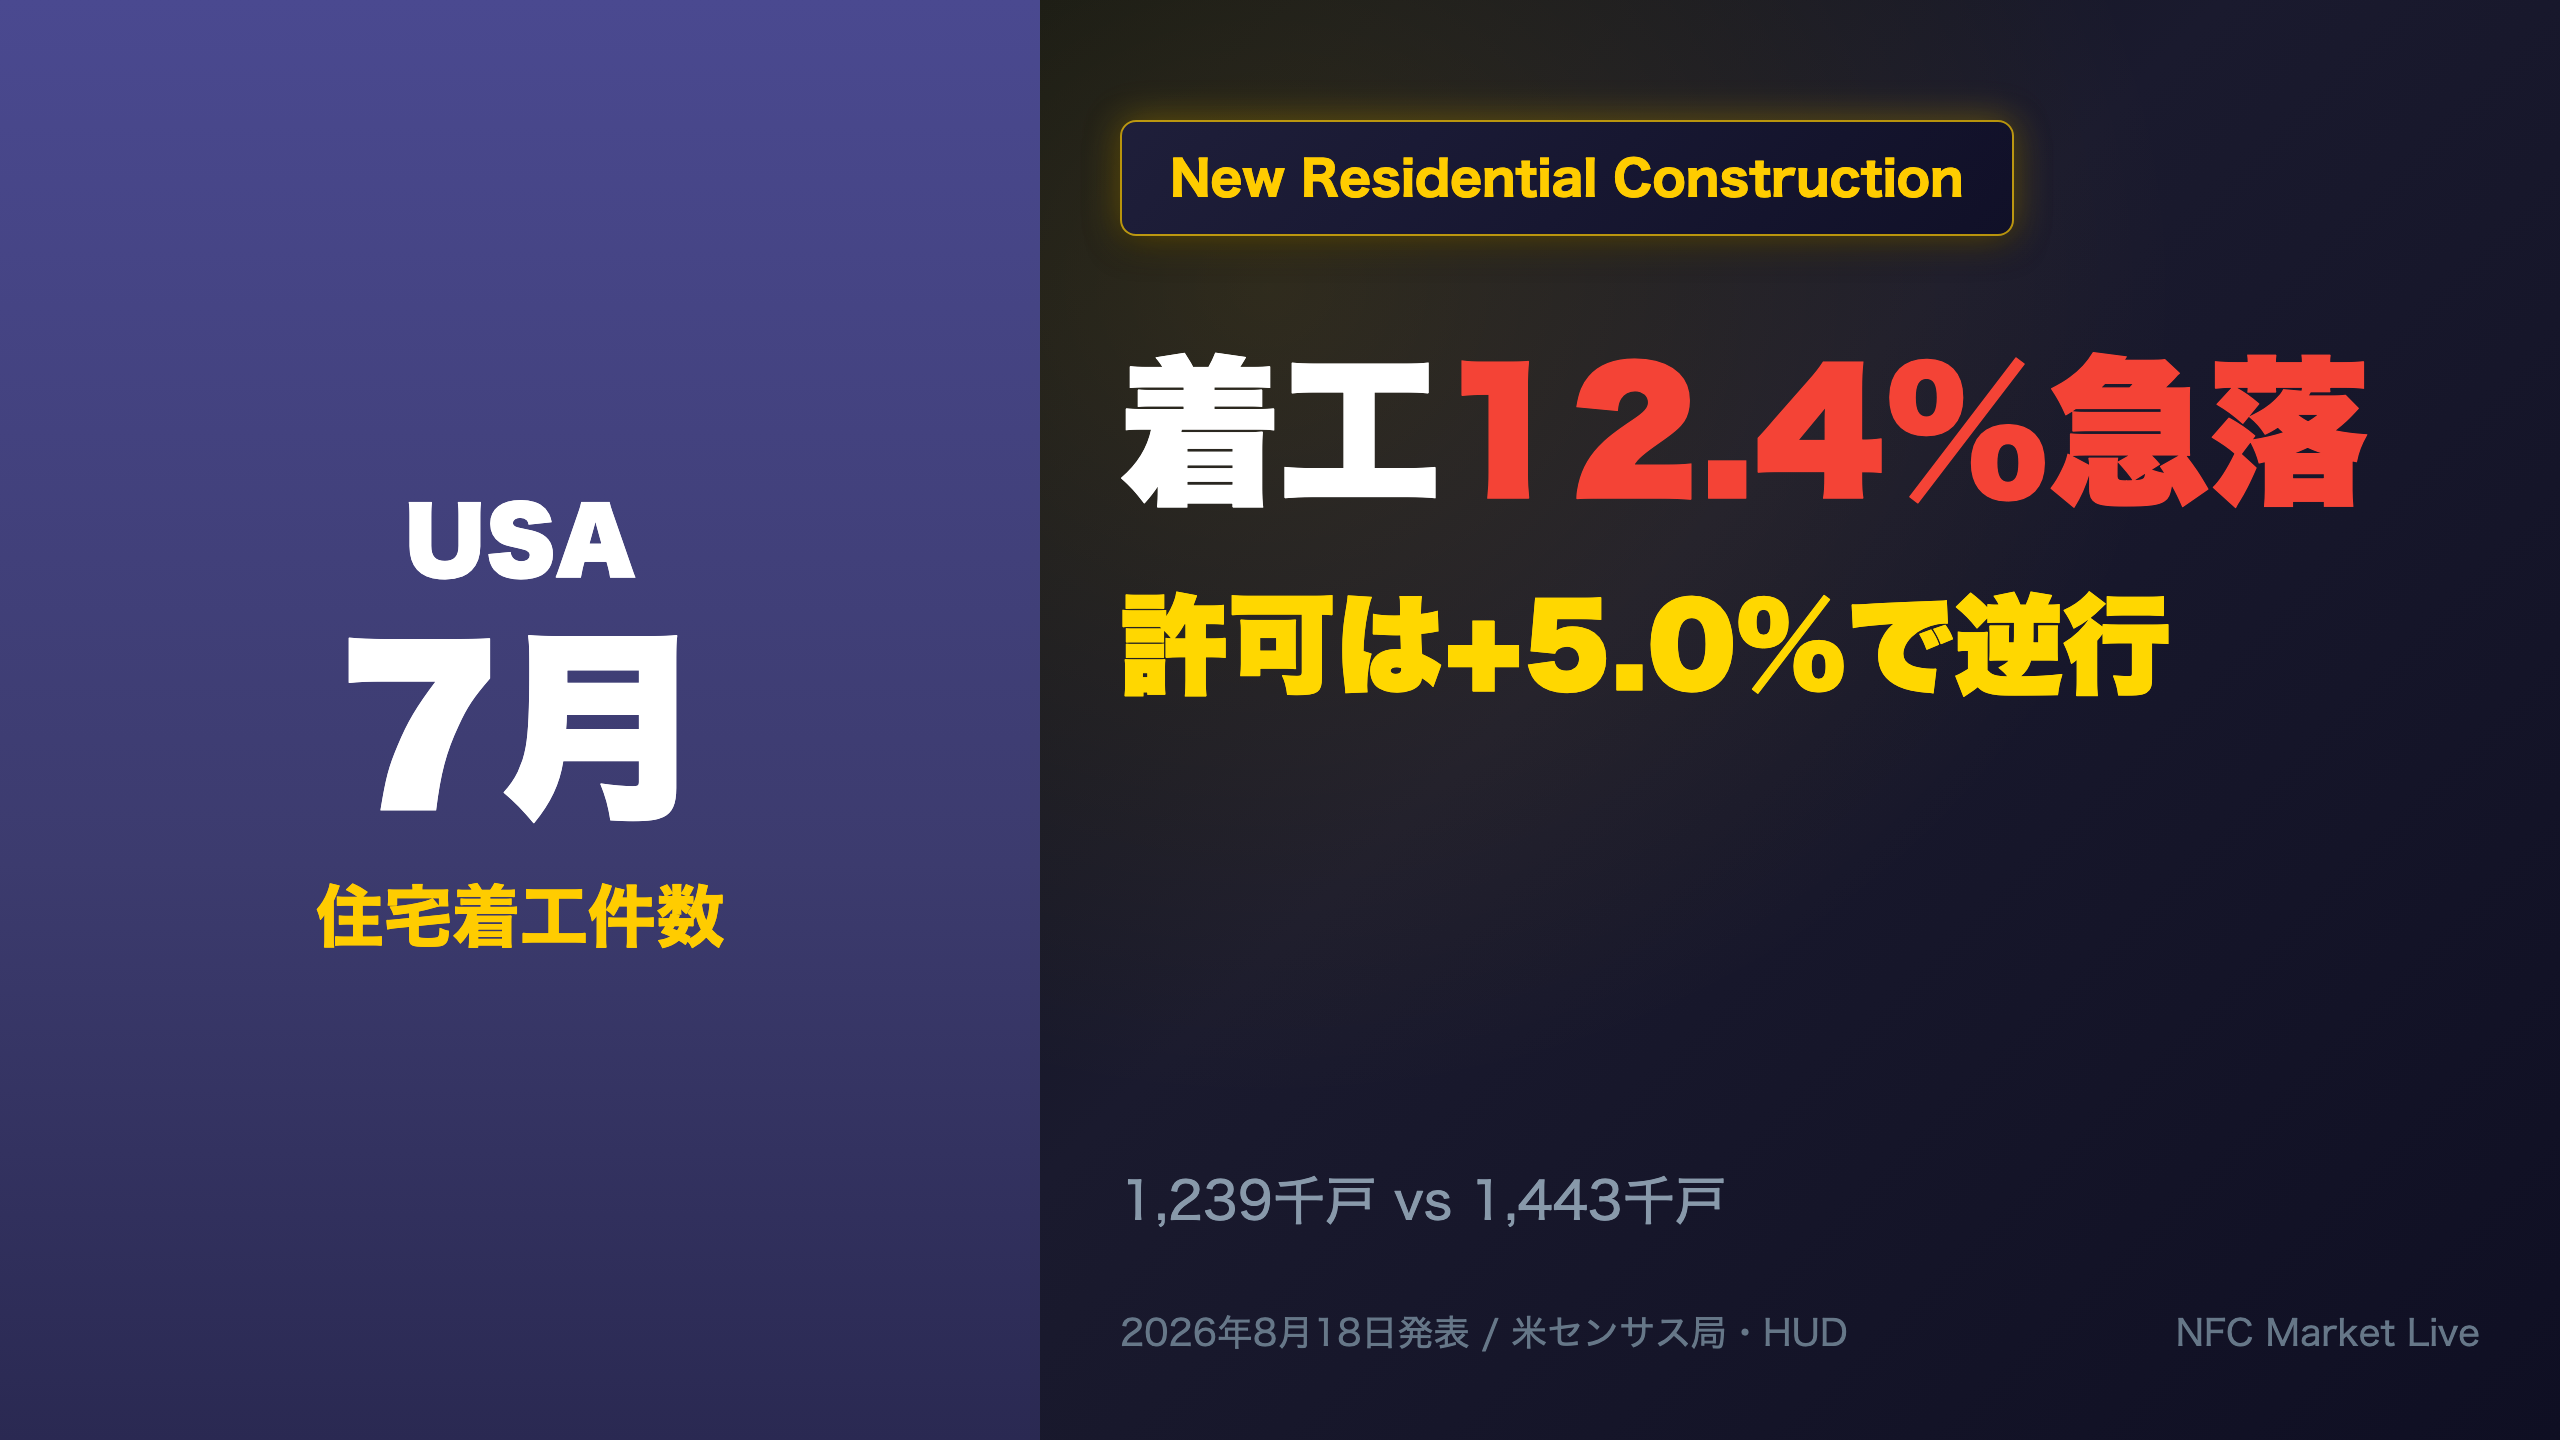
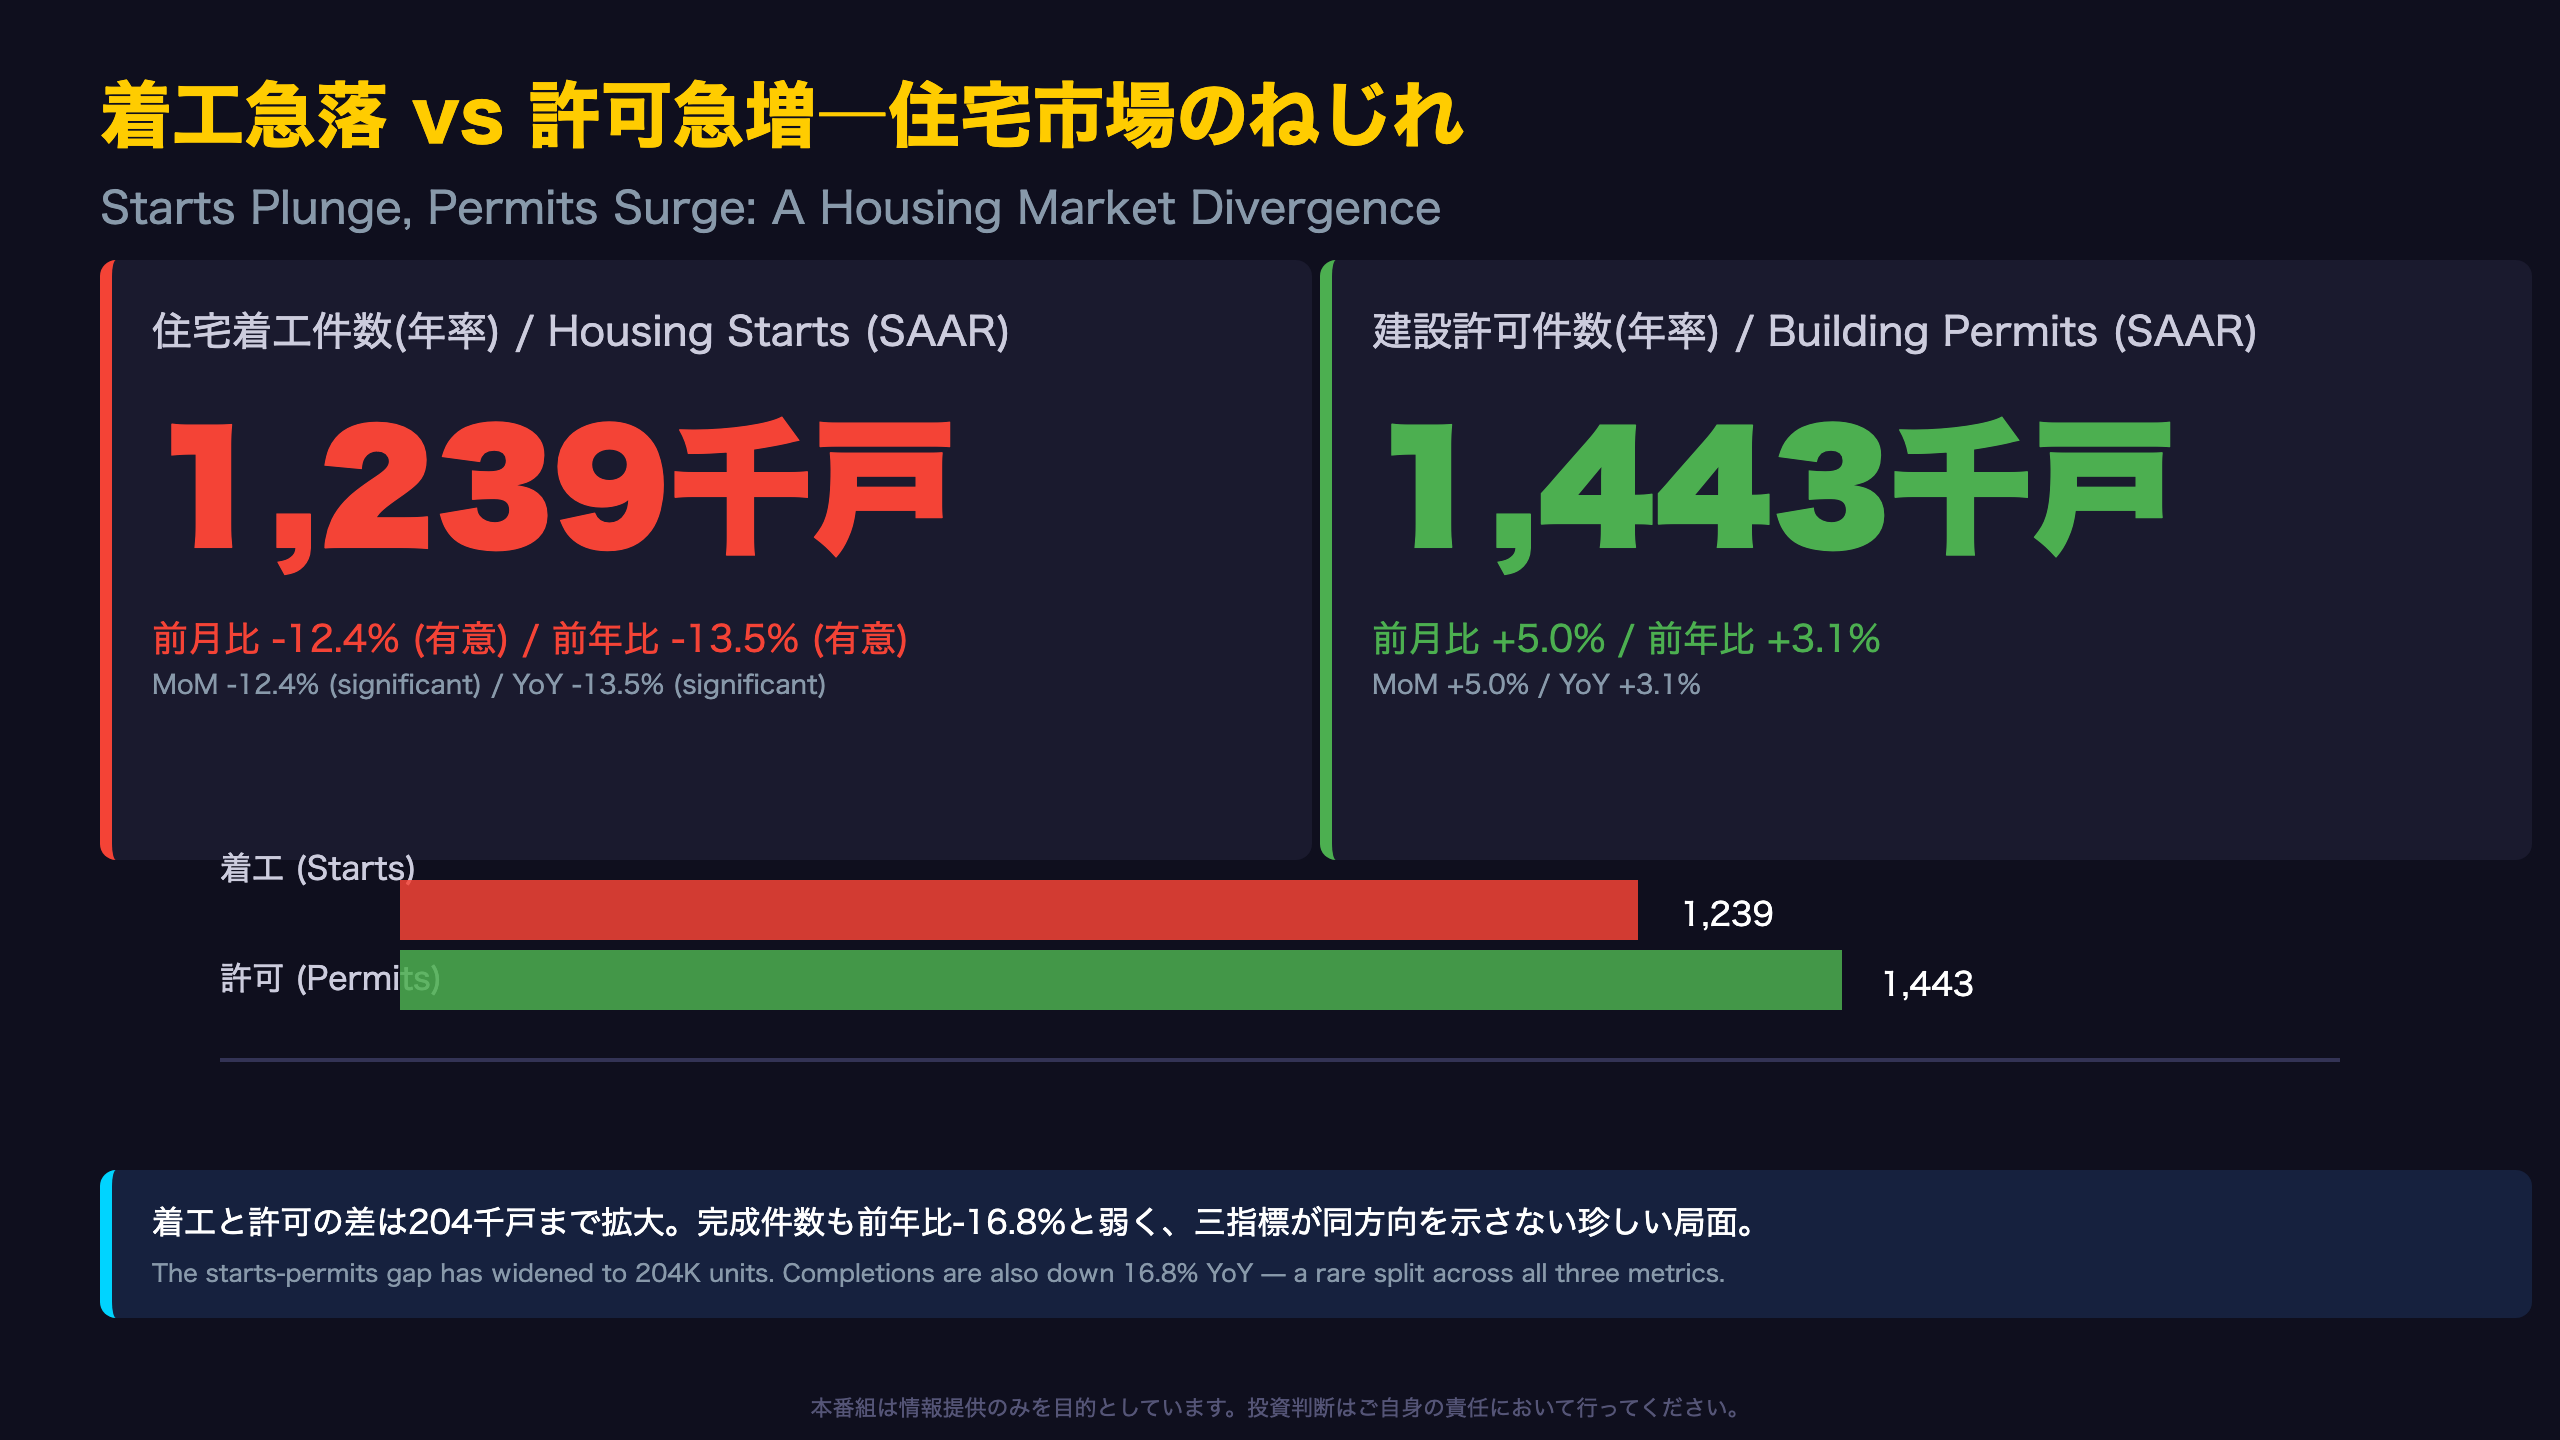
📊 US housing starts fell to a seasonally adjusted annual rate of 1.239 million units in July 2026 — a statistically significant 12.4% drop from June and 13.5% below a year ago.
📈 Yet building permits, the leading indicator, rose to 1.443 million units (+5.0% MoM, +3.1% YoY), creating an unusual divergence.
🏗️ The backlog of permitted-but-not-started units climbed 10.3% YoY, hinting at builder caution.
💡 We break down what this split signals for the housing market and Fed policy — including which figures actually clear the statistical significance bar.
着工急落 vs 許可急増―住宅市場に生じたねじれ
What a Single Month Can — and Cannot — Tell Us
July’s housing starts figure of 1,239,000 units marks a 12.4% drop from June’s revised 1,415,000, with a 90% confidence interval of plus or minus 9.5 points (range: -21.9% to -2.9%). Because that range excludes zero, this qualifies as a statistically significant decline. Yet on a year-to-date, non-seasonally-adjusted basis, starts total just 805,200 units versus 821,700 a year earlier — a decline of only 2.0%, with a margin of error of plus or minus 4.0 points that does include zero, making the YTD trend statistically inconclusive.
The report’s own explanatory notes caution that “it may take six months to establish an underlying trend for building permit authorizations… and six months for total starts.” That’s a useful check against reading July’s drop as a definitive turn in the housing cycle.
Divergent Signals Across Three Metrics
Starts (-13.5% YoY) and completions (-16.8% YoY) both registered statistically significant declines, while permits (+3.1% YoY) stayed in positive territory. It’s the kind of split investors don’t often see: three closely related housing indicators pointing different directions. Non-U.S. readers should note the U.S. release uniquely separates starts, permits and completions into distinct monthly series, unlike Eurostat’s combined construction output index — making this kind of divergence more visible here than in comparable European data.
One caveat worth flagging: the overall unit response rate for this survey was 75.9%, meaning sampling and nonsampling error remain part of the picture.
着工の内訳―一戸建てと集合住宅、有意性の検証
Single-Family vs. Multifamily: Who’s Driving the Decline?
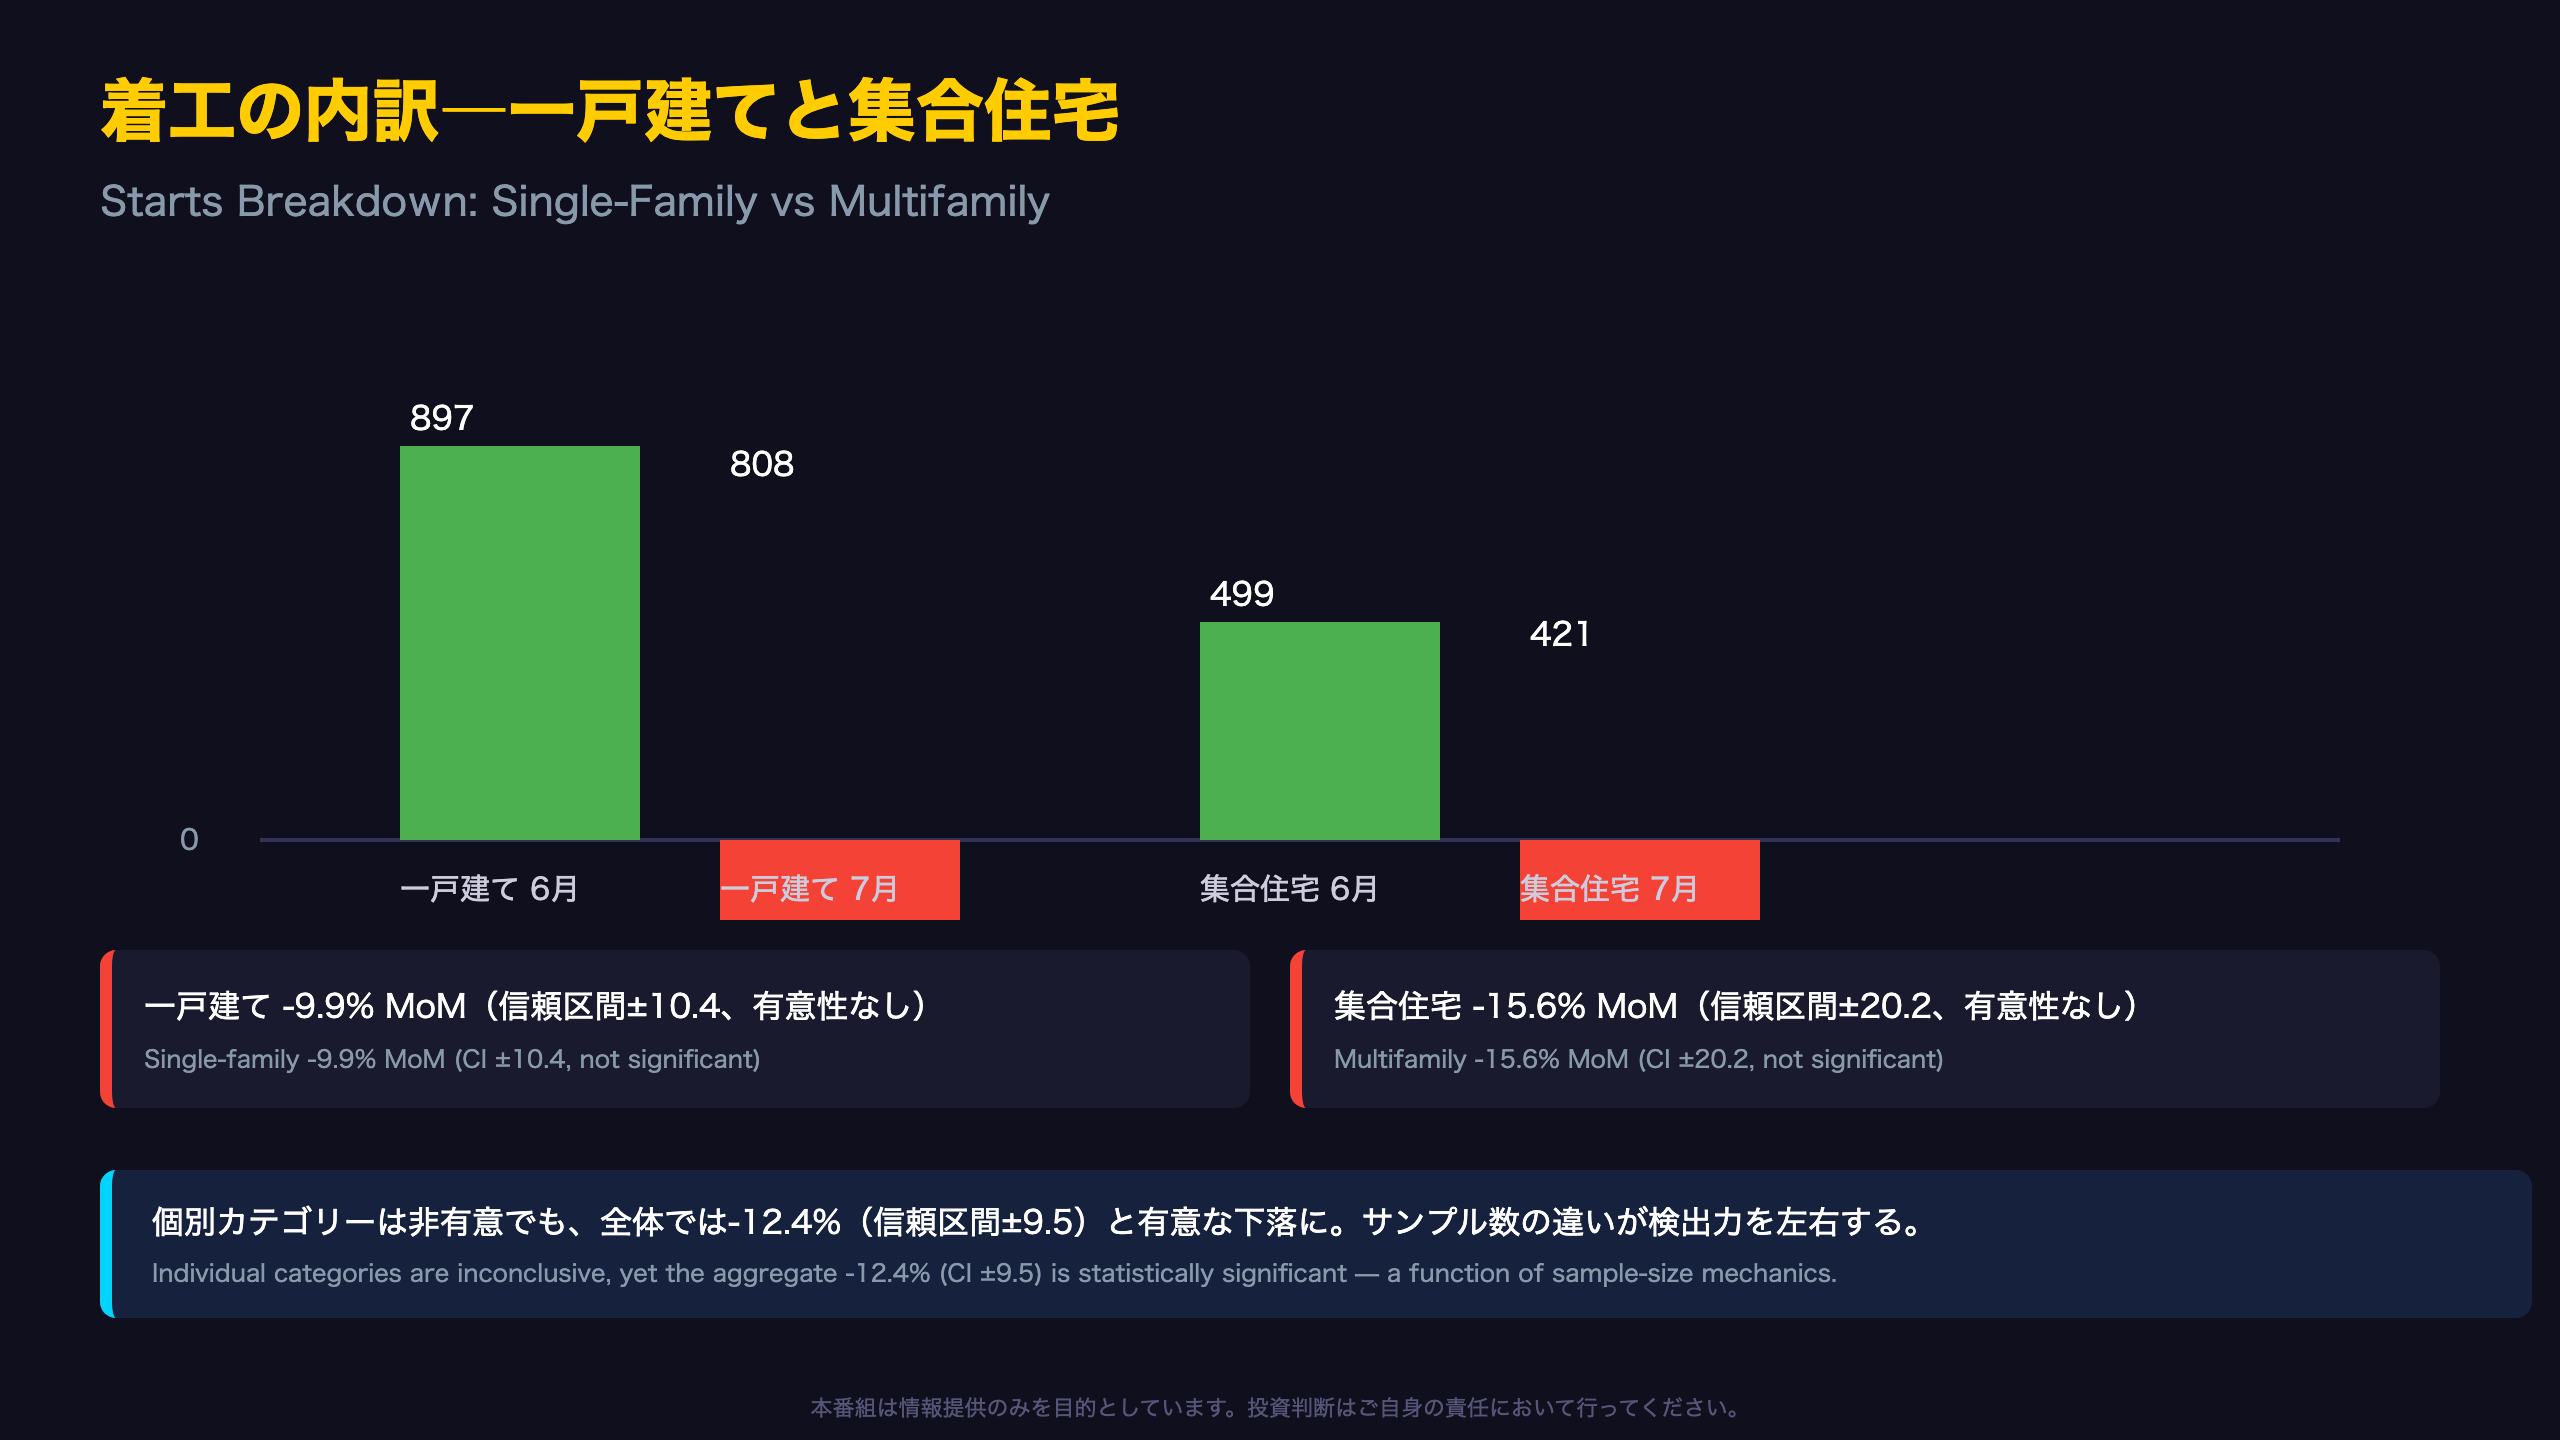
Single-family starts fell to 808,000 units in July, down 9.9% month-over-month — but with a 90% confidence interval of plus or minus 10.4 points (range: -20.3% to +0.5%), that decline straddles zero and isn’t statistically significant on its own. Multifamily starts (five-plus units) fell 15.6% to 421,000, with an even wider margin of plus or minus 20.2 points — also inconclusive.
So why does the aggregate total (-12.4%, interval plus or minus 9.5) register as statistically significant? This comes down to sample-size mechanics: as data aggregates to higher levels, standard errors shrink and statistical power increases — a nuance familiar to anyone following the U.S. Bureau of Labor Statistics’ payroll revisions, which follow similar logic.
The Year-Over-Year Picture Is Tougher
Year-over-year, single-family starts are down a significant 15.7% (interval plus or minus 8.6), while multifamily is down an inconclusive 7.1% (plus or minus 31.8), suggesting the single-family slowdown may be more structurally entrenched. Notably, the 2-to-4-unit category was flagged “S” (does not meet publication reliability standards) this month, meaning that data slice wasn’t disclosed at all.
建設許可と『許可済み未着工』の積み上がり
Permitted But Not Broken Ground: A Growing Backlog
The stock of units authorized but not yet started climbed to 279,000 in July, up 4.1% from June (CI plus or minus 2.5 points) and 10.3% from a year ago (plus or minus 7.3 points) — both statistically significant, since neither range includes zero.
This category, tracked in Table 2 of the release, is defined as “the number of housing units authorized… and not started as of [the reporting period’s] last day.\” A rising backlog implies a pool of hidden future supply, but it also carries the risk of a prolonged holding pattern if input costs or sales expectations remain uncertain — a dynamic echoing what UK developers describe amid elevated build-cost inflation.\n\n## Multifamily Permits Are Outpacing Single-Family\n\nMultifamily permits (five-plus units) rose 9.1% month-over-month and 6.3% year-over-year, outpacing single-family permits (+2.5% MoM, +1.1% YoY). That could reflect stronger rental demand or a pipeline of large-scale projects moving through approvals ahead of ground-breaking. Whether this permit acceleration translates into actual starts will be a key thing to watch in August’s data, due September 17.”,
“fallback_bullets”: [“許可総数1,443千戸、前月比+5.0%”, “許可済み未着工279千戸、前年比+10.3%(有意)”, “5戸以上許可は前月比+9.1%と一戸建てを上回る”, “許可の伸びが着工に波及するかが焦点”, “資金調達・資材コストへの慎重姿勢を示唆”],
“fallback_bullets_en”: [“Total permits 1.443M, +5.0% MoM”, “Authorized-not-started backlog 279K, +10.3% YoY (significant)”, “Multifamily permits +9.1% MoM, outpacing single-family”, “Key question: will permit growth feed through to starts”, “May reflect caution on financing and material costs”],
“html_content”: “<!DOCTYPE html>
”
},
{
“slide_title”: “地域別のばらつき―南部依存とサンプルの限界”,
“anchor_script”: “地域別の着工動向には大きなばらつきがある。全体の過半を占める南部は645,000戸で前月比12.6%減だが信頼区間±13.2ポイントとゼロを含み統計的有意性はない。一方、前年比では24.1%減、信頼区間±12.6でゼロを含まず有意な下落と判定できる。中西部は173,000戸で前月比27.6%減(信頼区間±16.5、有意)だが前年比27.0%減は信頼区間±33.3でゼロを含み有意性なし。北東部は前年比62.4%増と急伸するが信頼区間は±93.7と極めて広く、統計的にはほぼノイズの域を出ない。西部は前年比5.3%増だが有意性なし。地域データは総じてサンプルが小さく振れ幅が大きい点に留意が必要。”,
“anchor_script_en”: “Regional data shows wide dispersion. The South, accounting for more than half of total starts, came in at 645,000 units, down 12.6% month-over-month — but with a confidence interval of plus or minus 13.2 points, that monthly move isn’t statistically significant. Its year-over-year decline of 24.1%, with a tighter interval of plus or minus 12.6, does clear the significance threshold. The Midwest fell 27.6% month-over-month, a significant move, though its 27.0% year-over-year decline carries a margin of plus or minus 33.3 points and isn’t significant. The Northeast surged 62.4% year-over-year, but with an enormous margin of error of plus or minus 93.7 points, that figure is essentially statistical noise. The West rose 5.3% year-over-year, also not significant. Regional subsamples are small and volatile, warranting caution.”,
“blog_content”: “## 南部依存の構造とサンプルの限界\n\n着工全体に占める南部のシェアは52%(645千戸/1,239千戸)。全国の前年比-13.5%という下落のうち、南部の前年比-24.1%(信頼区間±12.6、有意)が主因の一つとなっている可能性が高い。\n\n一方、中西部・北東部・西部の前年比変化は、いずれも信頼区間がゼロをまたぎ統計的に有意とは言えない。特に北東部の前年比+62.4%(信頼区間±93.7)は、絶対水準が小さいため変動率が極端に振れやすく、実質的にはノイズに近い数値と解釈すべきだろう。\n\n## 許可の地域差も対照的\n\n許可ベースで見ると、南部は前年比-0.9%とほぼ横ばいだが、北東部は+16.2%、西部は+8.0%と伸びている。着工では精彩を欠く地域が許可では堅調という逆転現象も見られ、地域ごとの需給環境が一様でないことがうかがえる。地域別データはサンプル数が少なく振れ幅が大きいため、月次の単純比較よりも複数月の平均で傾向を確認する姿勢が望ましい。”,
“blog_content_en”: “## The South Dominates — and So Does Sampling Noise\n\nThe South accounts for 52% of total starts (645,000 of 1,239,000 units). Its year-over-year decline of 24.1% (CI plus or minus 12.6, statistically significant) is likely a major contributor to the national 13.5% YoY drop, simply due to its outsized weight.\n\nBy contrast, year-over-year changes in the Midwest, Northeast, and West all carry confidence intervals straddling zero, meaning none is statistically distinguishable from no change. The Northeast’s eye-catching +62.4% YoY figure (CI plus or minus 93.7) is a case in point — with a small absolute base, percentage swings there should be read as closer to noise than signal, much like small-cap regional housing prints in Canada or Australia.\n\n## Permits Tell a Different Regional Story\n\nOn permits, the South is roughly flat year-over-year (-0.9%), while the Northeast (+16.2%) and West (+8.0%) show solid gains — even as their starts data looked weak. This permits/starts inversion by region suggests underlying demand-supply conditions vary meaningfully by geography. Given the small regional samples, averaging several months of data is generally more informative than reading any single regional print in isolation.”,
“fallback_bullets”: [“南部は着工全体の52%を占める最大地域”, “南部の前年比-24.1%は統計的に有意”, “中西部・北東部・西部の前年比は有意性なし”, “北東部+62.4%YoYは信頼区間±93.7でほぼノイズ”, “許可では北東部・西部が堅調と対照的”],
“fallback_bullets_en”: [“South is 52% of total starts, the largest region”, “South’s -24.1% YoY is statistically significant”, “Midwest/Northeast/West YoY changes are not significant”, “Northeast’s +62.4% YoY (CI ±93.7) is essentially noise”, “Permits show Northeast and West holding up better”],
“html_content”: “<!DOCTYPE html>
”
},
{
“slide_title”: “完成件数と建設中パイプラインの縮小”,
“anchor_script”: “完成件数は年率1,212,000戸で前月比9.1%減。信頼区間は±10.2ポイントとゼロを含み、月次の変動としては有意性が確認できない。一方、前年比では16.8%減、信頼区間±13.7でゼロを含まず統計的に有意な下落となった。年初来(未季節調整)ベースでも完成件数は756,300戸と前年同期の853,400戸から11.4%減少、信頼区間±5.5で有意。工事中の住宅ストックを示す『着工済み・未完成』件数は1,262,000戸で前年比6.0%減(信頼区間±2.6、有意)。着工の減速がすでに建設中パイプラインの縮小として表れ始めており、数ヶ月先の完成件数にも影響が及ぶ可能性がある。”,
“anchor_script_en”: “Housing completions came in at an annualized 1,212,000 units, down 9.1% from June — but with a confidence interval of plus or minus 10.2 points that includes zero, the monthly change isn’t statistically significant. Year-over-year, completions fell a significant 16.8%, with a margin of plus or minus 13.7 points. On a year-to-date basis, completions totaled 756,300 units, down a significant 11.4% from 853,400 a year earlier. The stock of units still under construction stood at 1,262,000, down a significant 6.0% year-over-year. The slowdown in starts is already showing up as a shrinking construction pipeline, which could weigh on completions data several months down the road.”,
“blog_content”: “## 完成件数は『6ヶ月遅れ』の指標\n\n原文の解説注記は完成統計について「基調把握には6ヶ月を要する」としている。7月の完成1,212千戸(前年比-16.8%、有意)は、実質的には昨年末から今年前半にかけての着工実績を反映したものと解釈するのが適切だ。\n\n## パイプラインの縮小が示すもの\n\n工事中ストック(着工済み・未完成)は1,262千戸で前年比-6.0%(信頼区間±2.6、有意)。着工の減速が数ヶ月かけてパイプラインの縮小として顕在化しつつある。これは今後数ヶ月の完成件数、ひいては住宅供給フローが緩やかに減速する可能性を示唆する。\n\n## 年初来ベースでも明確な弱さ\n\n未季節調整の年初来完成件数は756.3千戸で前年同期の853.4千戸から11.4%減(信頼区間±5.5、有意)。単月のブレが大きい着工・許可と異なり、完成は年初来ベースでも一貫して弱含んでおり、三指標の中では最も明確な下落トレンドを示している。”,
“blog_content_en”: “## Completions: A Six-Month-Lagged Signal\n\nThe report’s explanatory notes state that establishing an underlying trend for completions \”may take six months.\” July’s completions figure of 1,212,000 units (-16.8% YoY, statistically significant) largely reflects starts activity from late last year through early this year, not current market conditions.\n\n## What a Shrinking Pipeline Suggests\n\nThe stock of units still under construction stood at 1,262,000, down a significant 6.0% year-over-year (CI plus or minus 2.6). This is the clearest sign yet that the starts slowdown is working its way through the construction pipeline, pointing toward gradually slower completions — and slower net additions to housing supply — over coming months, similar to what the UK’s NHBC new-build registration data tracks.\n\n## The Weakest of the Three Metrics on a YTD Basis\n\nNon-seasonally-adjusted, year-to-date completions total 756,300 units, down a significant 11.4% from 853,400 a year earlier. Unlike starts and permits, which showed more ambiguous year-to-date readings, completions show a consistent, unambiguous downward trend — arguably the clearest signal among the three headline metrics.”,
“fallback_bullets”: [“完成1,212千戸、前月比-9.1%は有意性なし”, “完成の前年比-16.8%は有意な下落”, “工事中ストック1,262千戸、前年比-6.0%(有意)”, “年初来完成は前年比-11.4%(有意)と三指標中最弱”, “完成は着工から6ヶ月遅れて表れる指標”],
“fallback_bullets_en”: [“Completions 1.212M, -9.1% MoM not significant”, “Completions -16.8% YoY is significant”, “Under-construction stock 1.262M, -6.0% YoY (significant)”, “YTD completions -11.4% YoY, weakest of the three metrics”, “Completions lag starts by roughly six months”],
“html_content”: “<!DOCTYPE html>
”
},
{
“slide_title”: “インプリケーション―住宅市場は何を語るのか”,
“anchor_script”: “今回のデータが示す論理をたどると、着工件数が前月比12.4%減(統計的有意)となったことは、住宅投資がGDP構成要素である以上、当該四半期の成長率計算に下押し圧力として働く。もっとも、この一点だけで景気後退を語ることはできない。一方、先行指標の許可件数は前月比5.0%増と有意に伸びており、中期的な着工の下支え要因となり得る。さらに許可済み未着工件数が前年比10.3%増(有意)で積み上がっている事実は、建設業者が資金調達コストや販売見通しを見極めながら着工判断を先送りしている可能性を示唆する。一般に住宅着工の減速は長期金利低下要因として意識されやすいが、今回のデータ単独で金融政策や市場の方向性を断定することはできない。次回発表は9月17日、着工の基調確認には今後数ヶ月のデータ蓄積が必要となる。”,
“anchor_script_en”: “Tracing the logic embedded in today’s report: the statistically significant 12.4% month-over-month drop in starts matters because residential investment is a direct component of GDP, exerting downward pressure on the quarter’s growth calculation. That said, one data point doesn’t establish a recession narrative. Permits — the leading indicator — rose a significant 5.0%, which could provide medium-term support for starts. The significant 10.3% year-over-year rise in the authorized-but-unstarted backlog suggests builders may be delaying groundbreaking while weighing financing costs and sales prospects. A slowdown in starts is generally seen as a factor that could pull long-term rates lower, but this single report cannot on its own confirm the direction of monetary policy or markets. The next report arrives September 17.”,
“blog_content”: “## 次回9月17日発表への視点\n\n今回のデータで最も重要なのは、単一の物語に収斂しない『三指標のねじれ』そのものだ。着工と完成が有意に弱い一方、許可は有意にプラス。年初来ベースでは着工・許可ともに有意性のない横ばい圏にとどまる。\n\n## シナリオ分岐の閾値\n\n強気シナリオ:8月データで着工が反発し、許可の伸びに収斂すれば、7月の急落は『ノイズ』だったと判断できる。弱気シナリオ:許可済み未着工の積み上がり(前年比+10.3%)がさらに拡大し、着工の反発が確認できなければ、業者の慎重姿勢が構造化している可能性が高まる。\n\n## 金融政策との距離感\n\n住宅着工はGDPの構成要素であると同時に、FRBが金融政策運営で参照する経済指標の一つ。ただし、単月の住宅データだけでFOMCの判断が変わることは通常なく、雇用統計や消費者物価指数など他の指標との整合性が問われる。次回発表(9月17日)までに、住宅ローン金利や着工許可の地域別内訳がどう推移するかが、今回のねじれを読み解く鍵となる。”,
“blog_content_en”: “## Looking Ahead to September 17\n\nThe single most important takeaway is the persistent \”three-way divergence\” that resists a simple narrative: starts and completions both show statistically significant weakness, while permits are significantly higher. On a year-to-date basis, both starts and permits sit in a flat, statistically inconclusive range.\n\n## Scenario Thresholds to Watch\n\nBullish scenario: If August data (due September 17) shows starts rebounding toward the level implied by permit growth, July’s plunge would likely be classified as noise. Bearish scenario: If the backlog of authorized-but-unstarted units (already up 10.3% YoY) continues to swell without a rebound in starts, that would point toward more structural builder caution.\n\n## Where This Fits Into Fed Policy\n\nHousing starts are both a GDP component and one of many series the Federal Reserve monitors, but a single month of housing data rarely moves FOMC decisions alone — it must be read alongside labor market and inflation data such as the jobs report and CPI. For non-U.S. readers: unlike Eurostat’s combined construction output index or the UK’s ONS series, the U.S. release uniquely separates starts, permits, and completions into three distinct monthly prints, which is why divergences like this one are more visible here than elsewhere.”,
“fallback_bullets”: [“着工急減はGDPの住宅投資項目に下押し圧力”, “許可の有意な増加は中期的な下支え要因”, “許可済み未着工の積み上がりは業者の慎重姿勢を示唆”, “住宅指標単独でFRB判断は決まらない”, “次回発表は9月17日、基調確認には数ヶ月要す”],
“fallback_bullets_en”: [“Starts decline pressures GDP via residential investment”, “Significant permit growth offers medium-term support”, “Growing backlog suggests builder caution”, “A single housing report won’t move Fed decisions alone”, “Next release Sep 17; trend confirmation needs more months”],
“html_content”: “<!DOCTYPE html>
”
}
]
Disclaimer: This article is for informational purposes only. All investment decisions are made solely at your own risk.







