📺 Watch the Full Video Analysis
This article was automatically generated by the NFC Market Live AI analysis system. (Updated: 2026-08-18 05:38 JST)
📄 Primary Source
NFC Market Live
https://home.treasury.gov/news/press-releases/sb0606
A deep dive into the U.S. Treasury’s June 2026 TIC (Treasury International Capital) data. 📊
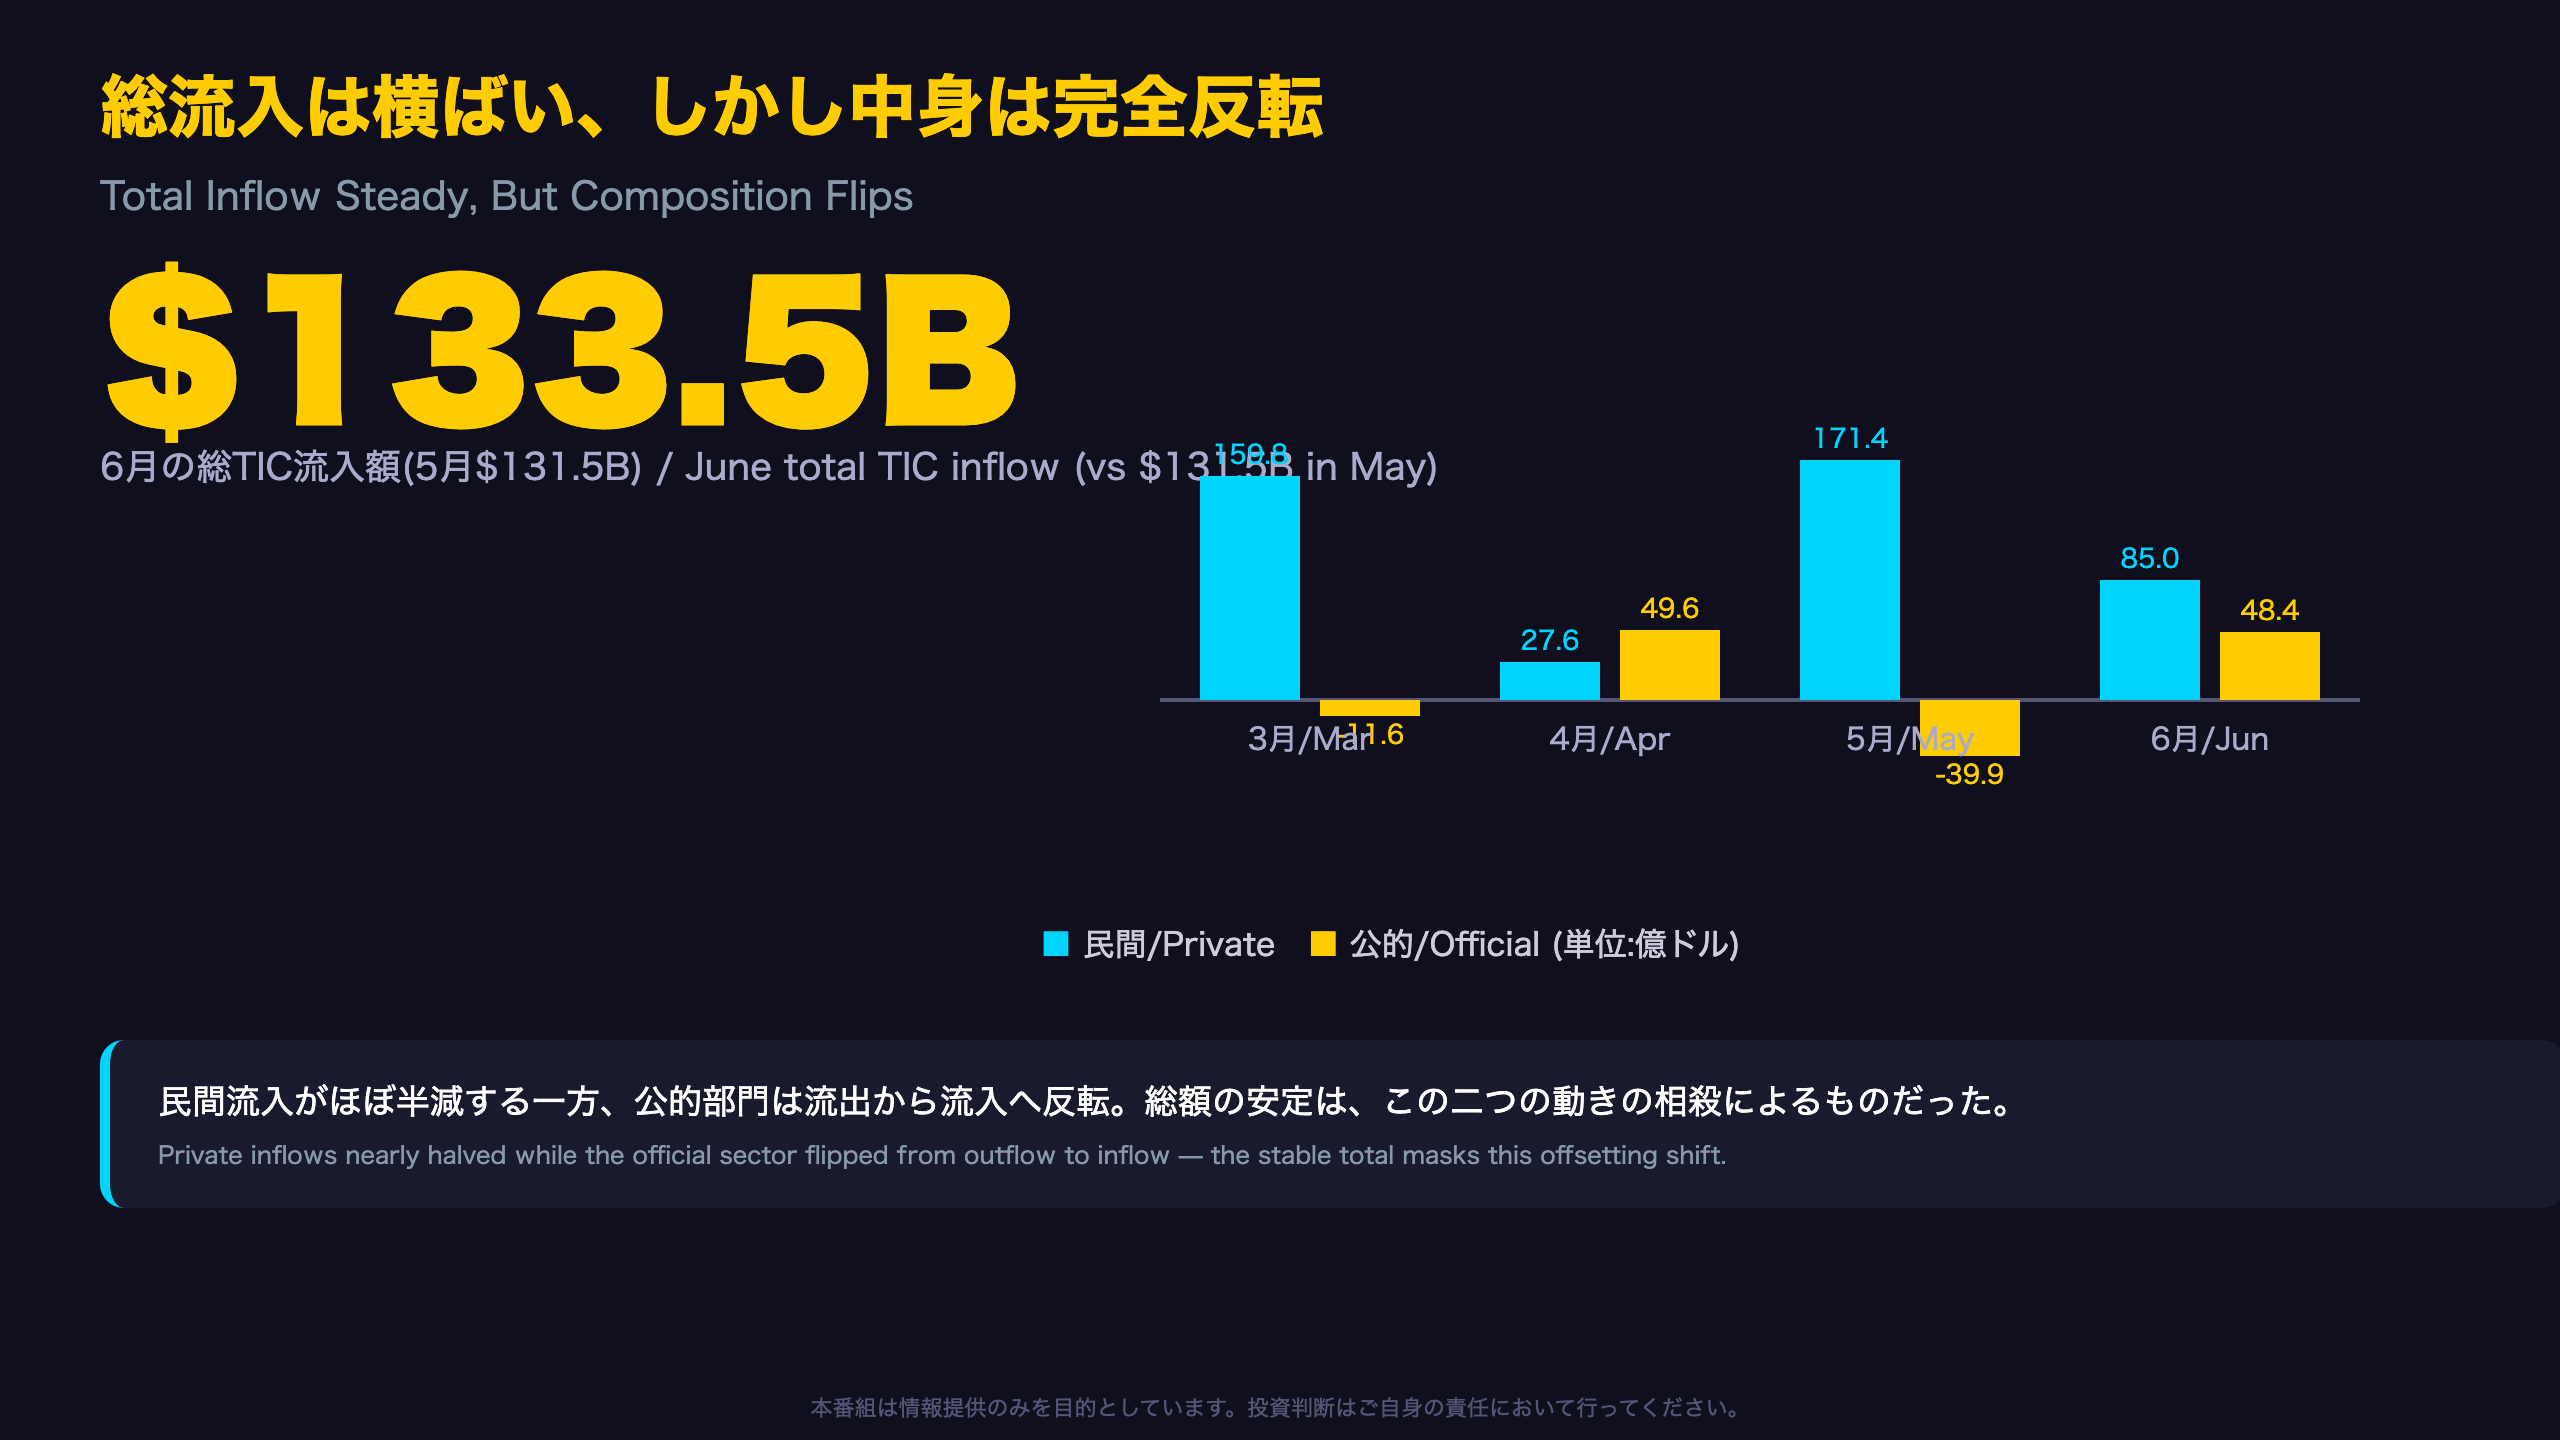
Total net inflows held nearly steady at $133.5bn, but the composition flipped: private inflows nearly halved from $171.4bn to $85.0bn.📉
Meanwhile foreign official institutions swung from a $39.9bn outflow to a $48.4bn inflow, with equity purchases surging 2.7x to $36.7bn.📈
What does fading private Treasury demand plus concentrated equity buying mean for the dollar, Treasuries, and U.S. stocks?💡
Next release (July data): September 16, 2026.
The Ultimate Summary:総流入は横ばい、中身は完全反転
What Is TIC Data, and Why It Matters
The Treasury International Capital (TIC) system is how the U.S. Treasury tracks cross-border portfolio flows into and out of U.S. securities markets. For international readers used to Japan’s Ministry of Finance weekly flow data or the Bundesbank’s balance-of-payments releases, TIC is the closest U.S. equivalent, published monthly with roughly a six-week lag.
The Real Story: A Buyer-Base Rotation
Headline net inflows of $133.5bn in June looked almost identical to May’s $131.5bn. But this apparent stability hides a rotation: private inflows nearly halved (from $171.4bn to $85.0bn) while official inflows swung from a $39.9bn outflow to a $48.4bn inflow, an $88bn swing that a single top-line number completely obscures.
Trailing 12-Month Divergence
On a trailing 12-month basis, total dollar portfolio inflows fell roughly 35% year-over-year, from $1,830.8bn to $1,191.1bn, driven mainly by a reversal in banks’ own dollar liabilities. Long-term securities flows, by contrast, actually grew 7.6% over the same period, suggesting durable demand for U.S. stocks and bonds even as short-term dollar funding flows reversed.
Market Implications
A rotation toward official buyers, combined with weakening private Treasury demand, bears watching ahead of upcoming Treasury auctions.
観点1:長期証券への純流入 — 5月の高水準から反落
Instrument-Level Breakdown
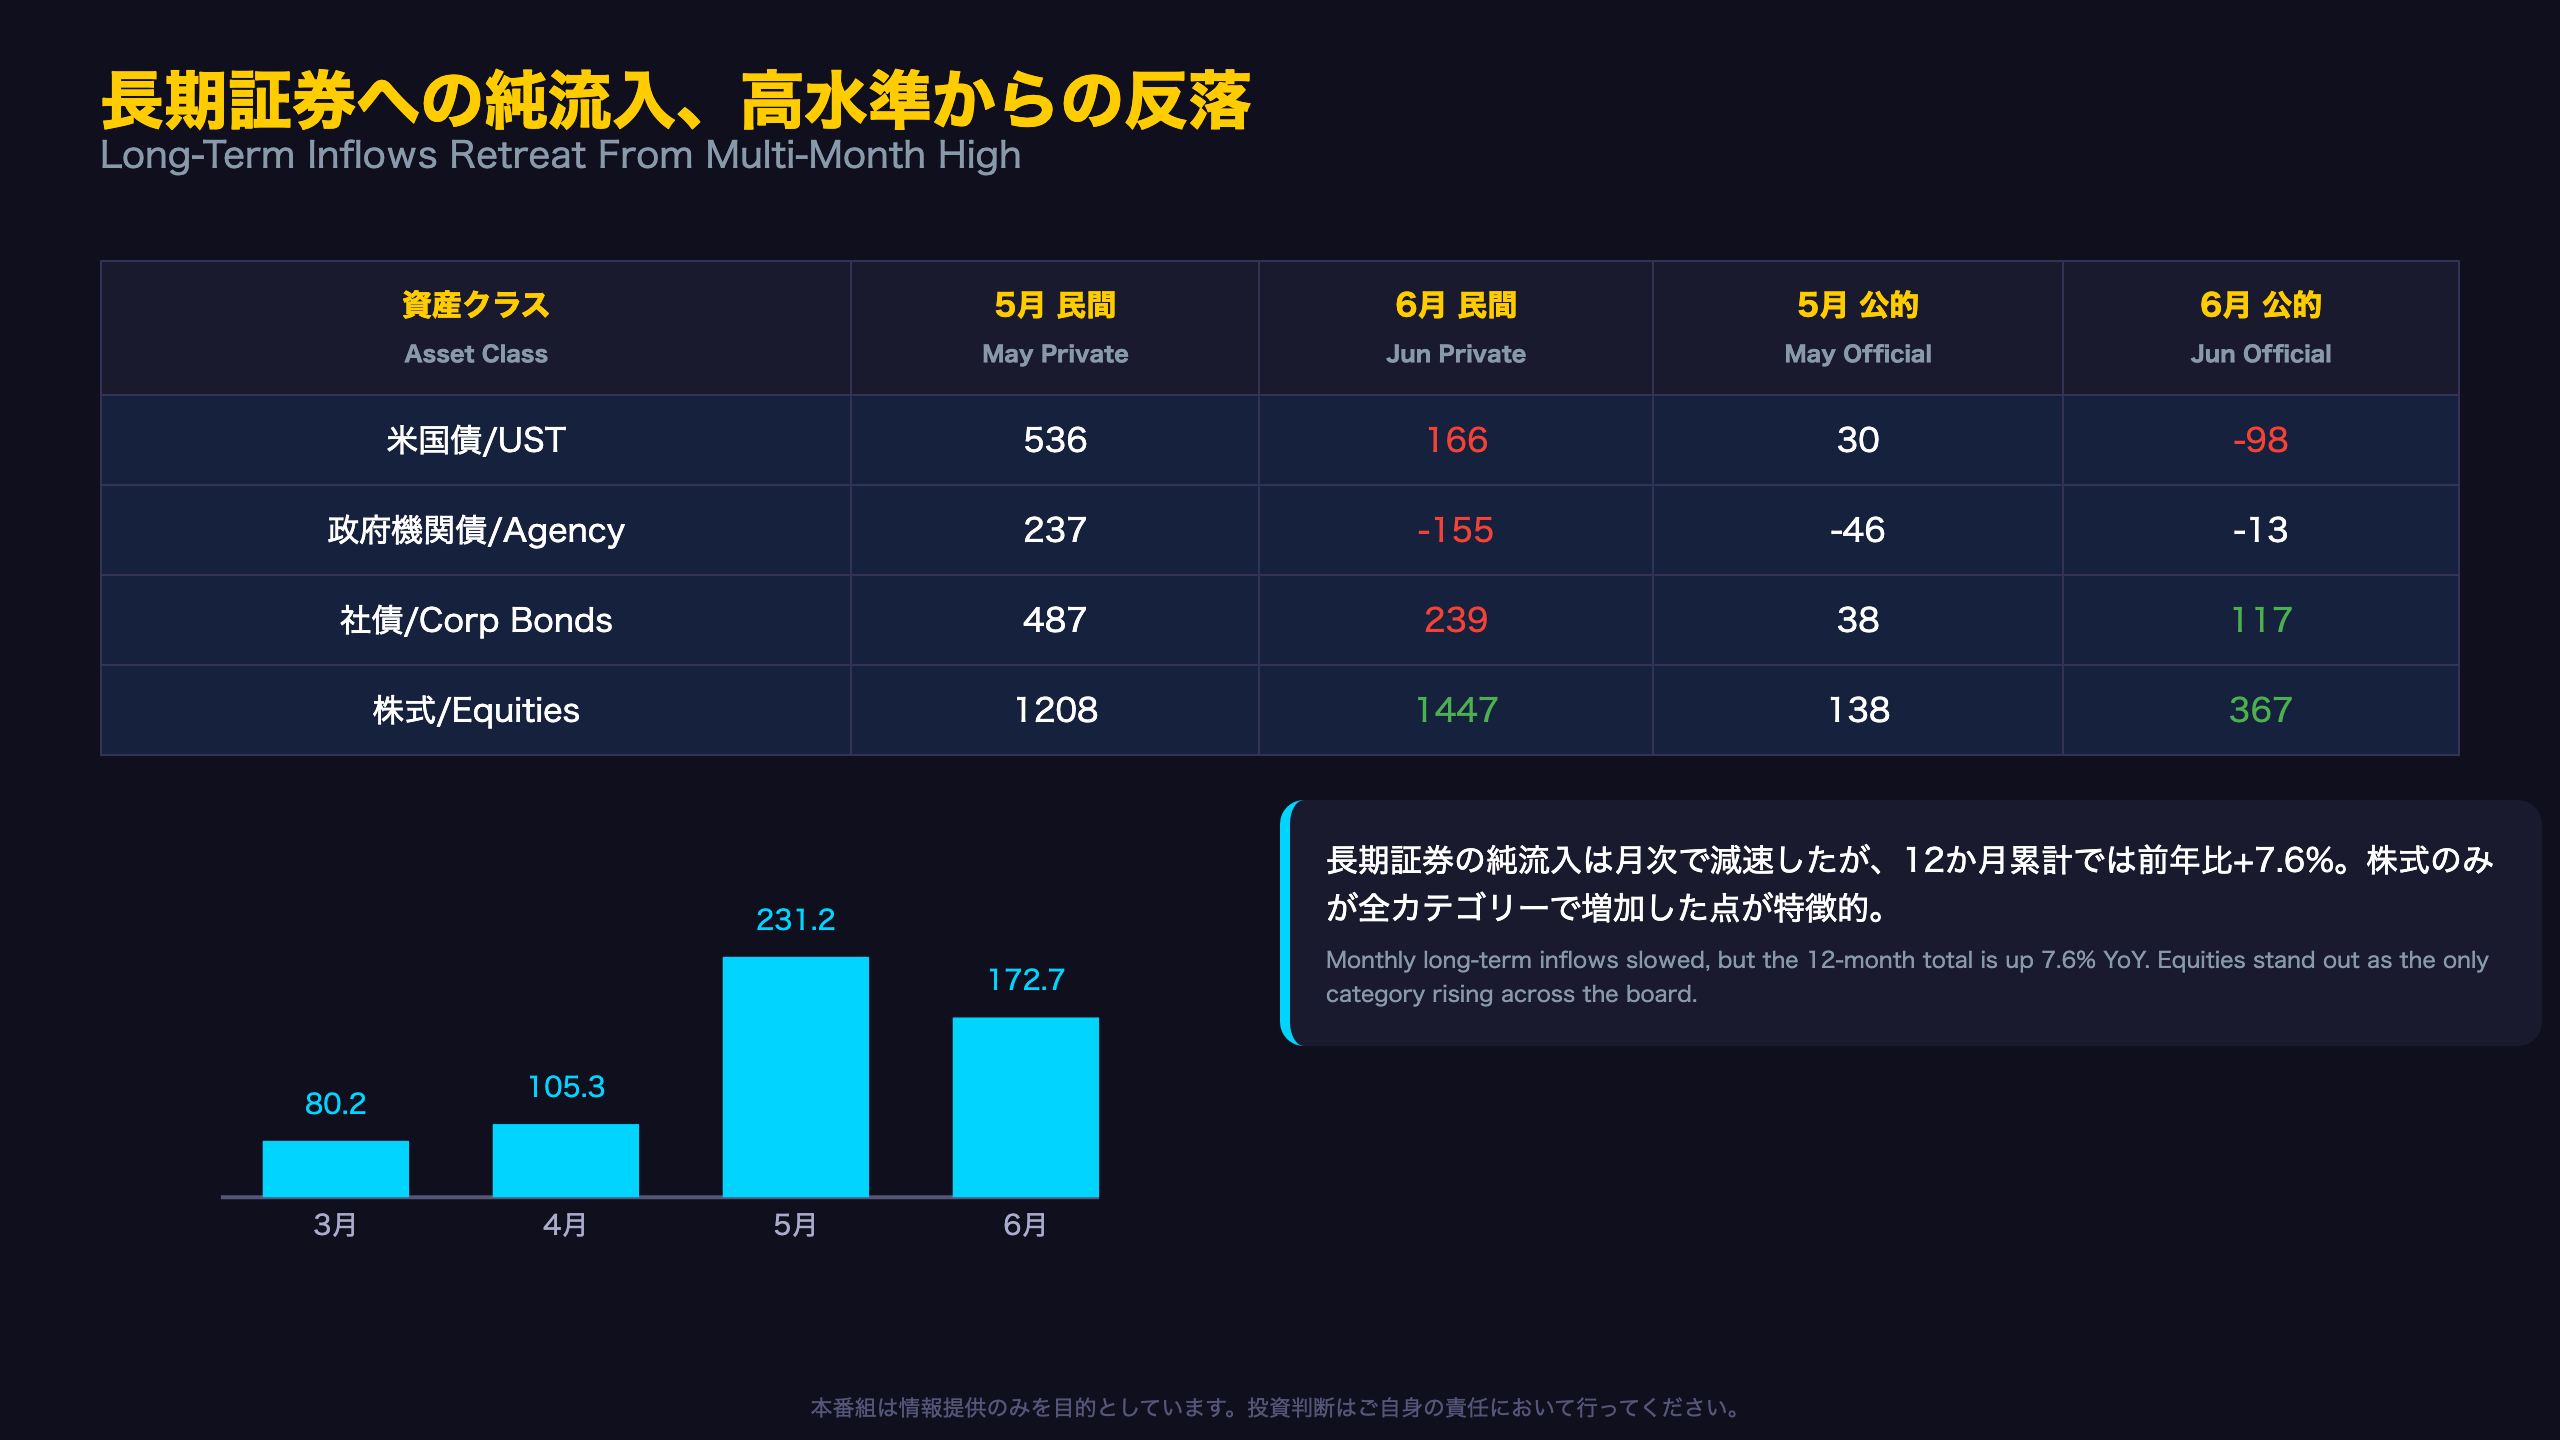
The June TIC release shows clear divergence across asset classes. Foreign private investors’ net purchases of Treasury notes and bonds fell from $53.6bn in May to just $16.6bn in June, a 69% drop. Agency bonds swung from +$23.7bn to -$15.5bn, meaning private investors turned net sellers. Corporate bond purchases nearly halved ($48.7bn to $23.9bn). Equities were the lone bright spot, rising from $120.8bn to $144.7bn.
On the official side, a similar pattern emerged: net Treasury purchases turned negative (from +$3.0bn to -$9.8bn), even as official equity purchases surged from $13.8bn to $36.7bn, more than double.
Context for International Readers
Unlike Japan’s Ministry of Finance data, which separately reports flows by investor type (banks, life insurers, trust accounts), the U.S. TIC breakdown splits by “private” versus “official” foreign holders, a distinction useful for gauging whether flows come from price-sensitive private capital or policy-driven reserve management.
Why This Matters
The rotation away from Treasuries and agency debt toward equities, visible in both private and official columns, could reflect profit-taking, valuation-driven reallocation, or simply one month of noise. A single month’s data cannot resolve which explanation dominates.
観点2:国別データは非開示、公的セクターの質の変化
Why No Country-Level Data This Time
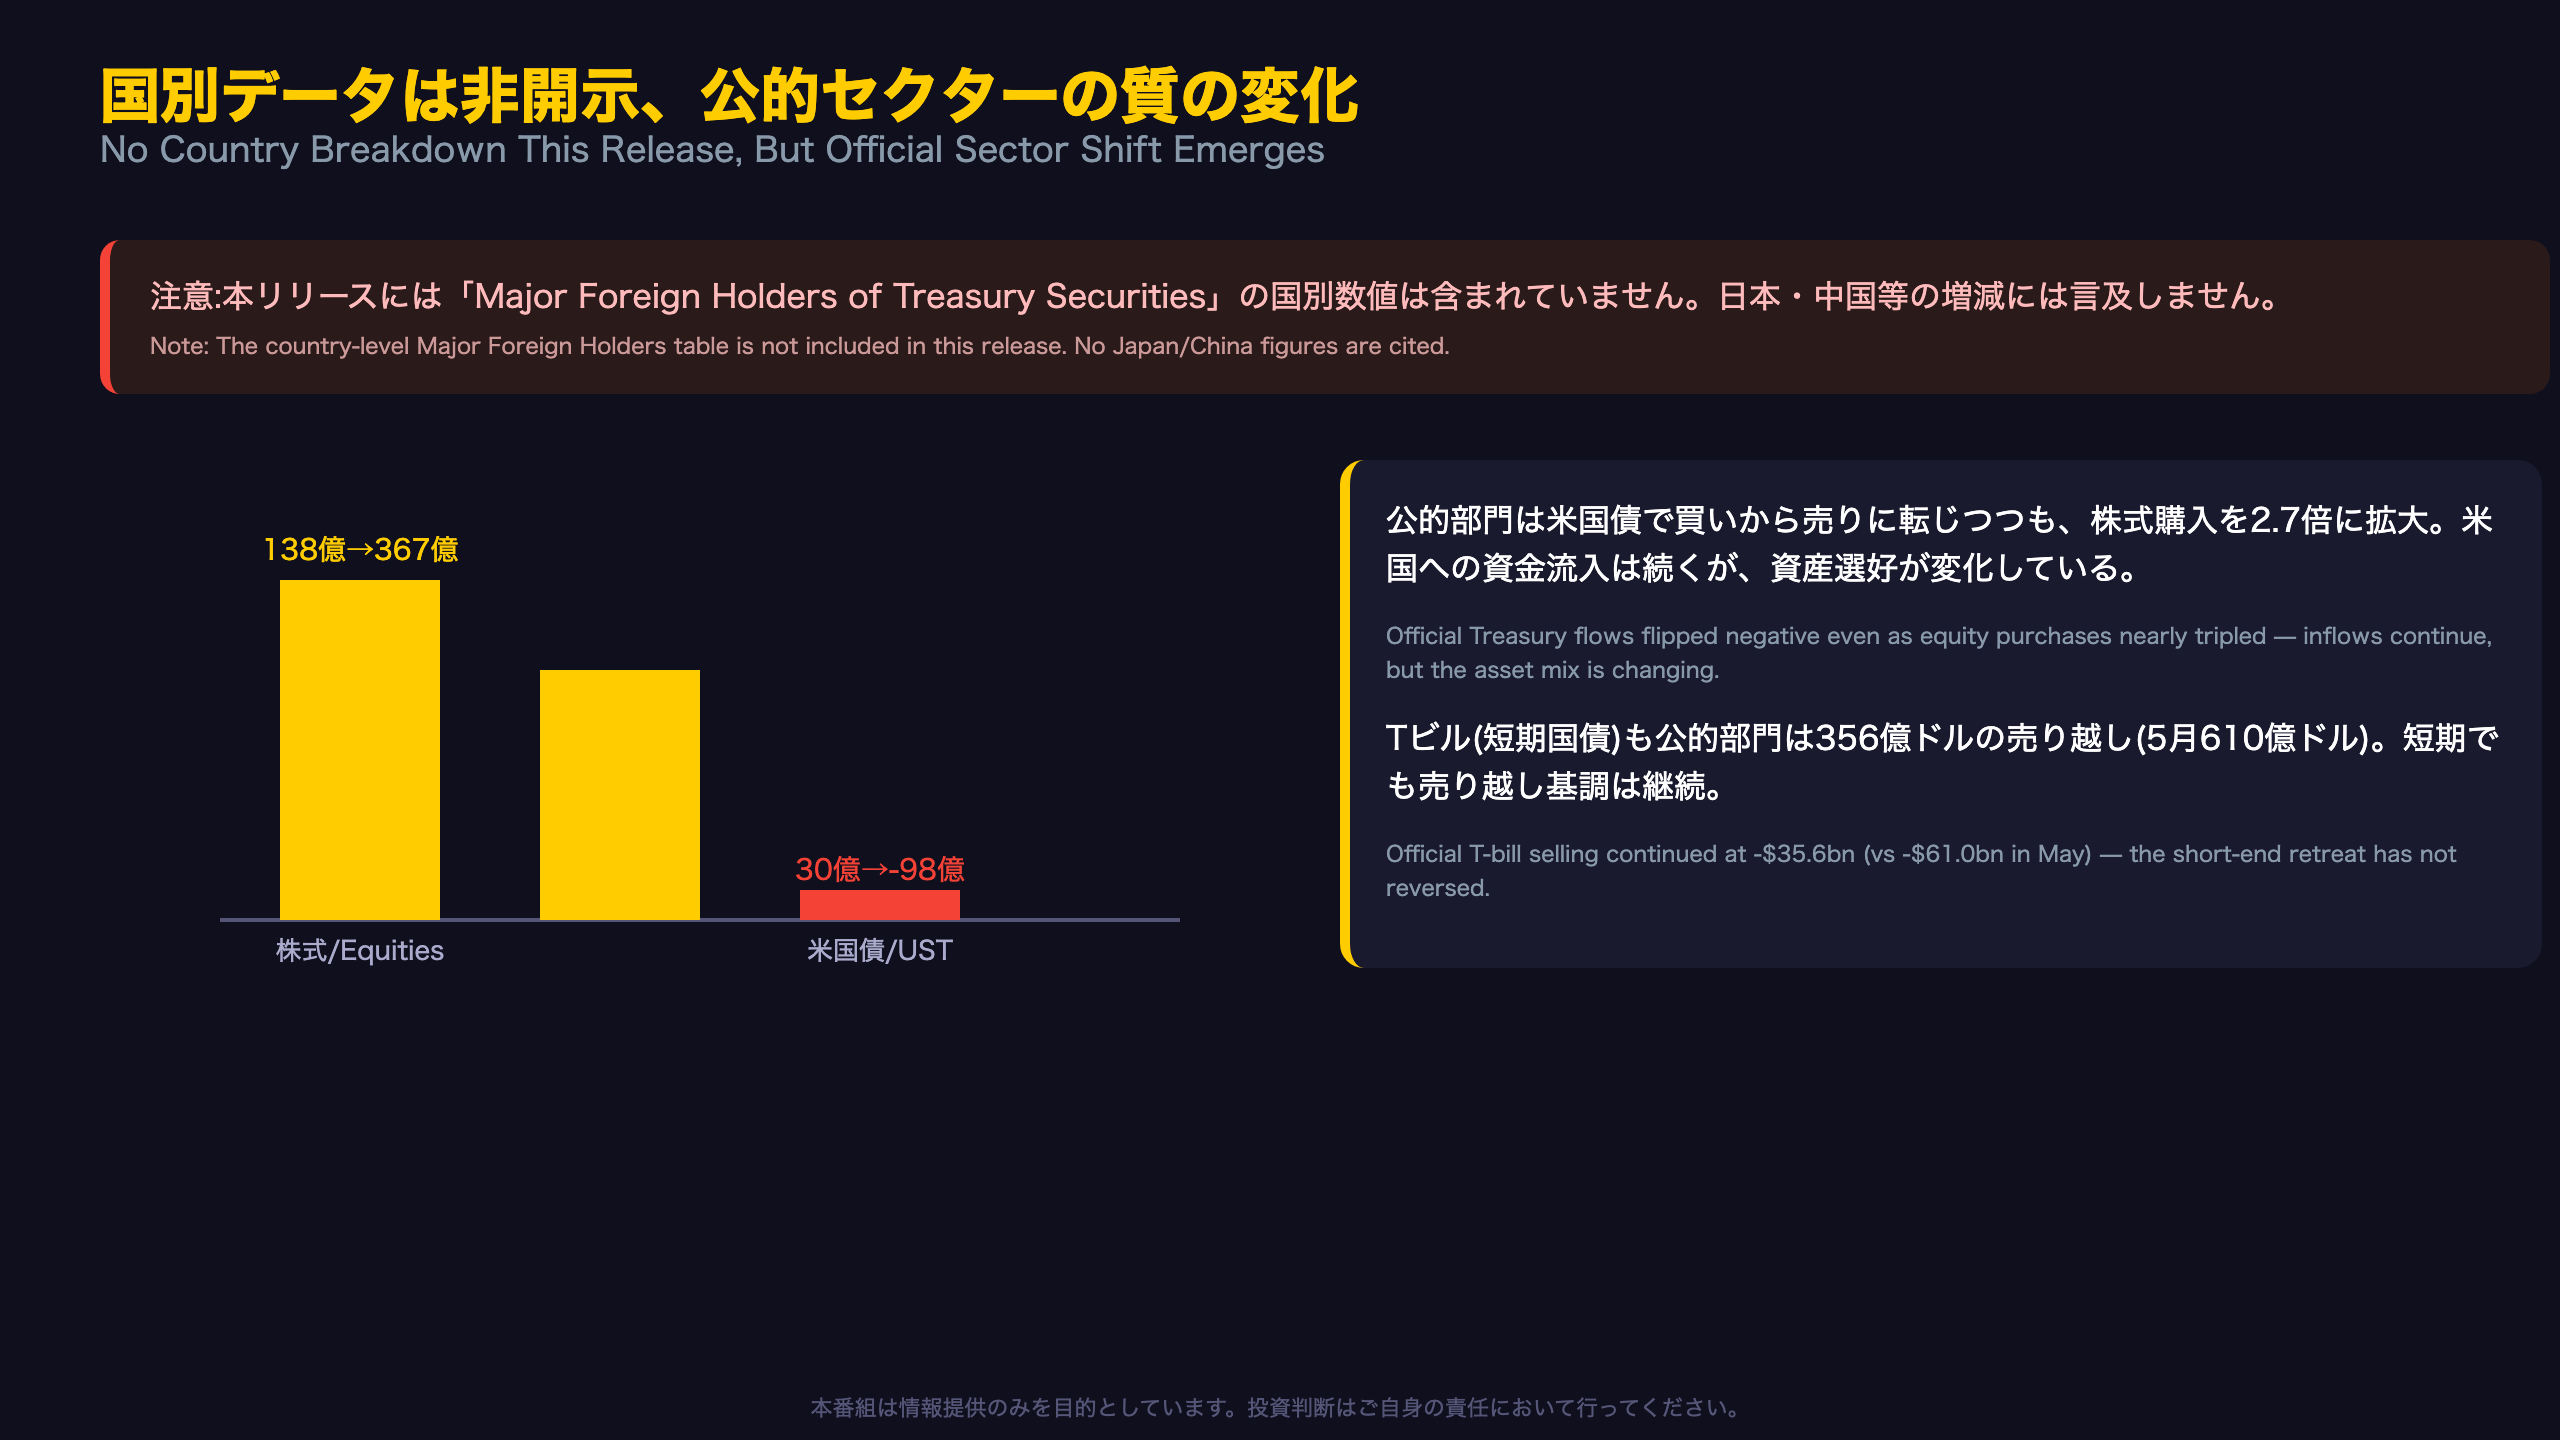
The Treasury’s press release references the existence of a Major Foreign Holders of Treasury Securities table, the source of headline figures on Japan’s and China’s UST holdings that global investors typically watch closely. However, the specific country-level figures were not included in the text provided for this release. In the interest of avoiding fabricated or estimated data, this analysis does not speculate on individual country positioning this month.
What We Can Say: Official-Sector Composition Shifted
The aggregate data confirms a change in the character of official-sector demand. Net long-term purchases by foreign official institutions rose from $16.1bn to $37.3bn month-over-month. But within that total, net Treasury purchases flipped from +$3.0bn to -$9.8bn, while equity purchases more than doubled, from $13.8bn to $36.7bn.
International Comparison
This pattern, official reserve managers reducing government bond exposure while adding equities, echoes debates seen around large public pension and reserve managers globally, though this TIC data reflects foreign official holders of U.S. assets specifically.
Bills Also Saw Continued Official Selling
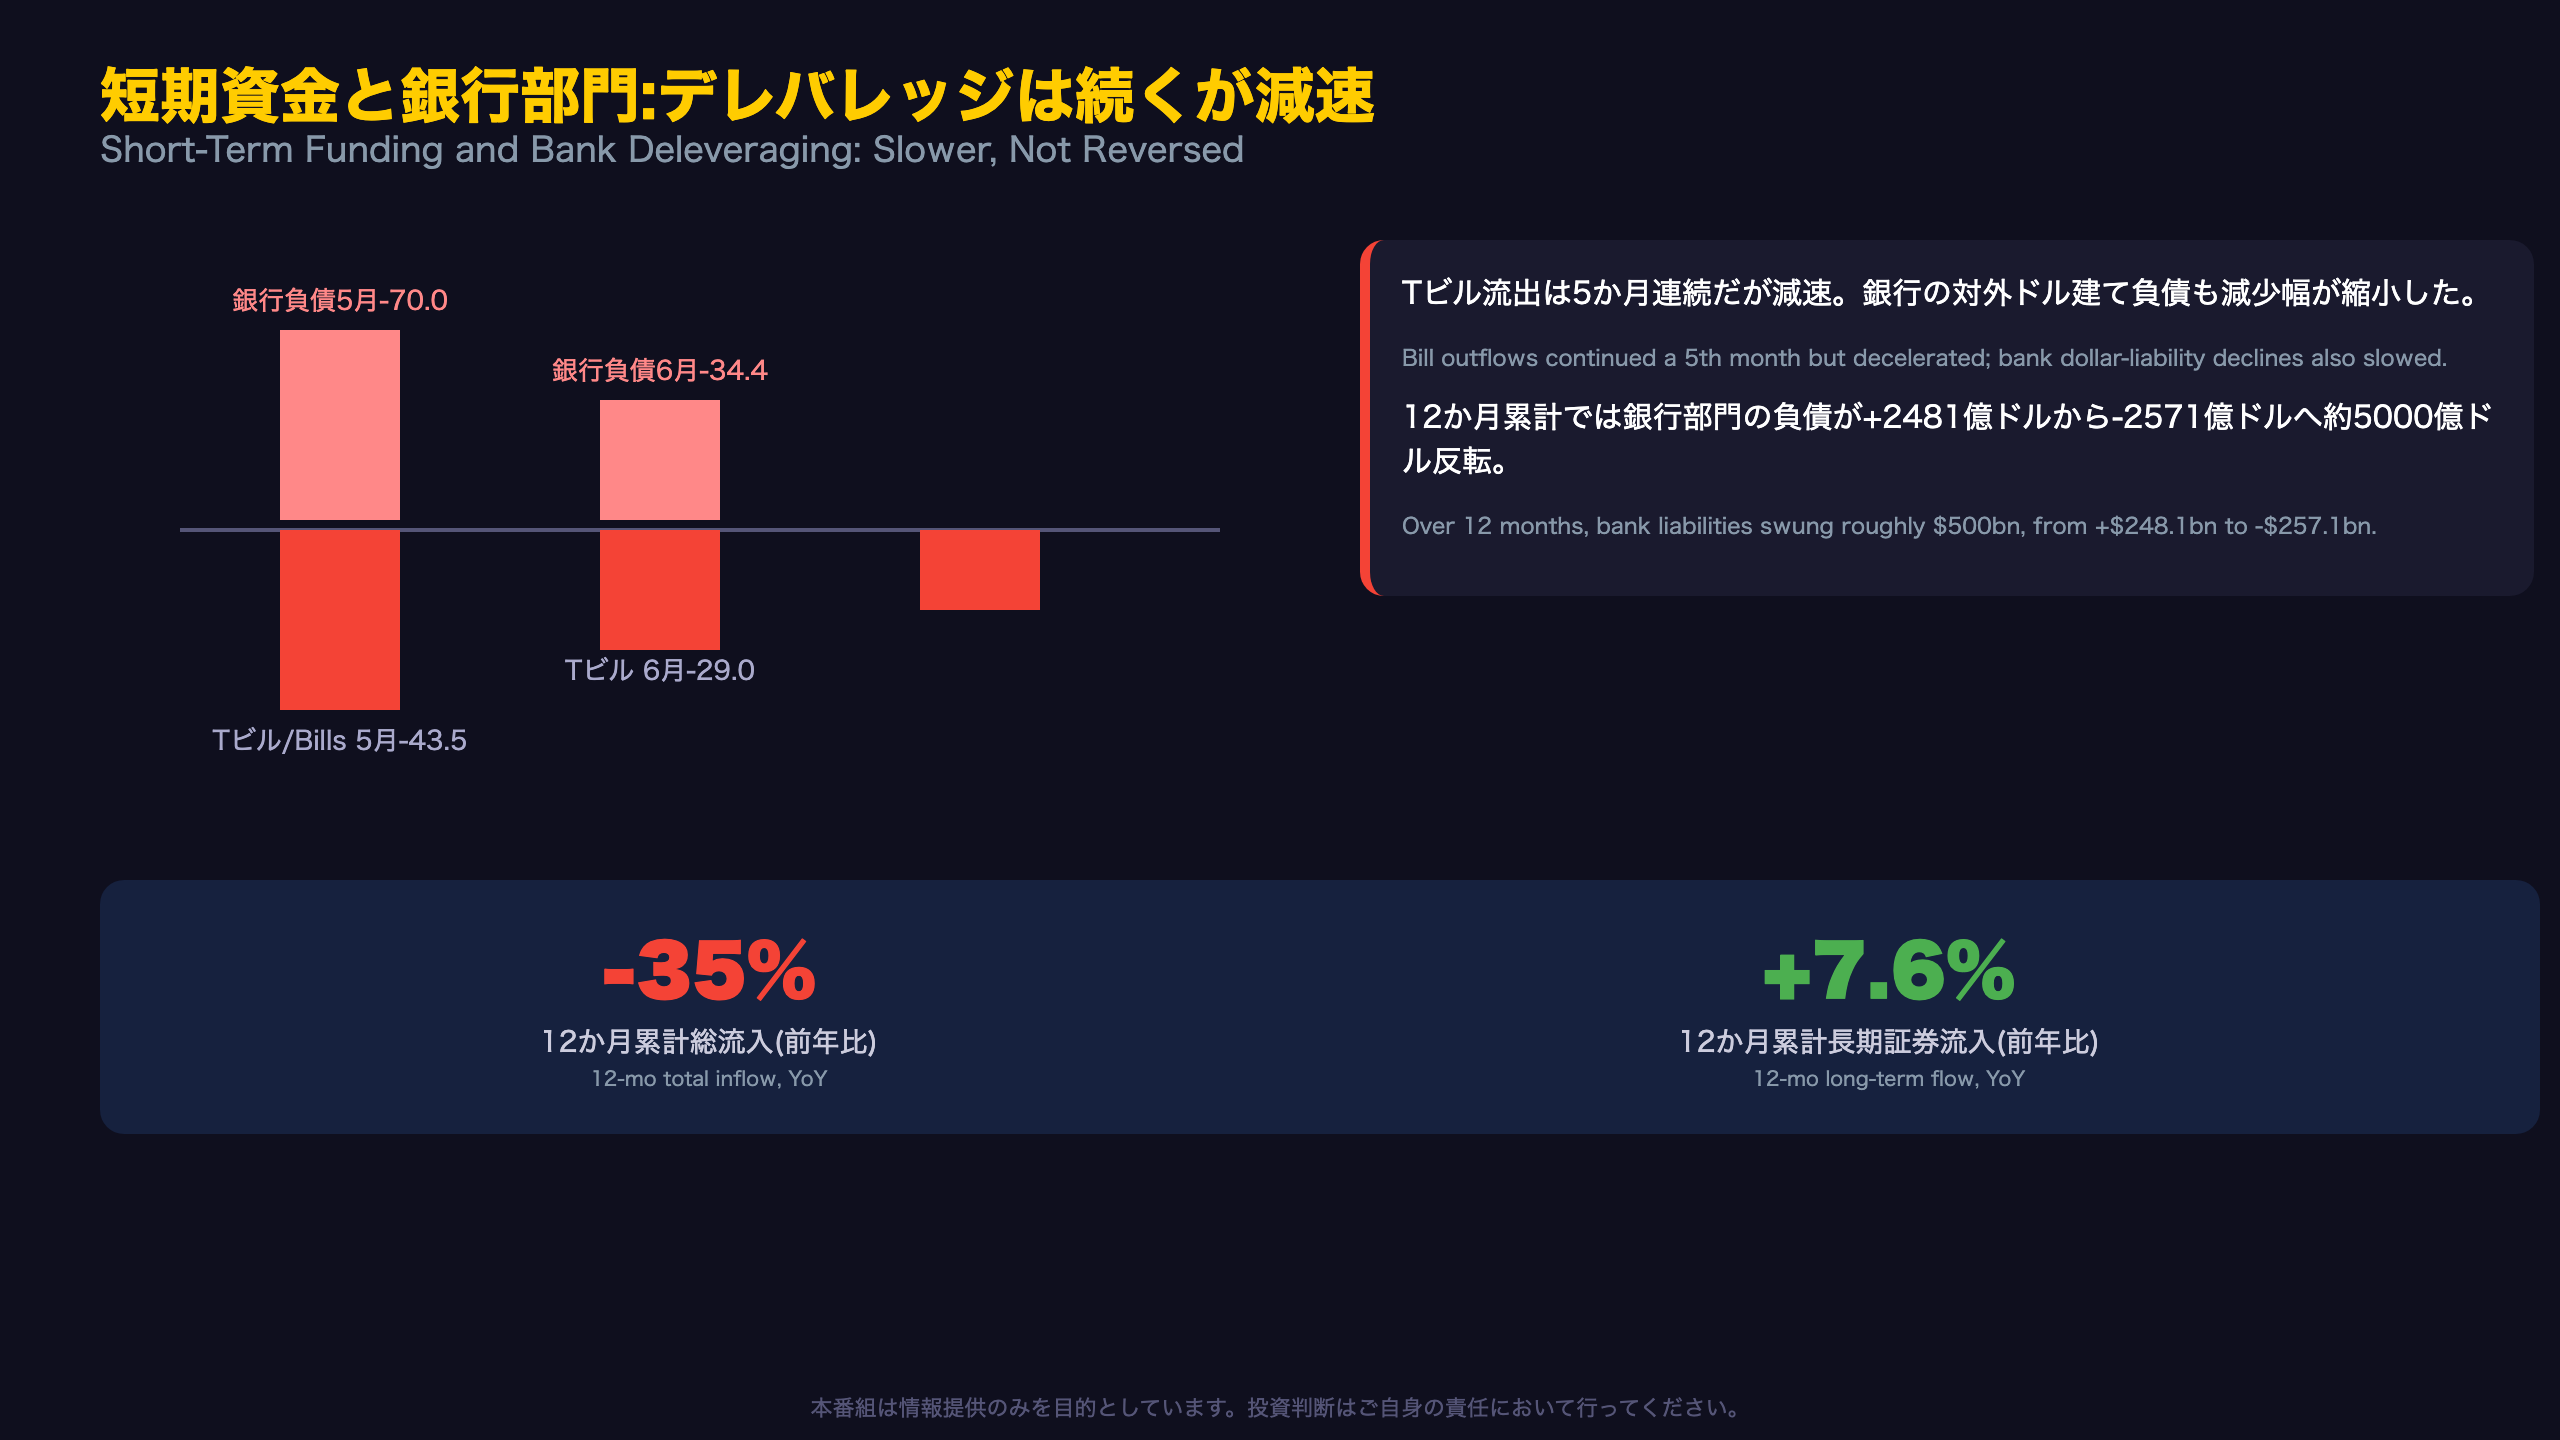
The release states foreign residents \”decreased their holdings of U.S. Treasury bills by $29.0 billion,\” of which the official share was -$35.6bn (versus -$61.0bn in May), a continued, if decelerating, retreat from short-term government paper.
Looking Ahead
Only the country-level breakdown due with future releases can confirm whether this rotation is broad-based or concentrated among a handful of large official holders.
民間マネーの逃避先はどこか — 債券売り、株式買い
The Private Bond Retreat, By the Numbers
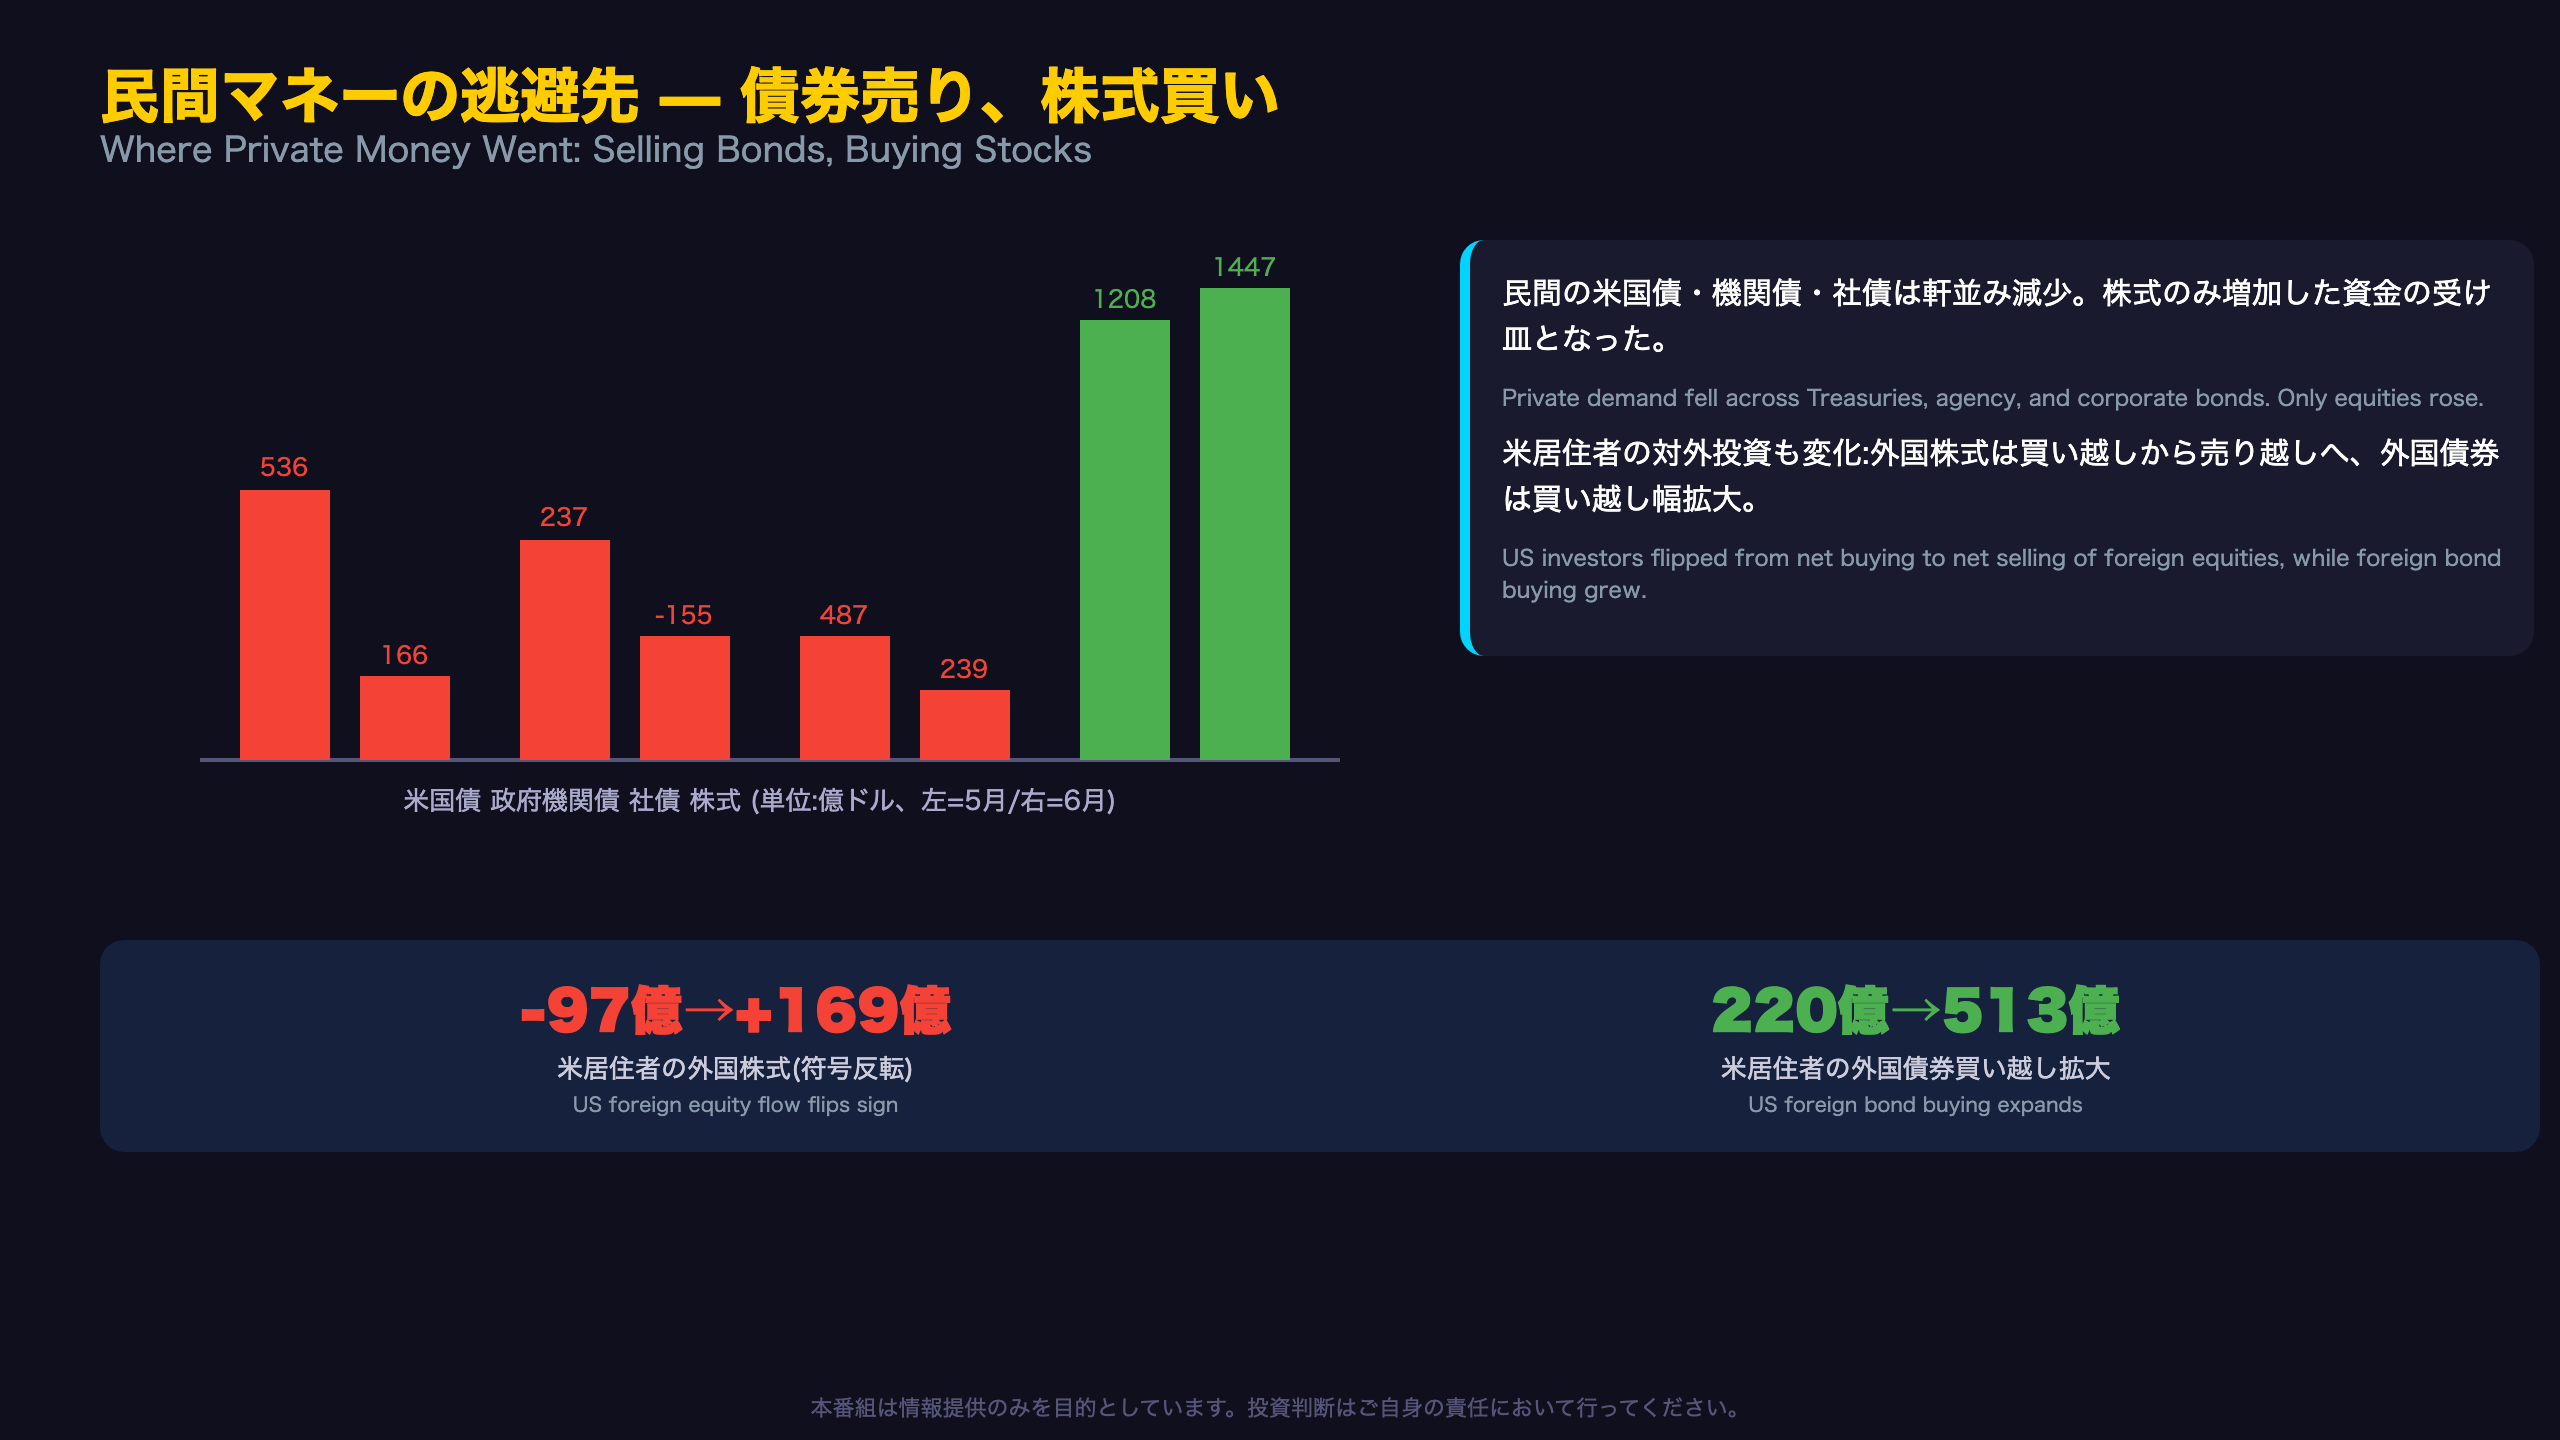
Private foreign investors’ net Treasury purchases fell 69%, from $53.6bn to $16.6bn. Agency bonds, often viewed as a close substitute for Treasuries, flipped from $23.7bn of net buying to $15.5bn of net selling. This simultaneous retreat across two government-related fixed income categories is notable, even if it does not yet constitute a multi-month trend.
Equities as the Consistent Destination
Equities bucked the trend entirely, rising from $120.8bn to $144.7bn, the largest single destination for private foreign capital in recent months. The Treasury’s release does not specify the drivers, so multiple interpretations remain valid.
A Two-Way Street: U.S. Investors’ Own Rotation
U.S. residents’ own cross-border allocations flipped for equities: net U.S. purchases of foreign equities of $9.7bn in May became net sales of $16.9bn in June, consistent with capital repatriation. Meanwhile, U.S. investors’ foreign bond purchases accelerated, from $22.0bn to $51.3bn.
A Caveat From the Source Itself
The Treasury’s own methodological note states plainly: it is difficult to draw precise conclusions from TIC data about changes in foreign holdings of U.S. financial assets by individual countries. The same caution applies to reading too much into a single month’s sector rotation.
短期資金と銀行部門:デレバレッジは続くが減速
Five Straight Months of Bill Outflows
Foreign Treasury bill holdings have now declined for five consecutive months. In June, the outflow was led by official holders (-$35.6bn, versus -$61.0bn in May), while private holders turned net buyers (+$6.6bn). This suggests the short-term outflow is primarily an official-sector phenomenon, not a broad private retreat.
Bank Deleveraging: A Byproduct of Tighter Dollar Funding?
The Treasury’s footnotes describe the banking liabilities series as reflecting monthly changes in banks’ and broker/dealers’ custody liabilities, a series often watched alongside Federal Reserve balance-sheet policy and global dollar funding conditions. The release itself offers no causal explanation, so any read-through to Fed policy remains speculative.
Bull Case vs. Bear Case on the 12-Month Swing
Optimists note that long-term securities flows actually grew 7.6% over the trailing year, implying genuine underlying demand for U.S. assets remains intact. Pessimists point to the roughly $500bn swing in banks’ 12-month dollar liabilities as a sign that global dollar funding channels are contracting, a dynamic that, if sustained, could tighten offshore dollar liquidity.
What to Watch Next
The July TIC data, due September 16, 2026, will show whether bank deleveraging extends to a third straight month and whether bill outflows finally stabilize.
インプリケーション:ドル・米国債・株式市場への示唆
Implications for the Treasury Market
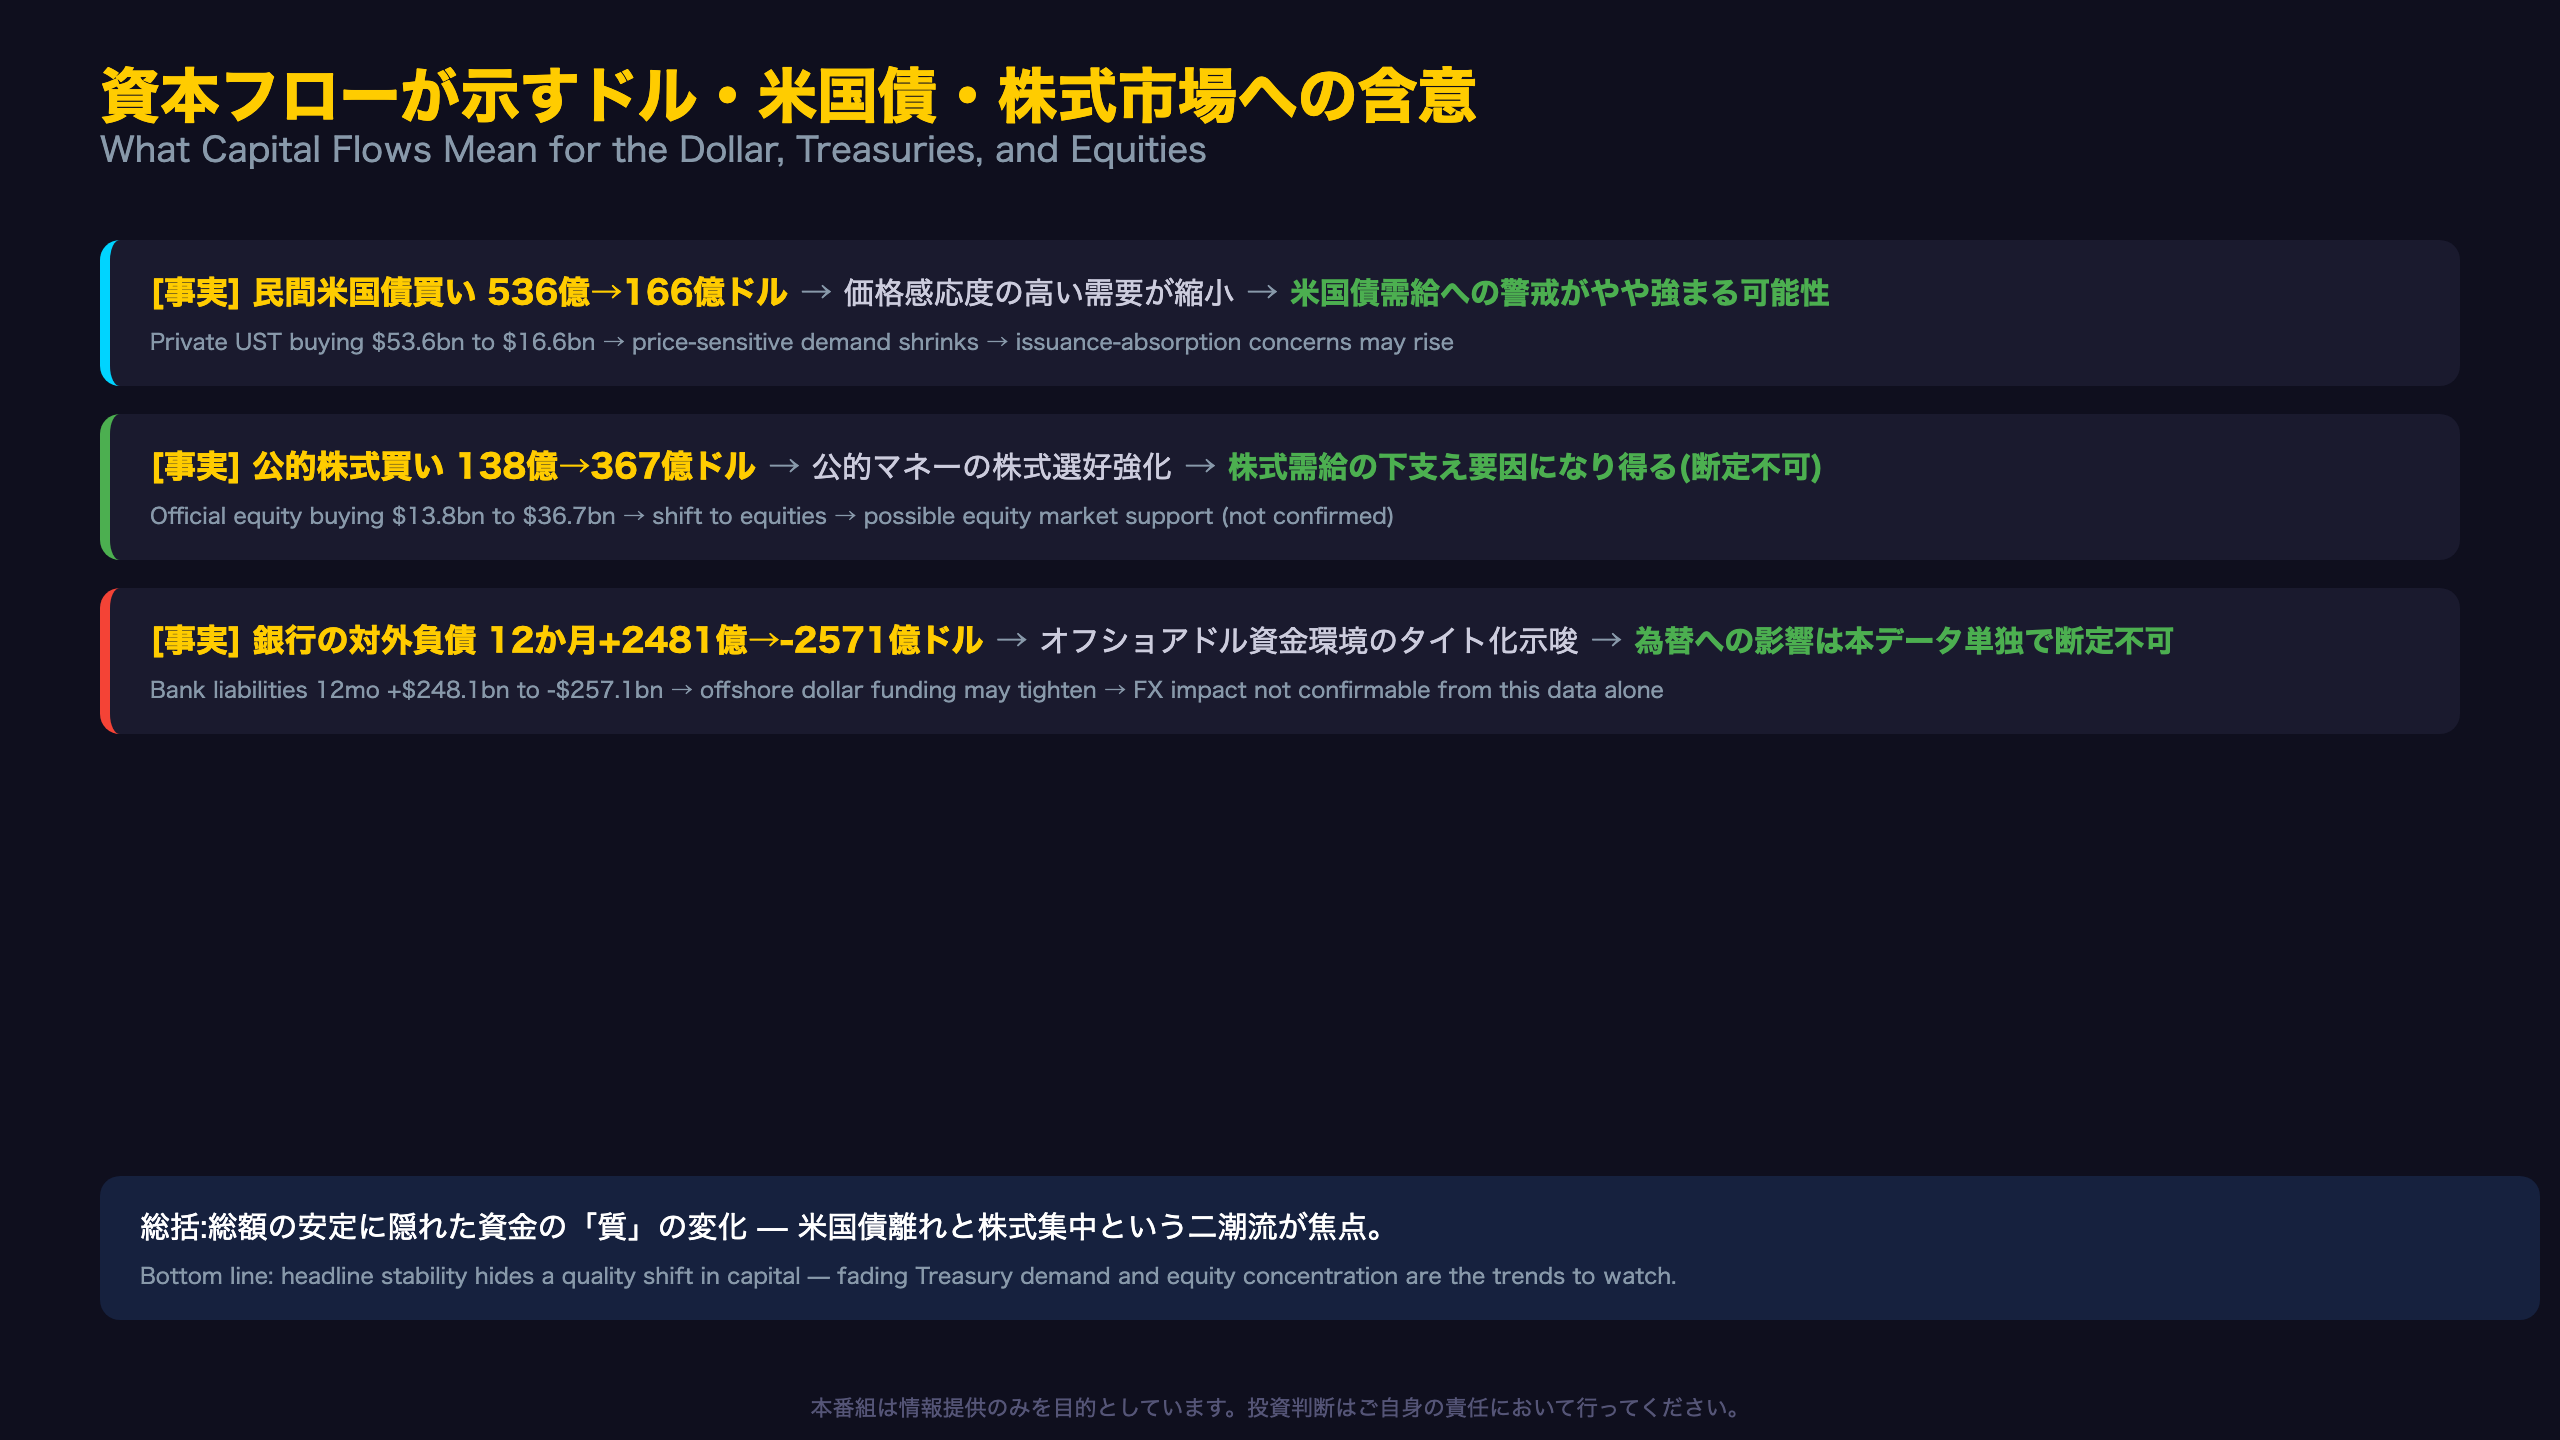
The sharp drop in private net Treasury purchases ($53.6bn to $16.6bn) arrives amid continued heavy Treasury issuance, and could reignite concerns about auction absorption capacity. That said, official-sector capital continued flowing into the U.S. via other channels (equities, corporate bonds), meaning this is not a story of broad capital flight from U.S. assets.
Implications for the Dollar
The roughly $500bn swing in banks’ 12-month dollar liabilities (from +$248.1bn to -$257.1bn) is the kind of banking-sector deleveraging typically associated with tighter offshore dollar funding conditions. Tighter offshore dollar liquidity has historically been associated with upward pressure on the dollar via demand for dollar funding, but the Treasury release contains no direct commentary on FX markets, so this remains a general economic inference rather than a data-confirmed conclusion.
Implications for U.S. Equities
Equities were the standout destination for both private and official foreign capital, with combined June purchases of $181.4bn ($144.7bn private plus $36.7bn official). Sustained foreign official buying is often viewed as a stabilizing source of demand, though a single month cannot confirm a durable trend.
Bottom Line
The core takeaway is that headline stability in TIC data conceals a meaningful rotation: private Treasury demand is fading while capital, both private and official, increasingly concentrates in U.S. equities. Whether this pattern persists in the July data, due September 16, 2026, will be the key test.
Disclaimer: This article is for informational purposes only. All investment decisions are made solely at your own risk.







