📺 Watch the Full Video Analysis
This article was automatically generated by the NFC Market Live AI analysis system. (Updated: 2026-08-17 21:53 JST)
📄 Primary Source
Statistics Canada
https://www150.statcan.gc.ca/n1/daily-quotidien/260817/dq260817a-eng.htm
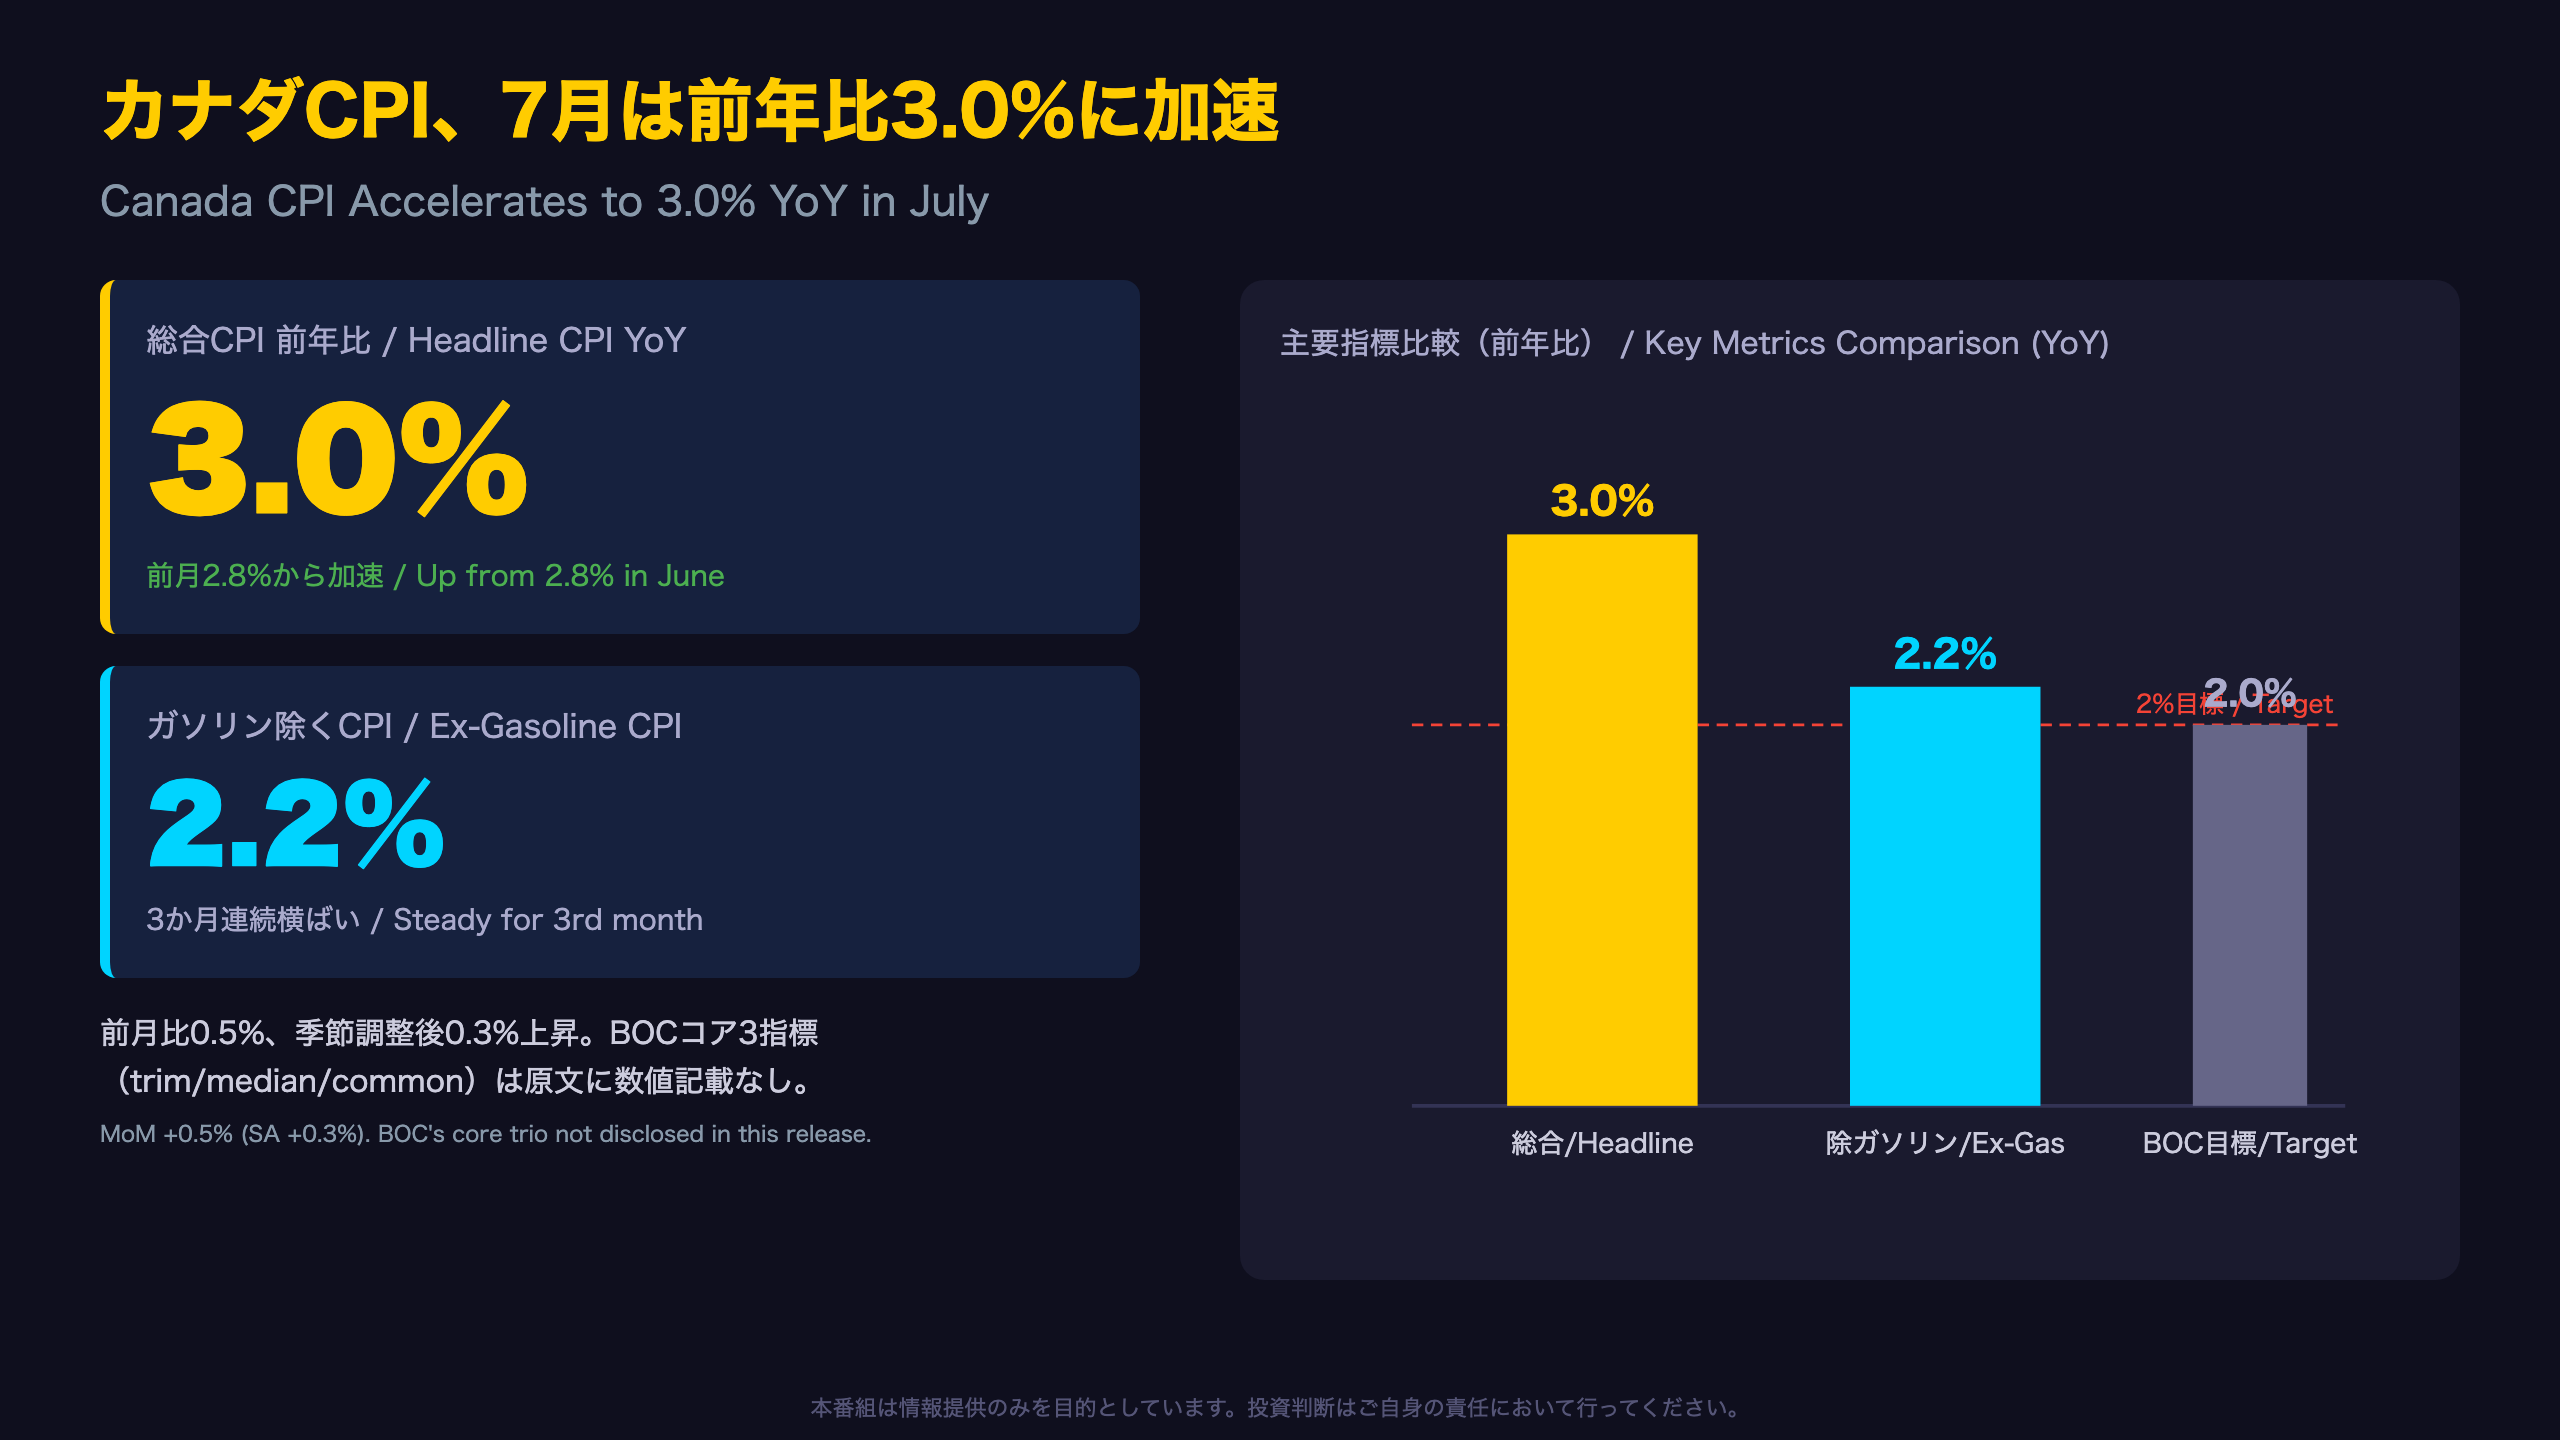
📊 Canada’s headline CPI accelerated to 3.0% YoY in July, up from 2.8% in June.
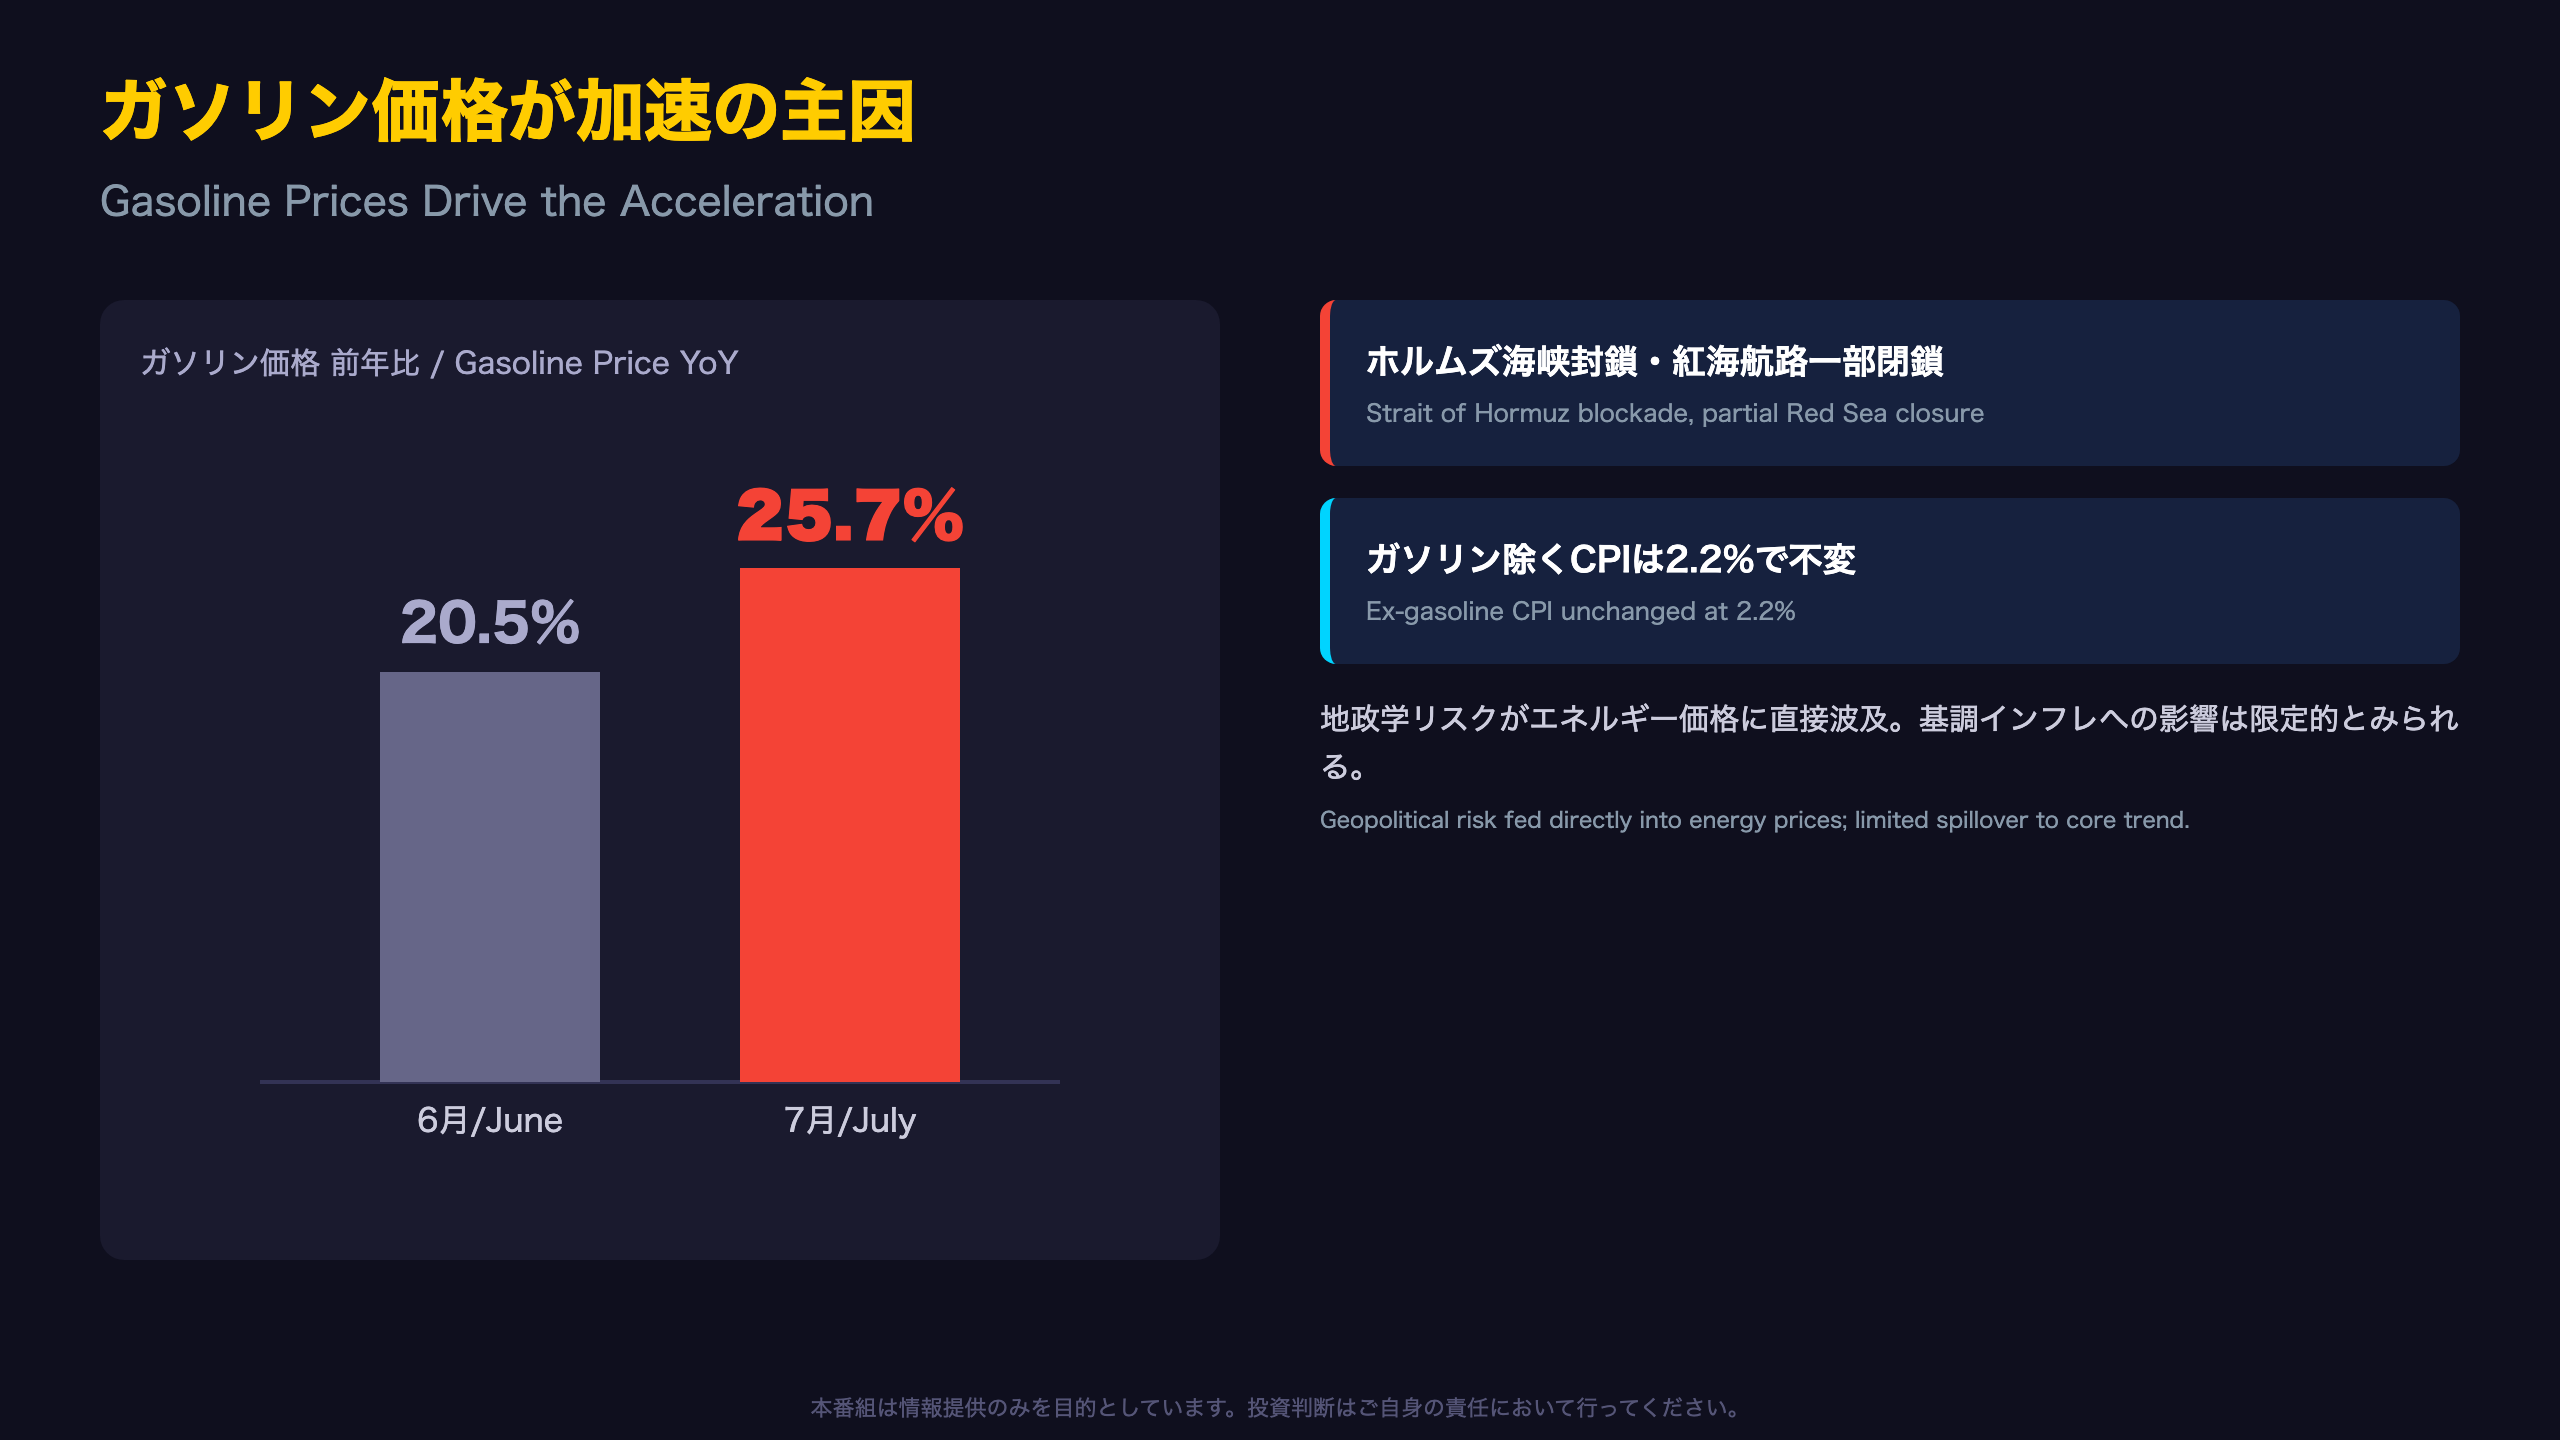
Gasoline prices surged +25.7% YoY, driven directly by Middle East tensions including the Strait of Hormuz blockade and partial Red Sea route closures.
📈 However, CPI excluding gasoline held steady at 2.2% for a third consecutive month, suggesting underlying price pressures have not shifted dramatically.
🍎 Grocery inflation cooled to 3.1% but has now outpaced headline CPI for 18 straight months. Fresh fruit prices jumped to +6.1% YoY.
🏦 Notably, BOC’s three core inflation gauges (trim/median/common) were not disclosed in this release, limiting the data available for policy assessment.
💡 We break down the implications for CAD and what to watch ahead of the August data release on September 14.
総合CPIは加速、コアは安定という二面性
Headline Acceleration, Steady Core
Canada’s July CPI rose 3.0% year-over-year, up 0.2 points from June’s 2.8%. Month-over-month growth was 0.5% (0.3% seasonally adjusted), confirming inflation momentum continued into the summer.
Statistics Canada (StatCan)—the federal agency responsible for national statistics, roughly analogous to the U.S. Bureau of Labor Statistics for CPI purposes—stated that “higher prices for gasoline and travel tours in July contributed to the acceleration in the headline CPI.”
Crucially, CPI excluding gasoline held at 2.2% for a third consecutive month, suggesting the broader inflationary pulse has not shifted meaningfully.
The Missing Core Trio
The Bank of Canada (BOC) relies on three preferred core inflation measures—CPI-trim, CPI-median, and CPI-common—published in a separate data table. None of these figures appeared with specific values in this release’s narrative text, limiting the depth of analysis available to markets this month.
By comparison, the U.S. Federal Reserve emphasizes core PCE, while headline CPI figures dominate short-term market reaction in both countries. For CAD traders, the absence of core data this cycle means the ex-gasoline reading (2.2%) becomes the best available proxy for underlying trend.
What’s Next
The August CPI report is due September 14. Given gasoline’s sensitivity to Middle East geopolitical developments, the trajectory of that conflict will likely be a key swing factor for the next release.
ガソリン価格が加速の主因
Anatomy of the Gasoline Price Spike
Gasoline prices surged 25.7% year-over-year in July, a sharp 5.2-point jump from June’s 20.5%. StatCan directly linked this to geopolitical developments: “The conflict in the Middle East, including the blockade of the Strait of Hormuz and the partial closure of Red Sea shipping routes in late July, put upward pressure on gasoline prices.”
Why These Chokepoints Matter
The Strait of Hormuz handles a substantial share of global seaborne oil trade, while Red Sea shipping lanes are critical for international logistics linking Asia, Europe, and the Americas. Disruptions to either route tend to feed quickly into freight costs and crude oil pricing, which pass through to pump prices with a short lag.
Supply Shock vs. Broad Inflation
The fact that CPI excluding gasoline has held at 2.2% for three straight months suggests this month’s headline jump reflects an energy-specific supply shock rather than a broader demand-driven inflation trend. This distinction matters for how the Bank of Canada might interpret the data—supply shocks are typically viewed as less persistent and less likely to trigger immediate policy reaction, unlike sustained demand-side price pressures.
Market Watch
For CAD traders, gasoline-driven CPI volatility tends to be discounted relative to core measures, but a prolonged Middle East conflict could keep energy import costs elevated into the August CPI release, due September 14.
旅行・航空運賃が押し上げ圧力に
Event-Driven Demand Lifts Travel and Air Fares
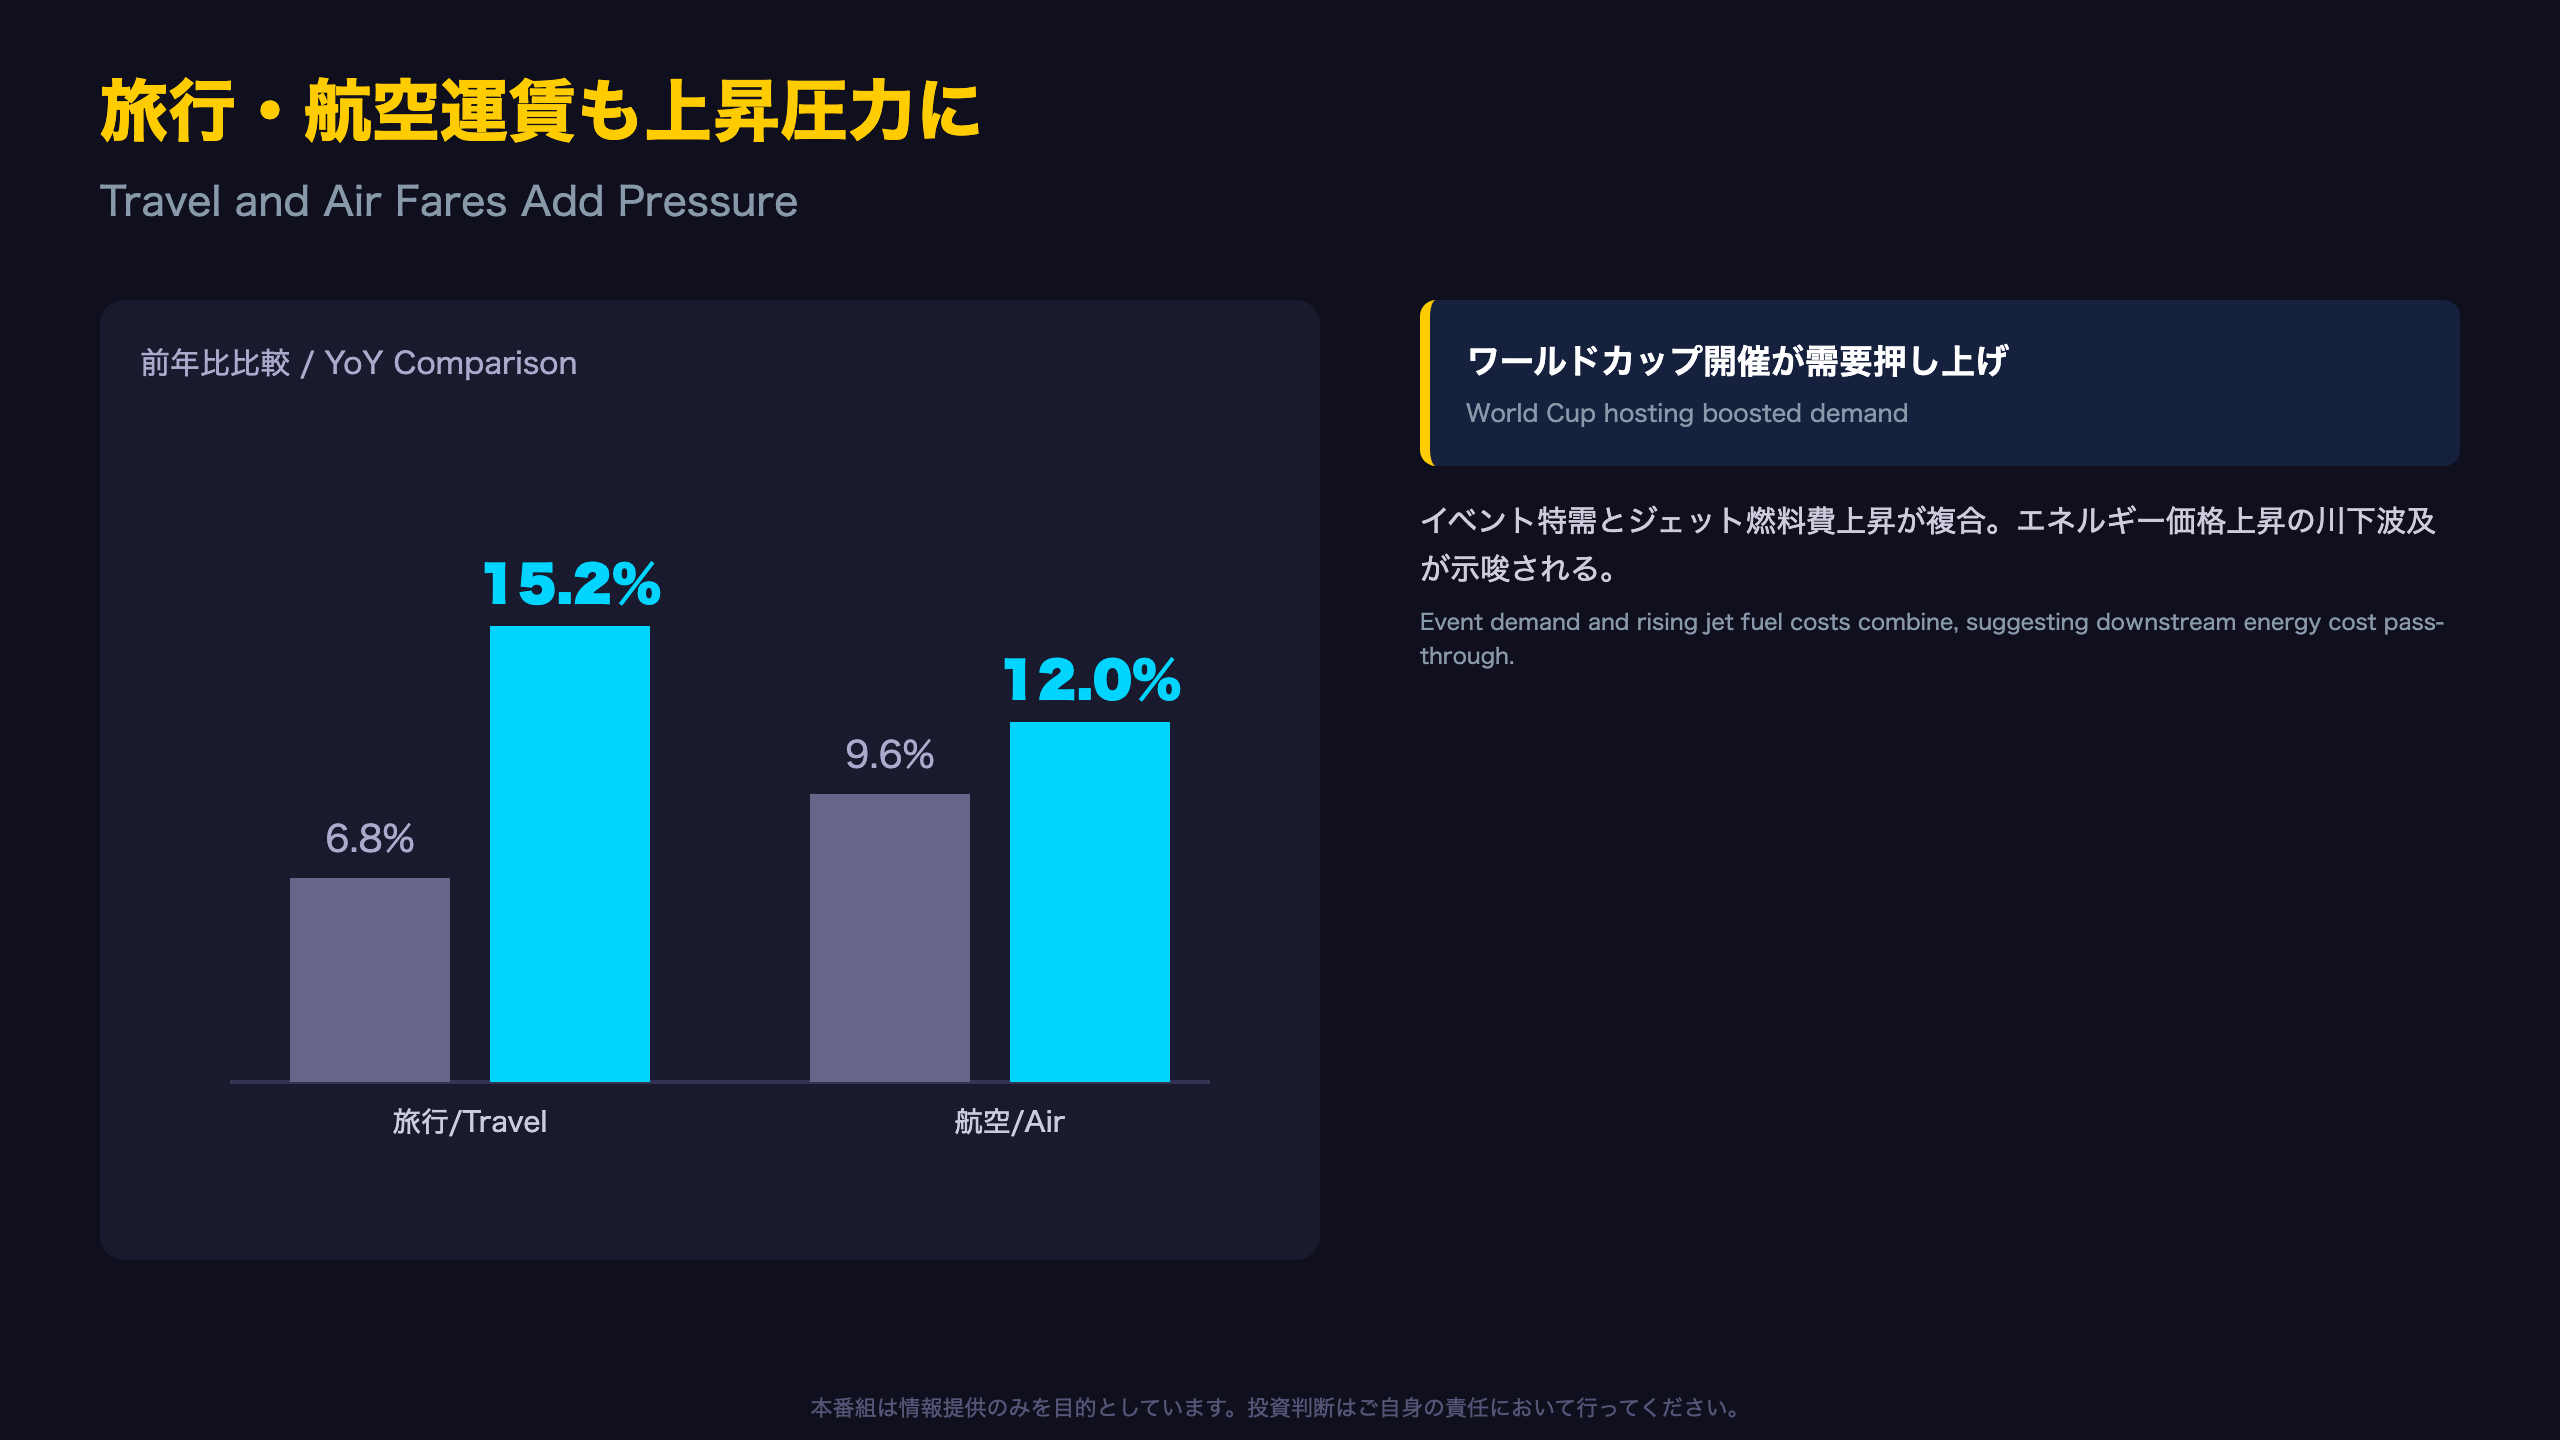
Travel tour prices leaped to 15.2% year-over-year in July, nearly doubling from June’s 6.8%. StatCan explained: “Contributing to higher prices were more expensive hotels and flights to US destination cities, coinciding with the hosting of World Cup matches.”
Air transportation prices also accelerated to 12.0% from 9.6%, attributed to “higher jet fuel costs”—an indirect channel through which broader energy price increases feed into transportation costs.
Distinguishing Event Effects from Trend
Large international sporting events like the World Cup can create temporary demand spikes in host and adjacent cities, pushing up hotel and airfare pricing in ways that don’t necessarily reflect underlying consumer demand strength. This is analogous to how U.S. CPI analysts often flag Olympic or Super Bowl-related price distortions in hospitality subcategories. Such effects typically normalize once the event concludes.
Connecting the Dots to Energy
However, jet fuel costs share a common root cause with the 25.7% surge in gasoline prices—both trace back to the same Middle East-driven energy market disruption. This suggests part of the travel and air fare increase may reflect genuine cost-push inflation from energy markets rather than pure event-driven demand.
For CAD watchers, this category’s volatility is unlikely to independently move the Bank of Canada’s policy calculus, but it reinforces the narrative that energy remains the dominant swing factor in this month’s CPI print.
食料品インフレは減速も高水準を維持
A Tale of Two Trends Within Groceries
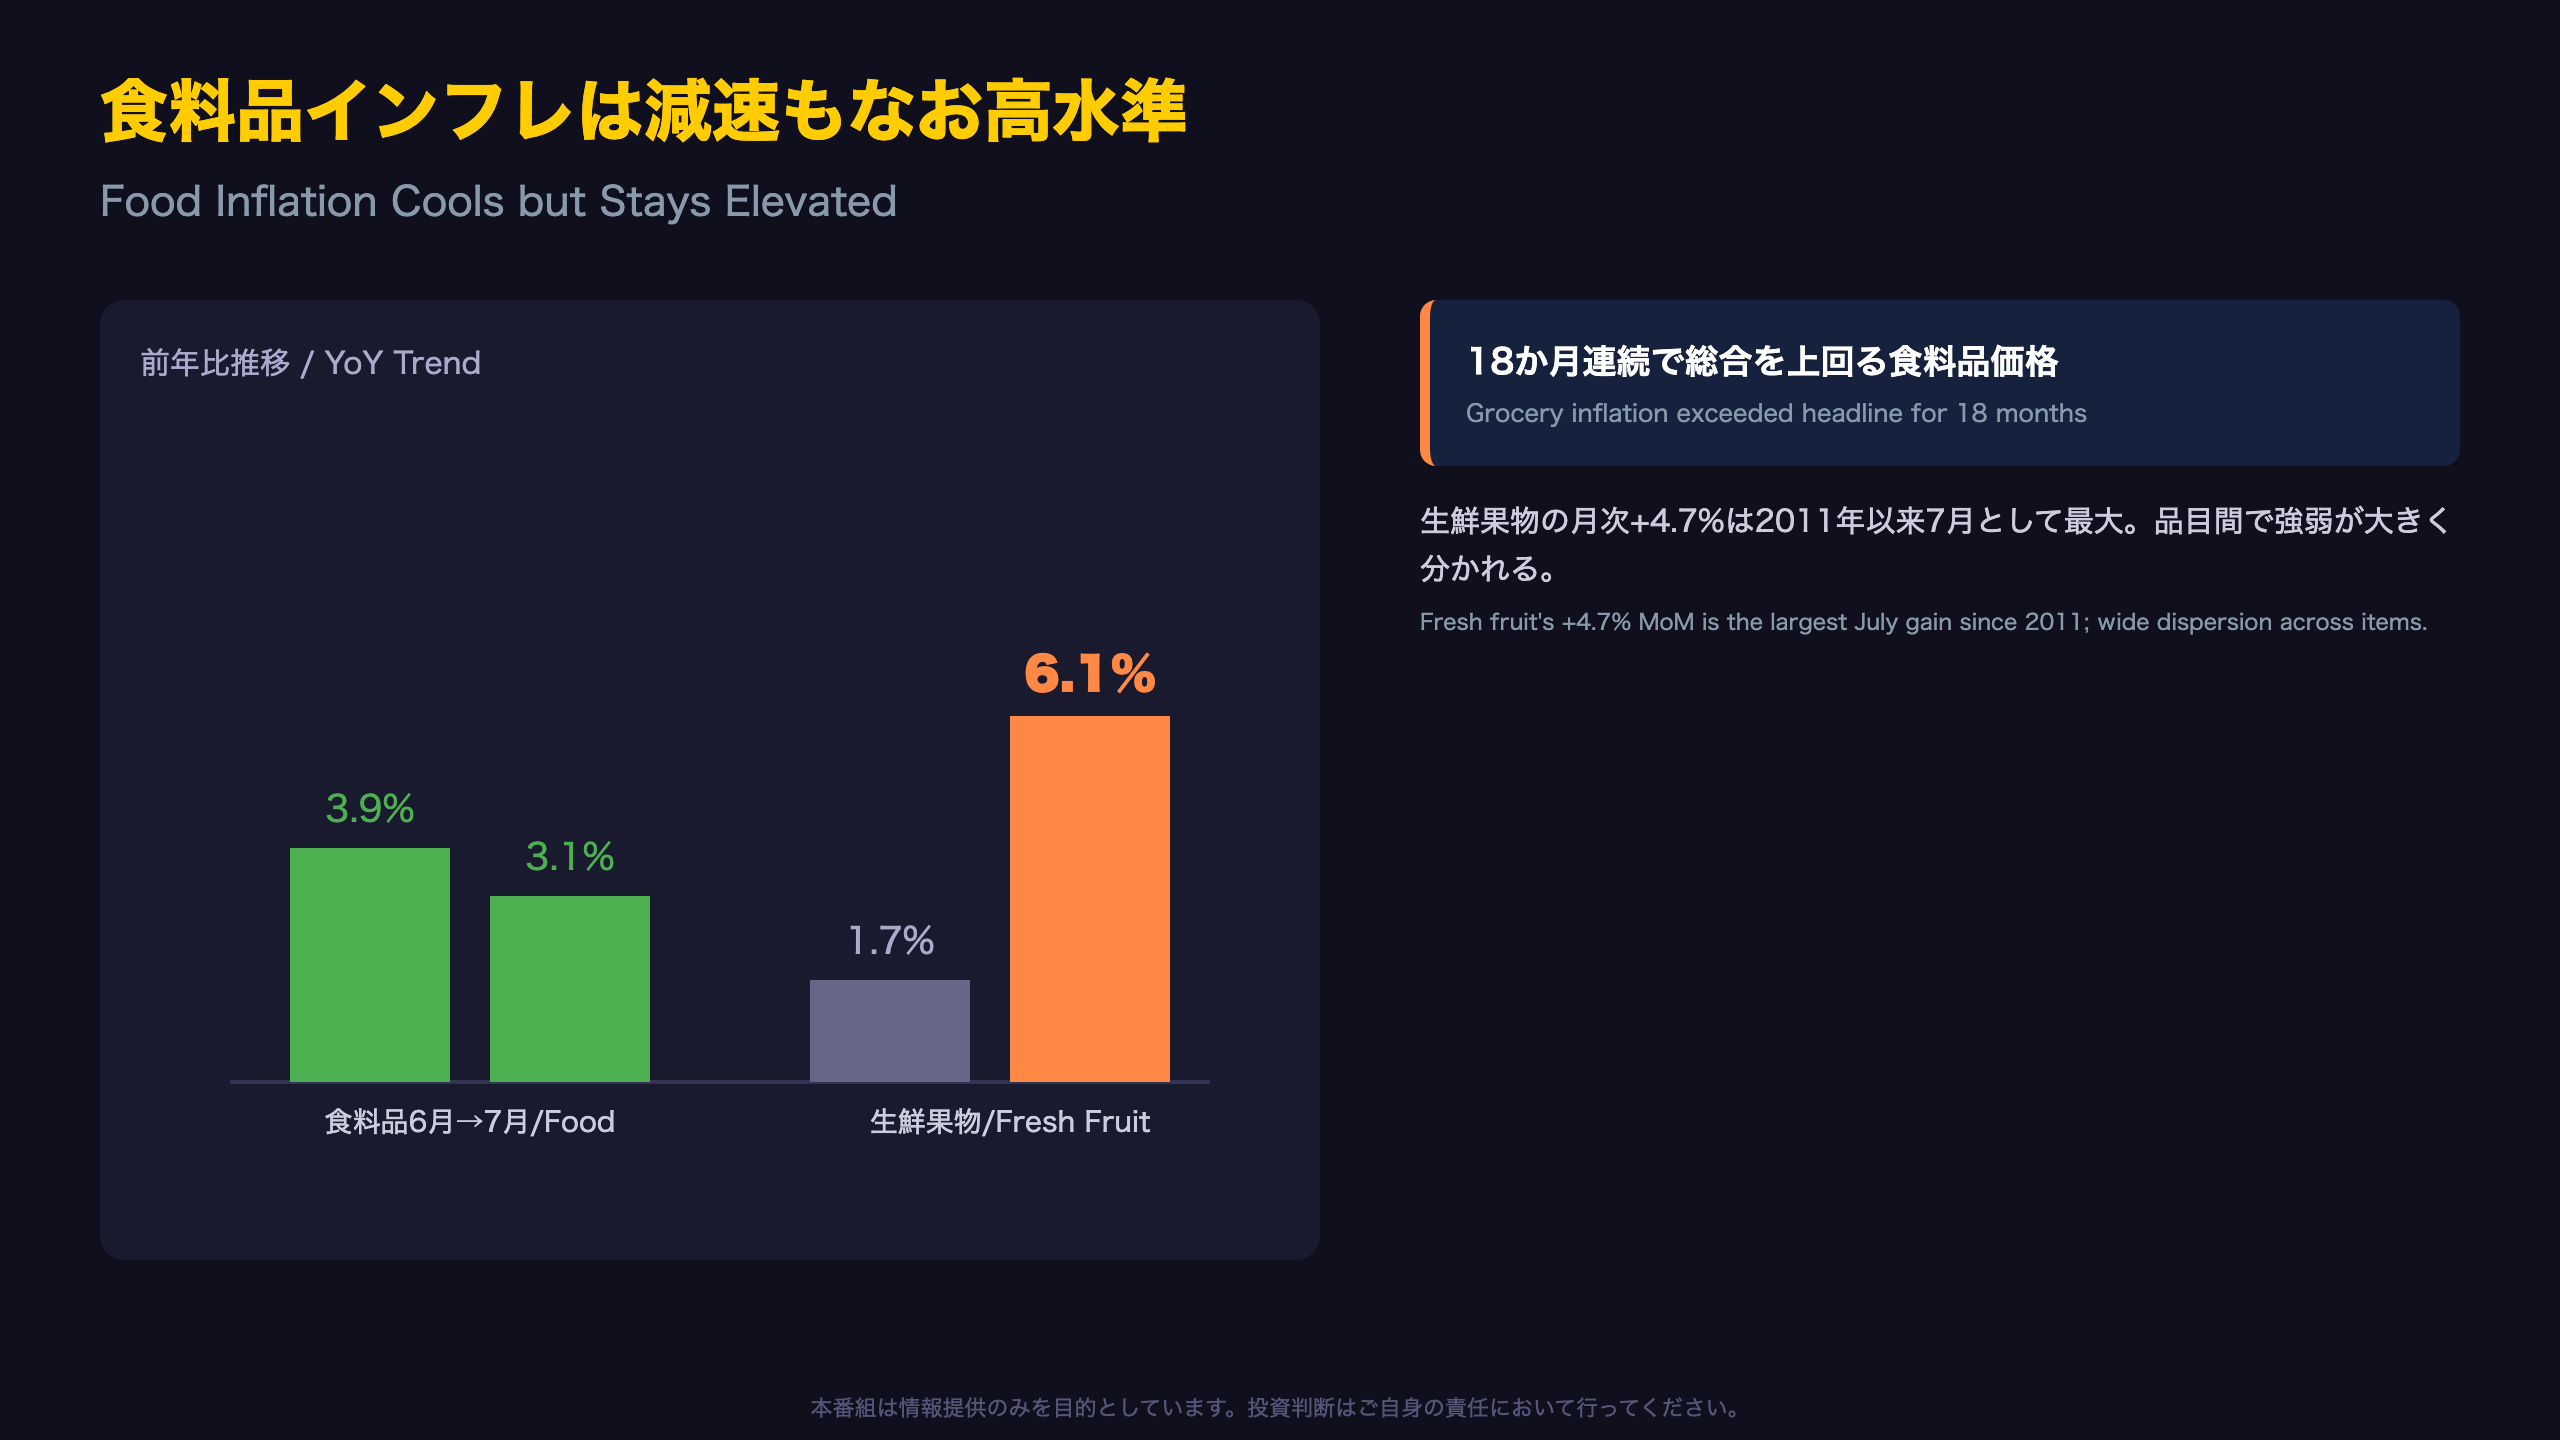
Food purchased from stores rose 3.1% year-over-year, down from 3.9% in June. Yet StatCan noted this was “the 18th consecutive month that grocery price inflation outpaced the all-items CPI”—a streak spanning a year and a half, underscoring persistent cost-of-living pressure at the grocery aisle level for Canadian consumers.
Diverging Sub-Categories
The deceleration was driven by slower price growth in fresh vegetables (+3.9%), fresh or frozen chicken (+0.3%), and an outright decline in cereal products (-1.7%). Offsetting this was a sharp acceleration in fresh fruit prices, which jumped from +1.7% in June to +6.1% in July.
StatCan highlighted that fresh fruit “recorded the highest month-over-month movement for the month of July since 2011, at 4.7%,” driven by higher berry and melon prices—a notably specific and unusual seasonal spike.
Reading the Dispersion
This divergence across food sub-categories suggests that grocery inflation is not moving as a single, uniform block. Factors like weather-driven crop yields, import costs, and seasonal harvest timing appear to be operating simultaneously across different product lines—a pattern similar to how U.S. CPI food-at-home components can show wide dispersion even as the aggregate cools.
Looking Ahead
Given this is single-month data, it remains uncertain whether the fresh fruit surge represents a temporary seasonal spike or a more durable repricing. The August CPI release on September 14 will be the key test of whether this divergence persists or normalizes.
地域間で広がるインフレ格差
Behind the 3.0% National Average: A Regional Divide
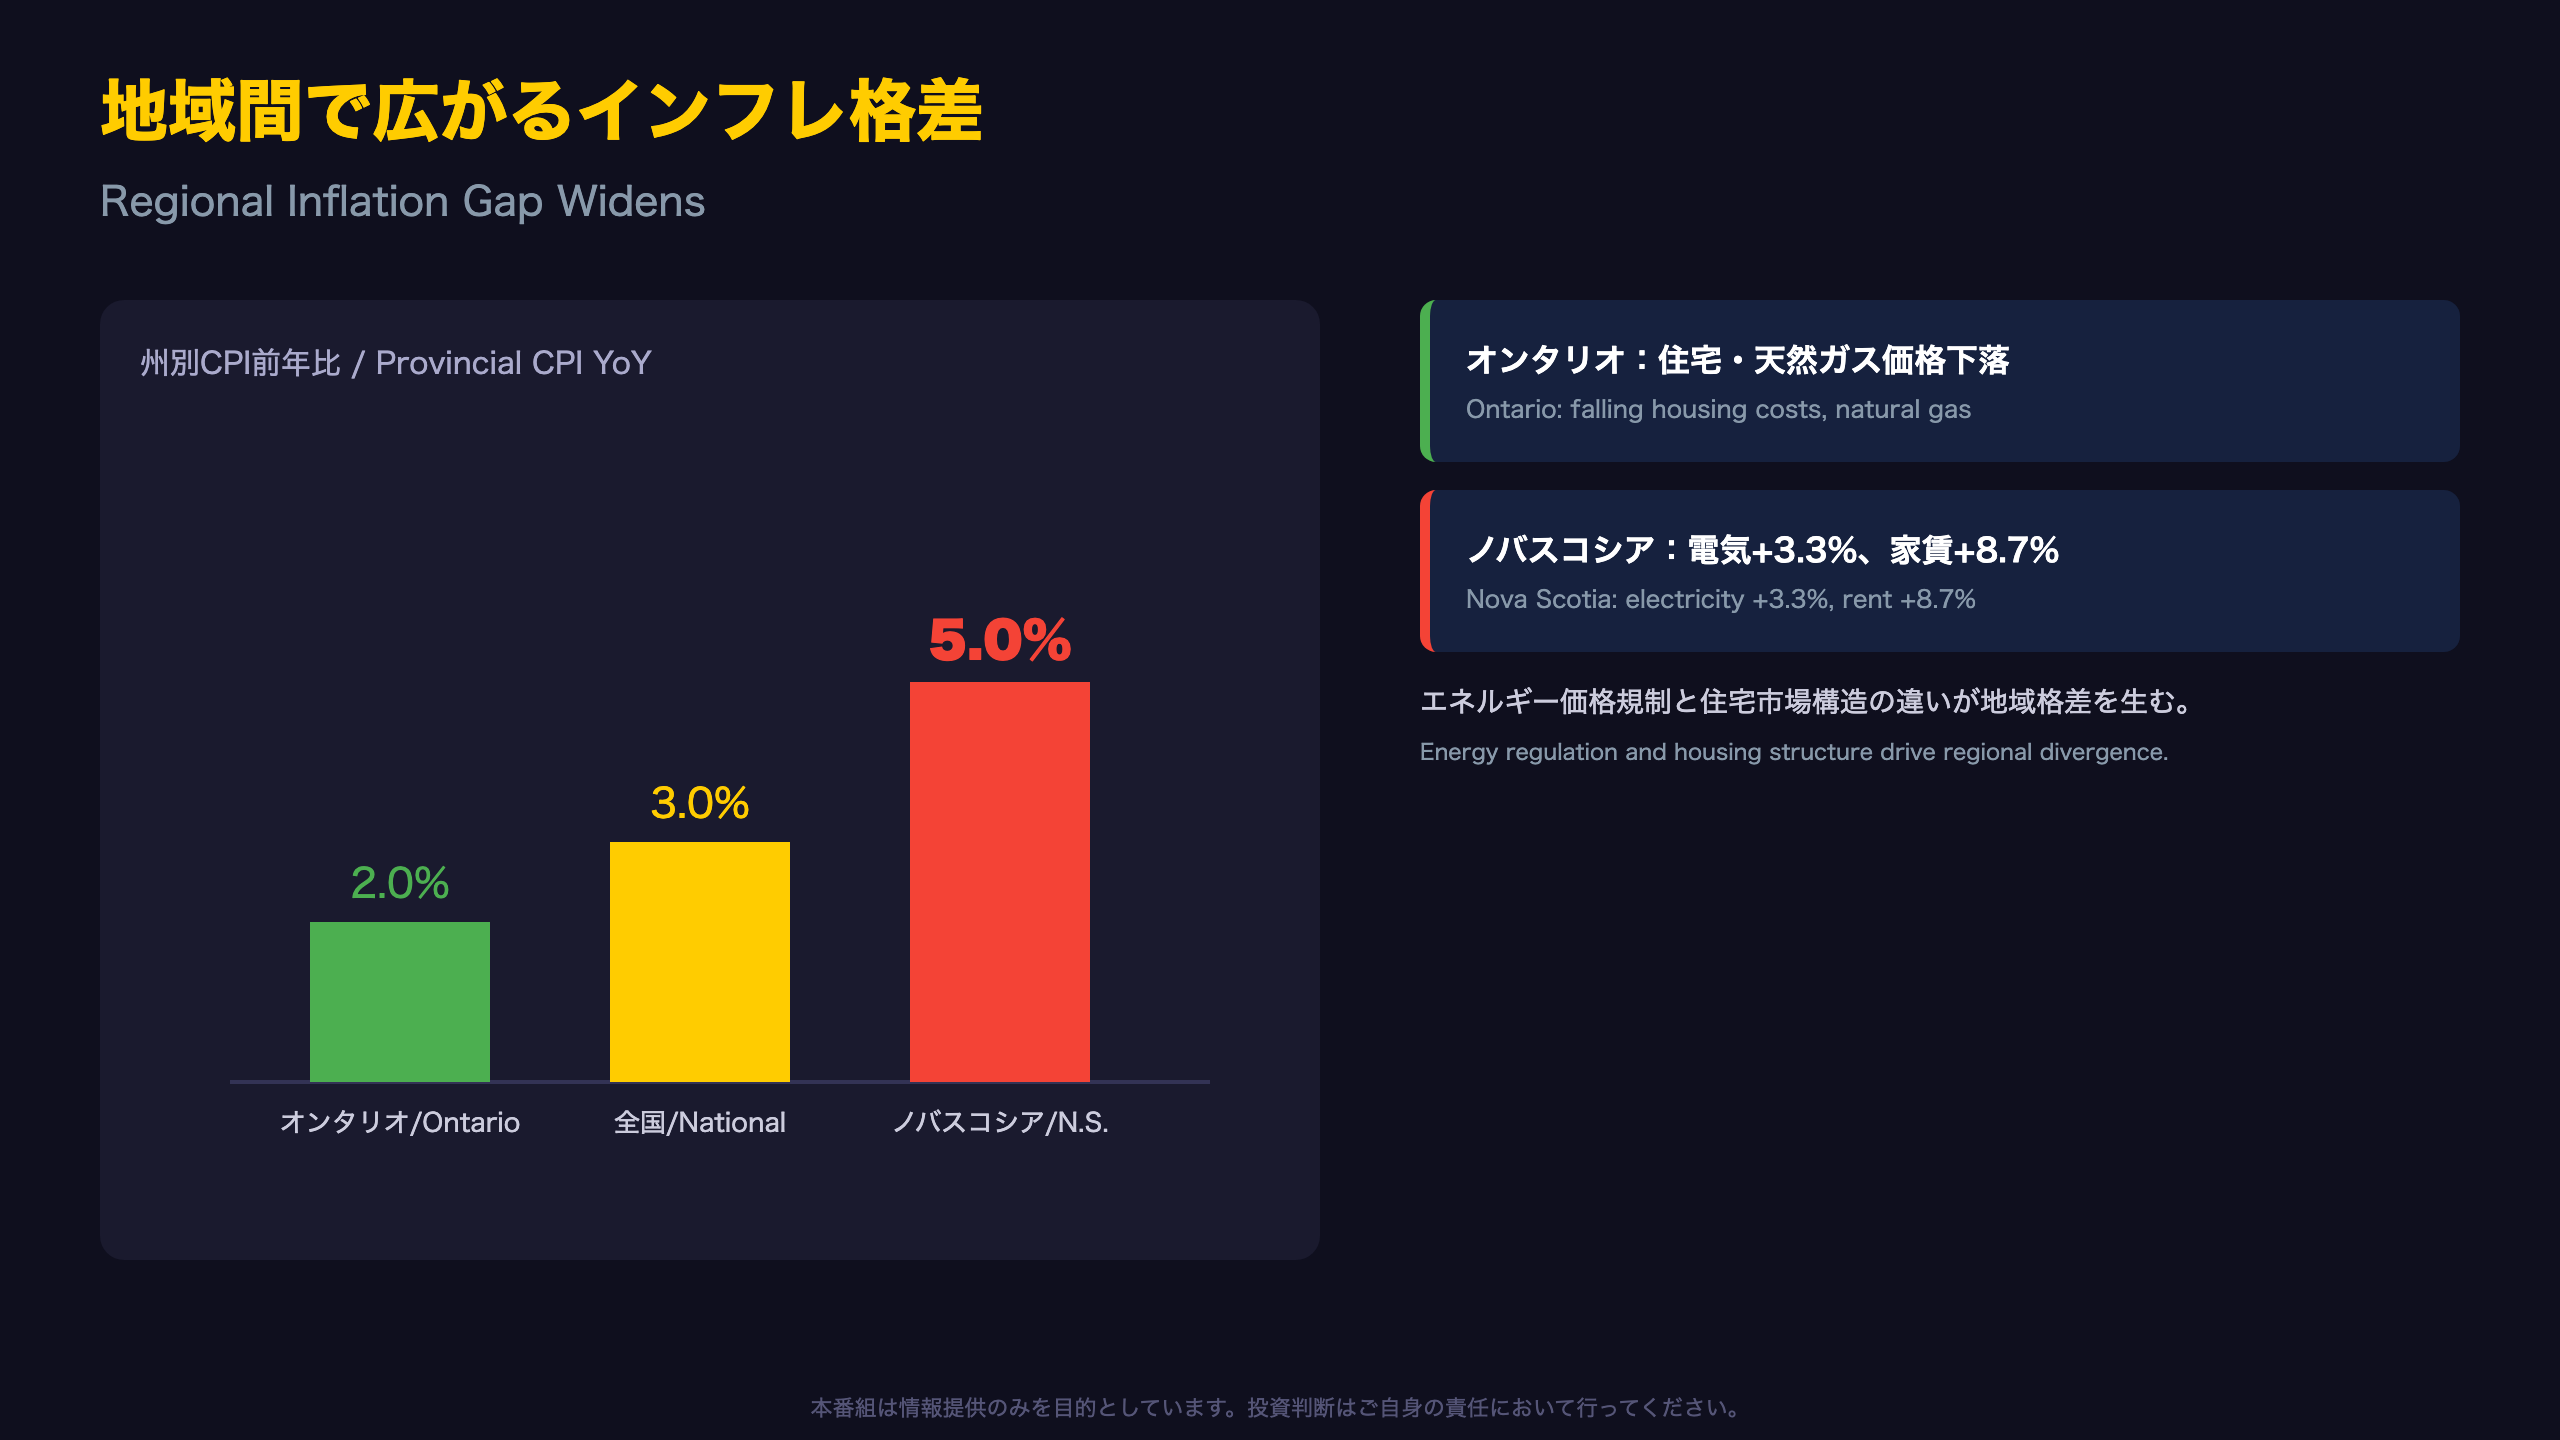
While the national CPI came in at 3.0% for July, provincial breakdowns reveal significant divergence. StatCan noted “prices rose at a faster pace in all provinces in July compared with June, except for Ontario”—making Ontario the sole outlier in an otherwise broad-based acceleration.
Why Ontario Held Flat
Ontario’s CPI remained unchanged at 2.0%, the lowest among all provinces, attributed to “declines in homeowners’ replacement cost (-4.6%) and prices for natural gas (-18.7%).” This combination of falling housing-related costs and cheaper natural gas offset broader inflationary pressures seen elsewhere—a dynamic somewhat comparable to how regional energy price regulation (e.g., utility rate caps) can create divergent CPI outcomes across U.S. states.
Nova Scotia Leads the Pack
Nova Scotia posted the country’s highest provincial inflation rate at 5.0%, driven by “higher prices for electricity (+3.3%) and rent (+8.7%).” These are two core cost-of-living components, and their simultaneous rise points to acute affordability pressure in that province.
New Brunswick similarly accelerated on “higher prices for electricity (+4.4%) and traveller accommodation (+4.5%),” reinforcing a pattern across Atlantic Canada of energy and housing-cost-driven inflation.
Market Takeaway
The roughly 3-point spread between Ontario (2.0%) and Nova Scotia (5.0%) illustrates that a single national CPI print can mask meaningful regional economic divergence—a nuance that matters for regional bond spreads and provincial fiscal planning, even if it has limited direct bearing on national BOC policy, which targets the aggregate figure.
BOC政策への示唆とCADの行方
A Data Gap at a Critical Moment
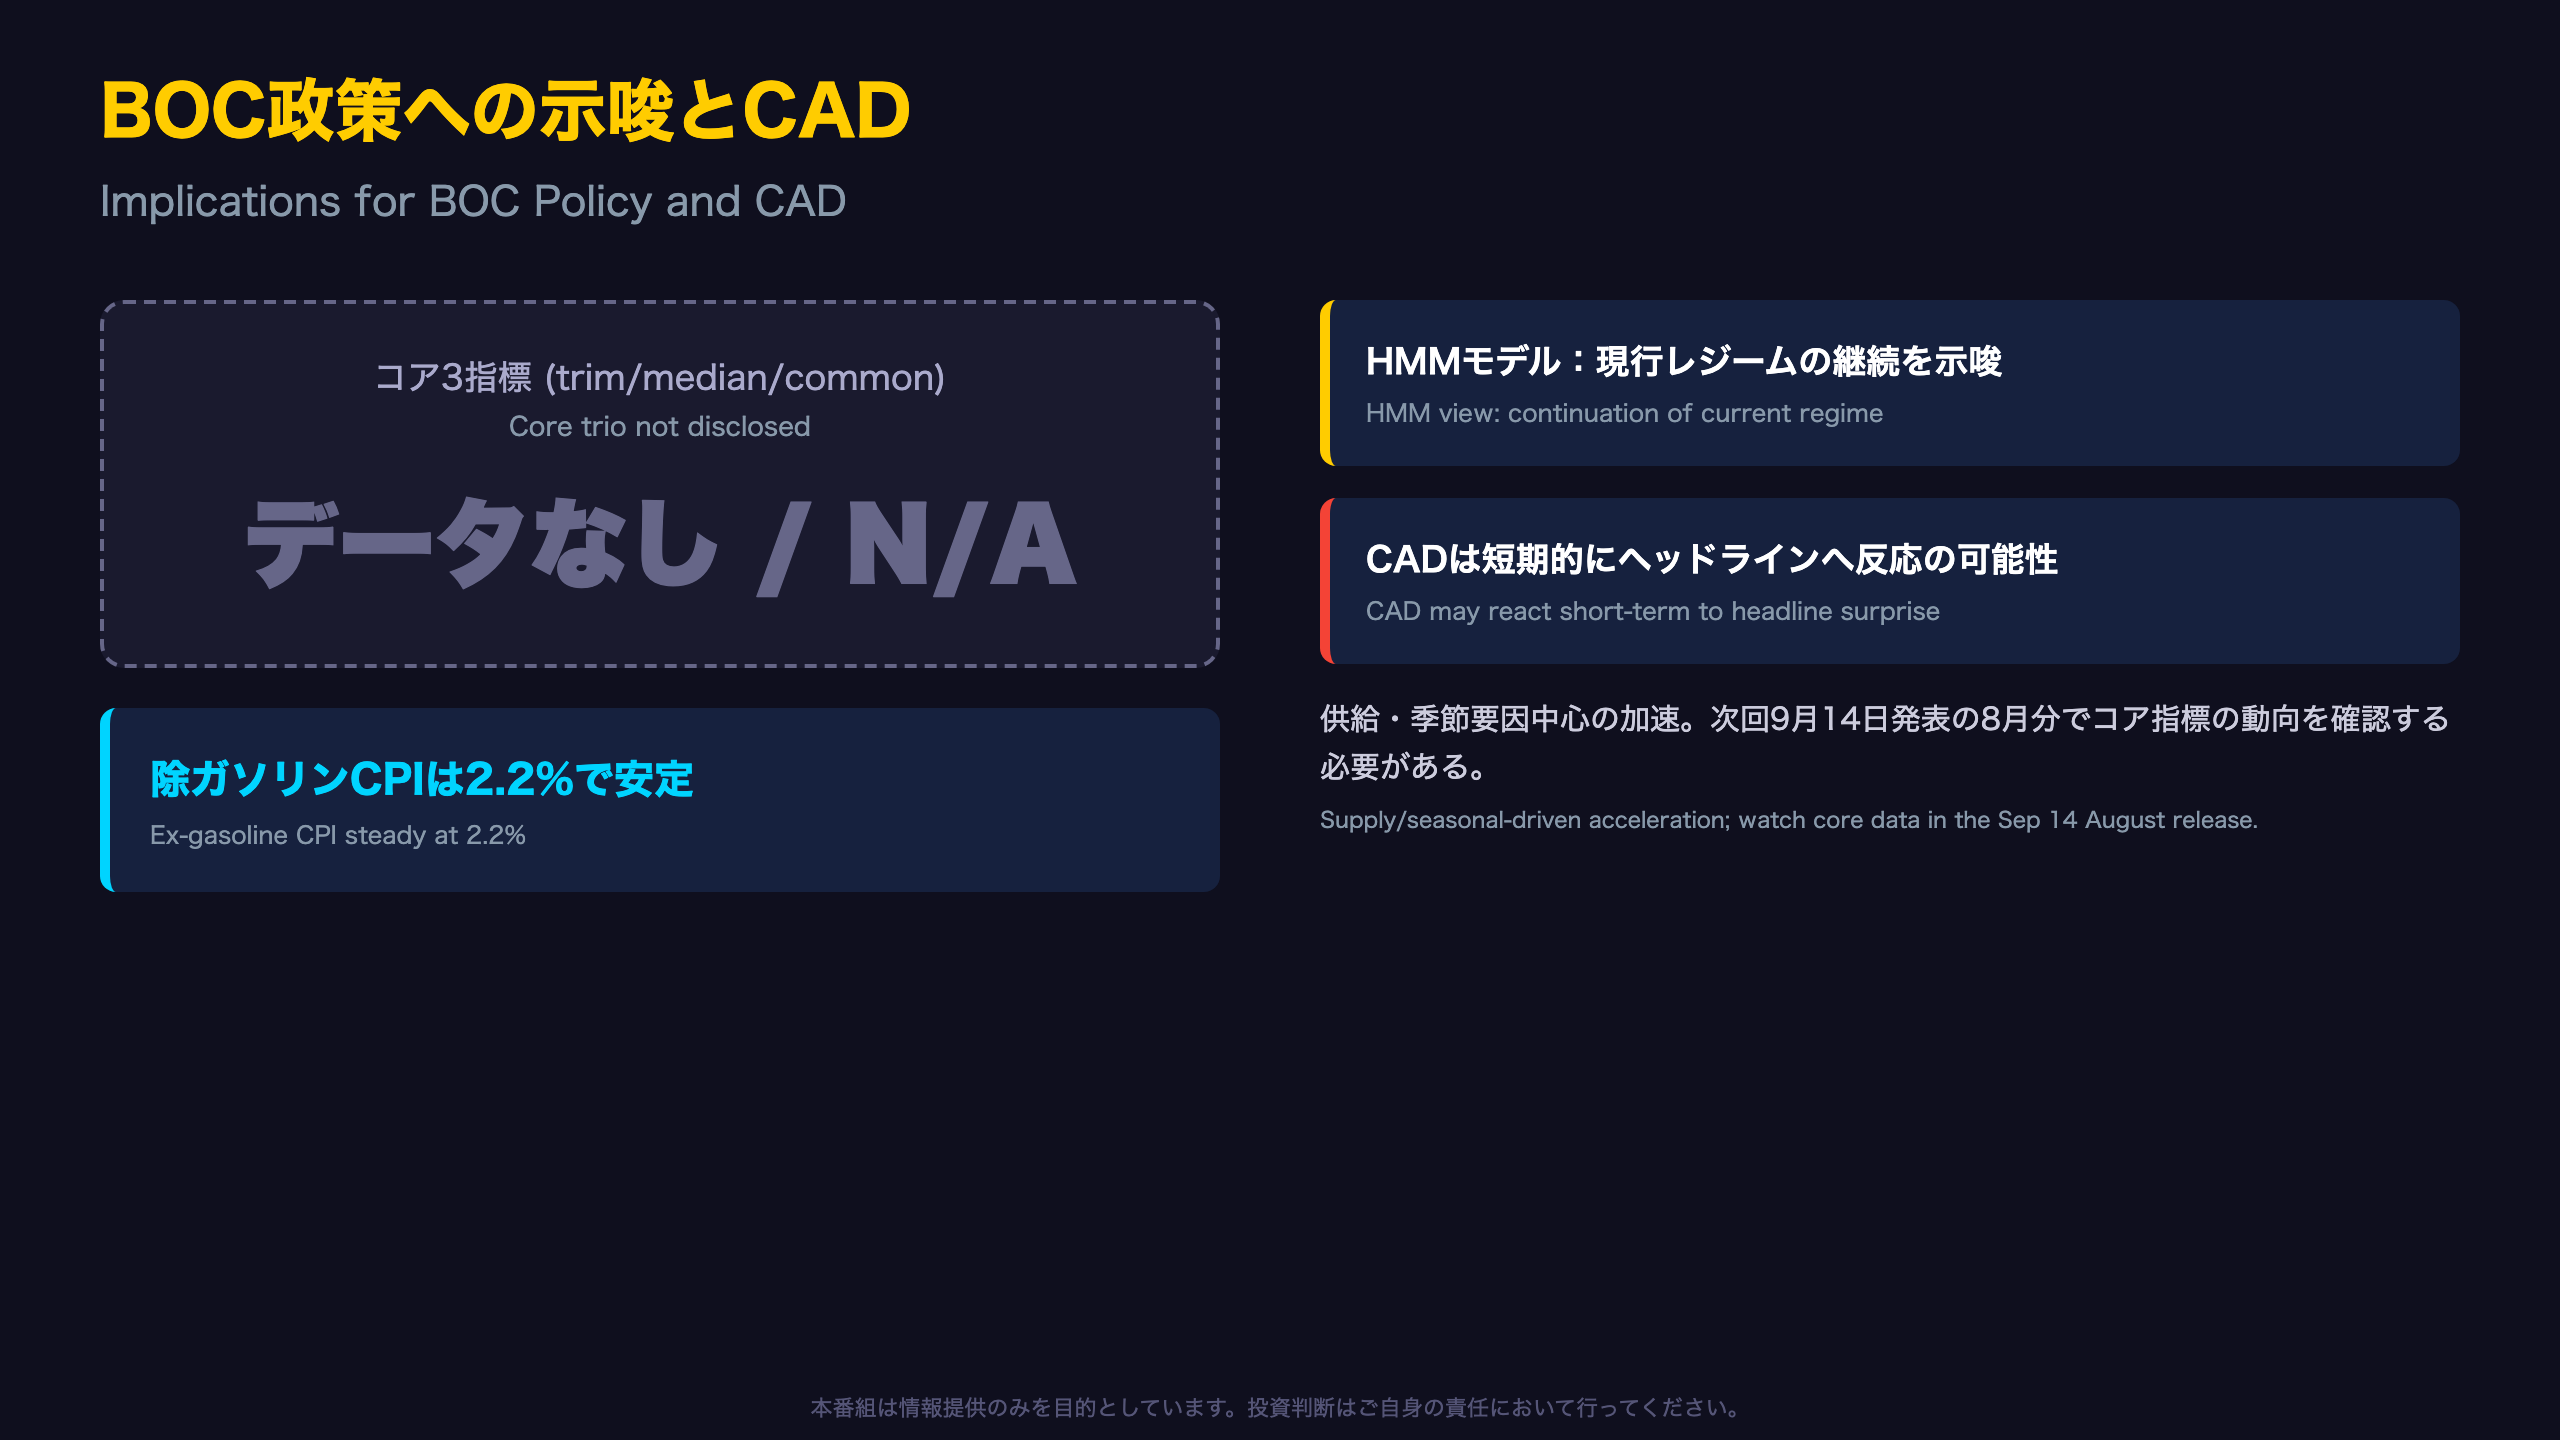
This CPI release did not include specific values for the Bank of Canada’s three preferred core inflation measures—CPI-trim, CPI-median, and CPI-common—within the narrative text, even though a dedicated data table (Table 4) is referenced. This is a notable gap for market participants trying to gauge underlying inflation momentum.
The Chain of Evidence
Headline CPI accelerated to 3.0% → driven primarily by gasoline (+25.7%) and travel tours (+15.2%), both supply-side and seasonal/event-driven factors → it is generally believed that supply-shock-driven price increases don’t necessarily prompt immediate central bank action, though this single data release cannot determine the BOC’s next move with certainty.
Ex-gasoline CPI held at 2.2% for three consecutive months → this suggests underlying price pressure has not shifted materially → however, this measure is a proxy, not a substitute for BOC’s own core trio, which use distinct trimming and weighting methodologies analogous to how the Fed’s trimmed-mean PCE differs from headline PCE.
HMM Regime-Tracking Perspective
Viewed as an observation variable for a hidden Markov model tracking BOC policy stance, this release offers limited evidence of a regime transition. The headline volatility is largely explainable by supply-side factors, suggesting continuation of the current policy regime rather than a clear hawkish or dovish pivot signal.
Implications for CAD
The gasoline-driven headline surprise could trigger short-term CAD volatility, but the absence of core inflation data reduces confidence in any trend-based interpretation. The next data point to watch is the August CPI release on September 14, when the BOC’s core trio values should provide a clearer read on underlying inflation momentum and the associated policy path.
Disclaimer: This article is for informational purposes only. All investment decisions are made solely at your own risk.







