
📺 Watch the Full Video Analysis
This article was automatically generated by the NFC Market Live AI analysis system. (Updated: 2026-08-15 07:10 JST)
📄 Primary Source
米国労働省(DOL)— 新規失業保険申請件数
https://www.dol.gov/newsroom/releases/eta/eta20260813
米国エネルギー情報局(EIA)— 週間石油状況レポート
https://www.eia.gov/petroleum/supply/weekly/pdf/highlights.pdf
連邦準備制度理事会(FRB)— H.4.1 バランスシート
https://www.federalreserve.gov/releases/h41/current/h41.htm
This week’s US macro cross-check 📊
🧑💼 DOL Jobless Claims: 209K (+9K WoW), but the 4-week average held near cycle lows at 199K
🛢️ EIA Weekly Petroleum: Crude stocks jumped 17.4M bbl, WTI fell to $79.77, yet retail gasoline stayed +28.5% YoY
🏦 Fed H.4.1: Total assets grew +$116B YoY even as reserve balances fell -$376B YoY and the RRP buffer nearly drained
Three signals, three different directions. We break down what it means for market liquidity and what to watch next week.
今週のアルティメット・サマリー
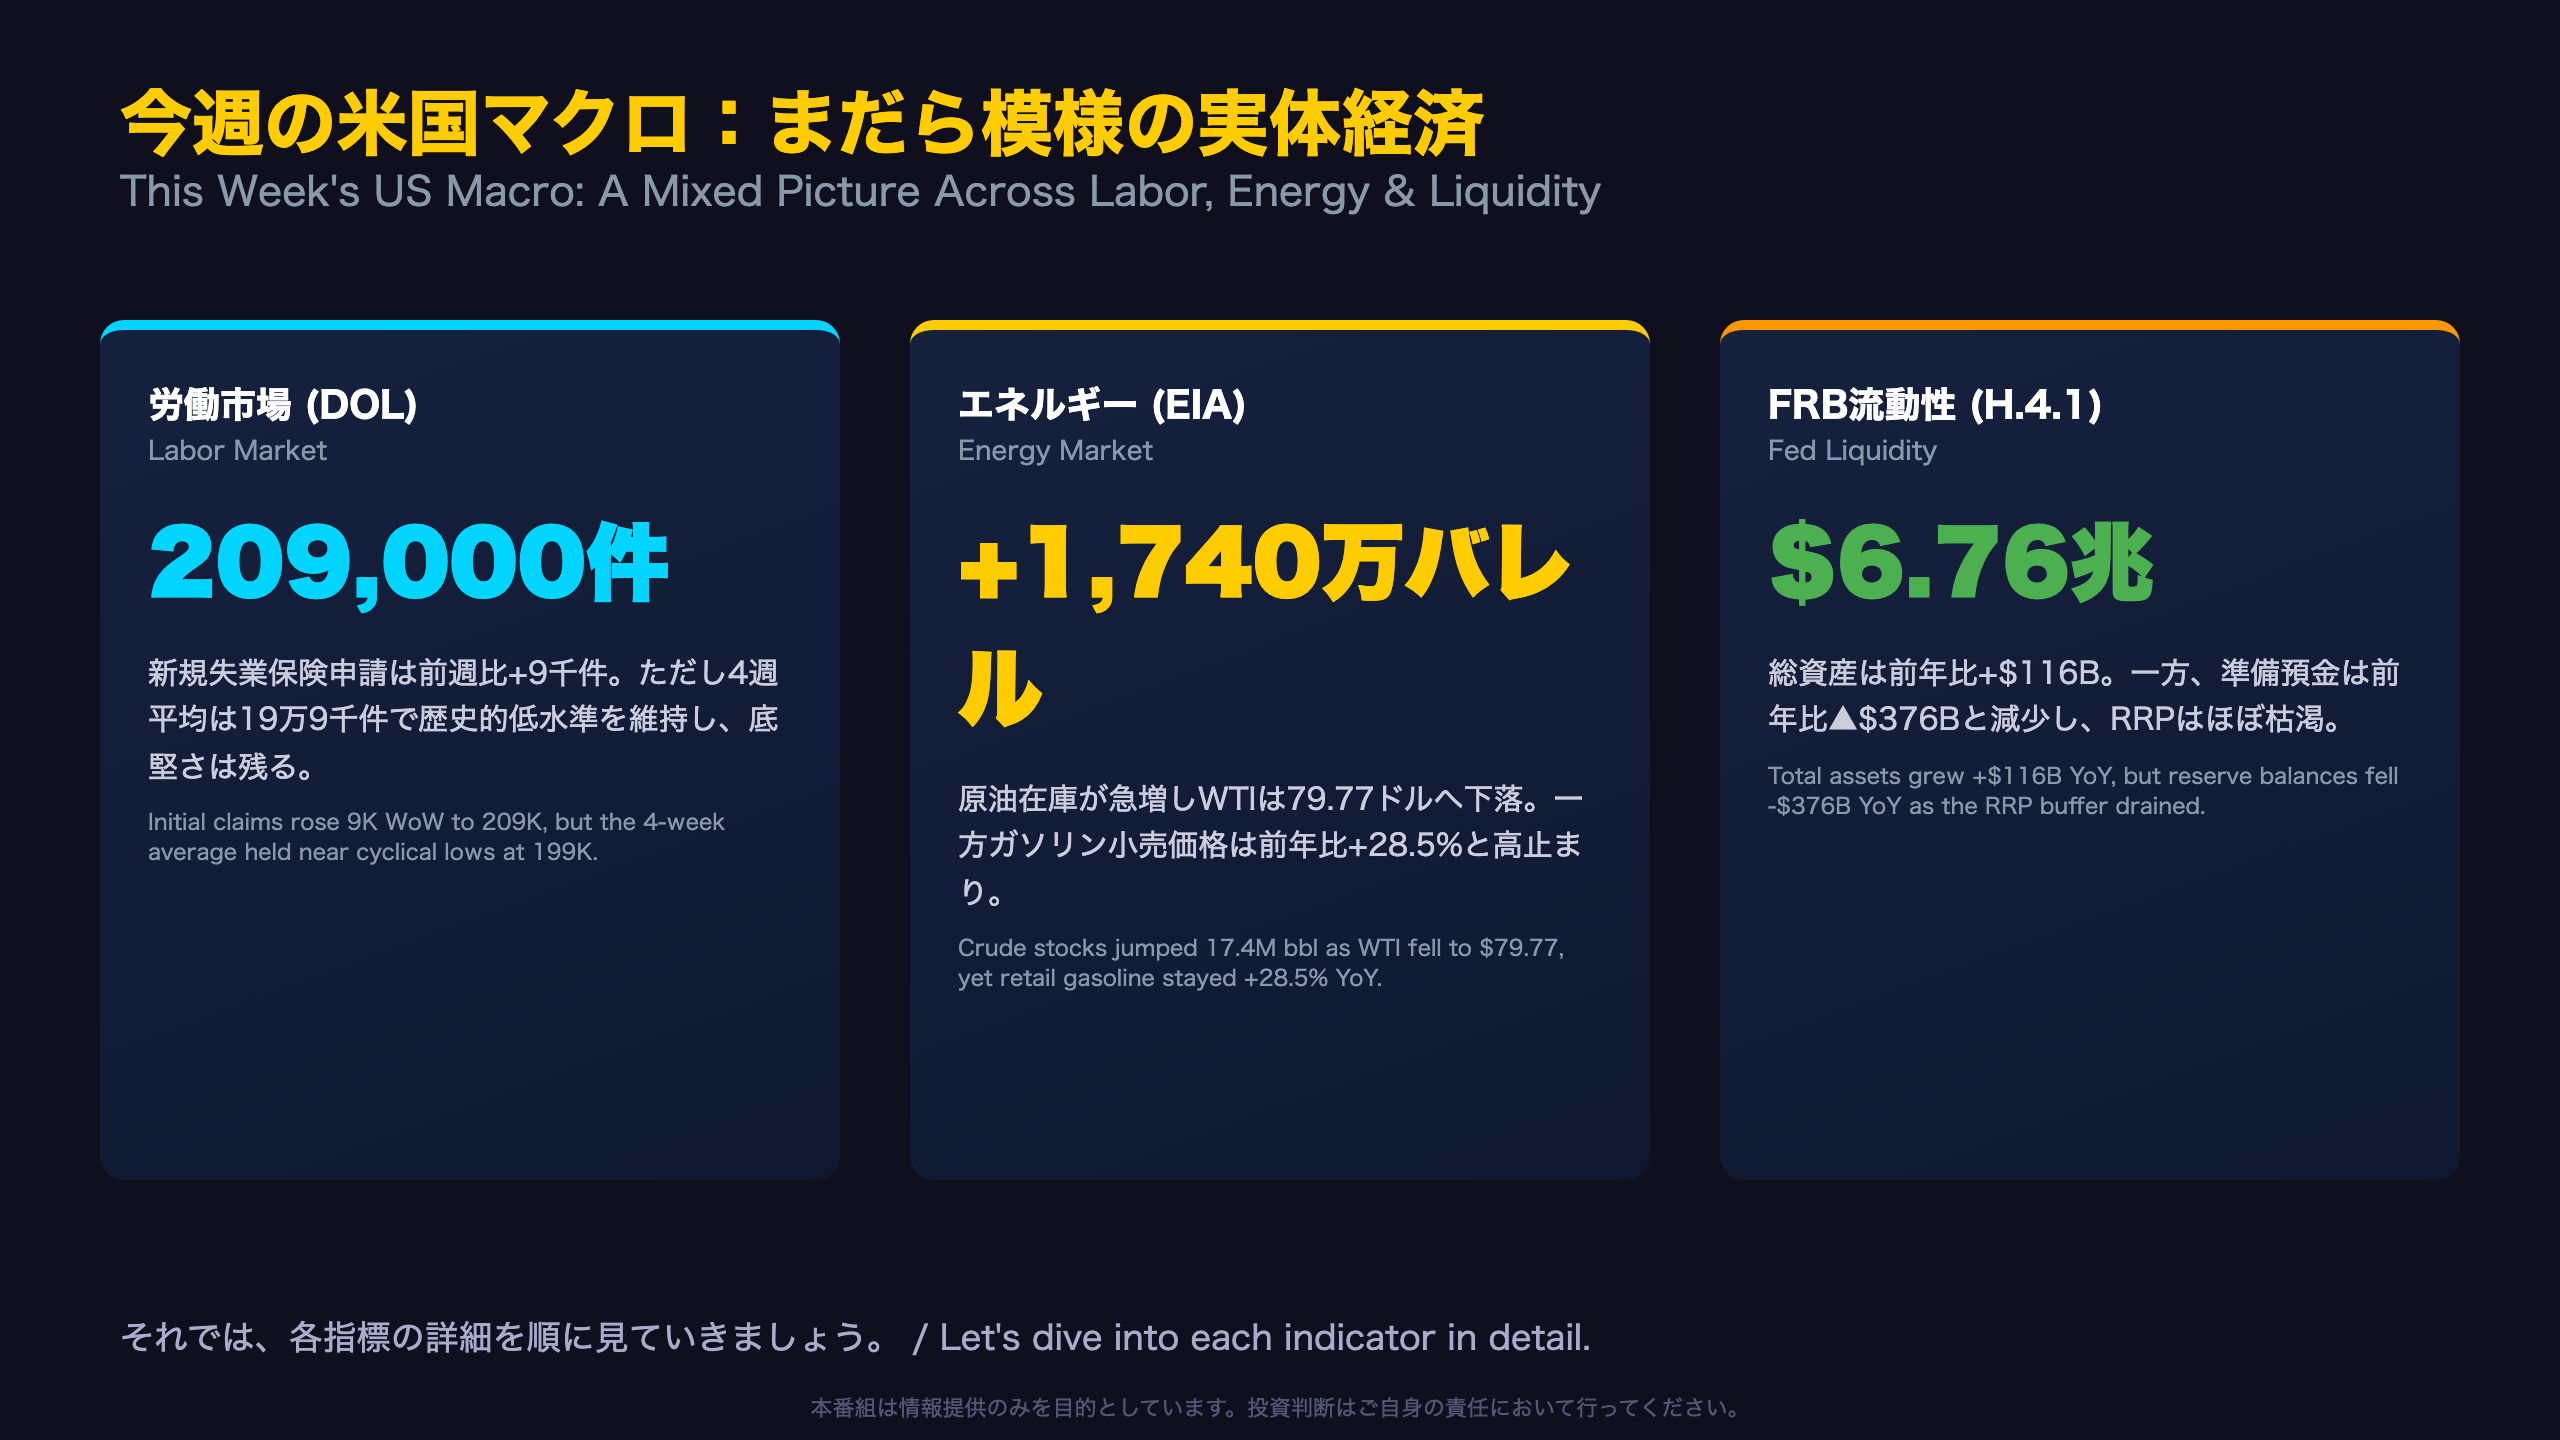
This Week’s Snapshot
The week of August 13, 2026 brought three key US data releases covering labor (DOL), energy (EIA), and financial system liquidity (Federal Reserve H.4.1). None individually delivered a major surprise, but layered together they reveal an economy pulling in different directions at once.
Why Cross-Reference Three Reports?
Each release captures a different facet of the economic cycle. The Department of Labor (DOL) issues weekly jobless claims as a leading labor market indicator. The Energy Information Administration (EIA), part of the US Department of Energy, tracks crude and refined product supply/demand weekly. The Federal Reserve’s H.4.1 report details the central bank’s balance sheet, the plumbing behind US dollar liquidity. When all three align, the macro signal strengthens; when they diverge, as this week, it suggests a transitional or mixed-signal phase.
The standout data point: total Fed assets rose +$116 billion year-over-year, implying quantitative tightening (QT) has effectively stalled, while bank reserve balances, the actual liquidity available in the banking system, fell -$376 billion over the same period. This gap between headline balance sheet size and usable reserves is this week’s most important nuance for market watchers.
Looking Ahead
Next week’s jobless claims release and the ongoing weekly Fed balance sheet data will help clarify whether this divergence is transient noise or the start of a more persistent liquidity tightening trend relevant to money-market and repo conditions.
労働市場の現在地(DOL 新規失業保険申請)
Behind the Numbers: A Pace That Outran Seasonal Expectations
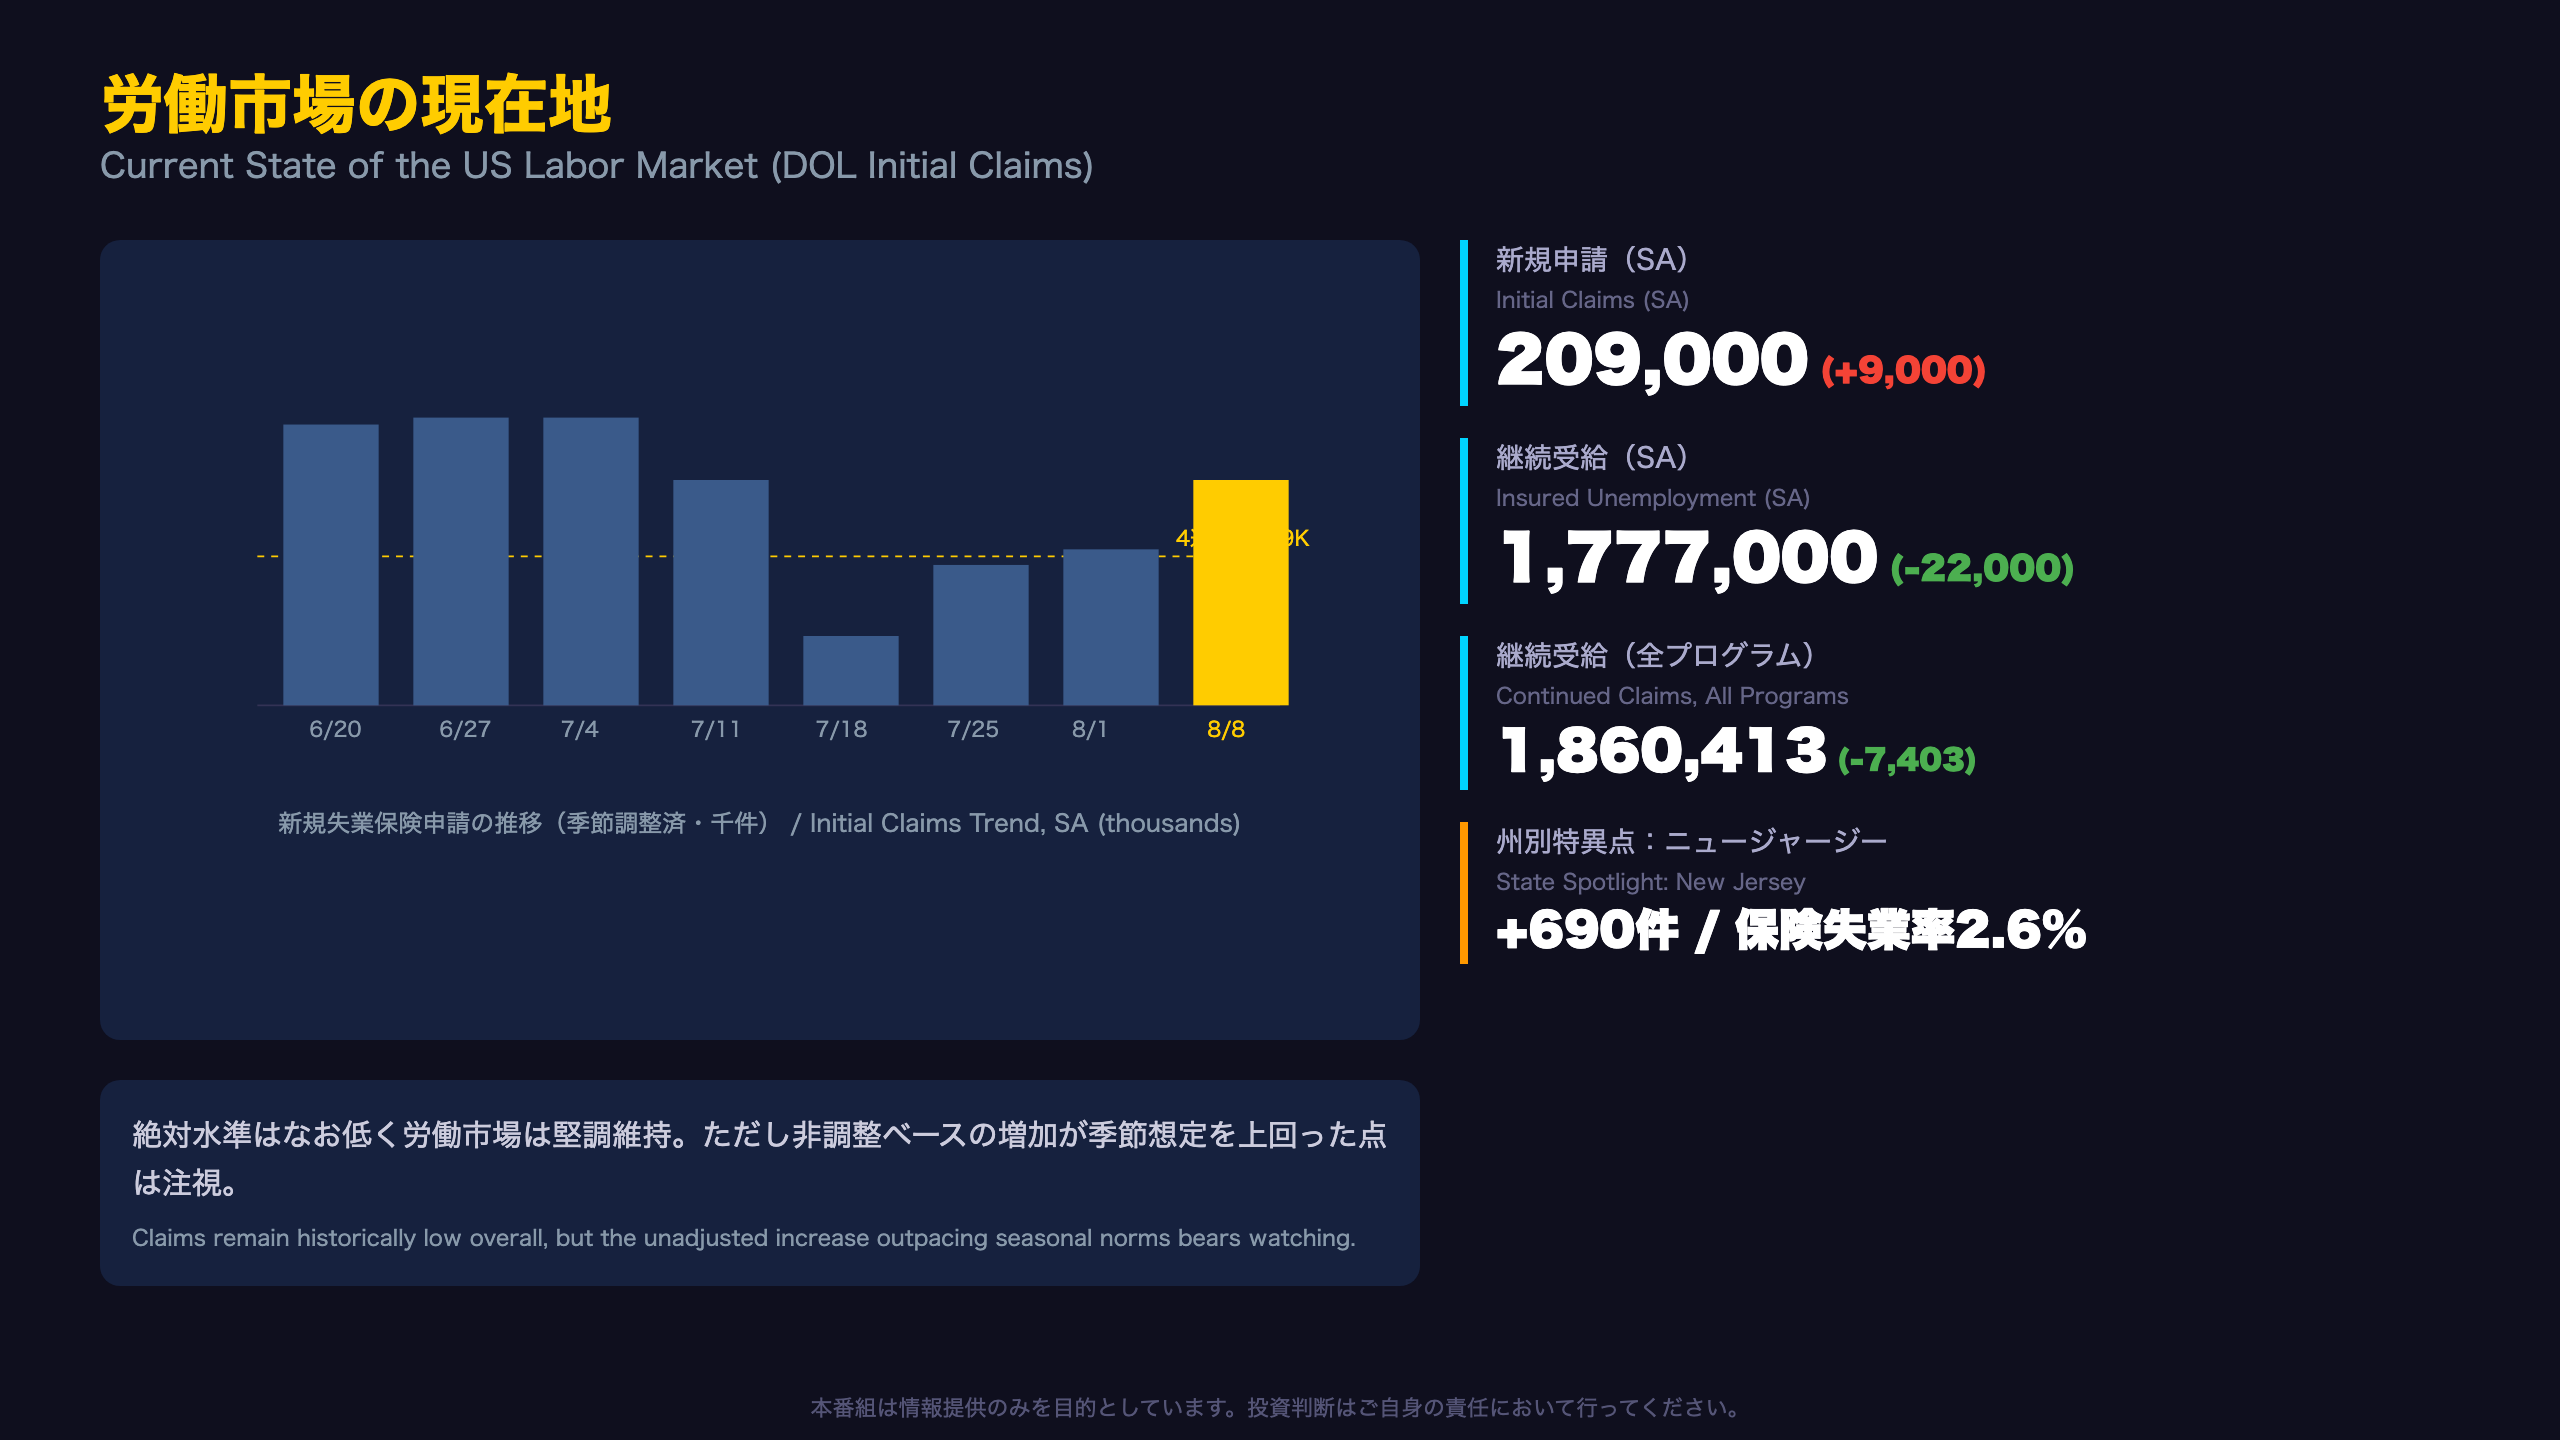
Unadjusted initial claims rose 14,437 (+8.4%) week-over-week, well above the seasonal factor’s expected increase of just 3.7%. This gap between actual and seasonally-expected moves is worth monitoring, though a single week’s deviation should not be read as a structural trend on its own.
What the DOL Release Actually Measures
For readers unfamiliar with the US Department of Labor’s (DOL) weekly release: “initial claims” count new applications for unemployment benefits (a leading indicator), while “continuing claims” (insured unemployment) count people still receiving benefits (a lagging/coincident indicator that reflects how long it takes laid-off workers to find new jobs).
Continuing Claims Signal
Continuing claims fell to 1,777,000, with the 4-week average easing to 1,785,500 from 1,790,750 the prior week. This gradual downward drift suggests no rapid acceleration in long-term unemployment duration risk at this stage.
State-Level Divergence
New Jersey (+690) and Pennsylvania (+688) posted the largest state-level increases in initial claims, while California (-973) and Illinois (-761) posted the largest declines — indicating the changes are regionally concentrated rather than broad-based national deterioration.
What to Watch Next
The key threshold for next week: does the 4-week average decisively break above 200K, or does it revert back toward the 189K-199K range seen since mid-July? That will help distinguish noise from an emerging trend, relevant for Fed officials watching labor slack.
エネルギー需給の現在地(EIA 週間石油統計)
Behind the Inventory Surge: A One-Week Import Spike
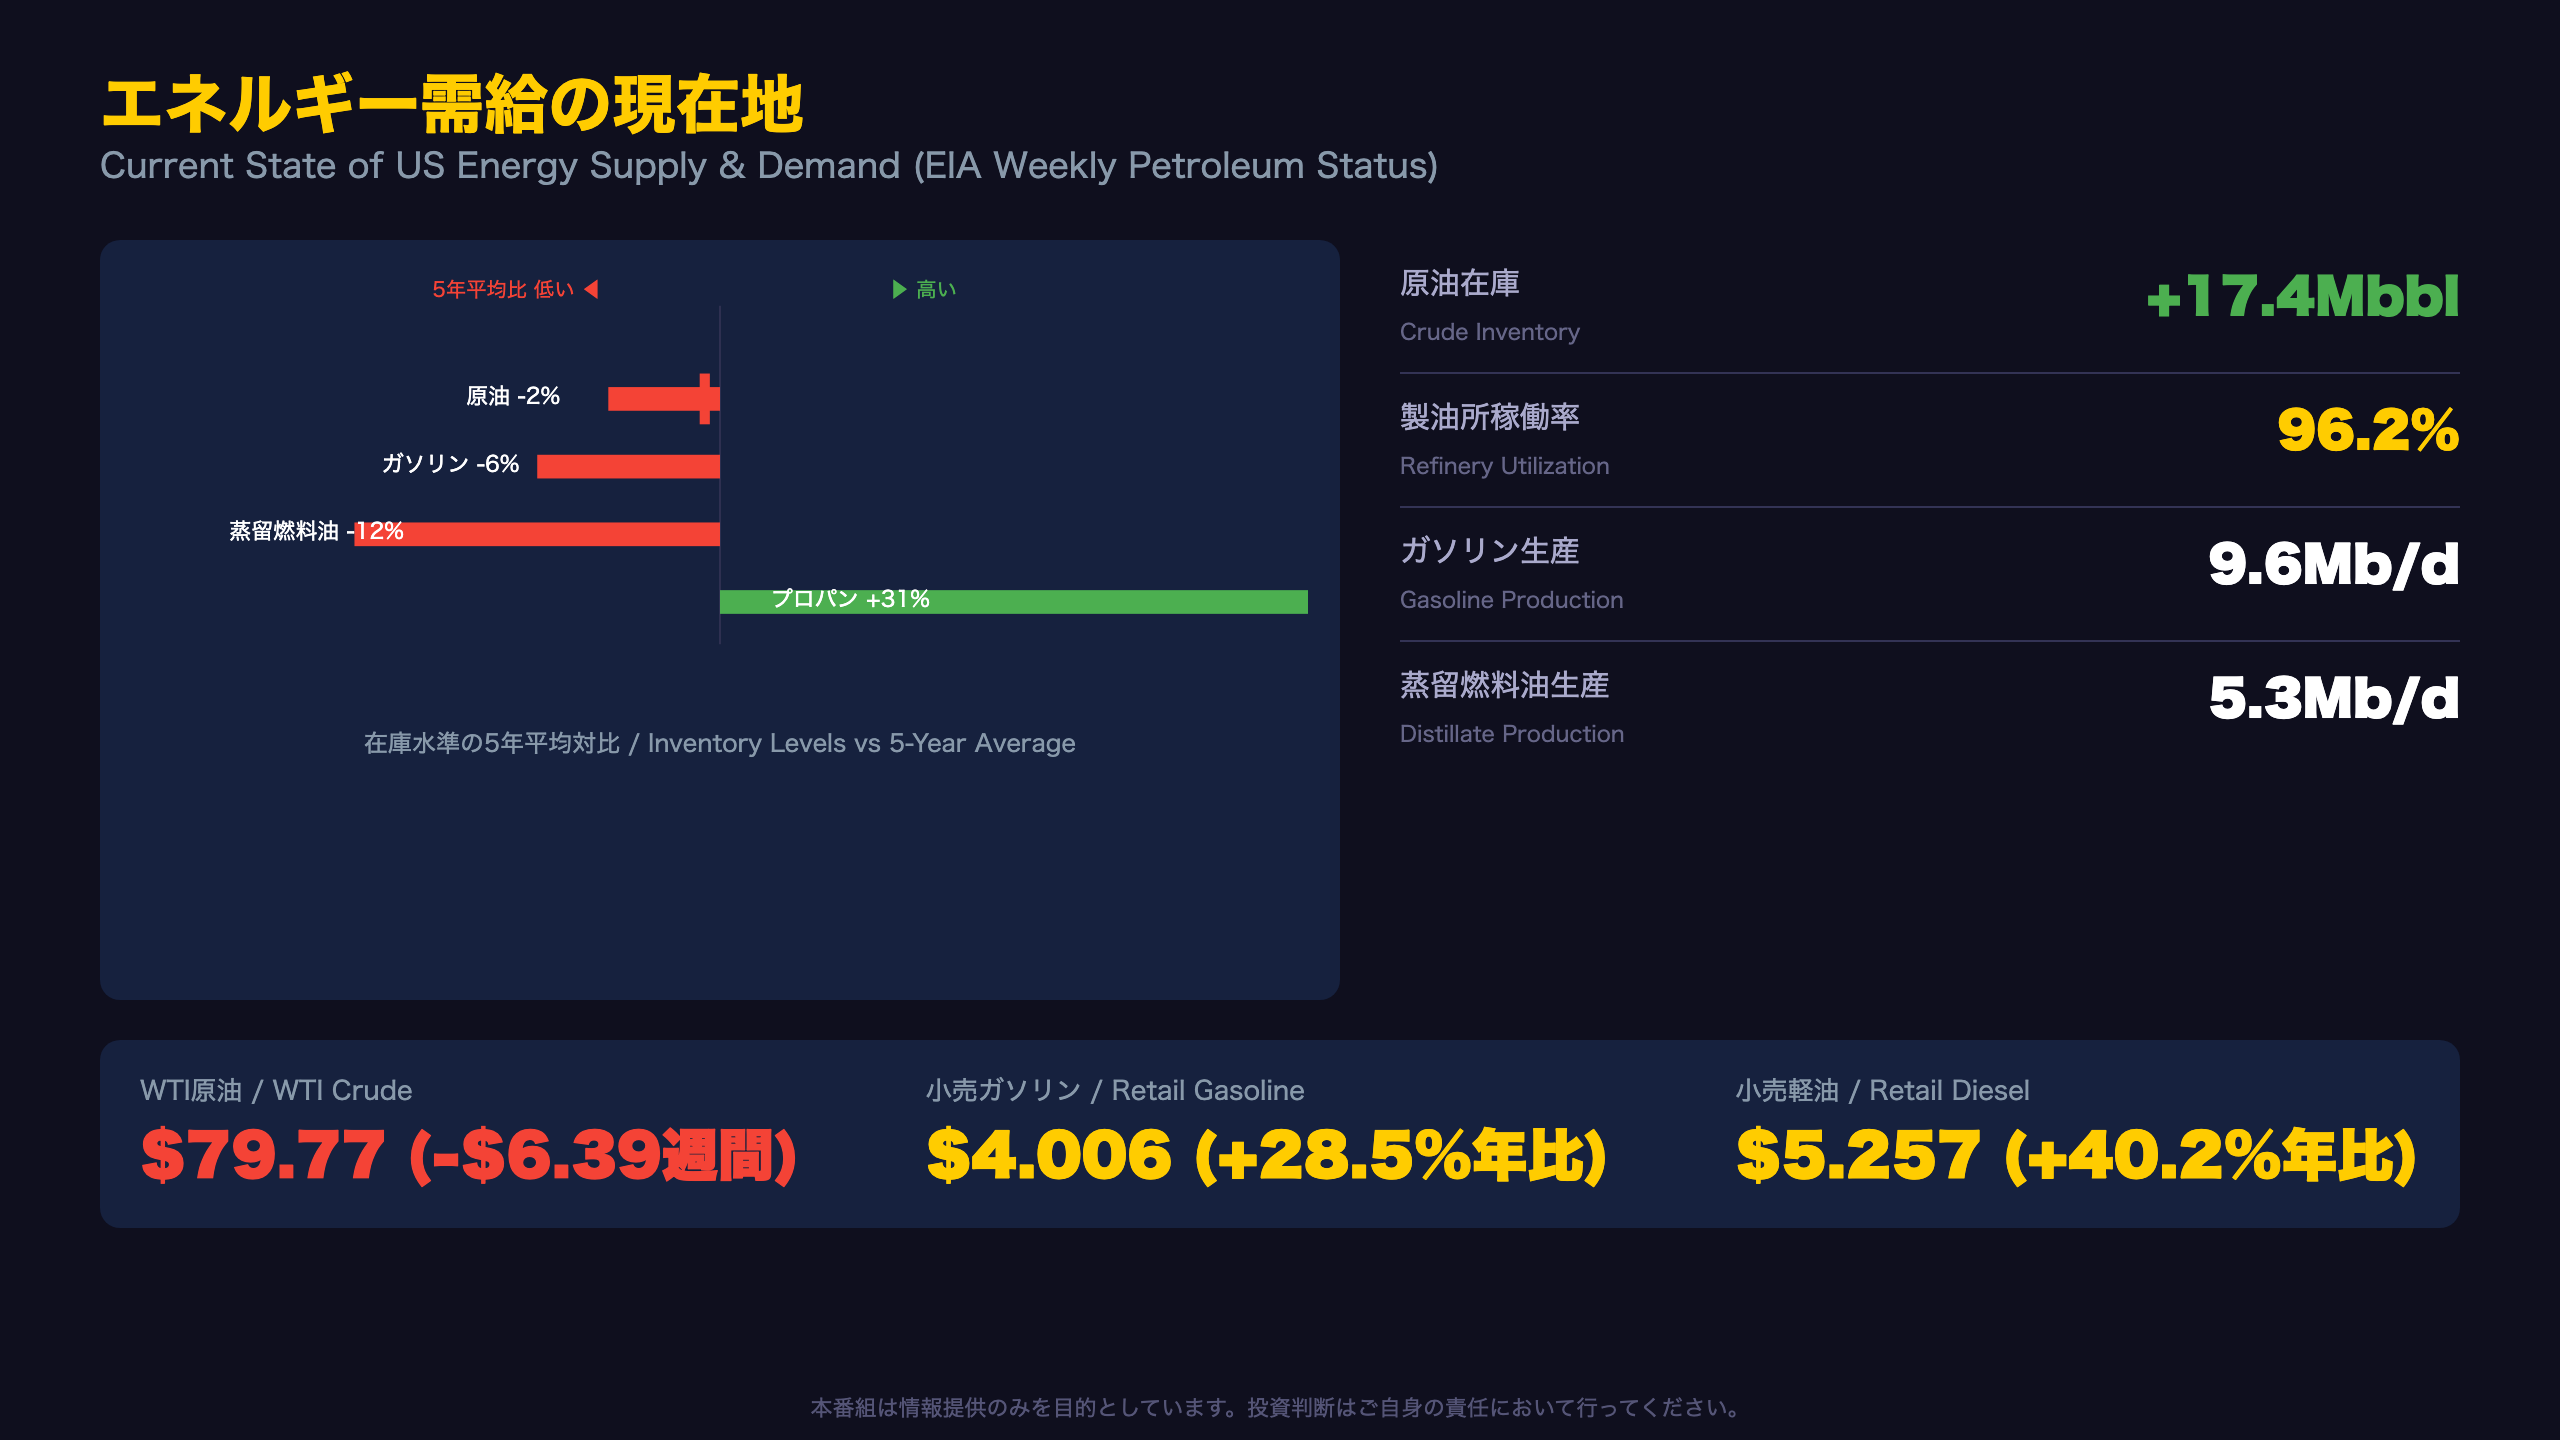
This week’s 17.4-million-barrel crude build was driven primarily by a sharp jump in imports, which the EIA states rose to “7.3 million barrels per day last week, increased by 1.14 million barrels per day from the previous week.” This looks like a one-off shipping/timing effect rather than a structural demand shift, and should not be read as a sudden change in underlying US oil demand.
Context for International Readers
The EIA (Energy Information Administration), a statistical agency under the US Department of Energy, publishes this Weekly Petroleum Status Report every Wednesday. It’s the primary high-frequency gauge of US oil supply/demand balances that global oil traders watch, comparable in market significance to OPEC’s monthly reports for global supply data.
A Two-Speed Demand Picture
Over the trailing 4 weeks, total products supplied fell 2.1% year-over-year, but this masks divergence: distillate fuel demand rose 1.9% YoY and jet fuel rose 3.8% YoY, while gasoline demand slipped only 0.5% YoY. This suggests industrial/aviation-linked demand is outperforming pure consumer driving demand.
The Price Duality
WTI crude fell $6.39 this week to $79.77, and wholesale gasoline spot prices eased too. Yet retail prices remain sharply elevated year-over-year: gasoline +28.5% YoY, diesel +40.2% YoY. For US CPI watchers, this base-effect gap means near-term crude softness may not immediately translate into cooler headline energy inflation prints, a nuance relevant for Fed policy expectations and Treasury market pricing.
FRB流動性の現在地(H.4.1 バランスシート)
What the Composition Shift Reveals About QT
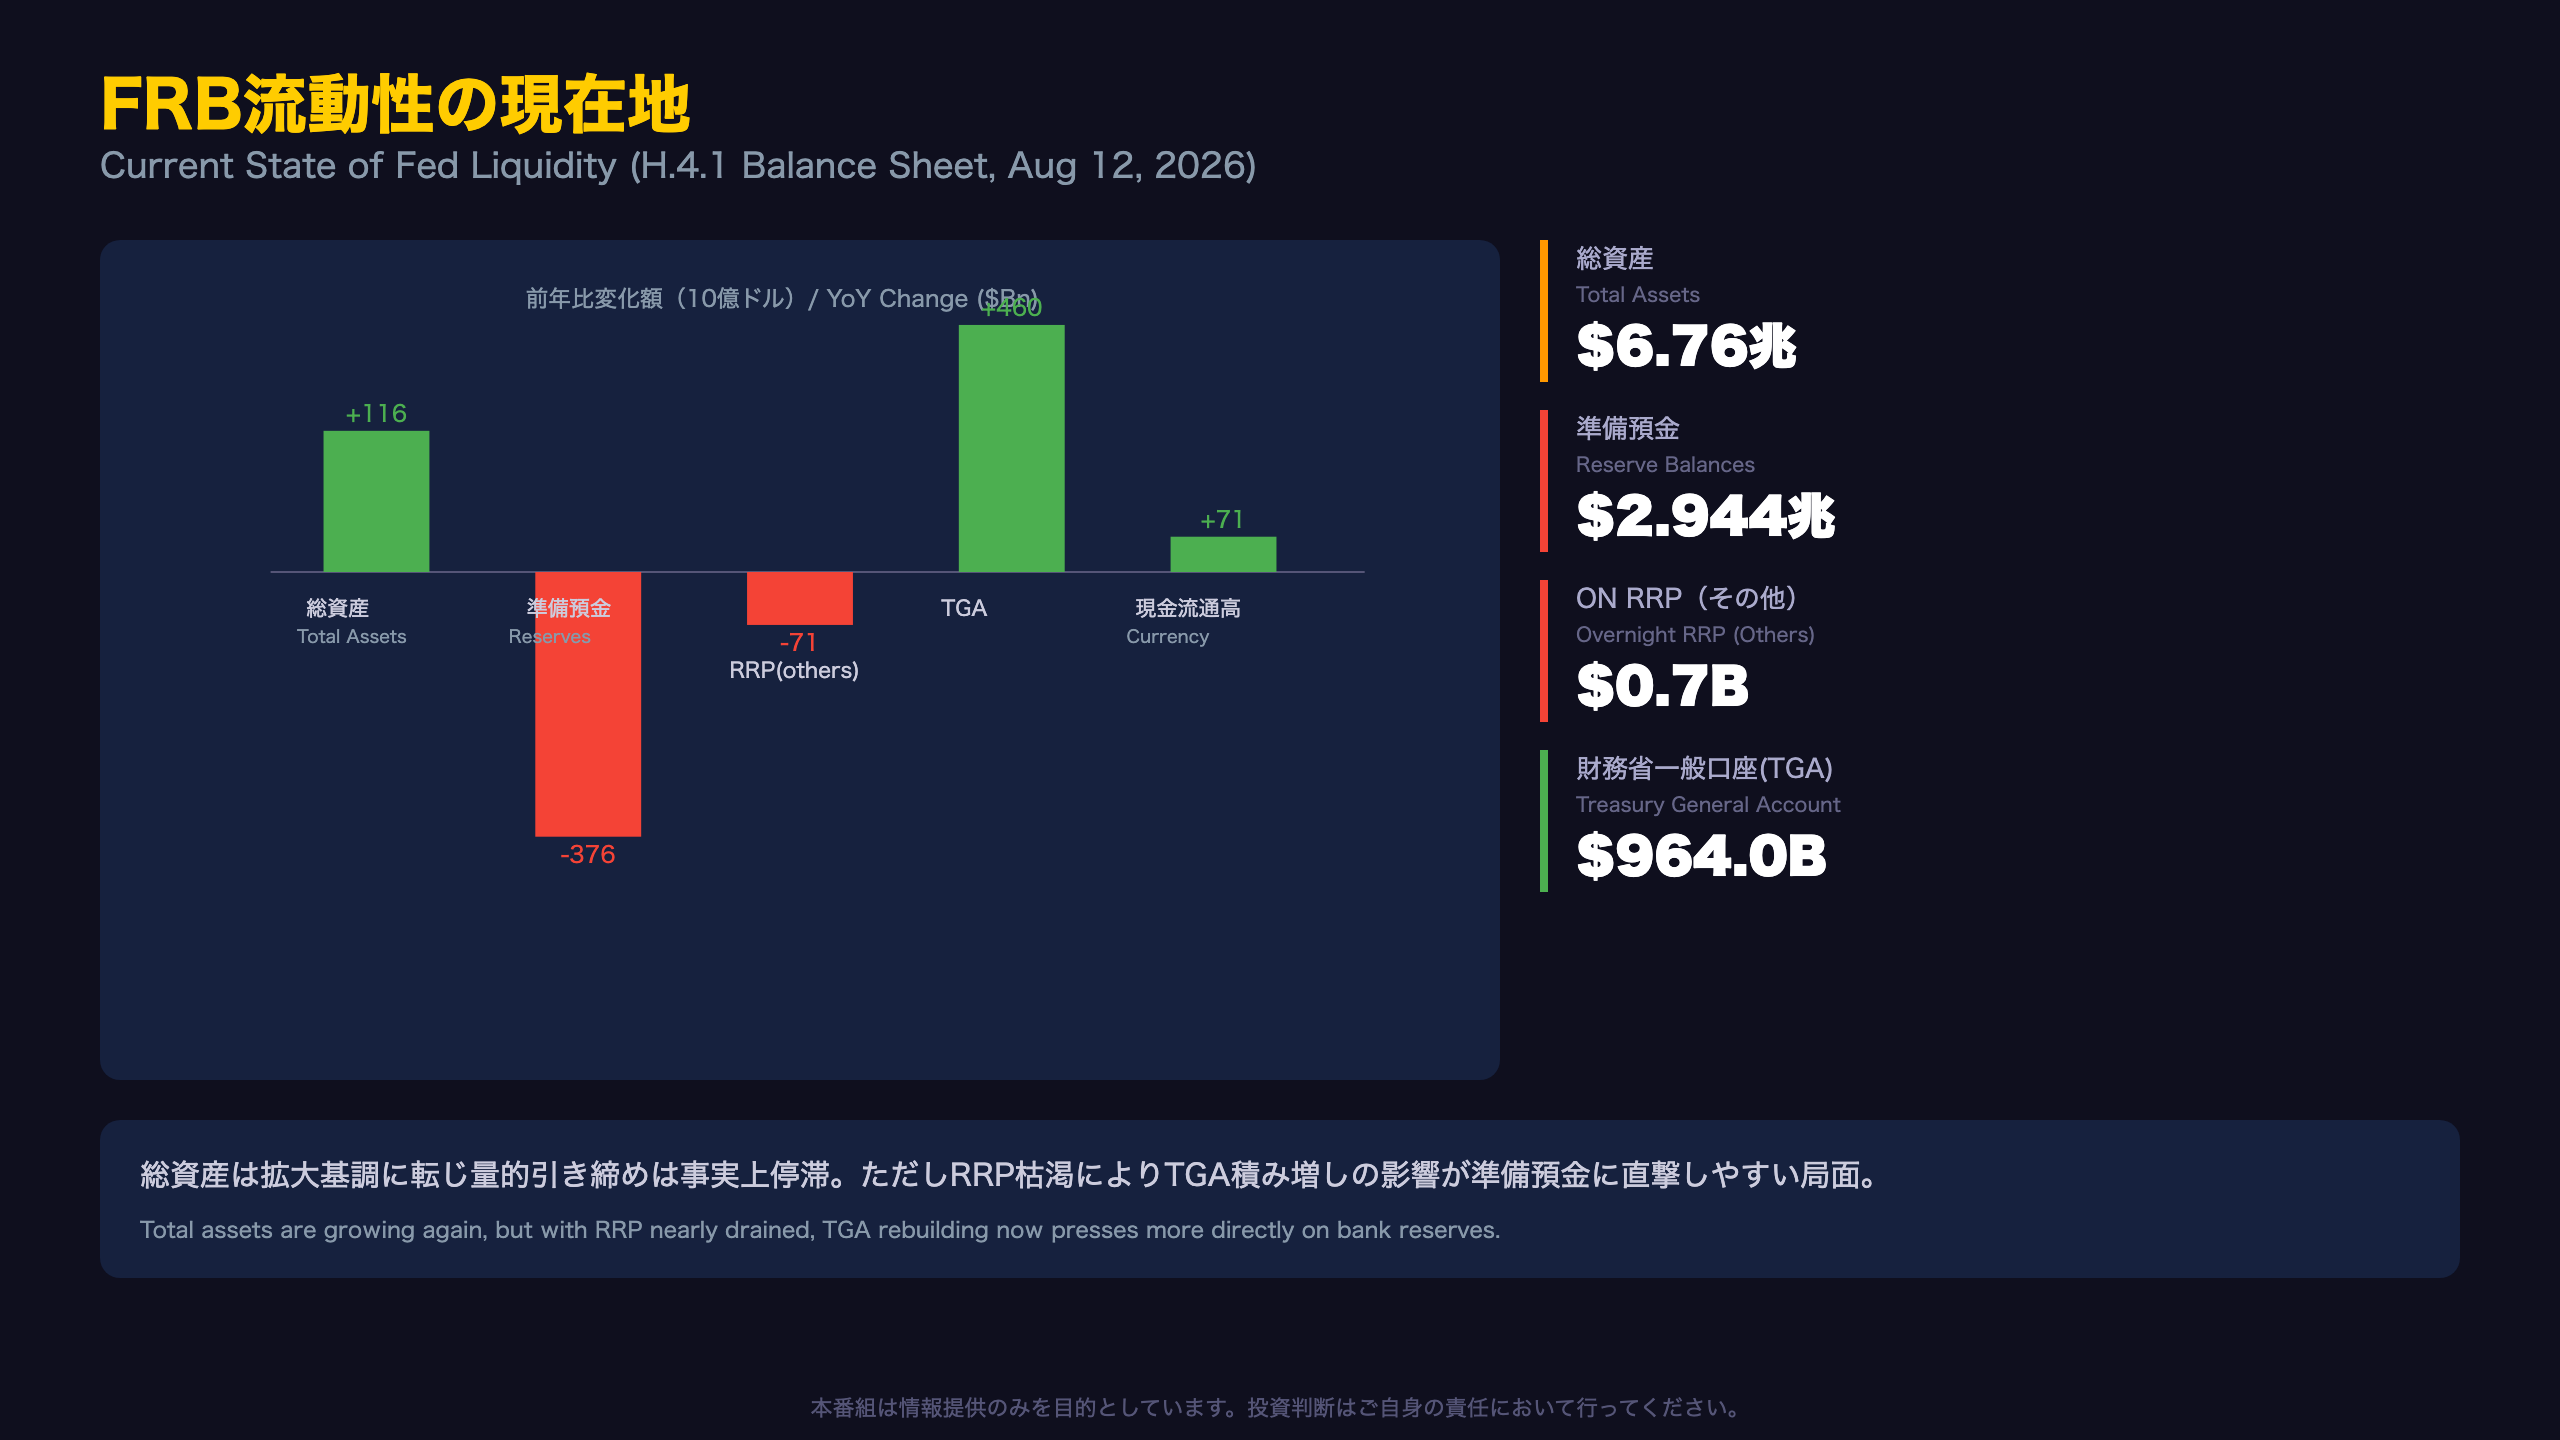
Total Fed securities holdings rose $138.95 billion year-over-year, but the composition tells a more nuanced story. Treasury bill holdings rose $333.1 billion YoY, while mortgage-backed securities (MBS) continued to shrink, down $189.8 billion YoY, and inflation-protected securities fell $33.4 billion YoY. In effect, the Fed is still allowing longer-duration assets to run off while actively adding short-term T-bills, a pattern consistent with the Fed’s publicly stated strategy of using bill purchases to maintain “ample” reserves after ending balance sheet runoff.
Context: What Is H.4.1?
The Federal Reserve’s H.4.1 report, released weekly, is the central bank’s balance sheet statement, detailing asset holdings (Treasuries, MBS) and liabilities (currency, reserves, reverse repo, Treasury’s cash account). It is the primary tool market participants use to track US dollar liquidity conditions, analogous to how the ECB’s weekly financial statement is used for euro liquidity tracking.
The Vanishing RRP Buffer
The most striking data point: the overnight reverse repo facility used mainly by money market funds (the “Others” line) has collapsed to a weekly average of just $0.725 billion, down more than 90% from $73.7 billion a year ago. This facility has historically acted as a shock absorber, letting the Fed’s balance sheet operations and Treasury cash swings play out without directly draining bank reserves. With that buffer nearly exhausted, further Treasury General Account (TGA) rebuilding, which rose $459.6 billion YoY to $964.0 billion, now flows more directly into reserve balances, which fell $376.0 billion YoY to $2.944 trillion.
Many market strategists generally view reserve levels below roughly $3.0-3.3 trillion as an area where repo-market funding stress becomes more likely, though this single week’s data cannot confirm the system is approaching that threshold.
What to Watch Next
Future H.4.1 releases will be key to watching whether the RRP facility stabilizes near zero and how aggressively the TGA continues to rebuild, both critical inputs for money-market rate stability.
ストラテジスト総括:3指標の連関と来週の注目シナリオ

Conclusion: Cross-Checking Three Signals
Laid side by side, this week’s three data releases resist a simple bullish/bearish binary. Labor (resilient), energy (near-term relief but elevated YoY), and Fed liquidity (headline balance sheet growing, but usable reserves shrinking) each speak to a different part of the economic and financial cycle, and this week they are not pointing in the same direction.
Market Implications, Chain of Reasoning
Reserve balances fell $376 billion YoY while the overnight reverse repo (RRP) facility drained to just $0.7 billion → With the RRP buffer, which has historically absorbed excess liquidity swings without touching bank reserves, now nearly exhausted, further Treasury General Account (TGA) rebuilding is more likely to flow directly into reserve balances → This creates conditions where short-term funding markets (repo, SOFR) could become more sensitive to liquidity swings, a dynamic global rates and money-market investors have watched closely since the September 2019 repo market stress episode. That said, this week’s data alone cannot confirm actual funding stress is materializing.
Retail gasoline and diesel prices remain 28.5% and 40.2% higher year-over-year, respectively → Elevated energy costs continue to weigh on household purchasing power and the energy component of CPI → It generally takes time for near-term crude price declines to filter through to retail and CPI prints, so this data alone does not support strong near-term disinflation conclusions; next month’s CPI release will be the key confirming data point.
Risk Scenarios for Investors to Monitor
- Repo market funding stress: With RRP near zero, further TGA increases could push short-term rates higher at the margin.
- Sticky energy-driven inflation: Elevated YoY comparisons mean any renewed uptick in crude prices could quickly translate into higher CPI energy readings.
This program is provided for informational purposes only. Please make investment decisions at your own discretion.
Disclaimer: This article is for informational purposes only. All investment decisions are made solely at your own risk.







