📺 Watch the Full Video Analysis
This article was automatically generated by the NFC Market Live AI analysis system. (Updated: 2026-08-14 21:38 JST)
📄 Primary Source
U.S. Census Bureau
https://www.census.gov/retail/marts/www/marts_current.pdf
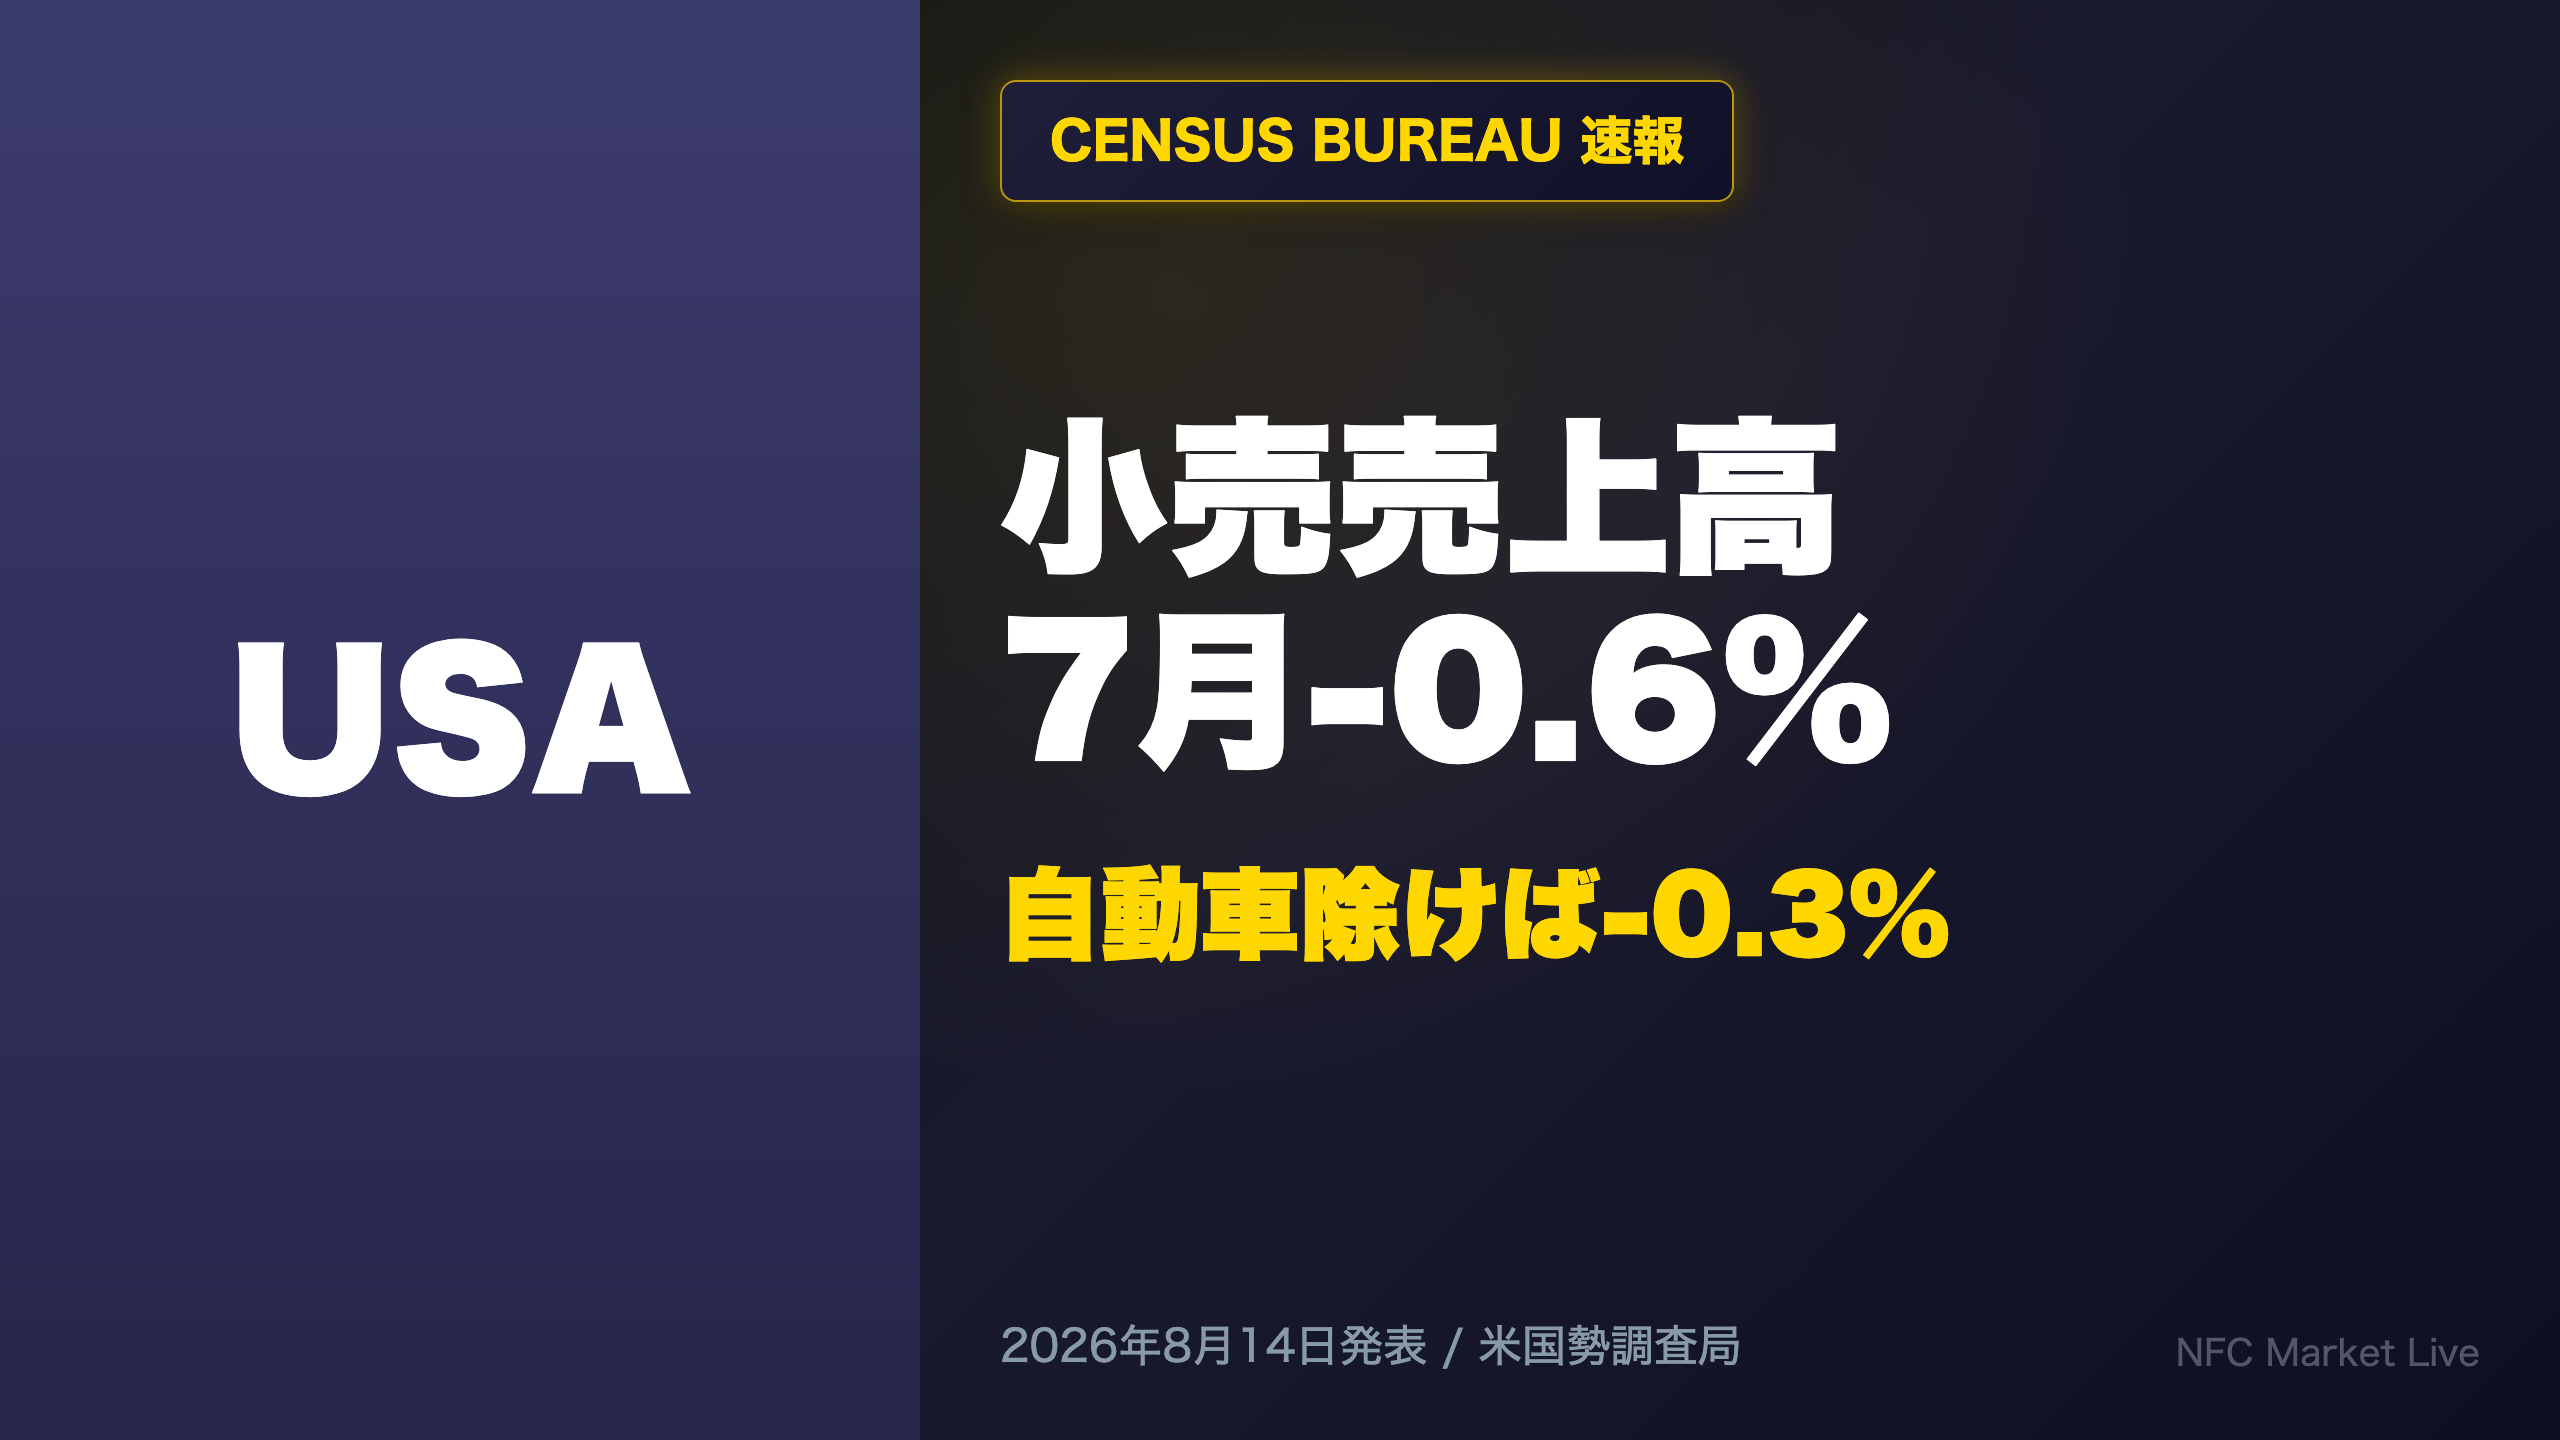
📊 The U.S. Census Bureau’s July retail sales report shows a statistically significant -0.6% MoM decline to $763.6B.
🚗 But dig into the details: auto dealers fell -1.8%, driving most of the headline drop. Ex-auto, the decline shrinks to just -0.3%.
📈 Meanwhile, the 3-month (May-Jul) total is up +6.3% YoY, nearly unchanged from +6.4% last period.
⚠️ A single-month dip vs. multi-month resilience — we break down what the data really tells us.
小売売上高、7月は-0.6%——されど基調は崩れず
Reading the Confidence Interval Behind the Headline
The U.S. Census Bureau’s Advance Monthly Retail Trade Survey is a closely watched early indicator of consumer demand, based on a subsample of roughly 4,800 firms weighted to represent the full universe of over three million retail and food service businesses. Because it’s a sample survey, every change comes with a margin of error.
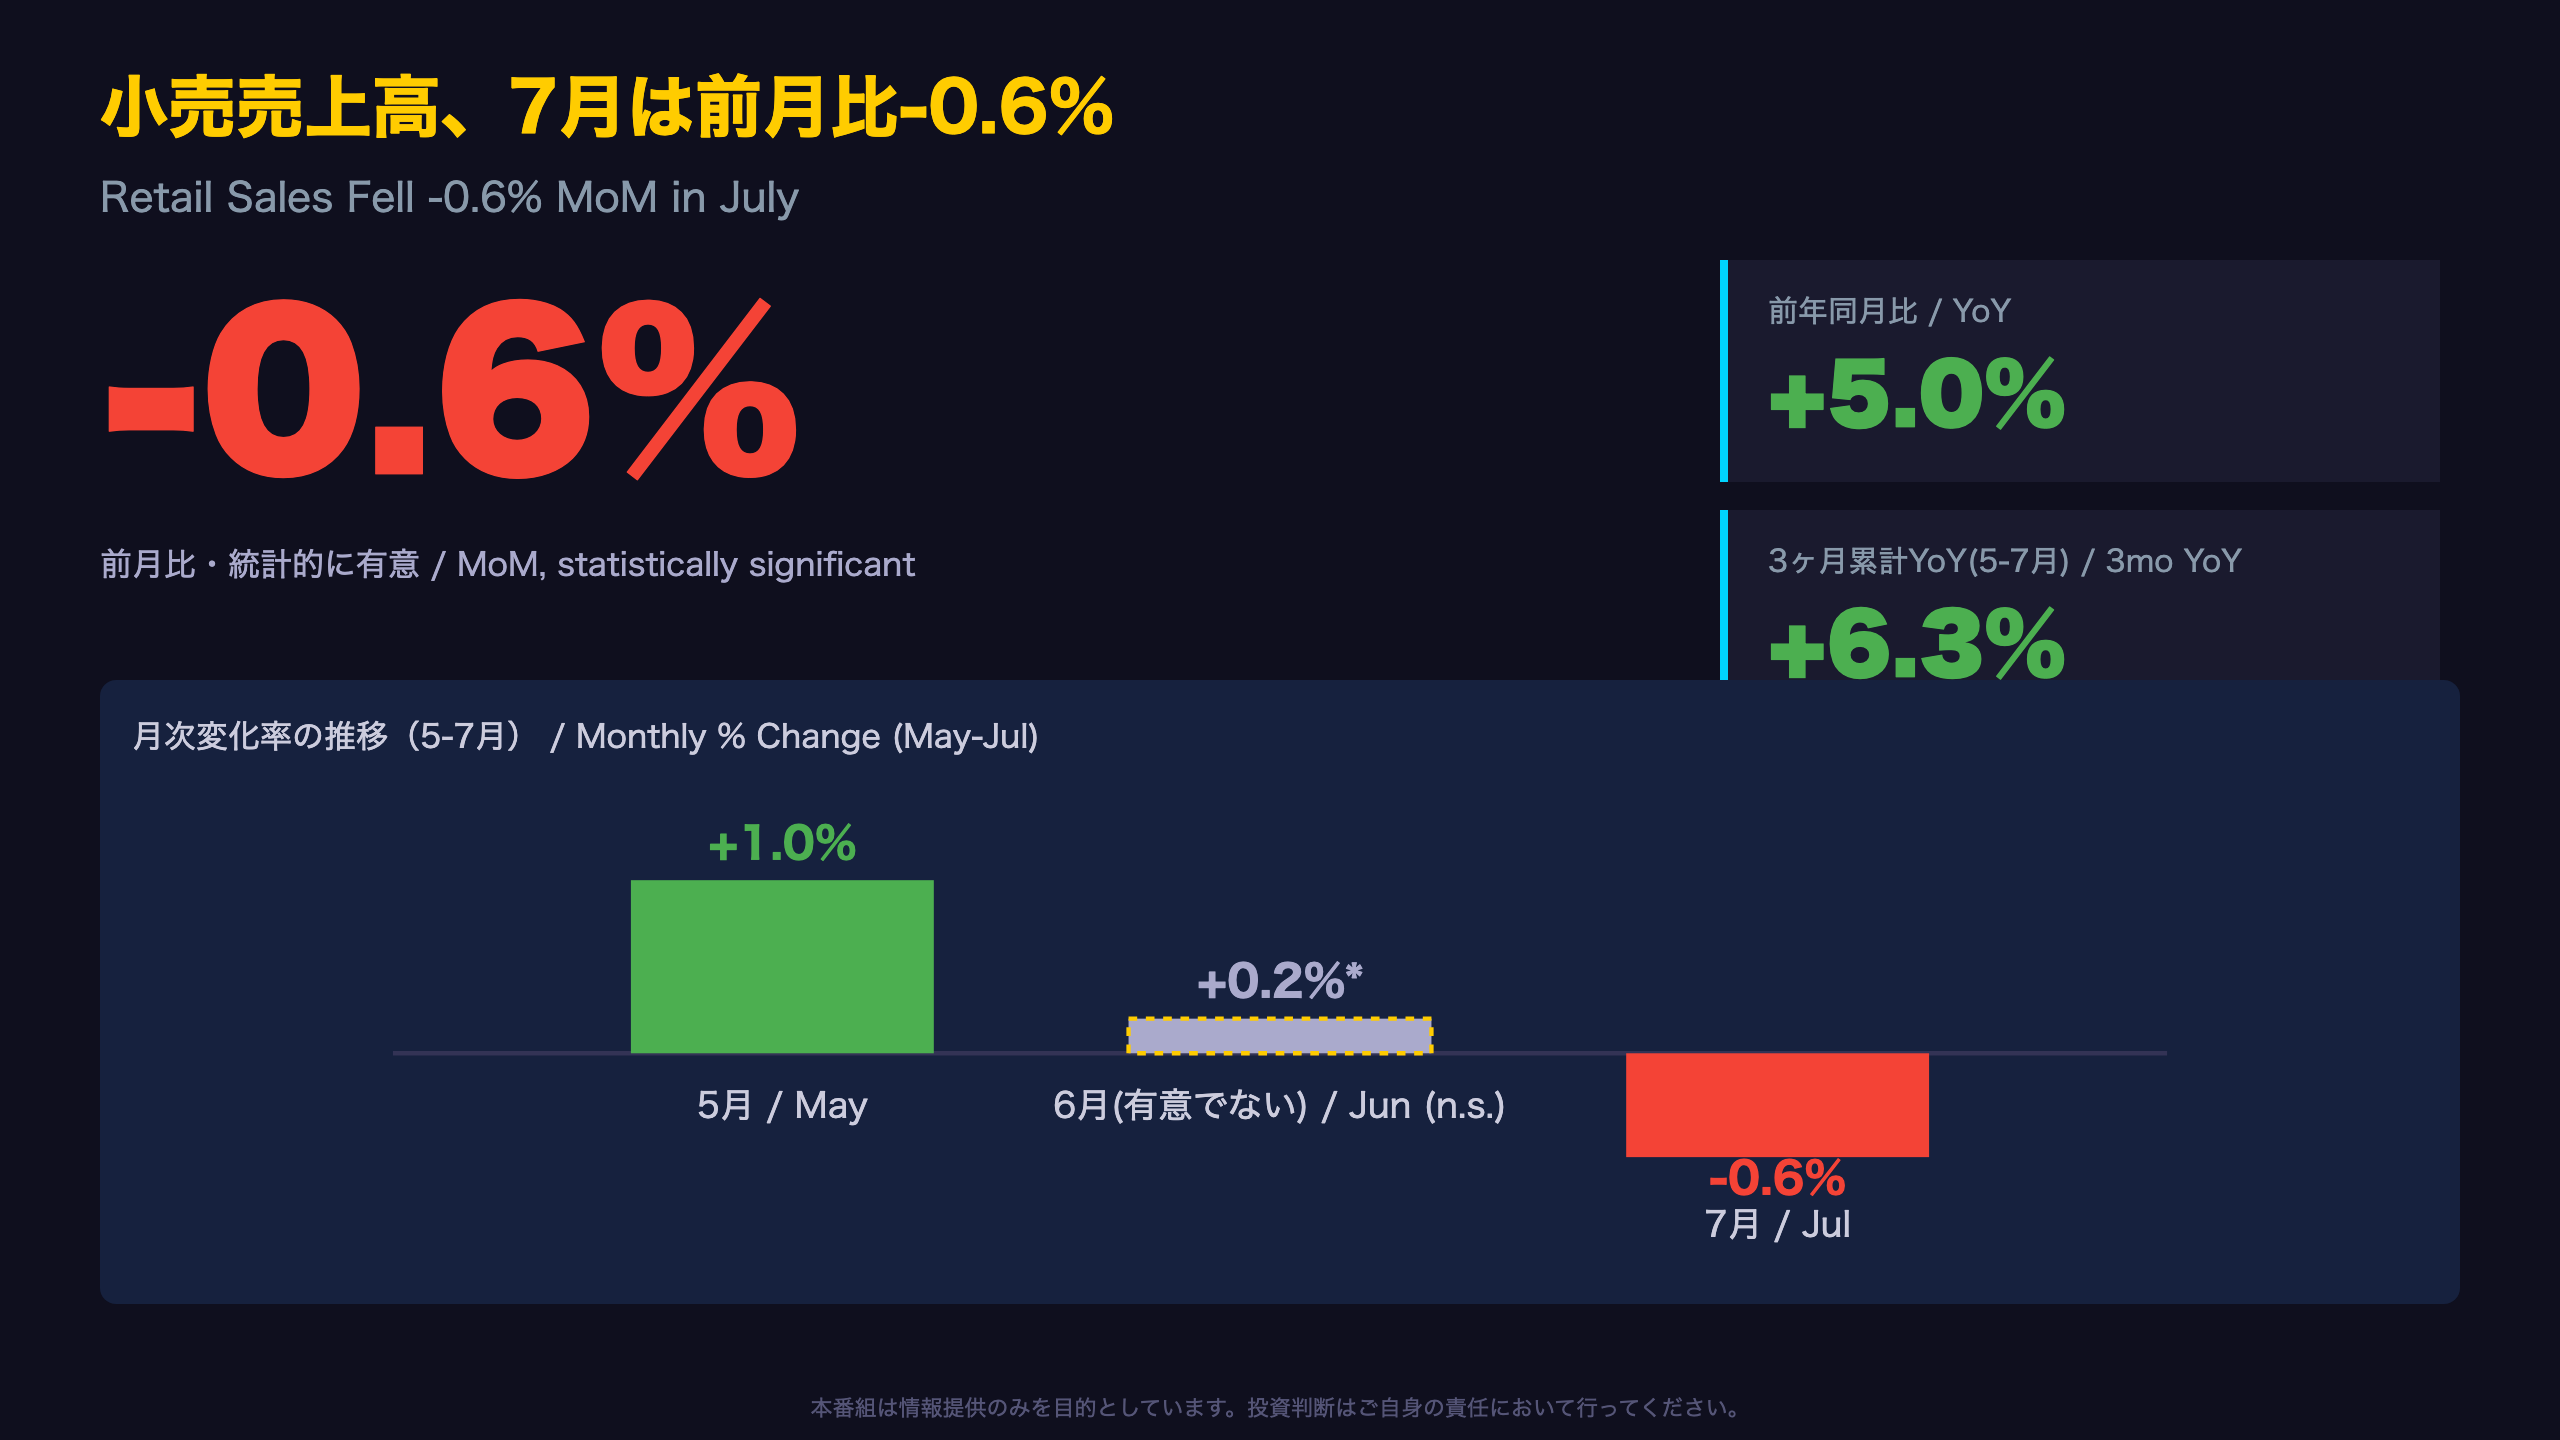
July’s headline drop of -0.6% carries a 90% confidence interval of ±0.4%, meaning the true range is roughly -1.0% to -0.2% — a range that does not include zero, so the decline is statistically significant. Compare that to June’s +0.2% figure, whose confidence interval of ±0.3% spans -0.1% to +0.5%, which does include zero. In plain terms, June’s “increase” was statistically indistinguishable from no change at all.
Month-by-month
- May: +1.0% (significant)
- June: +0.2% (not significant — effectively flat)
- July: -0.6% (significant)
Notably, June’s dollar total was revised slightly down from $768.6B to $768.1B, though the percent change itself was unrevised.
The Three-Month Lens
The May-July three-month total rose +6.3% YoY (±0.5%), barely different from the prior April-June reading of +6.4%. For U.S.-focused investors used to comparing this report against Fed communications, it’s worth noting this release contains no policy commentary — any read-through to Fed policy is inference, not fact from the source. The next release covering August data arrives September 16, 2026.
ヘッドラインを歪めた「自動車要因」
The Auto Sector’s Outsized Role
Unlike headline CPI, which US investors are used to parsing for “core” vs. “food and energy,” retail sales data requires its own set of exclusion filters. The Census Bureau publishes three key variants: total, ex-auto, and ex-auto-and-gas, precisely because autos and gasoline are volatile, price-sensitive categories that can distort the headline signal.
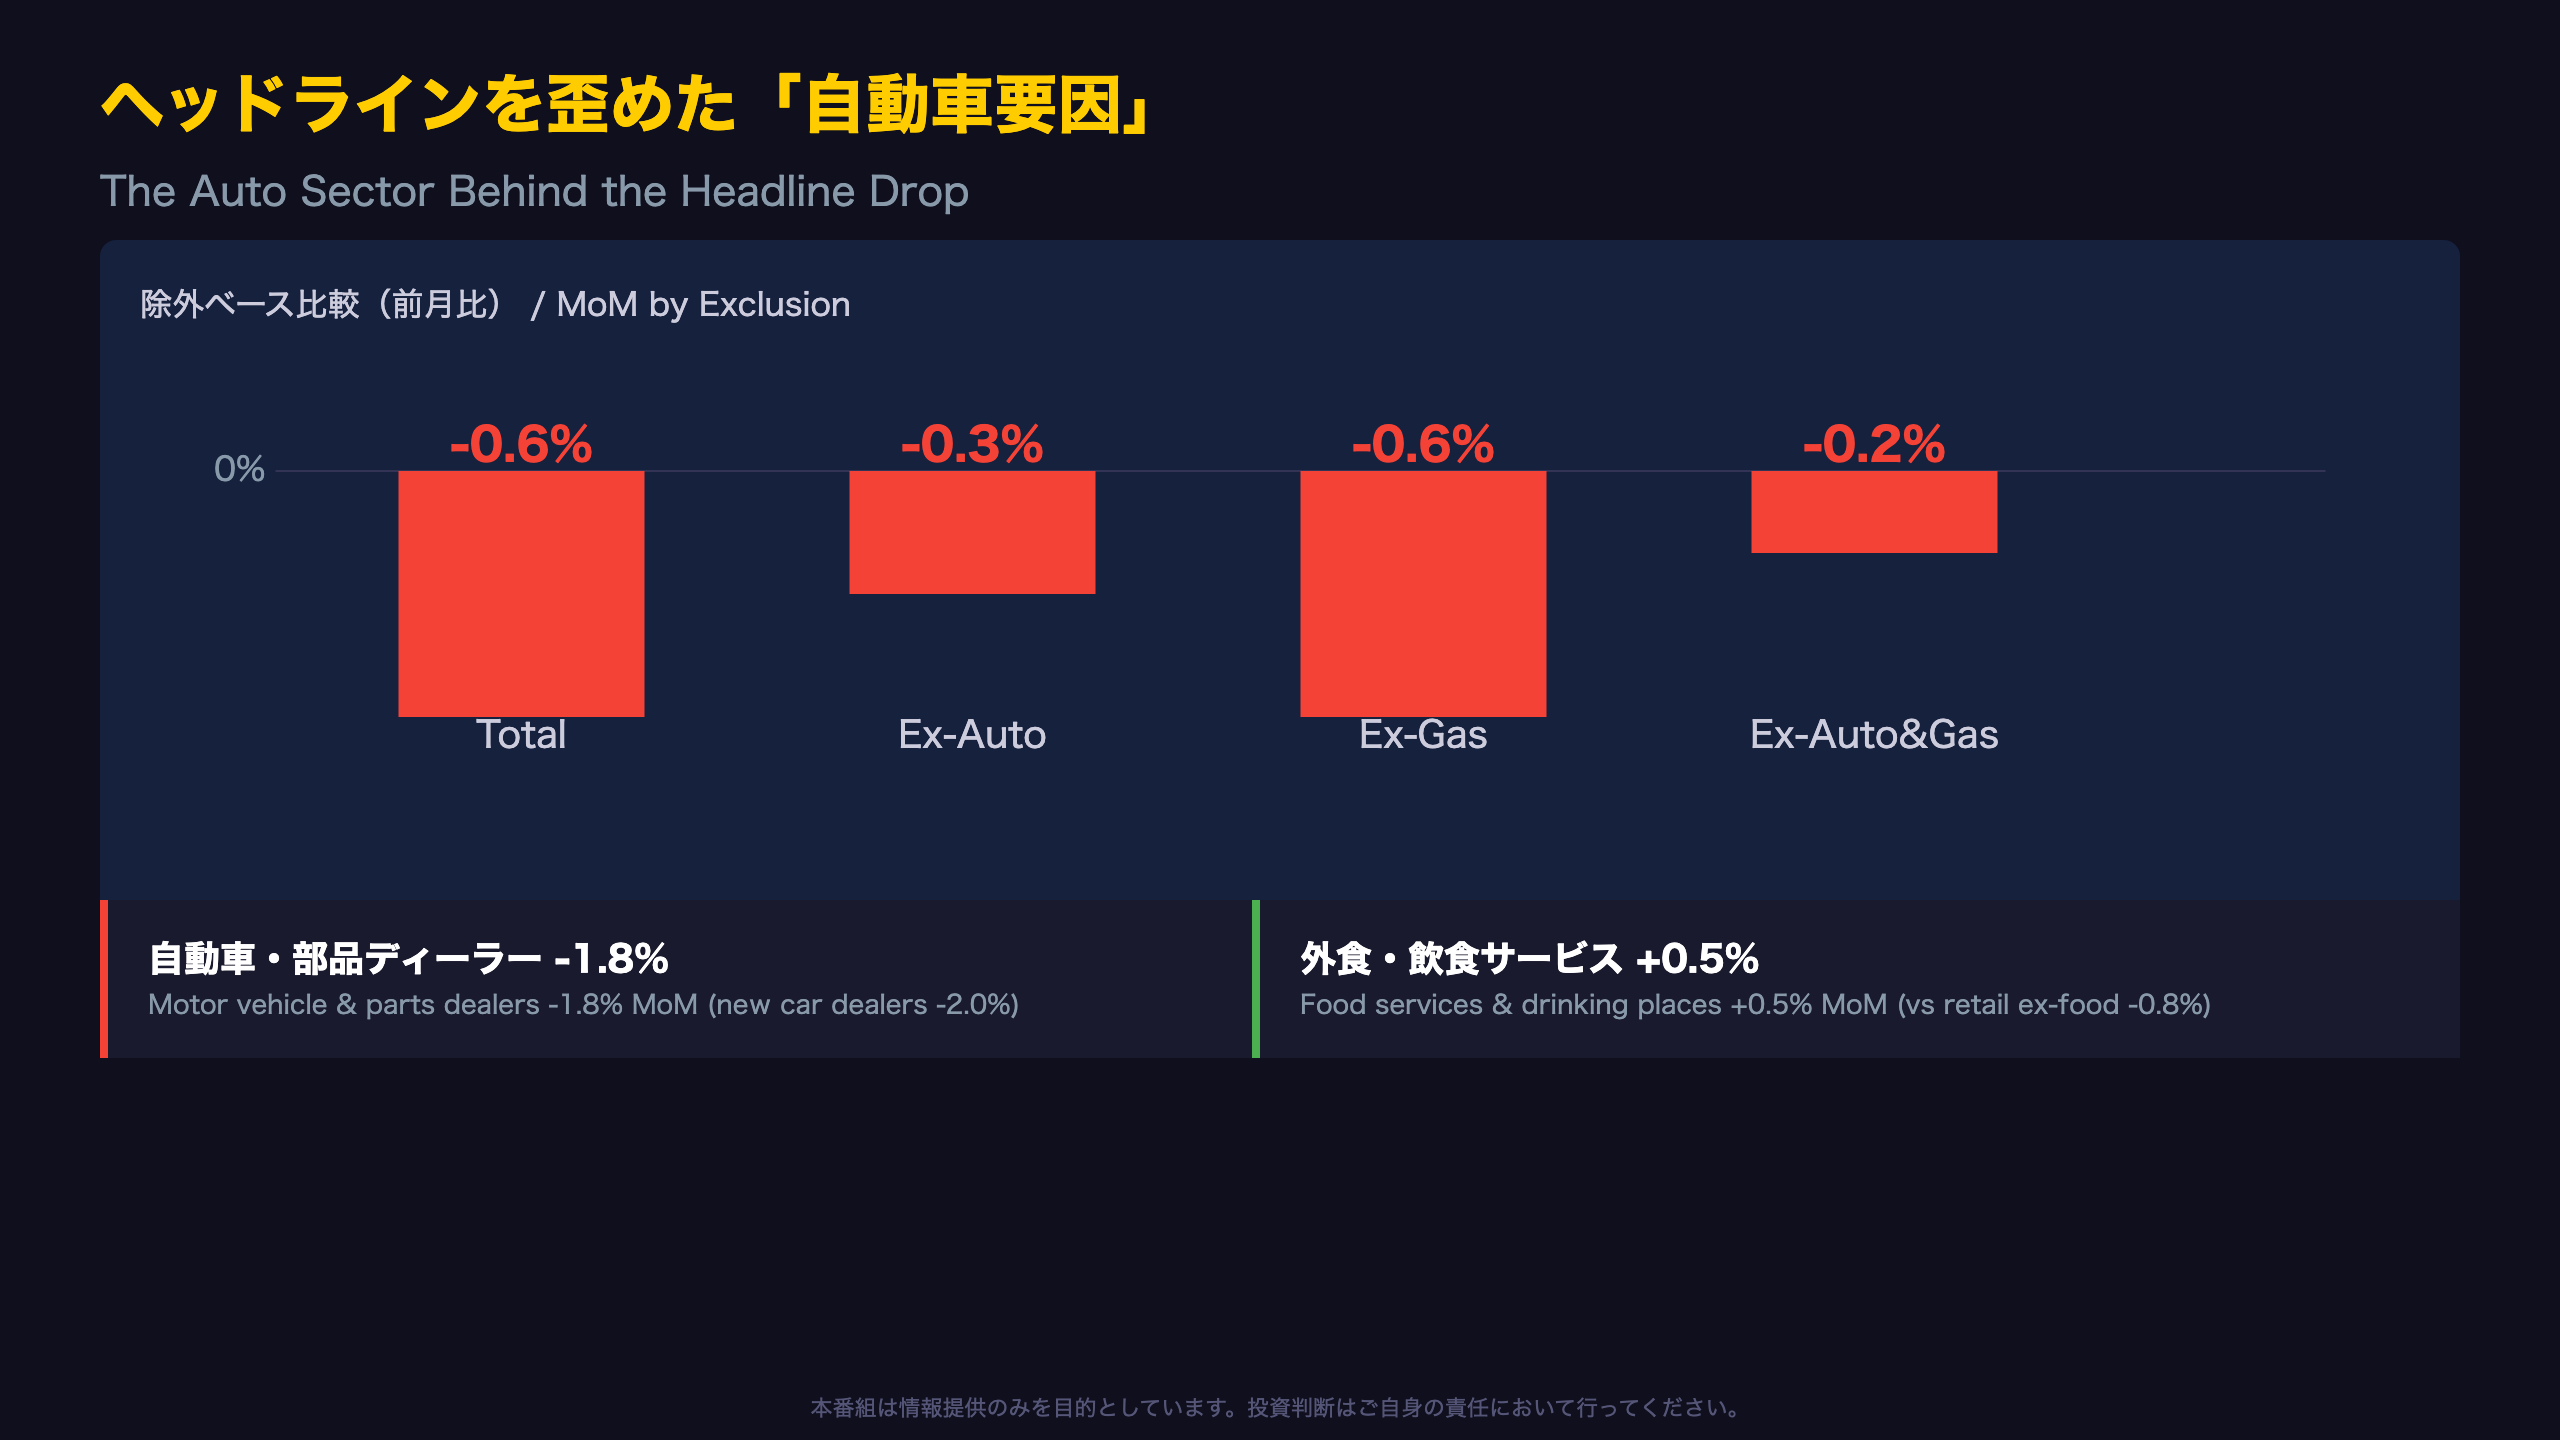
In July, motor vehicle and parts dealers fell -1.8% MoM, with new car dealers down -2.0%, reversing June’s +2.4% gain — a reminder that auto sales, often tied to financing rates, incentive cycles, and inventory swings, are among the most volatile lines in this report.
The Exclusion Ladder
| Metric | MoM |
|---|---|
| Total | -0.6% |
| Ex-Auto | -0.3% |
| Ex-Gas | -0.6% |
| Ex-Auto & Gas | -0.2% |
Stripping out autos alone cuts the decline roughly in half. Notably, excluding gasoline barely moves the needle (-0.6% either way), suggesting gasoline price swings were not the driver of this month’s softness — a useful distinction from headline CPI narratives where energy often gets the blame.
Goods vs. Services
Retail excluding food services fell -0.8%, while food services and drinking places rose +0.5%. For investors tracking discretionary services spending as a resilience gauge, this divergence is worth watching — though a single month is not enough to call it a trend.
3ヶ月移動平均が示す消費の底堅さ
Why the Three-Month Average Matters More Than the Headline
For investors accustomed to U.S. macro releases, it’s worth noting that this Advance report is a sample survey — Table 3 discloses coefficient-of-variation (CV) estimates showing sampling variability, with the total CV around 1.1%, auto dealers at 1.8%, and nonstore retailers as high as 2.8%. Single-month swings within these ranges can reflect sampling noise as much as real economic shifts, a nuance often lost in headline-driven market reactions.
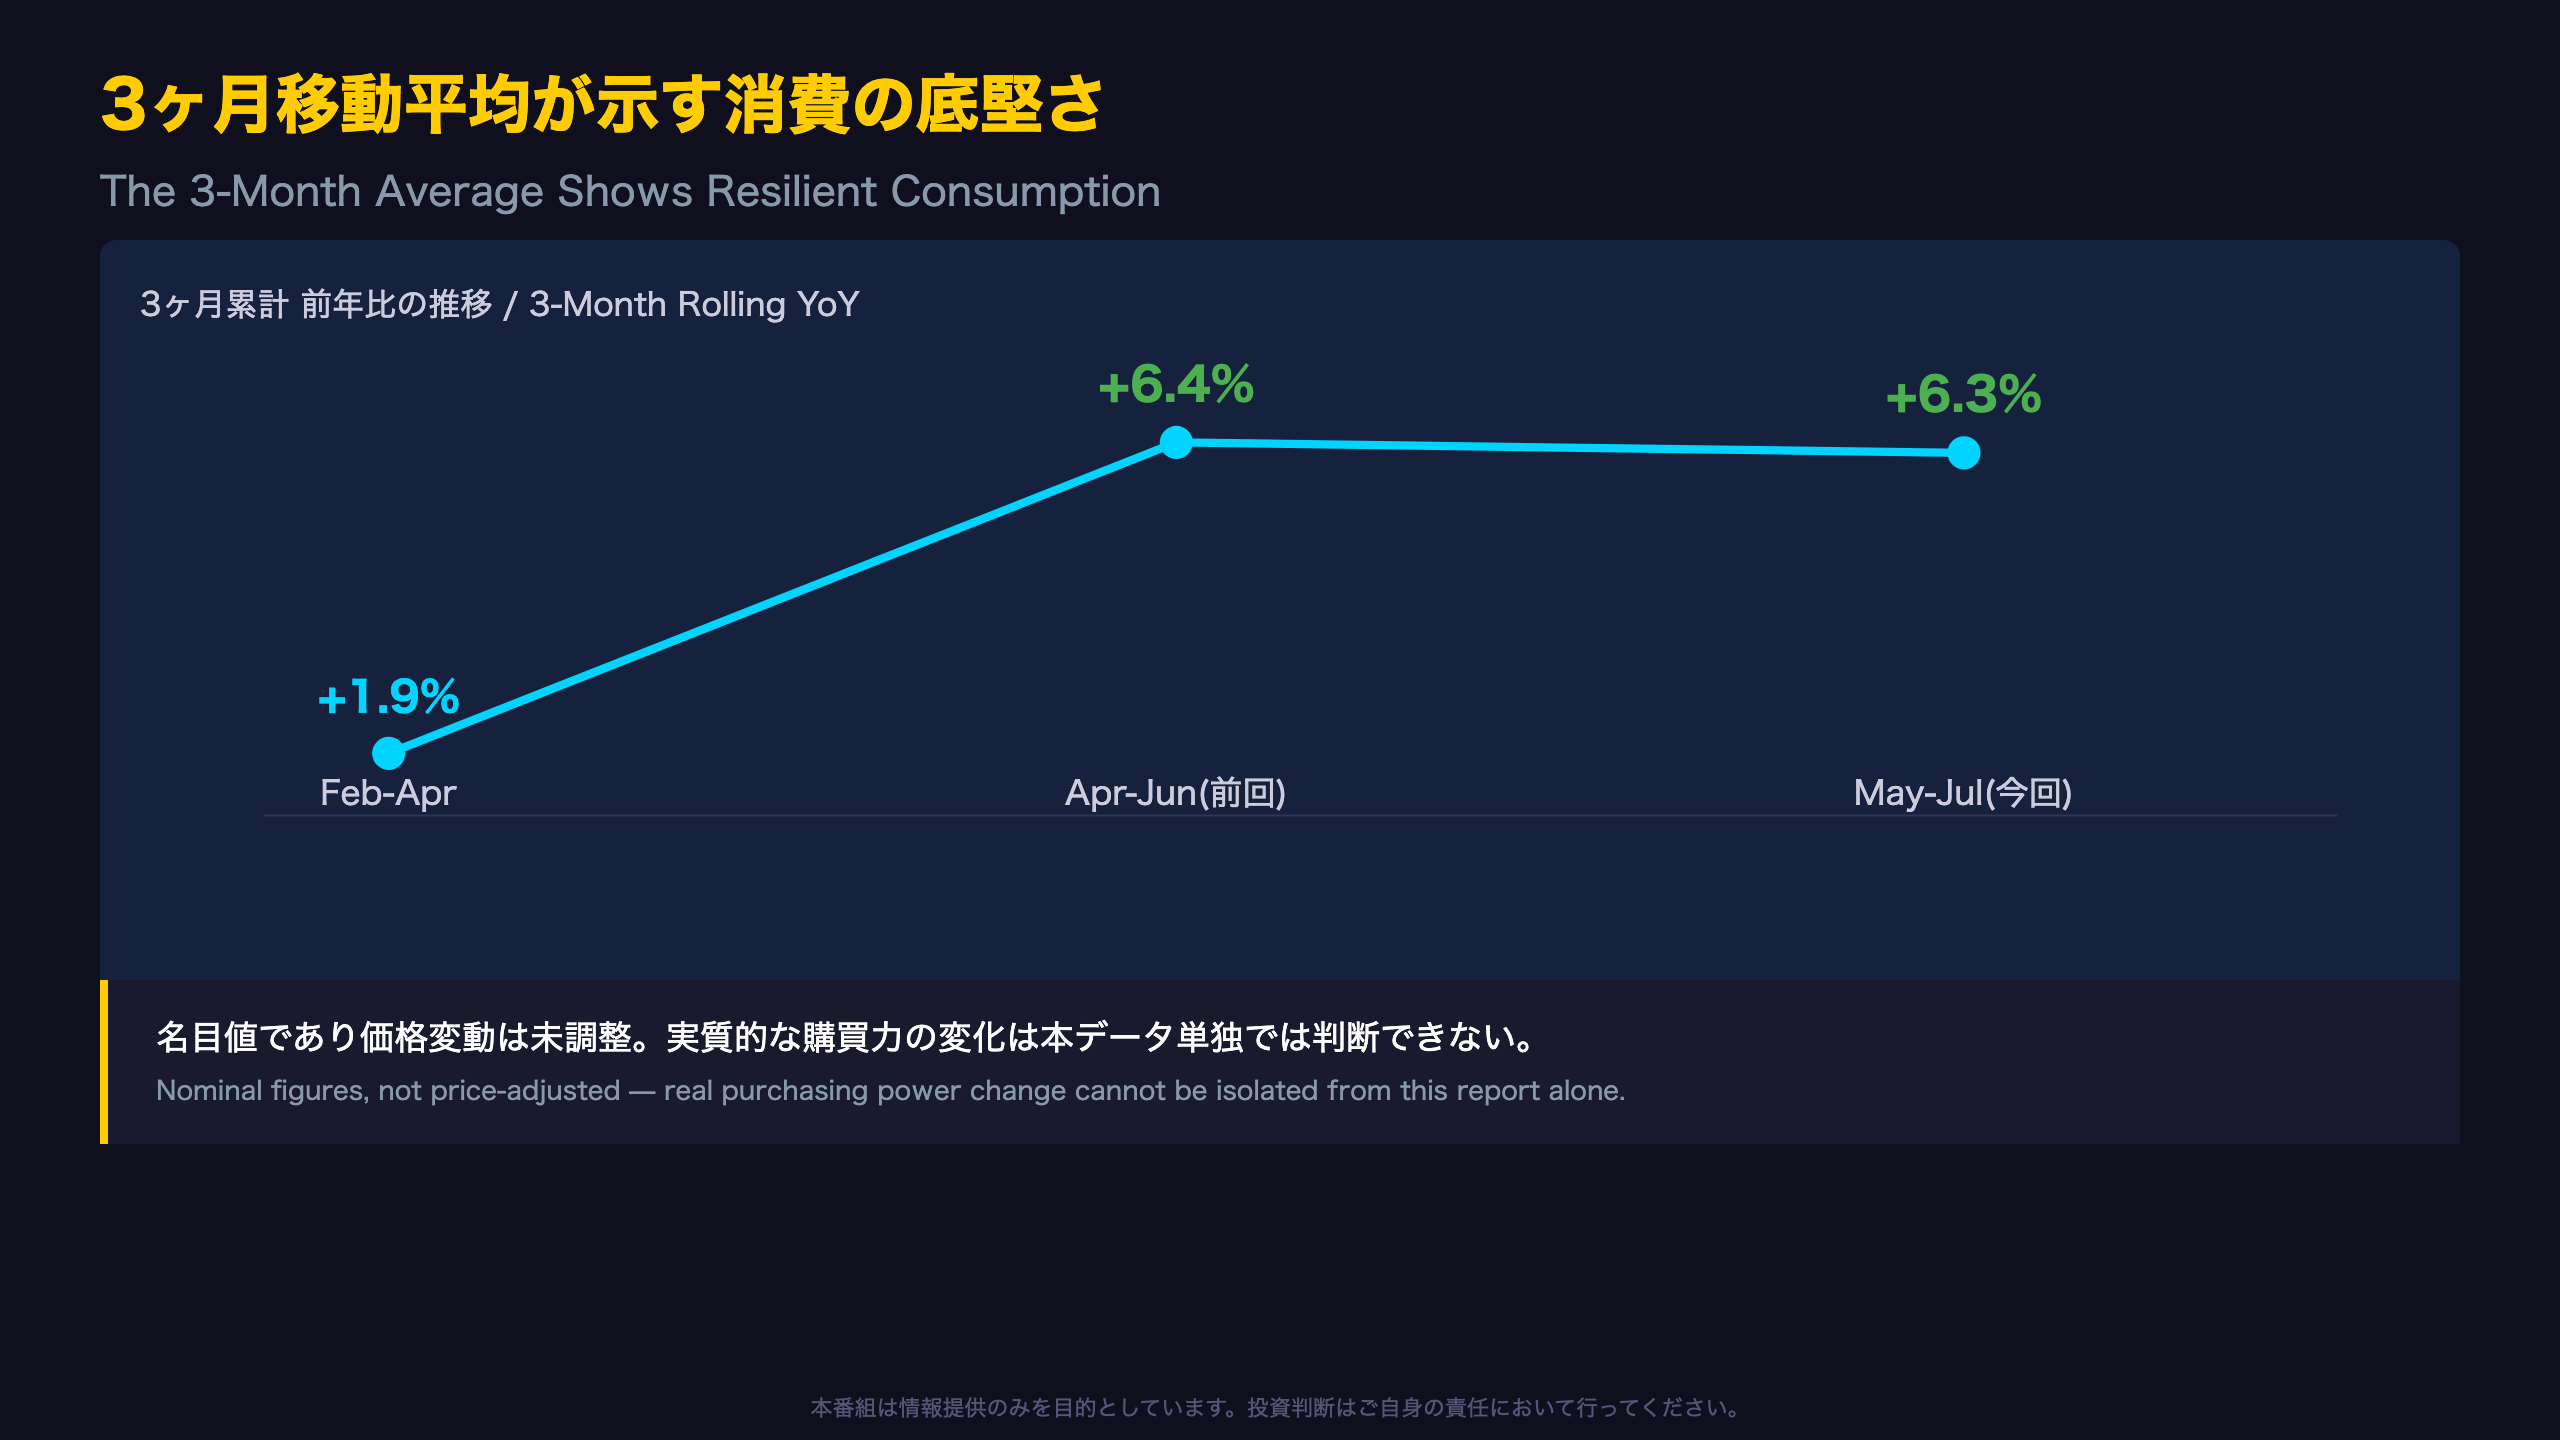
Three-Month Trend Comparison
| Period | YoY |
|---|---|
| Feb-Apr (base) | +1.9% |
| May-Jul (current) | +6.3% |
| Apr-Jun (prior) | +6.4% |
The three-month trend slipped just 0.1 percentage point from the prior reading — essentially unchanged. This is analogous to how U.S. investors often prefer the Fed’s 3-month or 6-month annualized core PCE over single-month prints when gauging inflation persistence; the same logic applies here to consumption.
The Nominal-Value Caveat
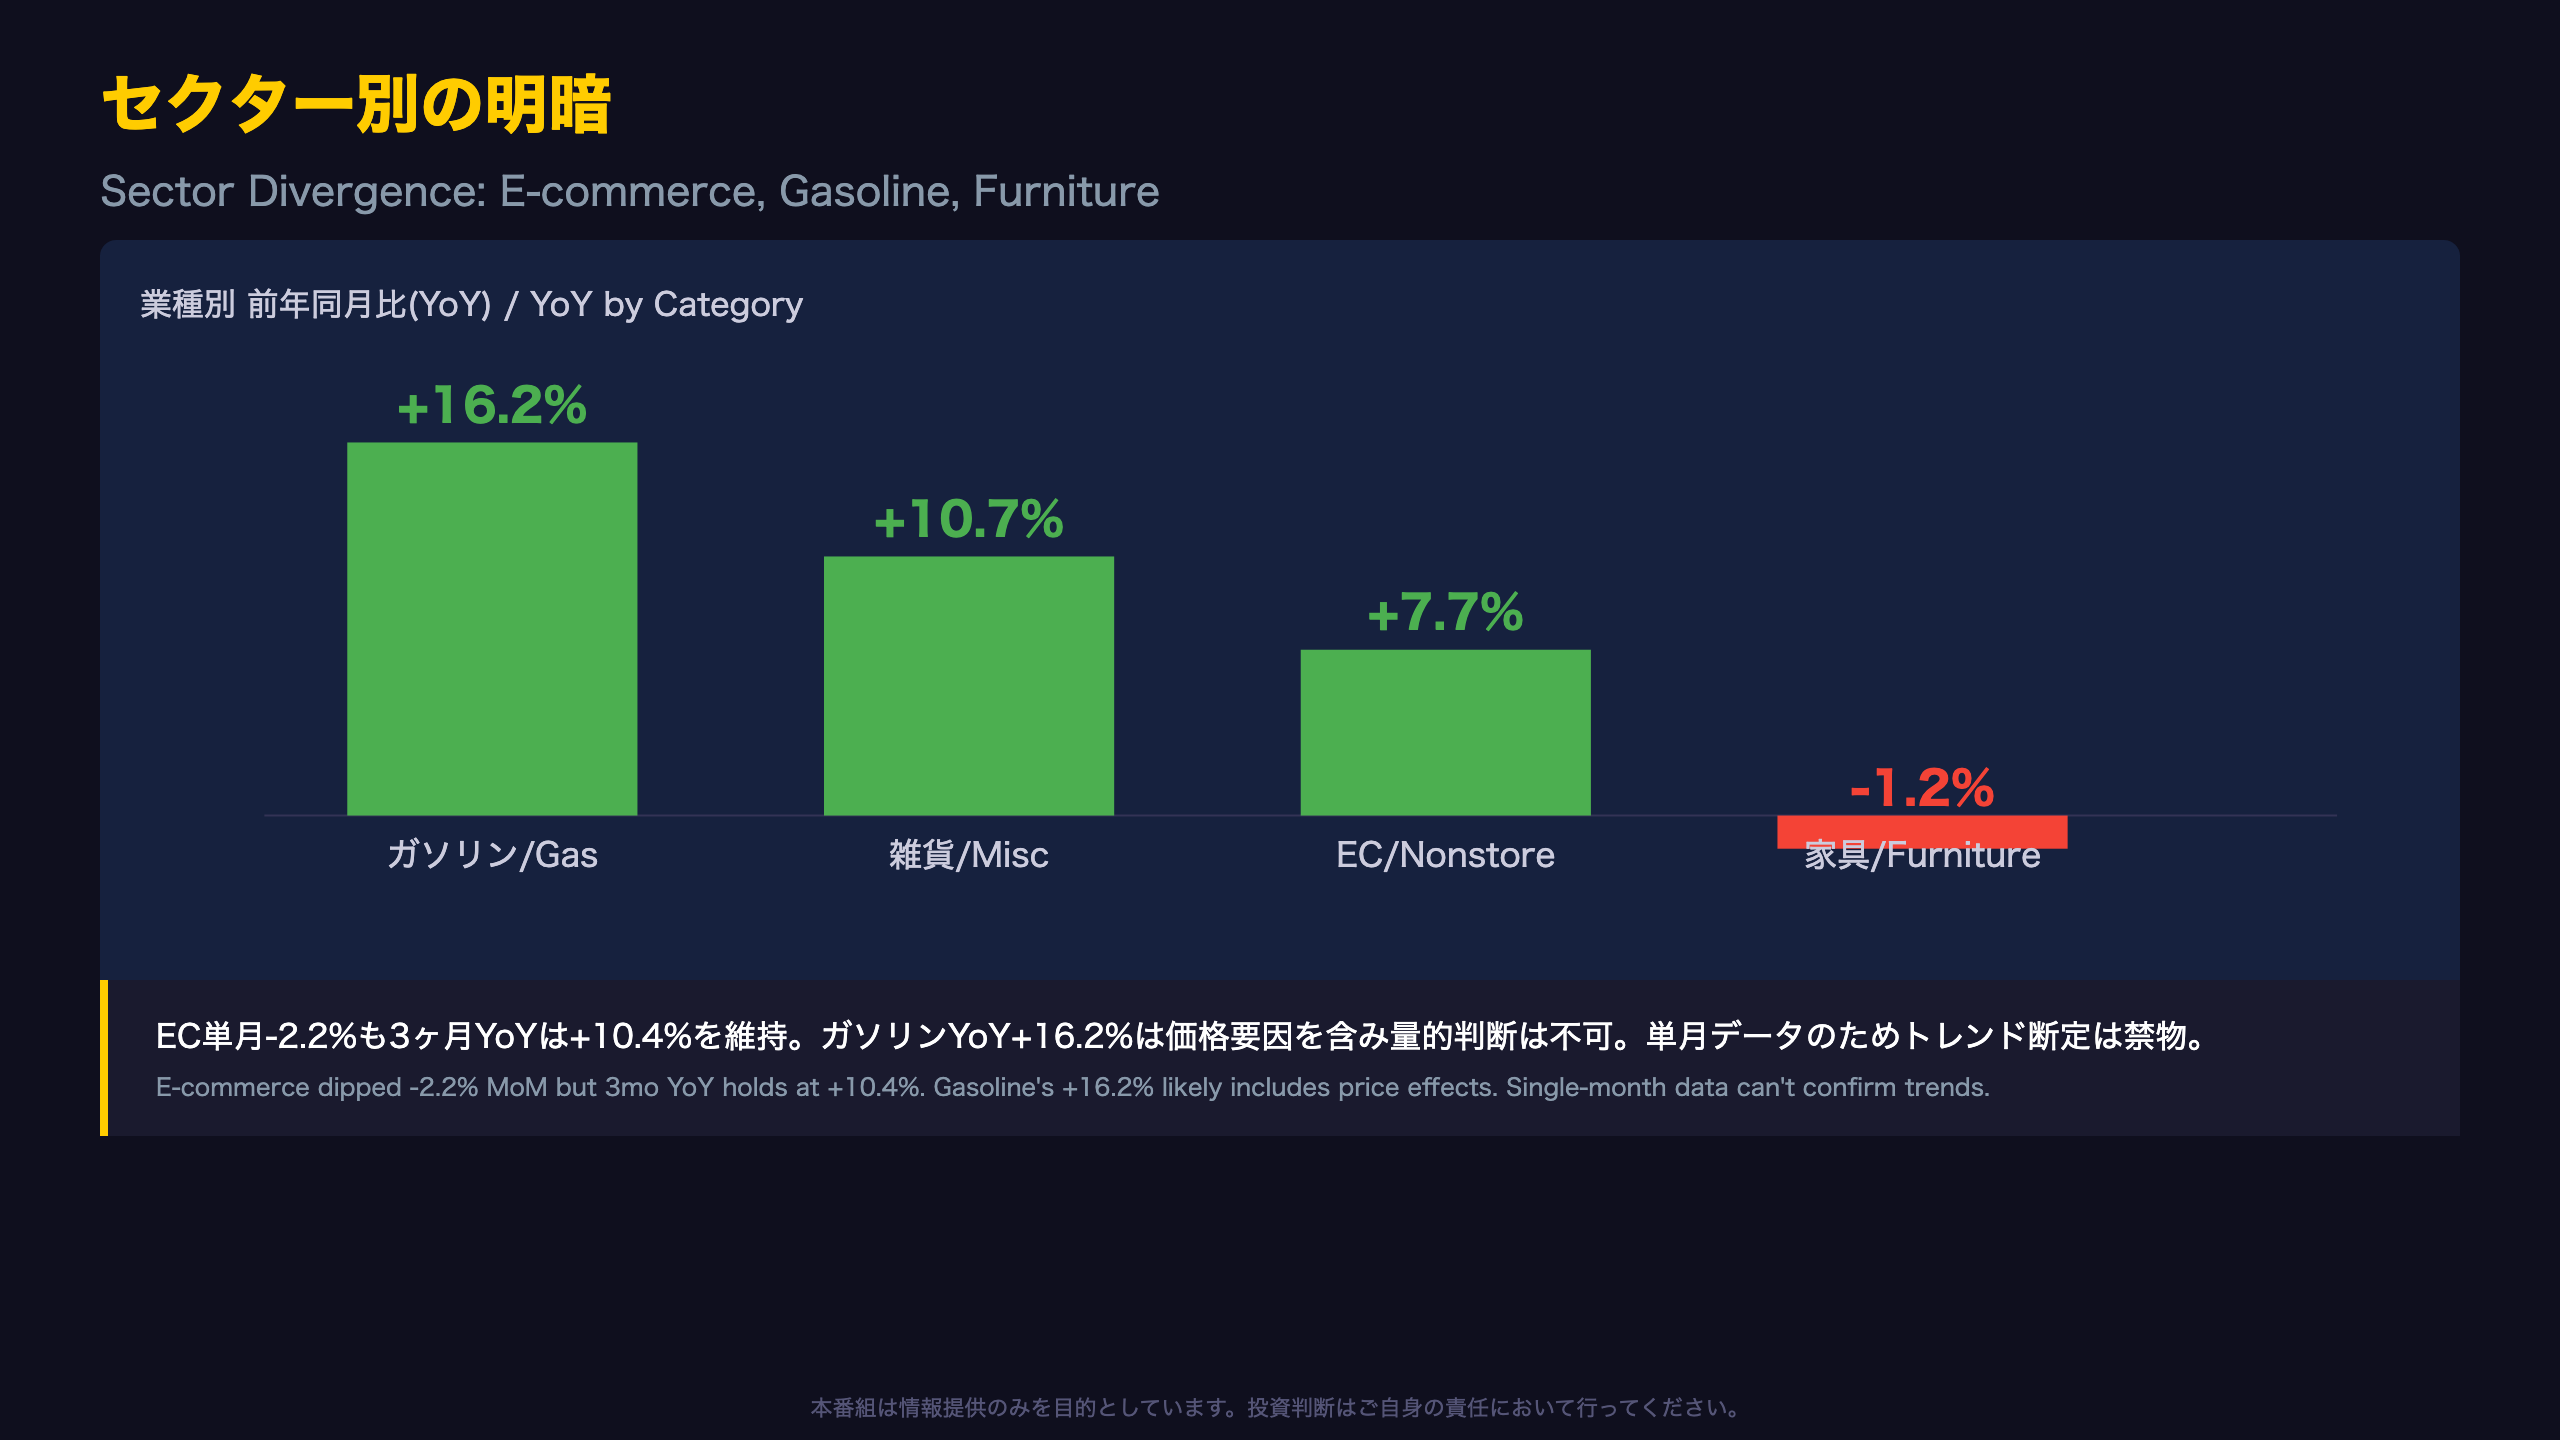
This report explicitly states figures are “not adjusted for price changes.” Gasoline stations’ +16.2% YoY gain likely reflects fuel price movements as much as volume — a distinction similar to how nominal U.S. retail sales differ from real personal consumption expenditure (PCE) figures used by the Fed. Without a price deflator, this report alone cannot isolate real demand from price effects.
セクター別の明暗:EC急落、ガソリン急伸、家具低迷
A Sector-by-Sector Divergence Map
Is the E-Commerce Dip Noise or Signal?
Nonstore retailers — the category closest to U.S. e-commerce — fell -2.2% MoM, a sharp single-month drop. Yet the YoY figure remains +7.7%, and the three-month rolling YoY is +10.4% (down modestly from +12.4% previously). For investors used to watching Amazon and e-commerce penetration trends, this is a useful reminder: a single month’s decline within a category still growing double-digits on a rolling basis should not be read as a reversal without confirmation in subsequent months.
What the Gasoline Number Really Tells You
Gasoline stations posted the largest YoY gain of any category at +16.2%. But unlike U.S. CPI, which separates “headline” from “core” specifically to strip out volatile energy prices, this retail sales report offers no such price deflator. The report explicitly states data is “not adjusted for price changes,” meaning this figure conflates fuel price inflation with any change in gallons purchased — the two cannot be disentangled here.
The Lone Laggard: Furniture
Furniture and home furnishings stores fell -1.2% YoY, and -0.5% on a three-month basis — one of the only categories in negative territory. This category is often linked to housing market activity in macro commentary, but this report contains no housing data, so any causal link to mortgage rates or home sales would be speculation beyond what this data can support.
Direct quote: “Furniture & home furn. stores” YoY change was -1.2% (Table 2).
市場への含意:減速か、単月ノイズか
What to Watch Before September 16
For market participants deciding how much weight to give this report, it’s useful to separate confirmed facts from inference.
What This Data Confirms
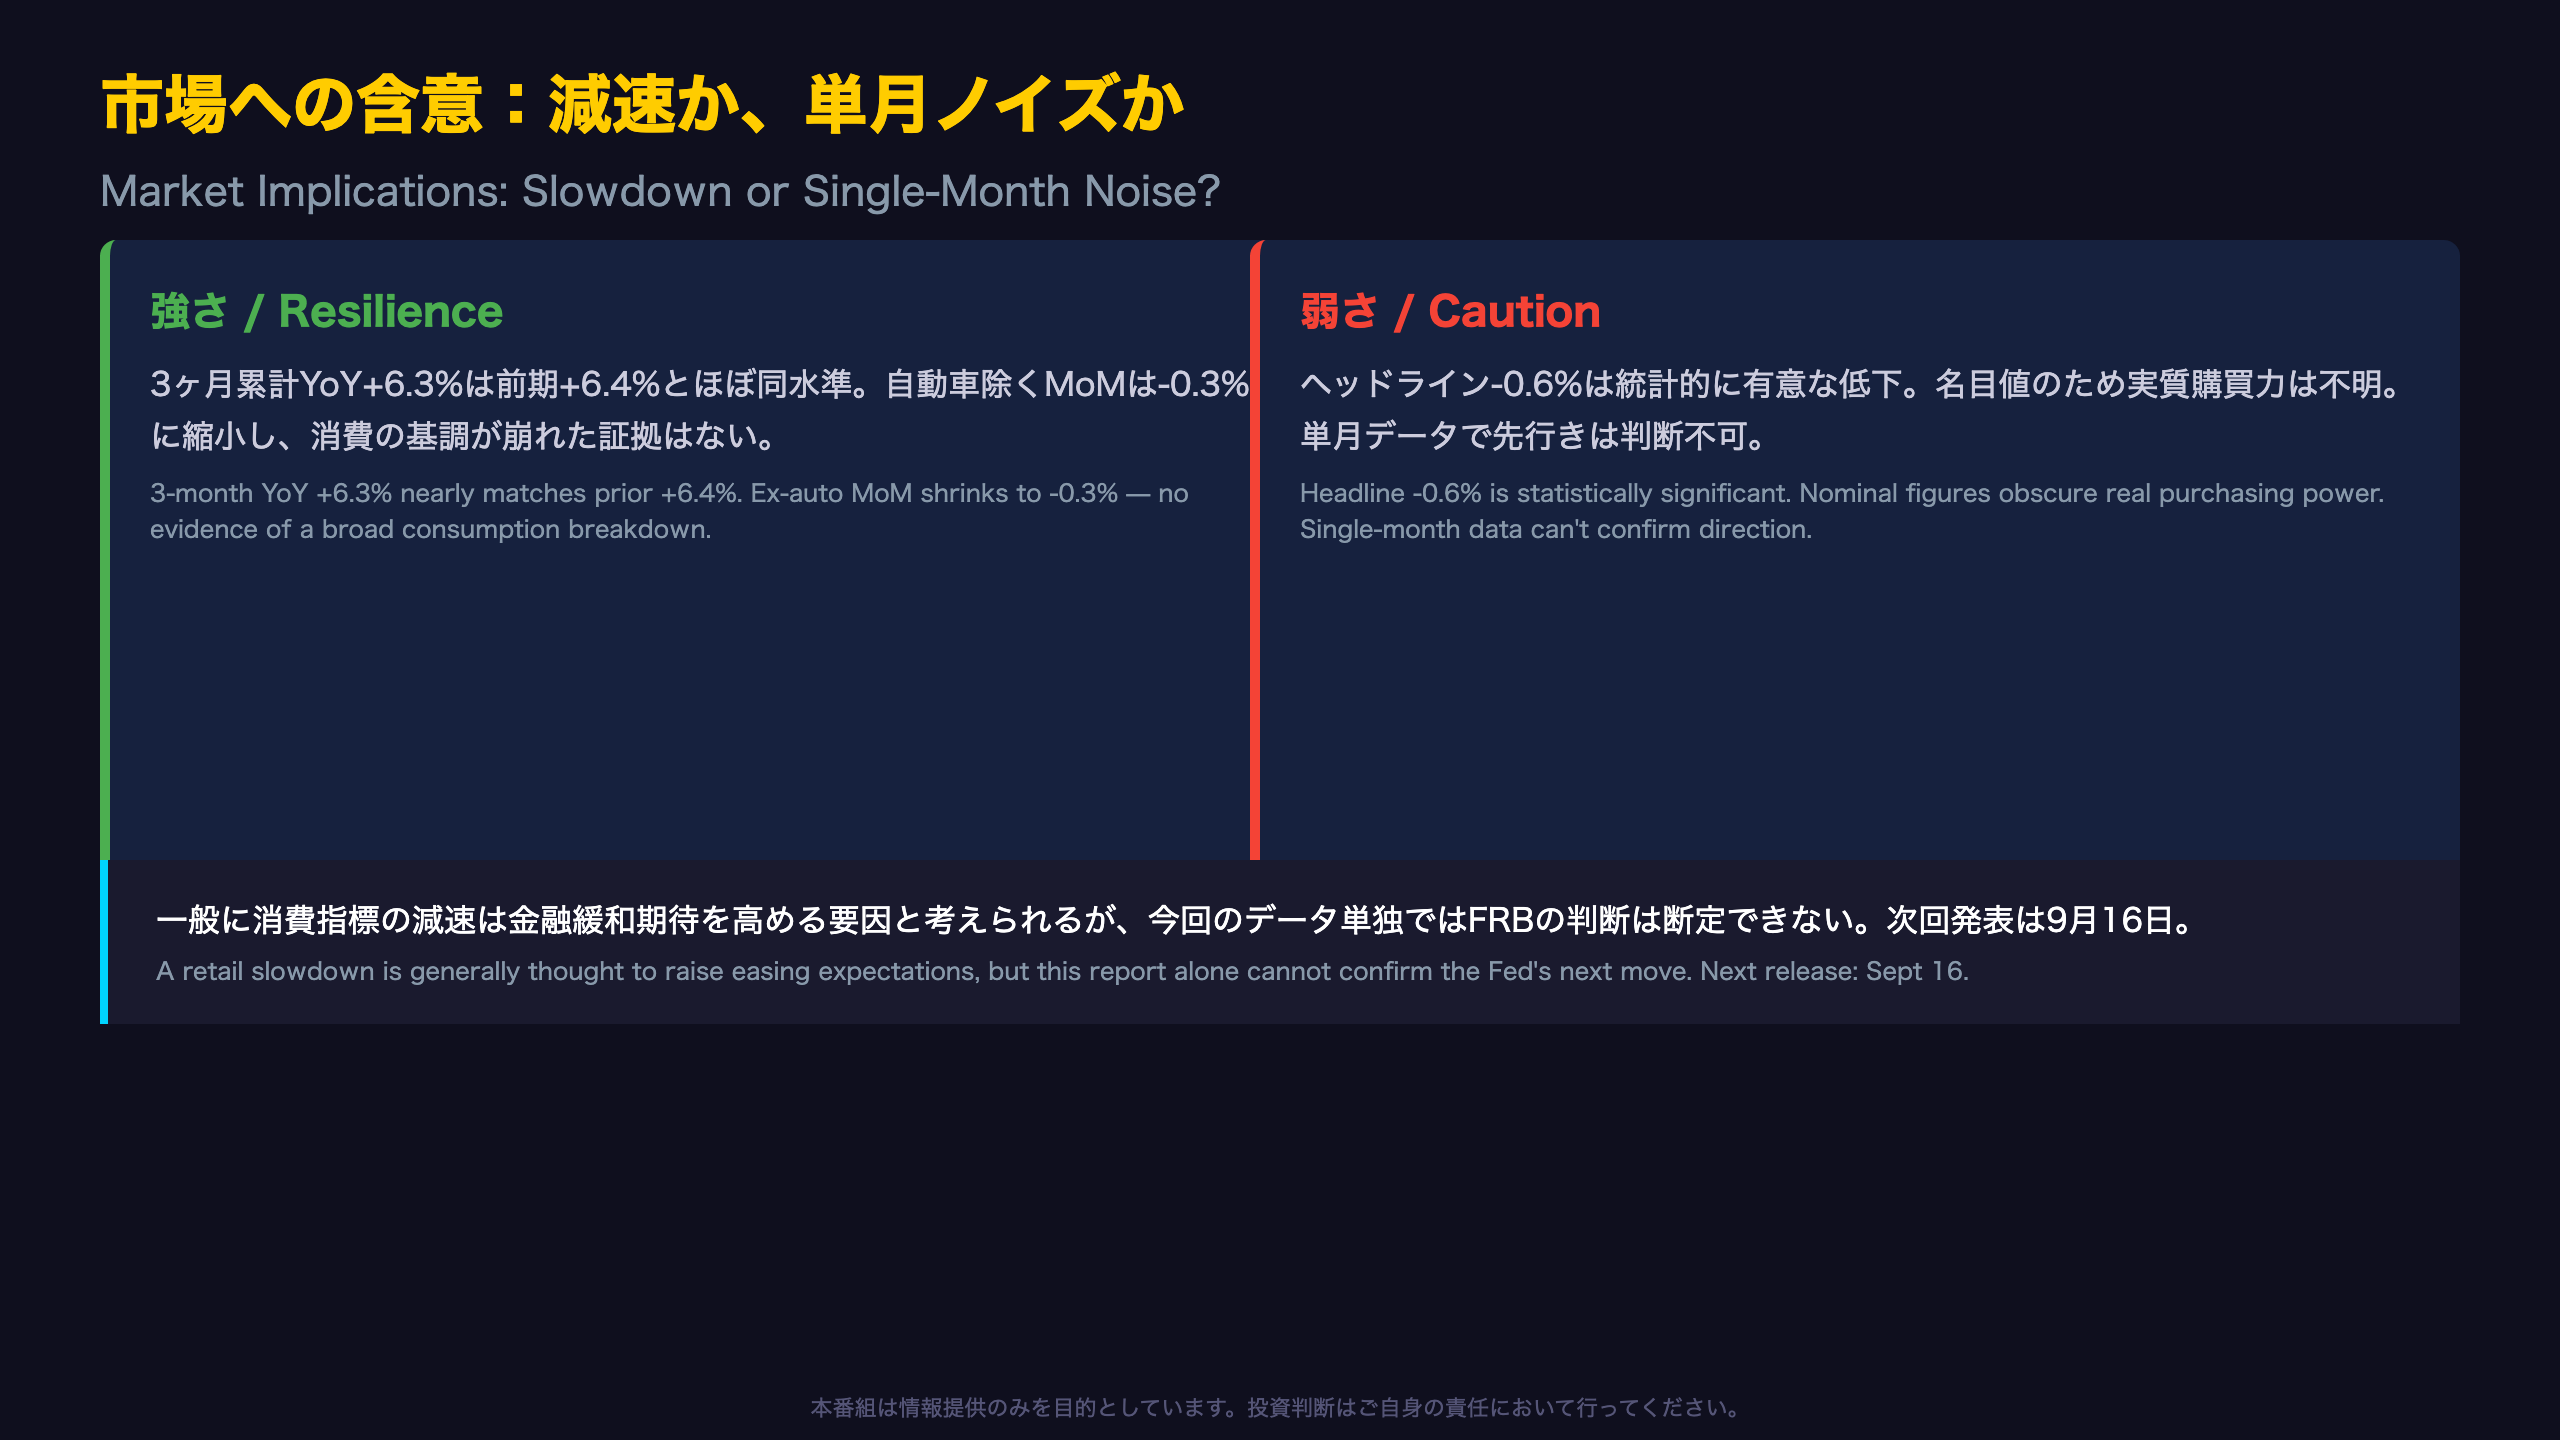
- The headline -0.6% MoM decline is statistically significant (90% CI does not include zero)
- Excluding autos, the decline shrinks to -0.3%, showing the drop is concentrated in one category
- The 3-month YoY trend of +6.3% is essentially unchanged from the prior +6.4% reading
What This Data Cannot Tell You
- How the Federal Reserve will interpret this at its next policy meeting — this report contains no monetary policy commentary
- Real (inflation-adjusted) consumption trends, since figures are nominal and not price-adjusted — unlike real PCE, the Fed’s preferred consumption gauge
- Whether July’s dip is the start of a trend or a one-off, since only a single data point confirms the reversal
Looking Ahead
The next Advance Monthly Retail report, covering August 2026, is scheduled for September 16, 2026 at 8:30 AM EDT. A benchmark revision incorporating the 2023-2024 Annual Integrated Economic Survey is also tentatively due September 28, which could revise today’s figures. For international investors comparing this to their own domestic retail data, remember this U.S. series is a leading, frequently-revised indicator — useful for direction, but each single print should be weighed against its confidence interval, not treated as definitive.
As a general principle, a retail slowdown is often thought to raise the odds of monetary easing — but that link cannot be confirmed from this report alone, and should not be treated as this data’s direct implication.
Disclaimer: This article is for informational purposes only. All investment decisions are made solely at your own risk.







