📺 Watch the Full Video Analysis
This article was automatically generated by the NFC Market Live AI analysis system. (Updated: 2026-08-12 21:40 JST)
📄 Primary Source
U.S. Bureau of Labor Statistics
https://www.bls.gov/news.release/cpi.htm
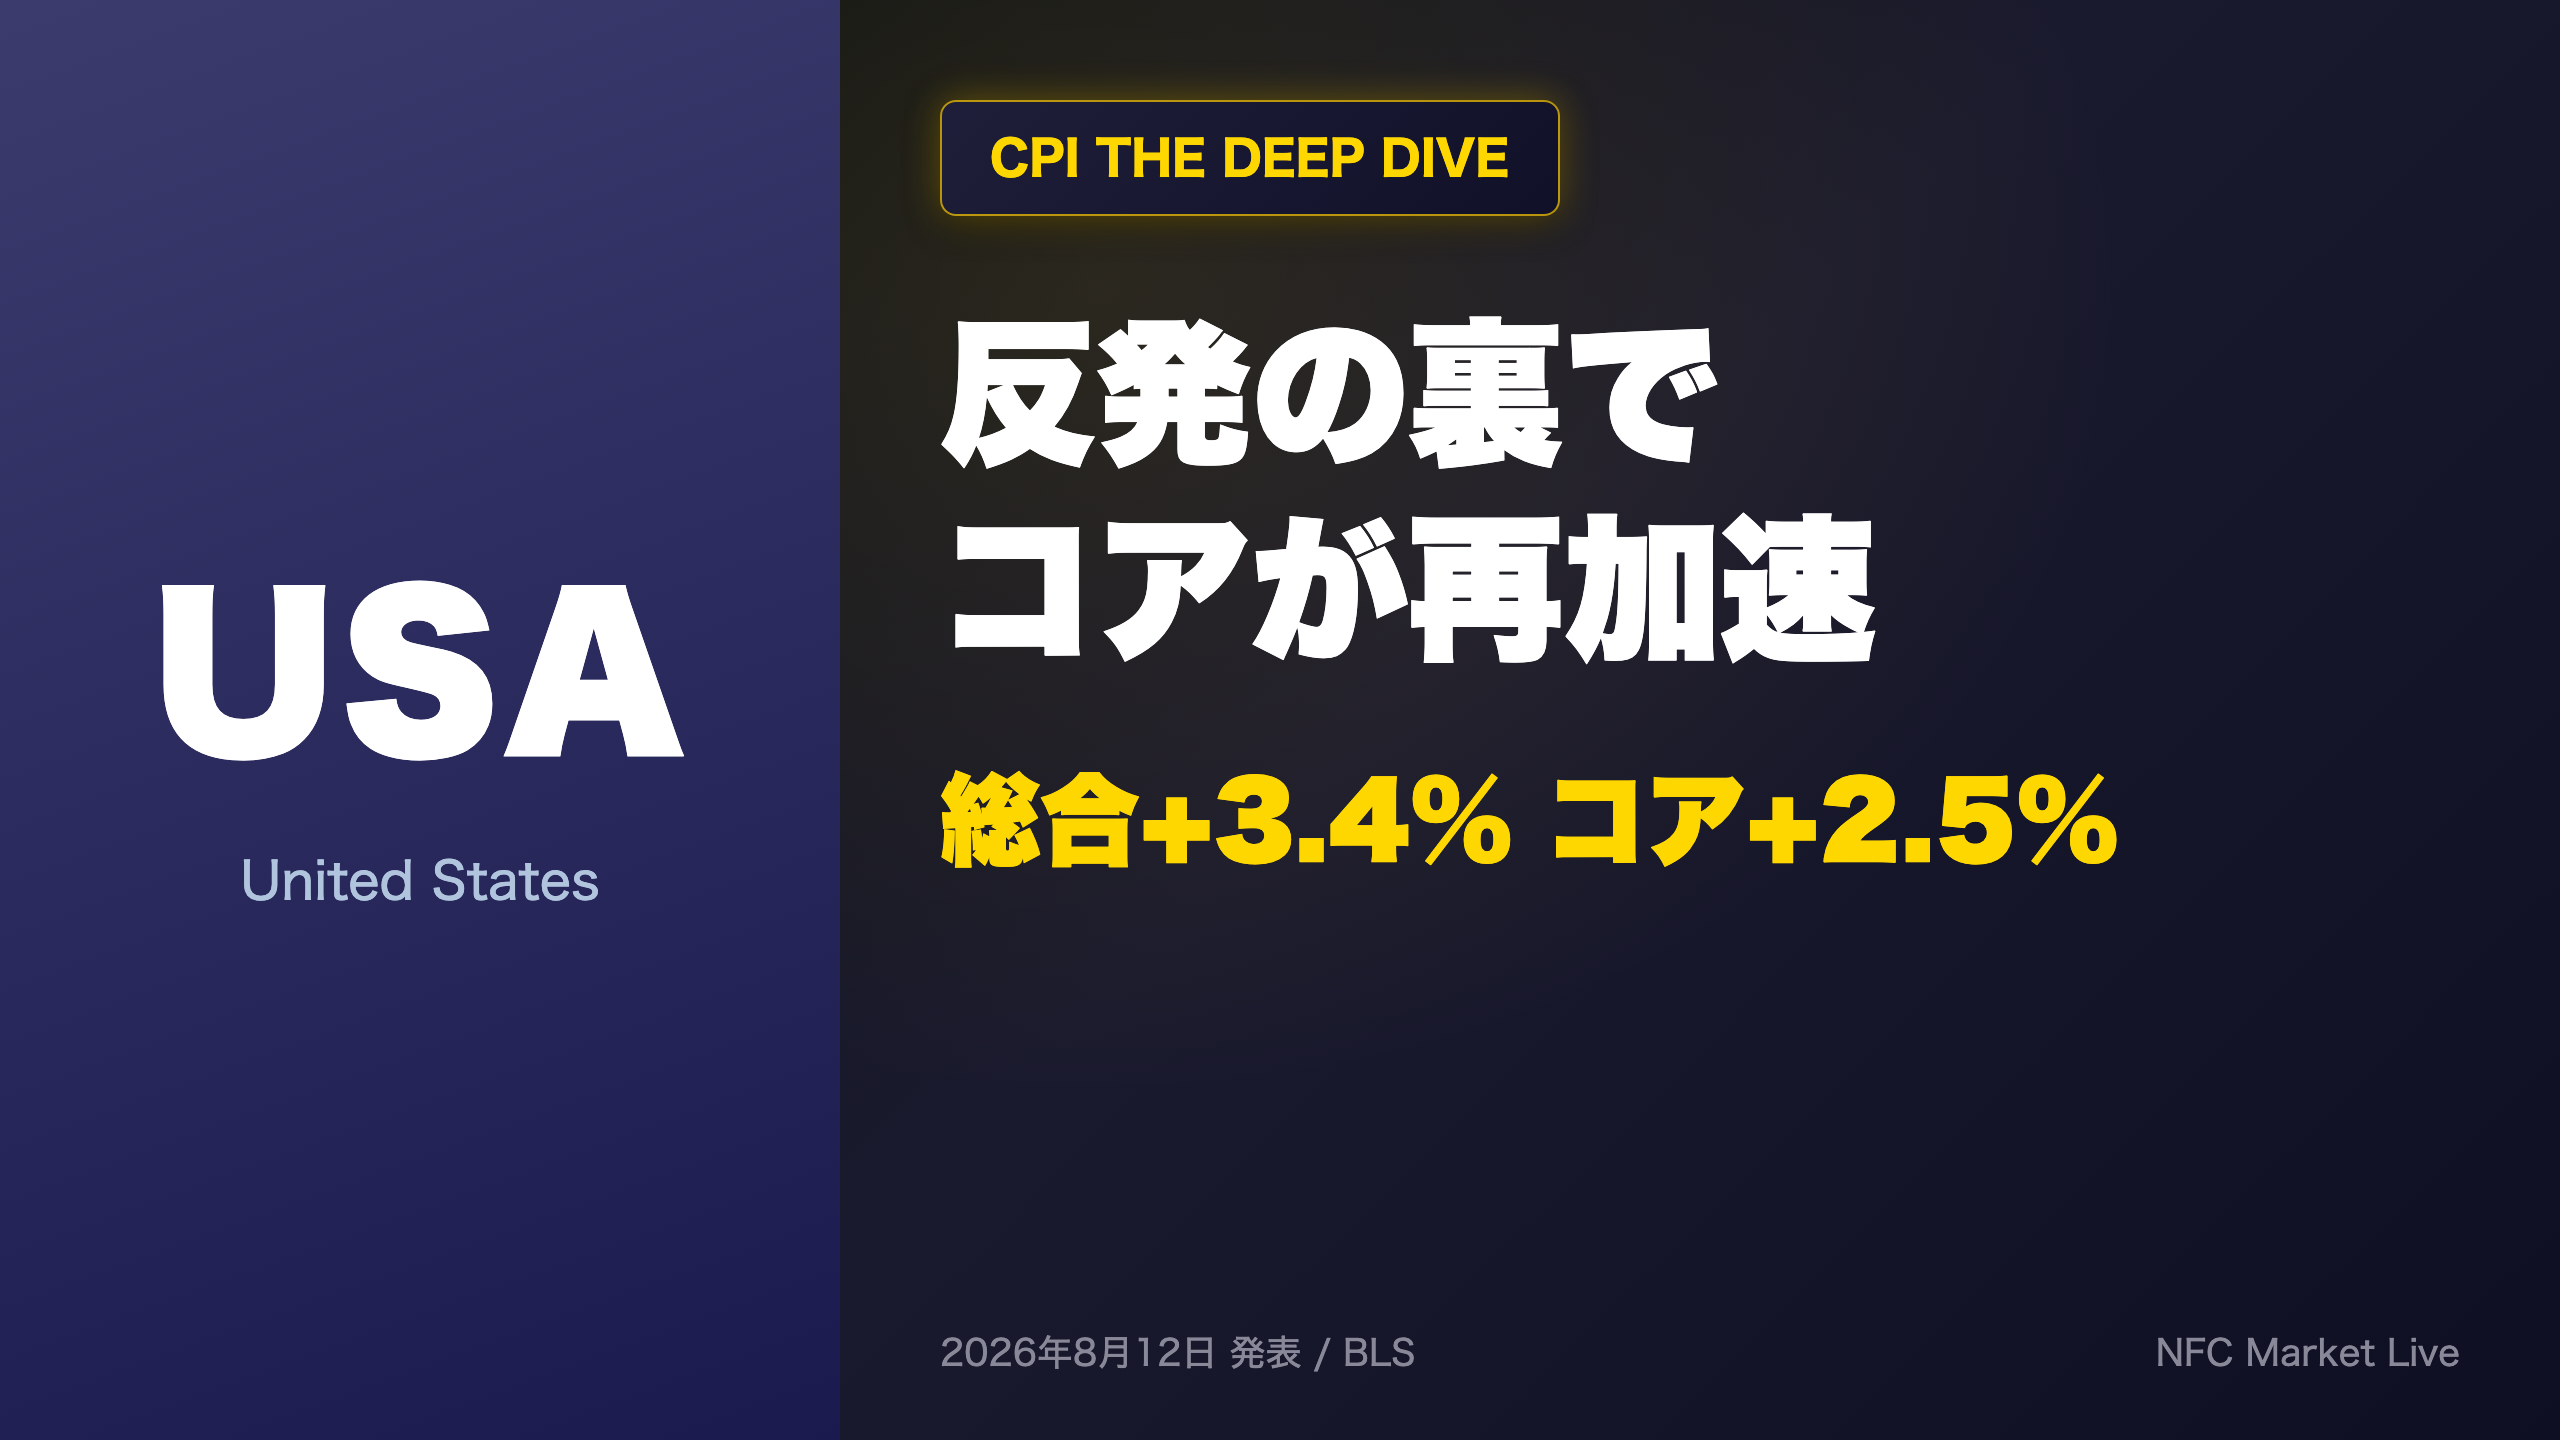
📊 Deep dive into the July 2026 US CPI report from the Bureau of Labor Statistics.
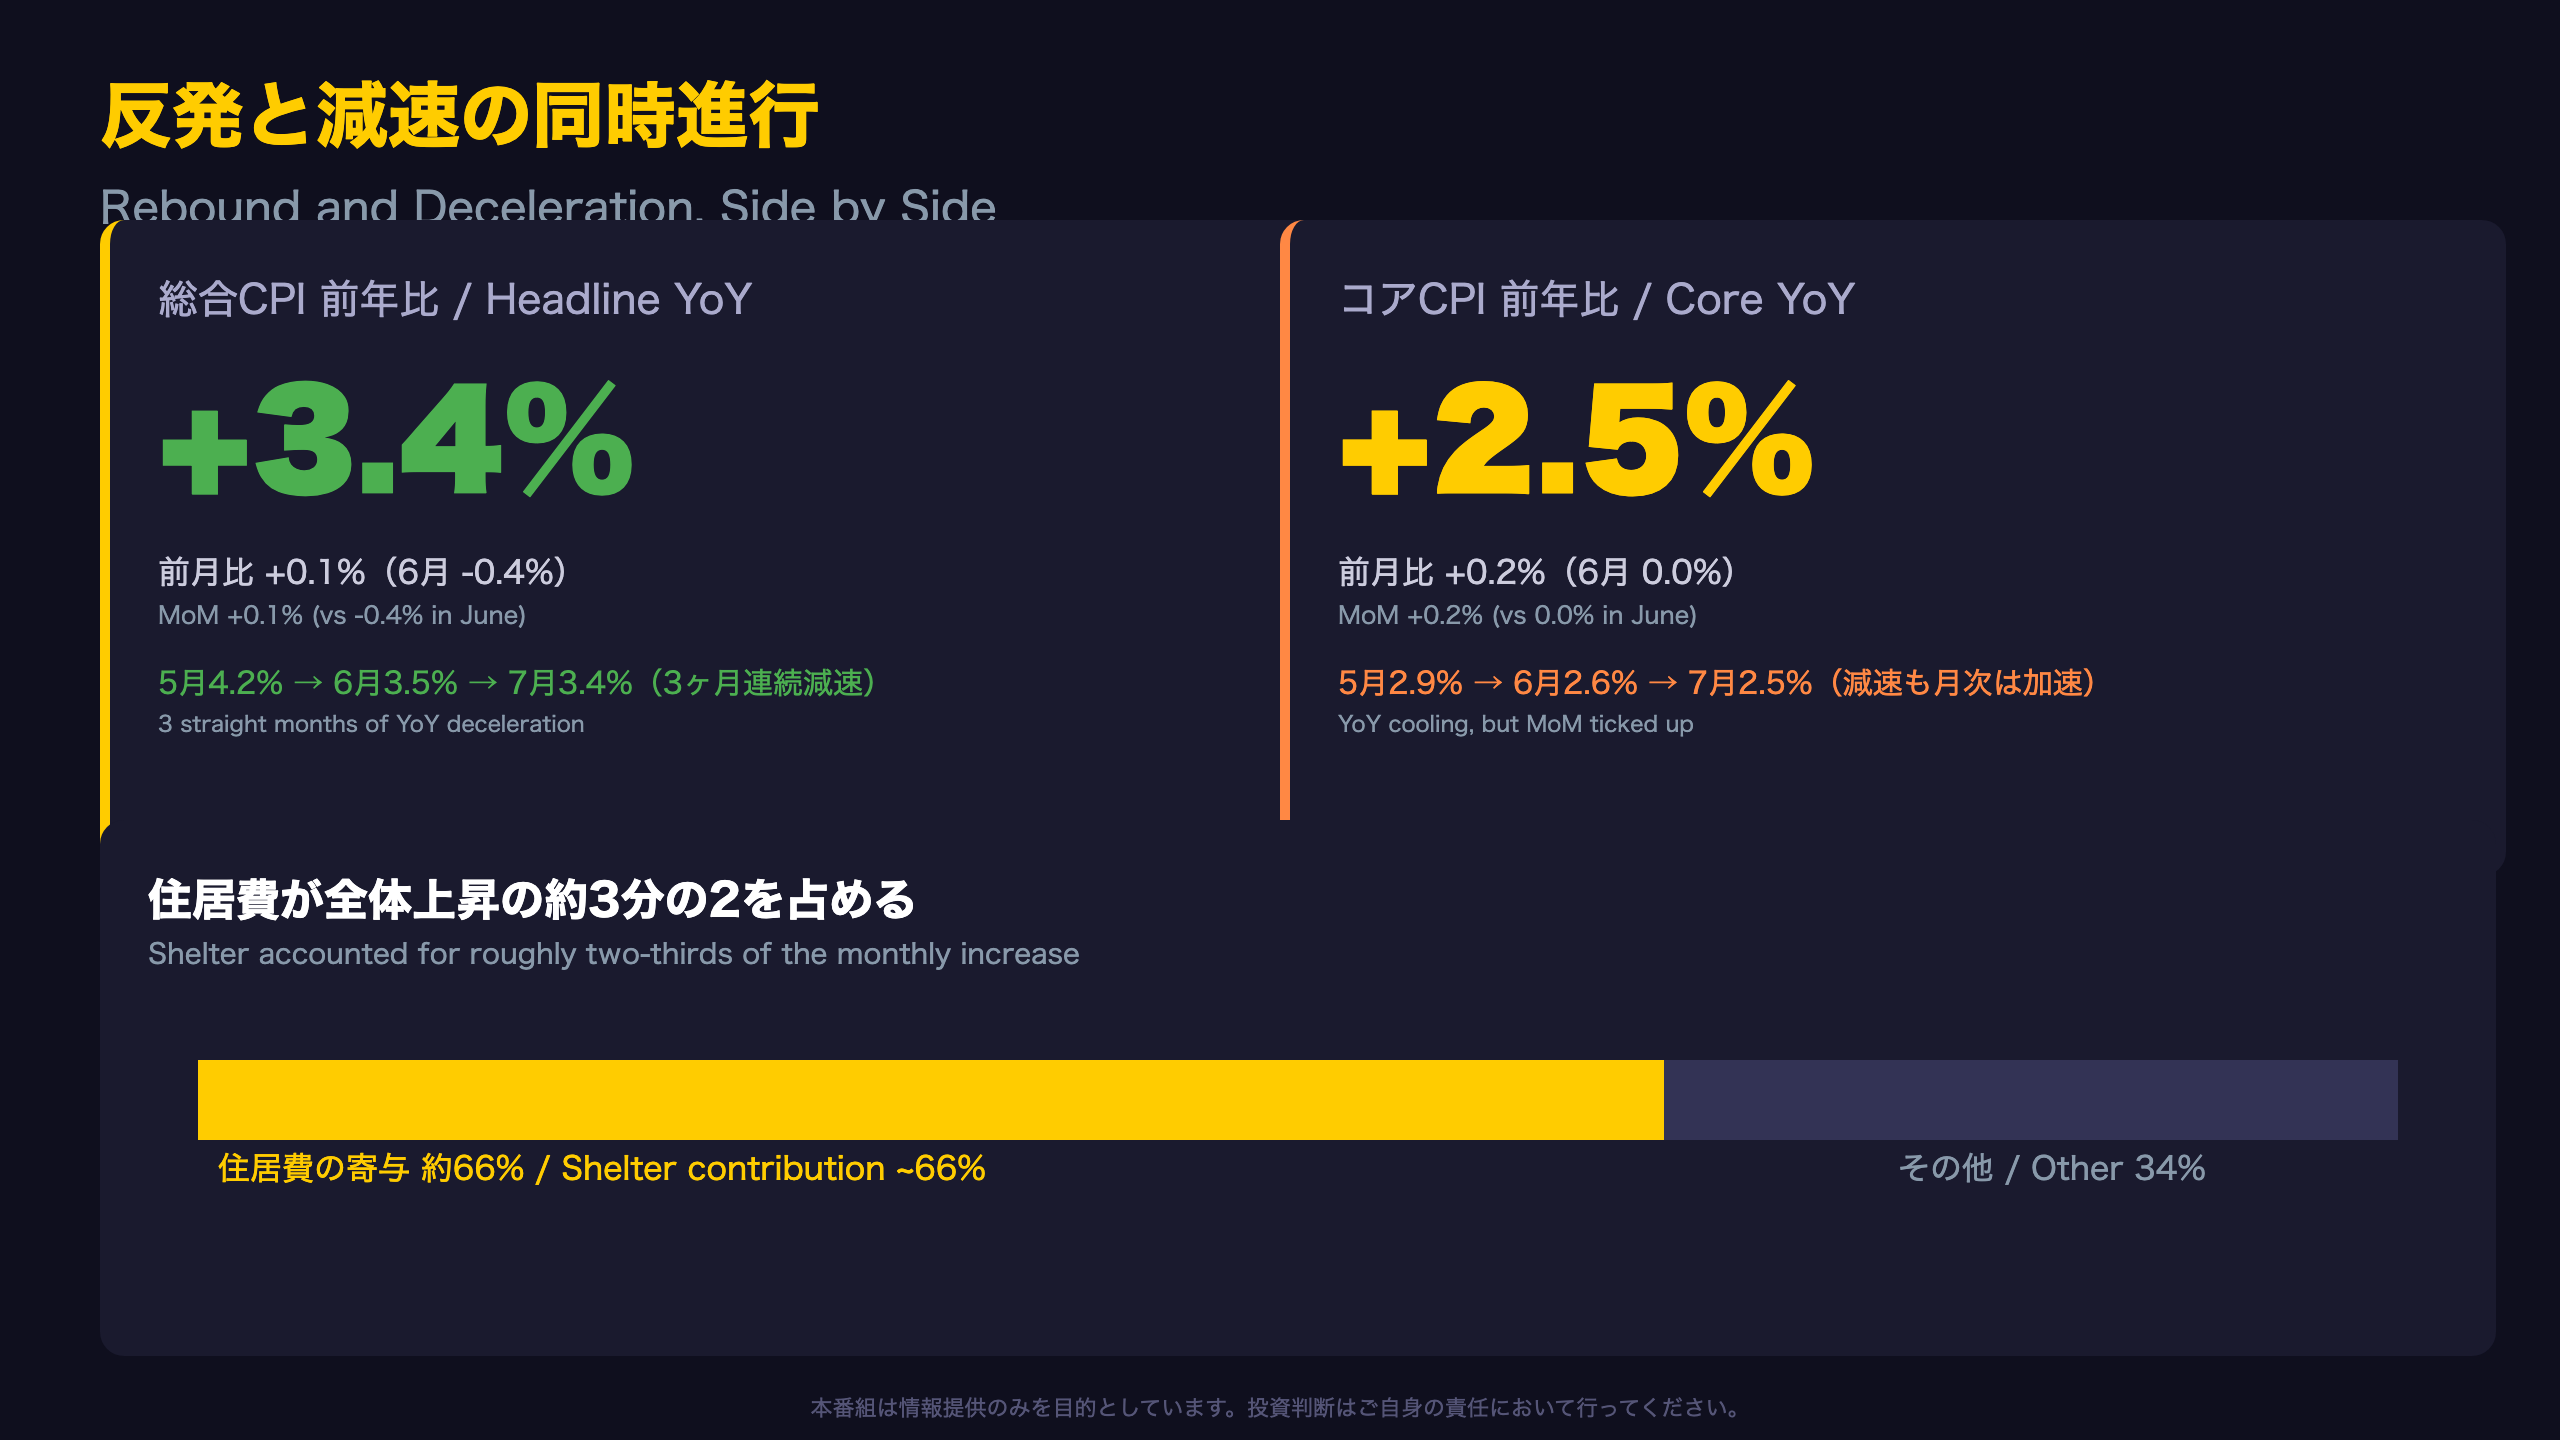
Headline CPI rose +0.1% MoM, rebounding from June’s -0.4% decline; YoY cooled to +3.4%, the third consecutive month of deceleration.
Core CPI YoY eased to +2.5%, but MoM reaccelerated to +0.2% after June’s flat reading.
📈 Shelter accounted for roughly two-thirds of the monthly all-items increase.
📉 The energy index’s slower rate of decline was the main driver of the headline rebound.
💡 The data suggests the path to the Fed’s 2% target remains uneven.
Next CPI release: September 11.
反発と減速の同時進行——7月CPIの全体像
Why the “Rebound” Is More Complicated Than It Looks
At first glance, July’s +0.1% month-over-month CPI reading looks like an improvement from June’s -0.4% decline. But reading the BLS release closely reveals this was largely a mechanical effect from a slowdown in the pace of energy price declines, not a sign of strengthening demand.
The Bureau of Labor Statistics (BLS) is the U.S. federal agency responsible for producing the CPI, the primary gauge of U.S. consumer inflation, analogous to Japan’s CPI compiled by the Ministry of Internal Affairs and Communications. Unlike Japan’s headline CPI, the U.S. report places heavy emphasis on the “core” measure (CPI less food and energy), which the Federal Reserve watches closely, though the Fed’s preferred gauge is actually the PCE price index, not CPI.
June’s energy index fell -5.7% month-over-month — the largest single-month drop since April 2020 — which dragged the headline index sharply lower. In July, that decline slowed to just -1.5%, producing a statistical “rebound” in the headline number.
Three Straight Months of Deceleration
Headline CPI year-over-year has now cooled for three consecutive months: 4.2% in May, 3.5% in June, and 3.4% in July. This suggests (though cannot be definitively confirmed from a single report) that tariff- or supply-related price pressures from earlier in 2026 may be fading.
Market Implications and What’s Next
For U.S. equity and bond investors, this data offers a mixed signal: continued disinflation supports the case for eventual Fed easing, but the uptick in core month-over-month inflation (discussed further in later slides) complicates the timing. The next CPI release is scheduled for September 11, 2026, and will be critical in determining whether July’s core reacceleration was noise or a genuine shift.
エネルギー価格急落一巡の正体
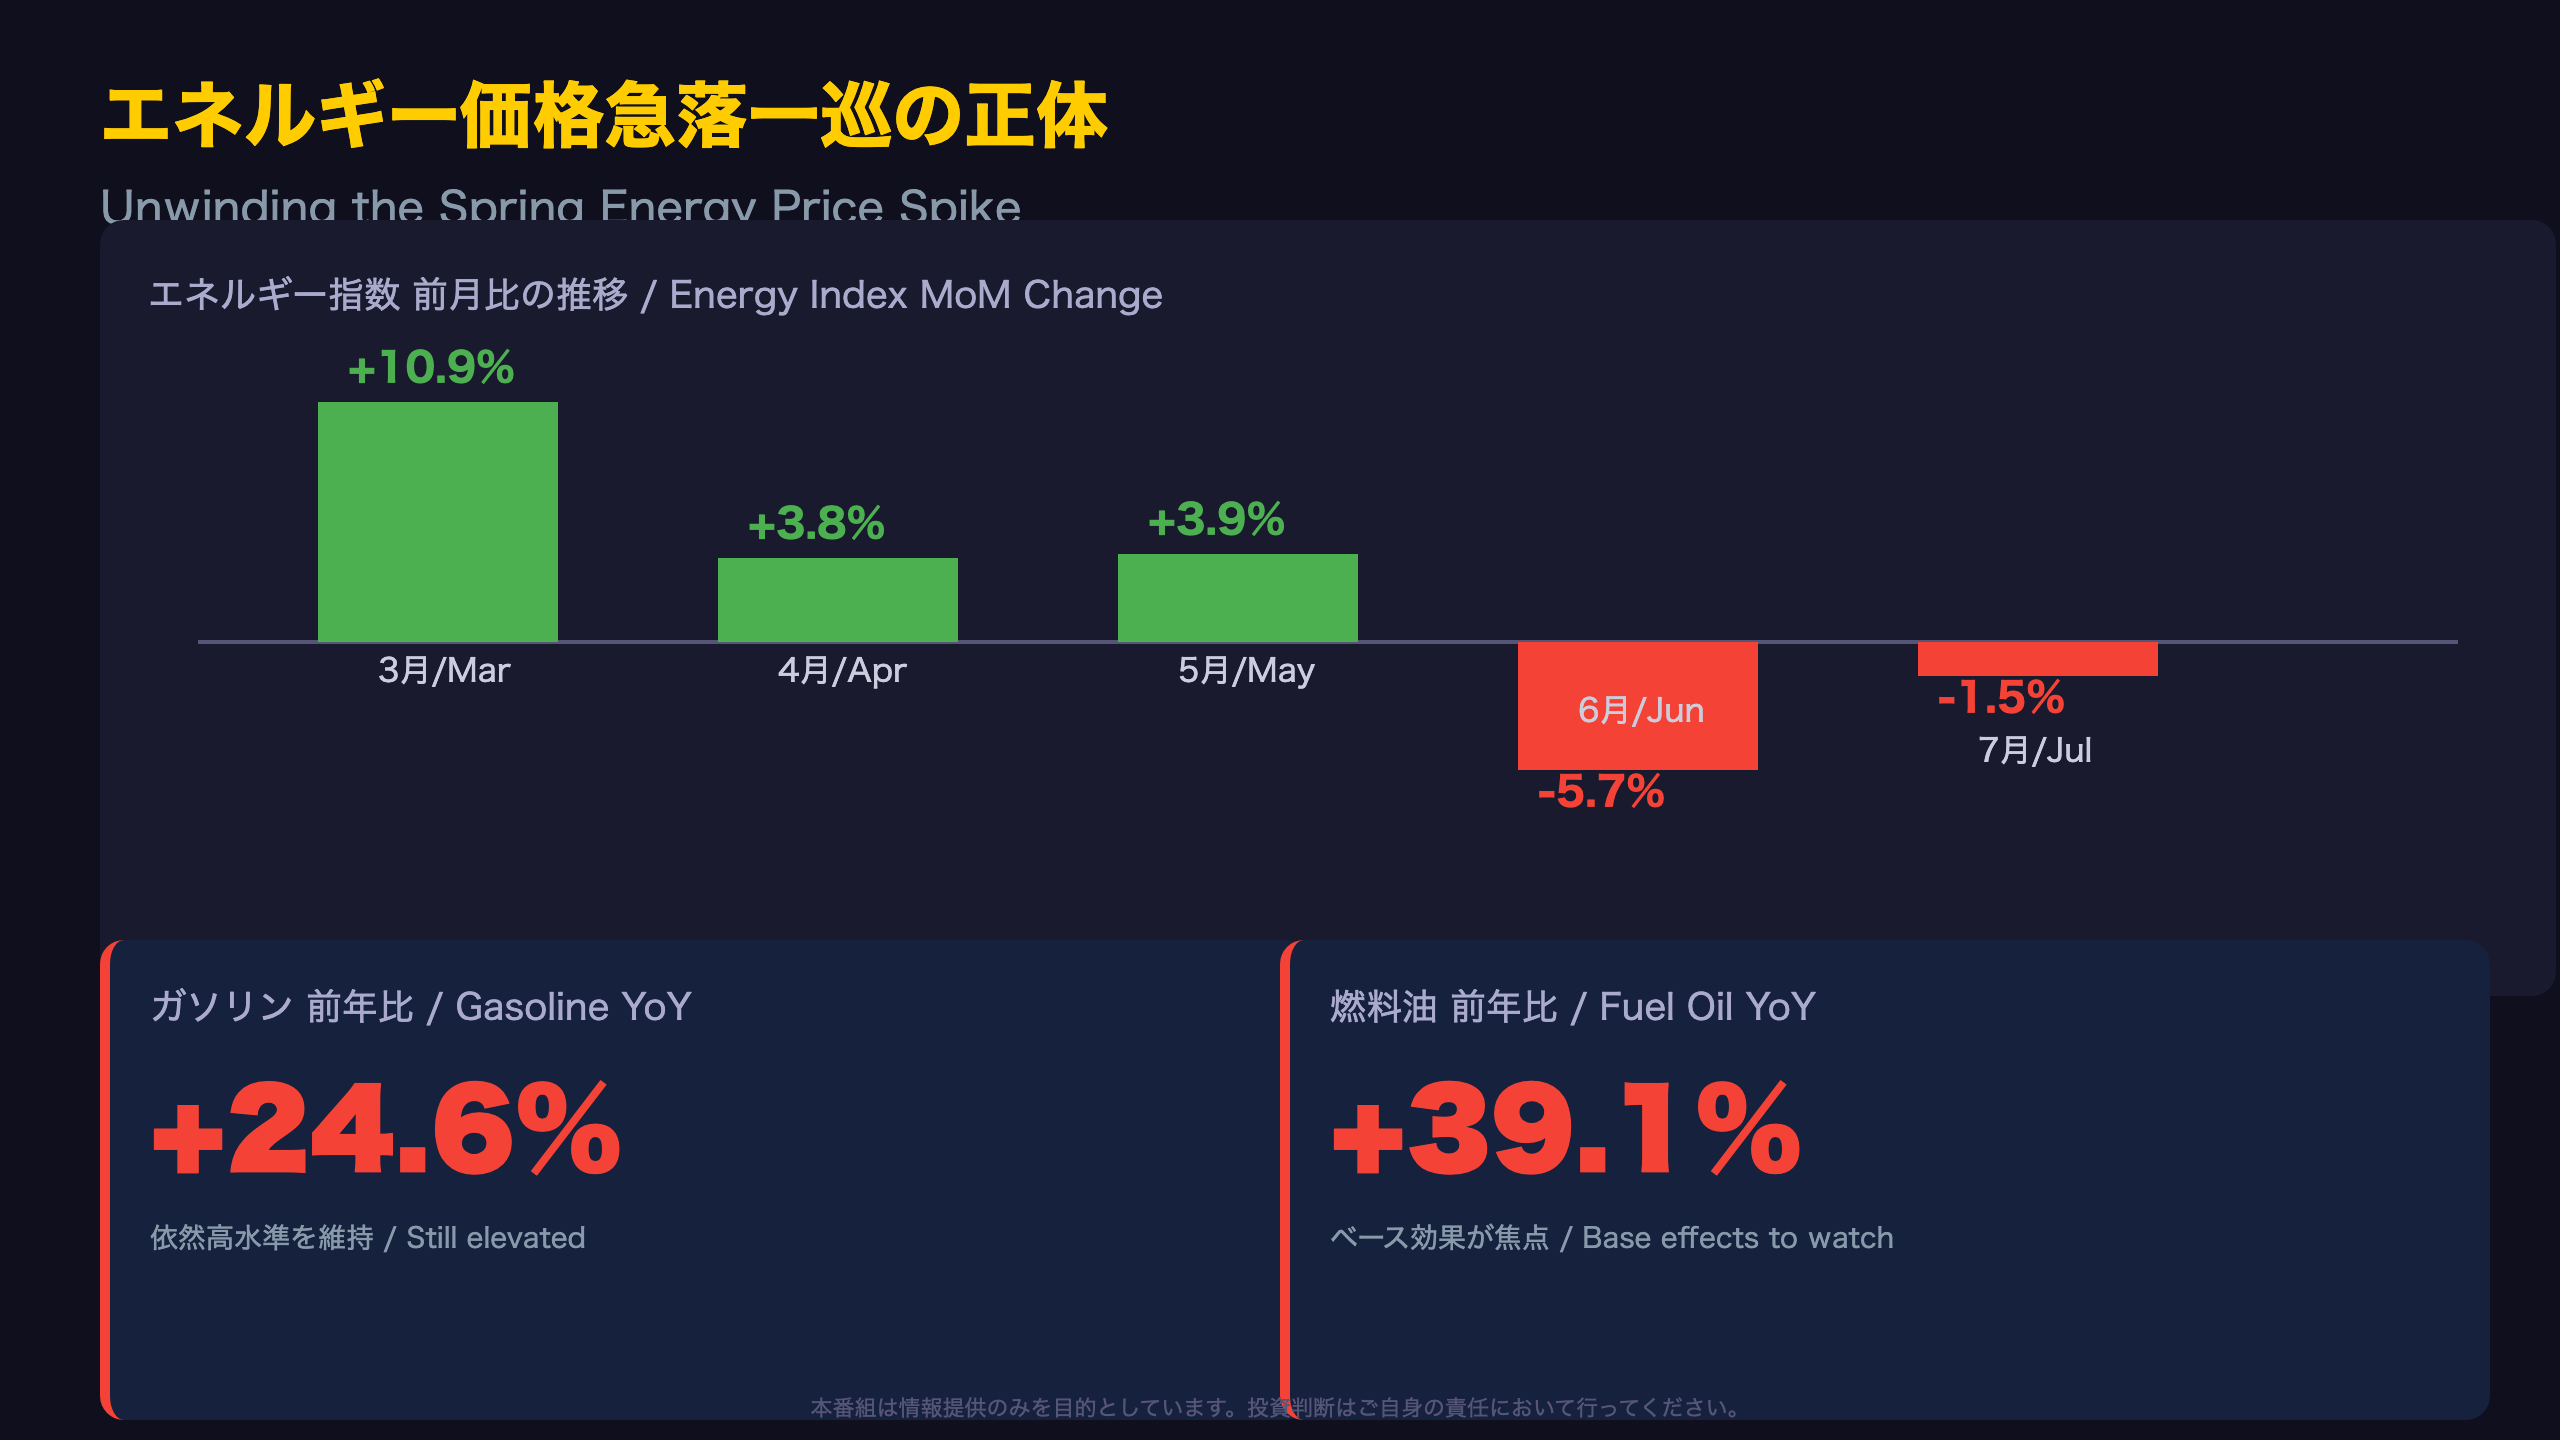
An Unusually Volatile Energy Trajectory
Lining up the energy index’s month-over-month changes over the past five months reveals just how extreme the swings have been:
| Month | MoM Change |
|---|---|
| March | +10.9% |
| April | +3.8% |
| May | +3.9% |
| June | -5.7% |
| July | -1.5% |
The March spike of +10.9% wasn’t specifically flagged in BLS commentary, but the subsequent June plunge (-5.7%, the largest since April 2020) was explicitly highlighted as noteworthy.
For context, U.S. CPI’s energy component includes gasoline, electricity, and natural gas — broadly comparable to Japan’s energy sub-index in the Japanese CPI, though weightings differ. Gasoline carries a much larger relative weight in the U.S. basket (roughly 3.85% of total CPI) compared to Japan, making U.S. headline inflation more sensitive to oil price swings.
Drilling Into Sub-Indices: Gasoline and Fuel Oil
Gasoline’s year-over-year change stood at +24.6% in July. Fuel oil was even more extreme, up 39.1% year-over-year. These elevated readings are largely residual effects from the March-May spike, and base effects (comparisons against year-ago levels) will be the key swing factor over coming months.
Two Competing Interpretations
The optimistic read: the slowdown in energy’s rate of decline represents the fading of a temporary disruption, paving the way for calmer readings ahead. The more cautious view: the underlying drivers of March’s spike — potentially tariffs or supply constraints — haven’t been fully explained, leaving open the risk of renewed volatility.
Looking Ahead
August gasoline price trends will heavily influence the next headline CPI print, due September 11, 2026. This will be a key test of whether the current energy price trajectory has genuinely stabilized.
コアインフレのモメンタム——減速の裏の再加速
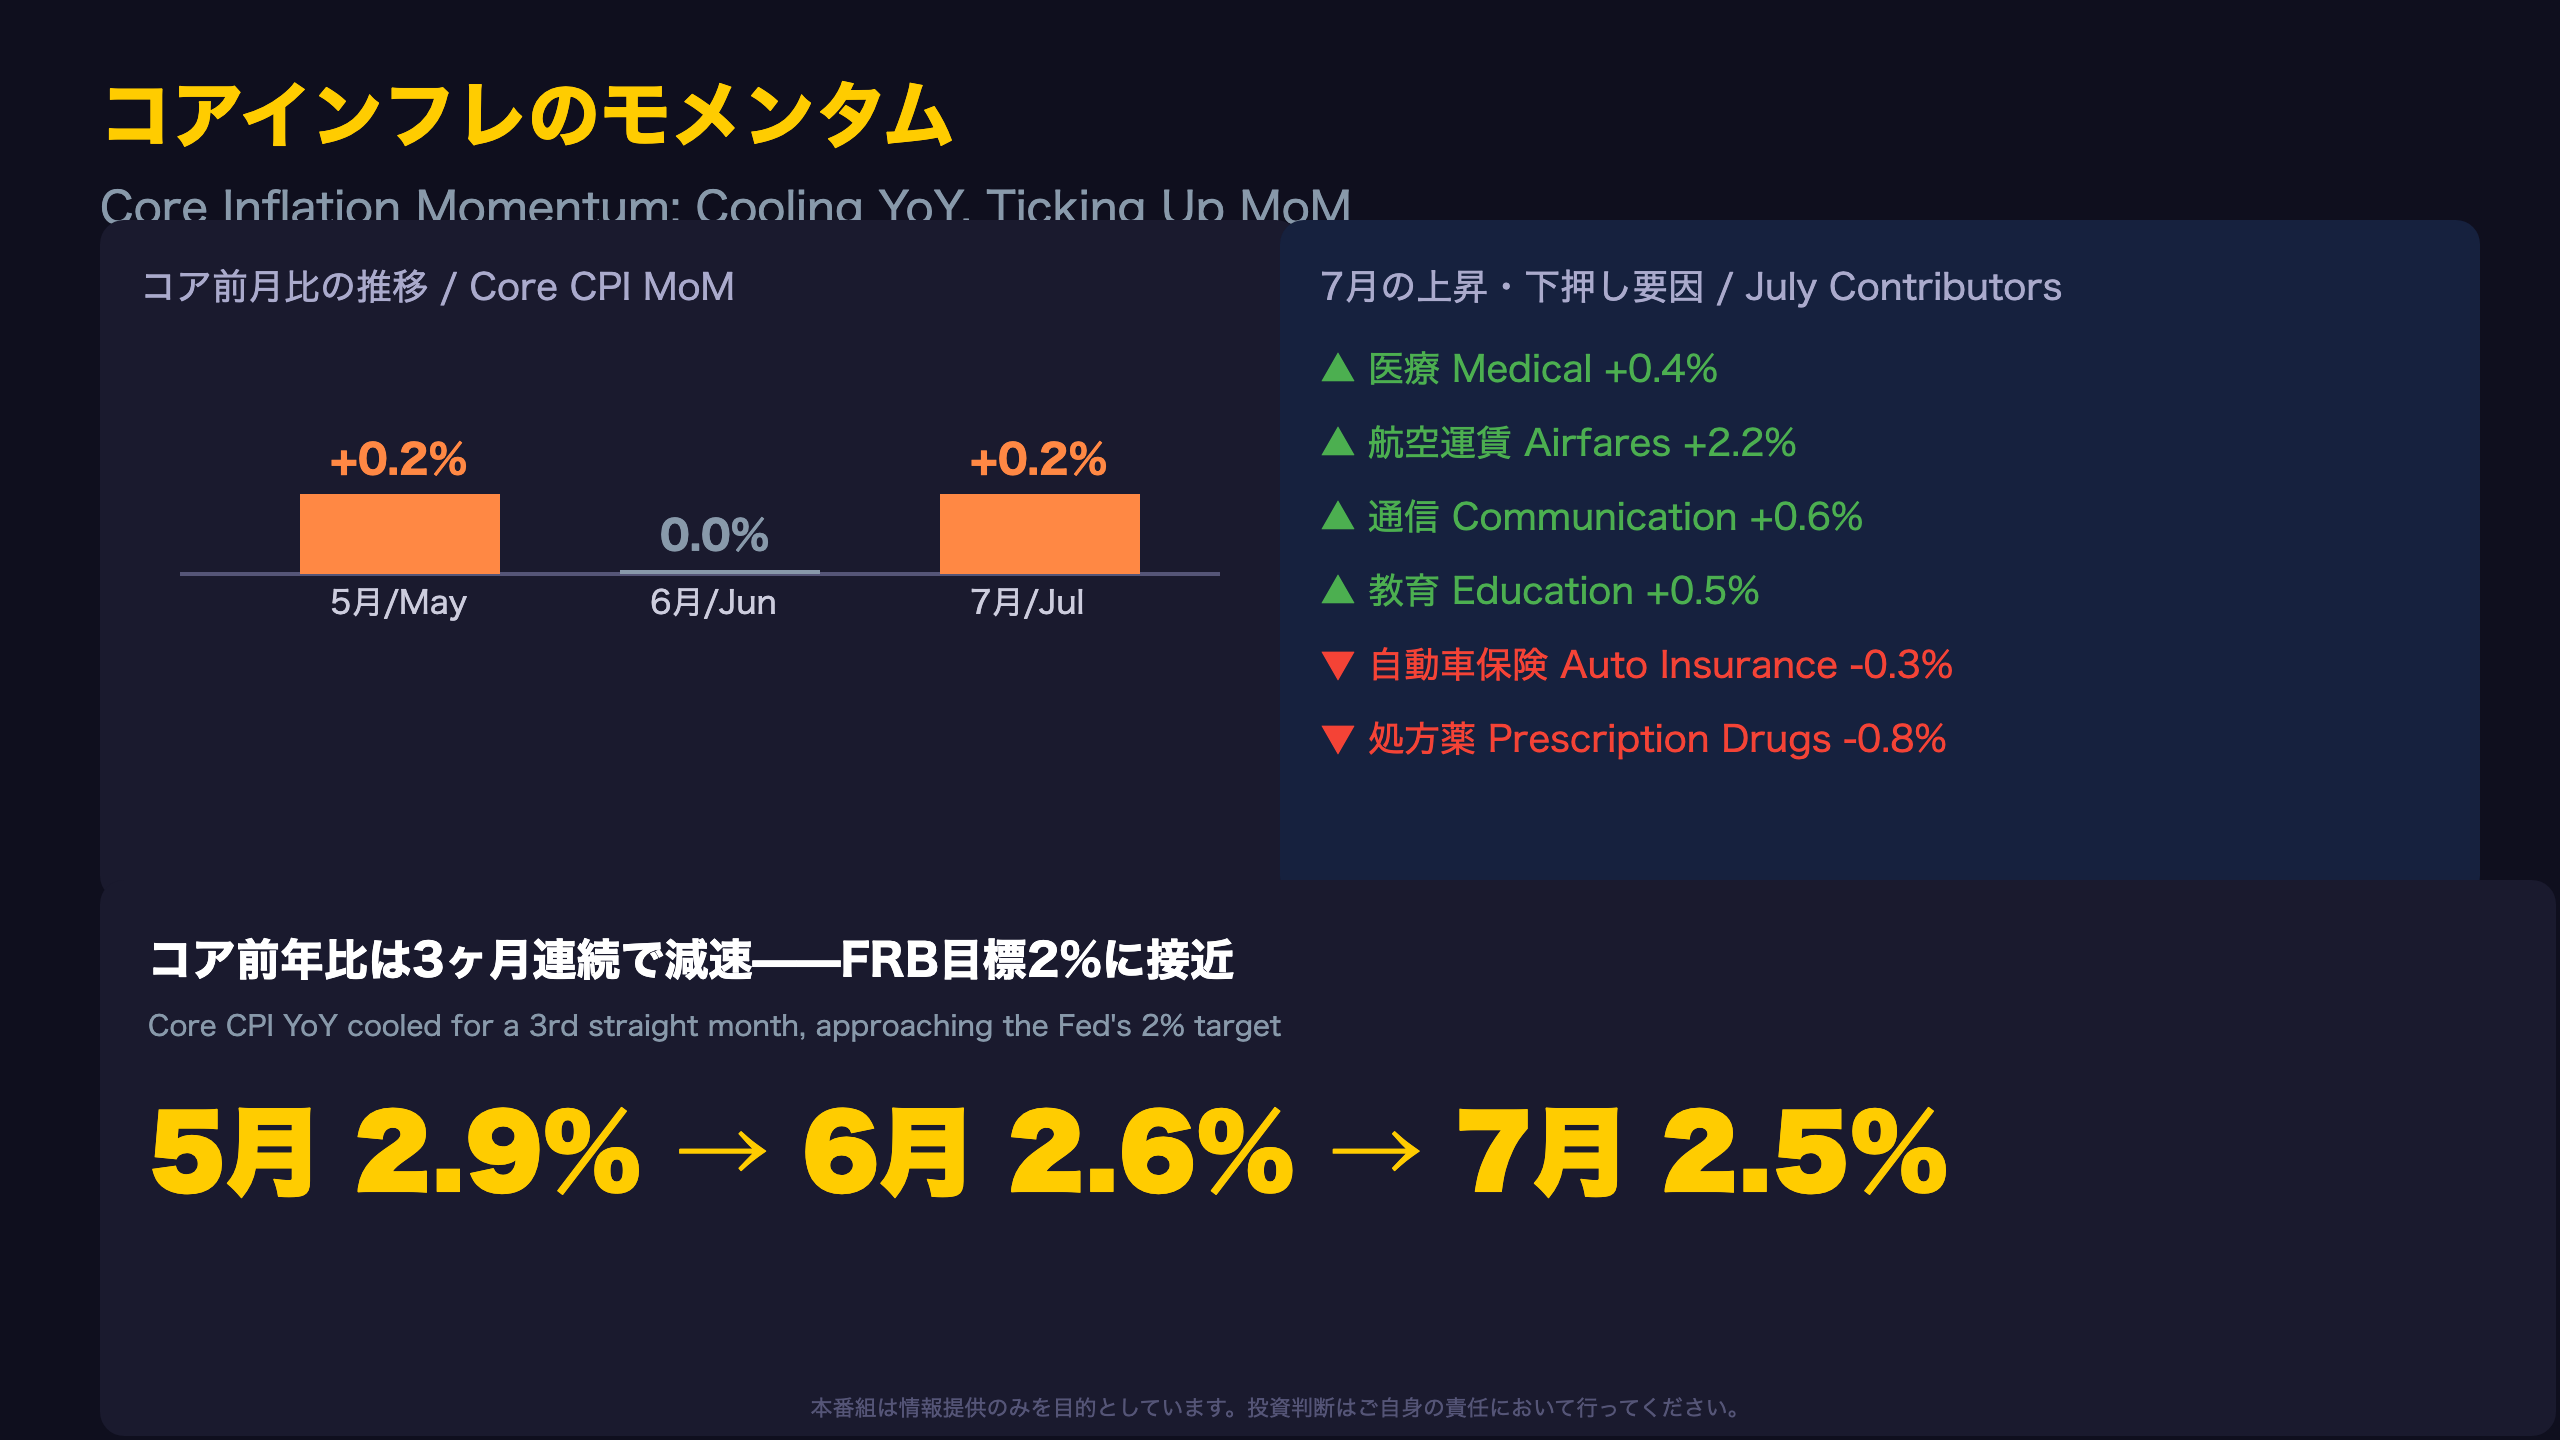
Two Different Yardsticks: YoY vs MoM
Core CPI’s year-over-year trajectory (2.9% in May → 2.6% in June → 2.5% in July) tells a clean disinflation story. But the month-over-month numbers reveal a less uniform picture.
| Month | Core MoM |
|---|---|
| May | +0.2% |
| June | 0.0% |
| July | +0.2% |
The BLS report explicitly states: “The index for all items less food and energy rose 0.2 percent after being unchanged in June.”
For international readers unfamiliar with U.S. CPI conventions: “core CPI” (excluding food and energy) is the closest U.S. analog to Japan’s “core-core CPI” (excluding fresh food and energy), though the exact composition differs. Notably, the Federal Reserve’s actual preferred inflation gauge is the core PCE price index, not core CPI — the two often diverge modestly due to different weighting methodologies (e.g., PCE gives less weight to shelter).
Breaking Down the Sub-Indices
Categories contributing to July’s increase: medical care (+0.4%), airline fares (+2.2%), communication (+0.6%), education (+0.5%), recreation (+0.2%), and used cars (+0.4%).
Categories acting as a drag: motor vehicle insurance (-0.3%) and prescription drugs (-0.8%).
The airline fares jump of 2.2% in a single month is particularly notable — this category is highly sensitive to fuel costs and seasonal factors, so it would be premature to treat this alone as evidence of broader inflationary pressure.
Two Competing Reads
The bullish interpretation: core’s year-over-year trend remains firmly on a disinflationary path, and July’s monthly uptick is just noise. The bearish interpretation: June’s flat reading was itself the anomaly, and July’s 0.2% represents a return to a “normal” underlying pace.
What to Watch Next
Whether core’s month-over-month pace settles back down or continues running around 0.2% in August’s data will be a key signal for gauging the Fed’s timeline for potential rate cuts.
住居費の粘着性——押し上げの主因を解剖する
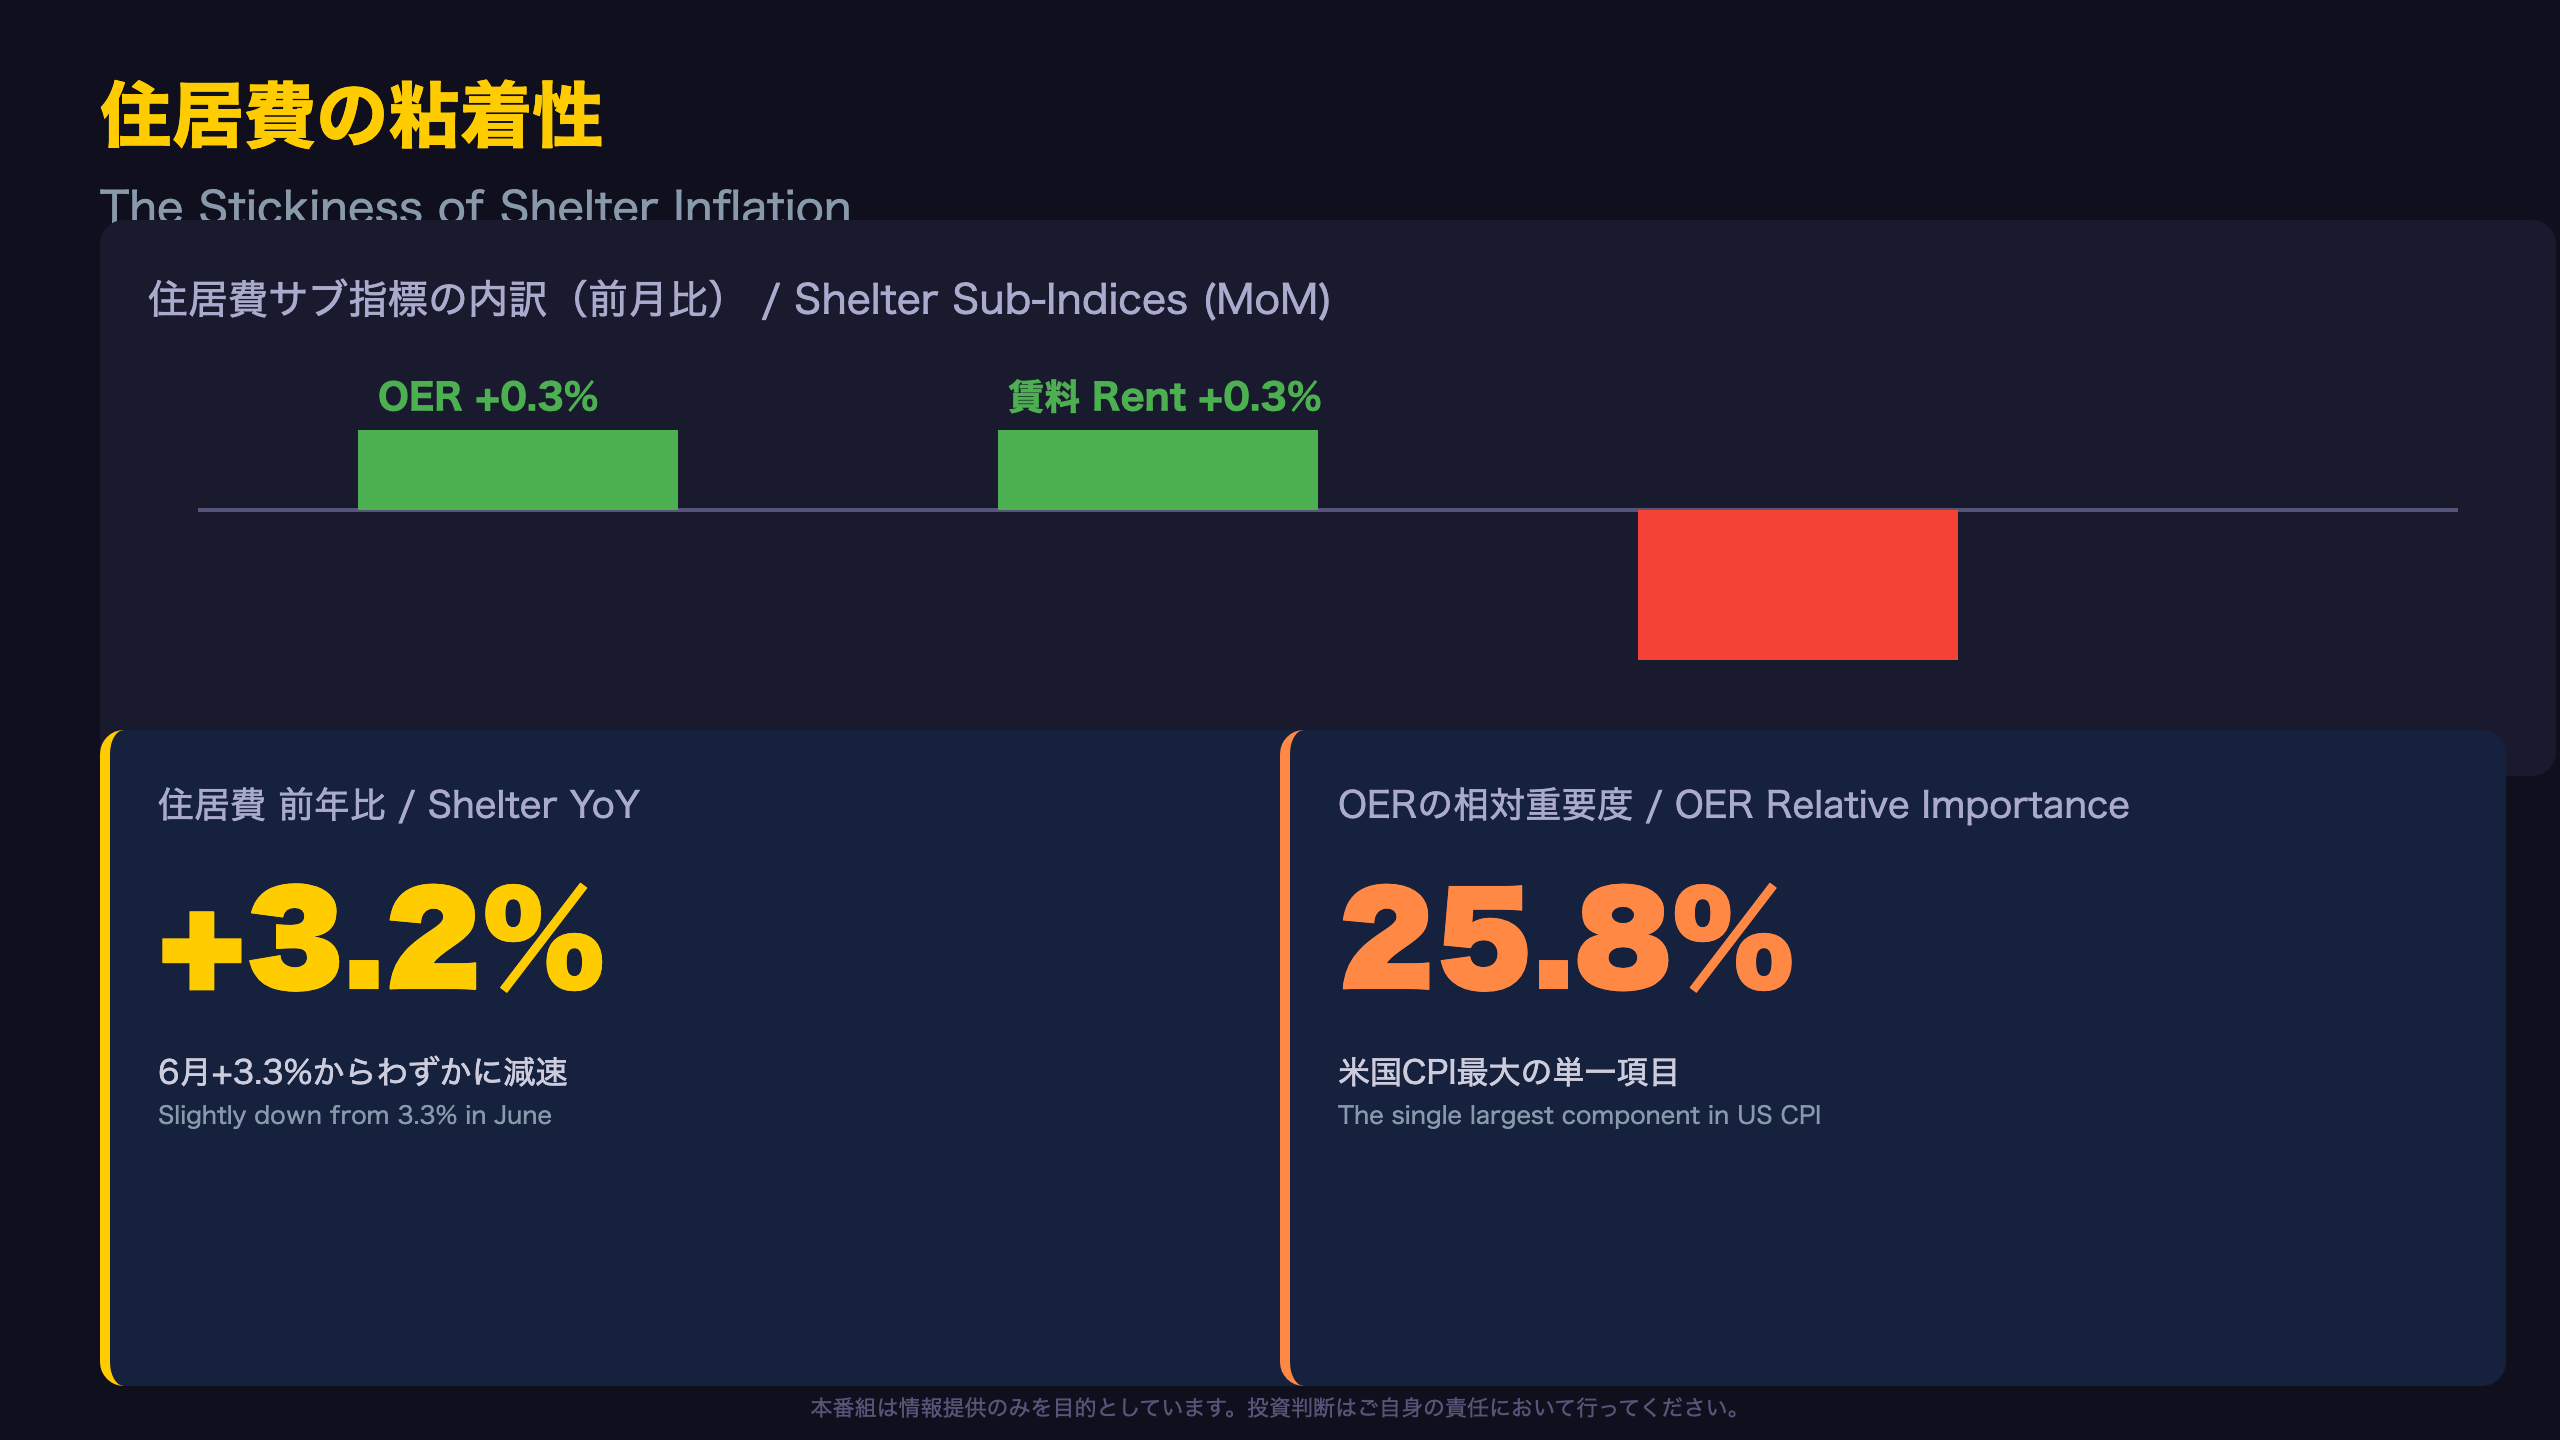
Shelter’s Two-Speed Structure
At +0.1% month-over-month, the shelter index appears calm on the surface, but the underlying components tell a more nuanced story. Core rental measures remain stubbornly firm, while lodging away from home (hotels and similar) fell sharply.
| Component | MoM | YoY |
|---|---|---|
| Owners’ Equivalent Rent (OER) | +0.3% | +3.2% |
| Rent of primary residence | +0.3% | +2.9% |
| Lodging away from home | -2.8% | +3.0% |
For readers unfamiliar with U.S. CPI methodology: Owners’ Equivalent Rent (OER) is a unique and somewhat controversial concept — it estimates what a homeowner would pay to rent their own home, rather than using actual home purchase prices. OER carries the single largest weight in the entire U.S. CPI basket (25.8% relative importance), far larger than any comparable component in Japan’s CPI, which uses actual rent data more directly. This structural design means OER’s steady upward creep is arguably the single biggest reason U.S. core inflation has remained above the Fed’s target for so long.
Historical Context: A Slow-Motion Normalization
Shelter’s year-over-year rate eased only modestly, from 3.3% in June to 3.2% in July — consistent with a gradual, multi-year unwind from the post-pandemic rental surge rather than any sudden shift. Notably, BLS flagged in its June release that shelter’s monthly change was
インプリケーション——FRBの2%目標への道筋
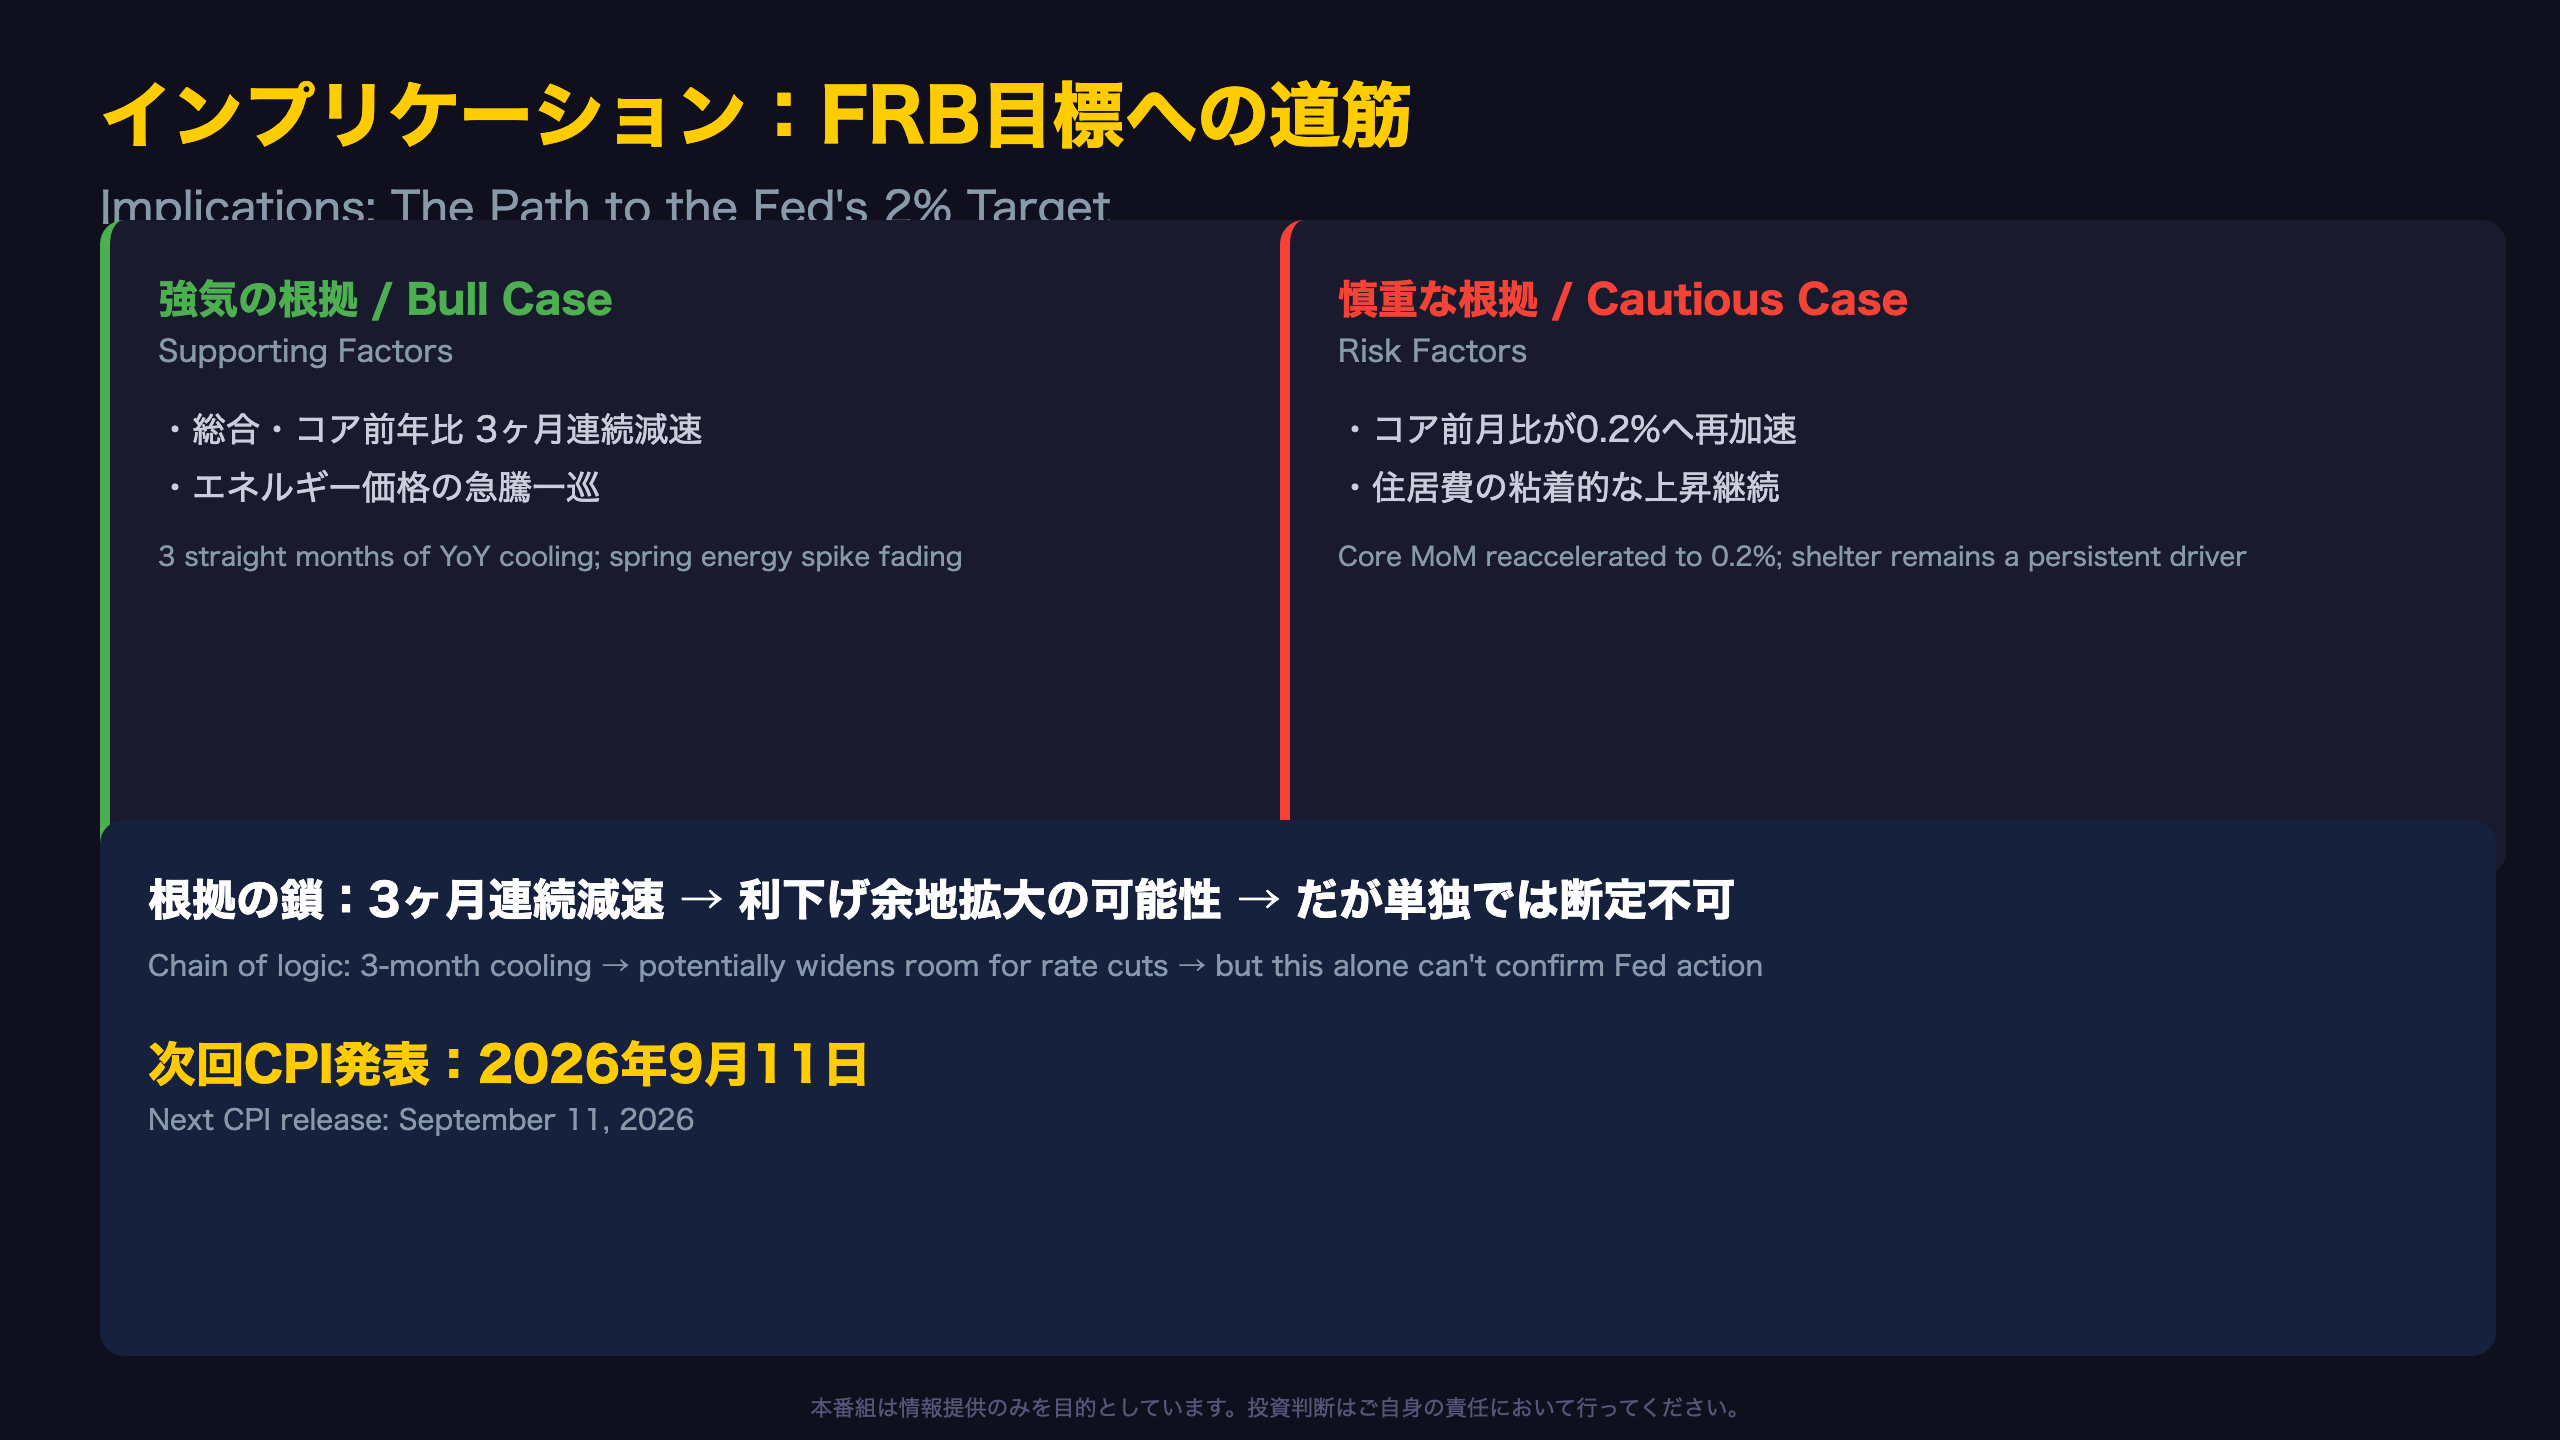
Reading the Market Implications Through a Chain of Logic
[Fact from the report] Headline CPI YoY cooled for three straight months: 4.2% (May) → 3.5% (June) → 3.4% (July).
[Economic mechanism] Generally, confirmed disinflation is thought to widen the Fed’s room to eventually cut interest rates.
[Market implication] However, this single data point alone cannot confirm whether or when the Fed will actually move — that judgment requires additional confirming data, including the Fed’s preferred PCE gauge.
[Fact from the report] Meanwhile, core CPI MoM accelerated from 0.0% in June to +0.2% in July.
[Economic mechanism] A reacceleration in core’s monthly momentum could mean the annualized “underlying” inflation rate stays elevated longer than currently priced in.
[Market implication] This creates a risk that markets may push back their expected timing for the start of Fed rate cuts.
Weighing the Bull and Bear Cases
The bullish case: A clear three-month streak of YoY deceleration, and the fading of the spring energy price spike, both point toward continued disinflation.
The cautious case: Core’s monthly reacceleration, shelter’s persistent contribution to headline gains, and sharp single-month jumps in categories like airline fares all suggest underlying price pressures haven’t fully faded.
What This Means for Consumers and Investors
With food up 3.0% and shelter up 3.2% year-over-year, American households continue to face real cost pressures in daily life — particularly renters and homeowners, given shelter’s outsized and persistent contribution to the overall index. For fixed-income investors, this data supports a “higher for longer, but gradually easing” narrative rather than an imminent dovish pivot. For equity markets, continued disinflation is broadly supportive, but the core reacceleration adds a note of caution that could weigh on rate-sensitive sectors if it persists.
Key Things to Watch in the Next Release
The August CPI report, due September 11, 2026, will be a critical test on three fronts: (1) whether core’s monthly pace holds around 0.2% or reverts lower, (2) whether shelter’s deceleration accelerates, and (3) whether energy prices stabilize. Together, these three variables will shape the near-term path for Fed policy expectations.
Disclaimer: This article is for informational purposes only. All investment decisions are made solely at your own risk.