📺 Watch the Full Video Analysis
This article was automatically generated by the NFC Market Live AI analysis system. (Updated: 2026-08-10 08:58 JST)
📄 Primary Source
財務省
https://www.mof.go.jp/policy/international_policy/reference/balance_of_payments/preliminary/pg202606.htm
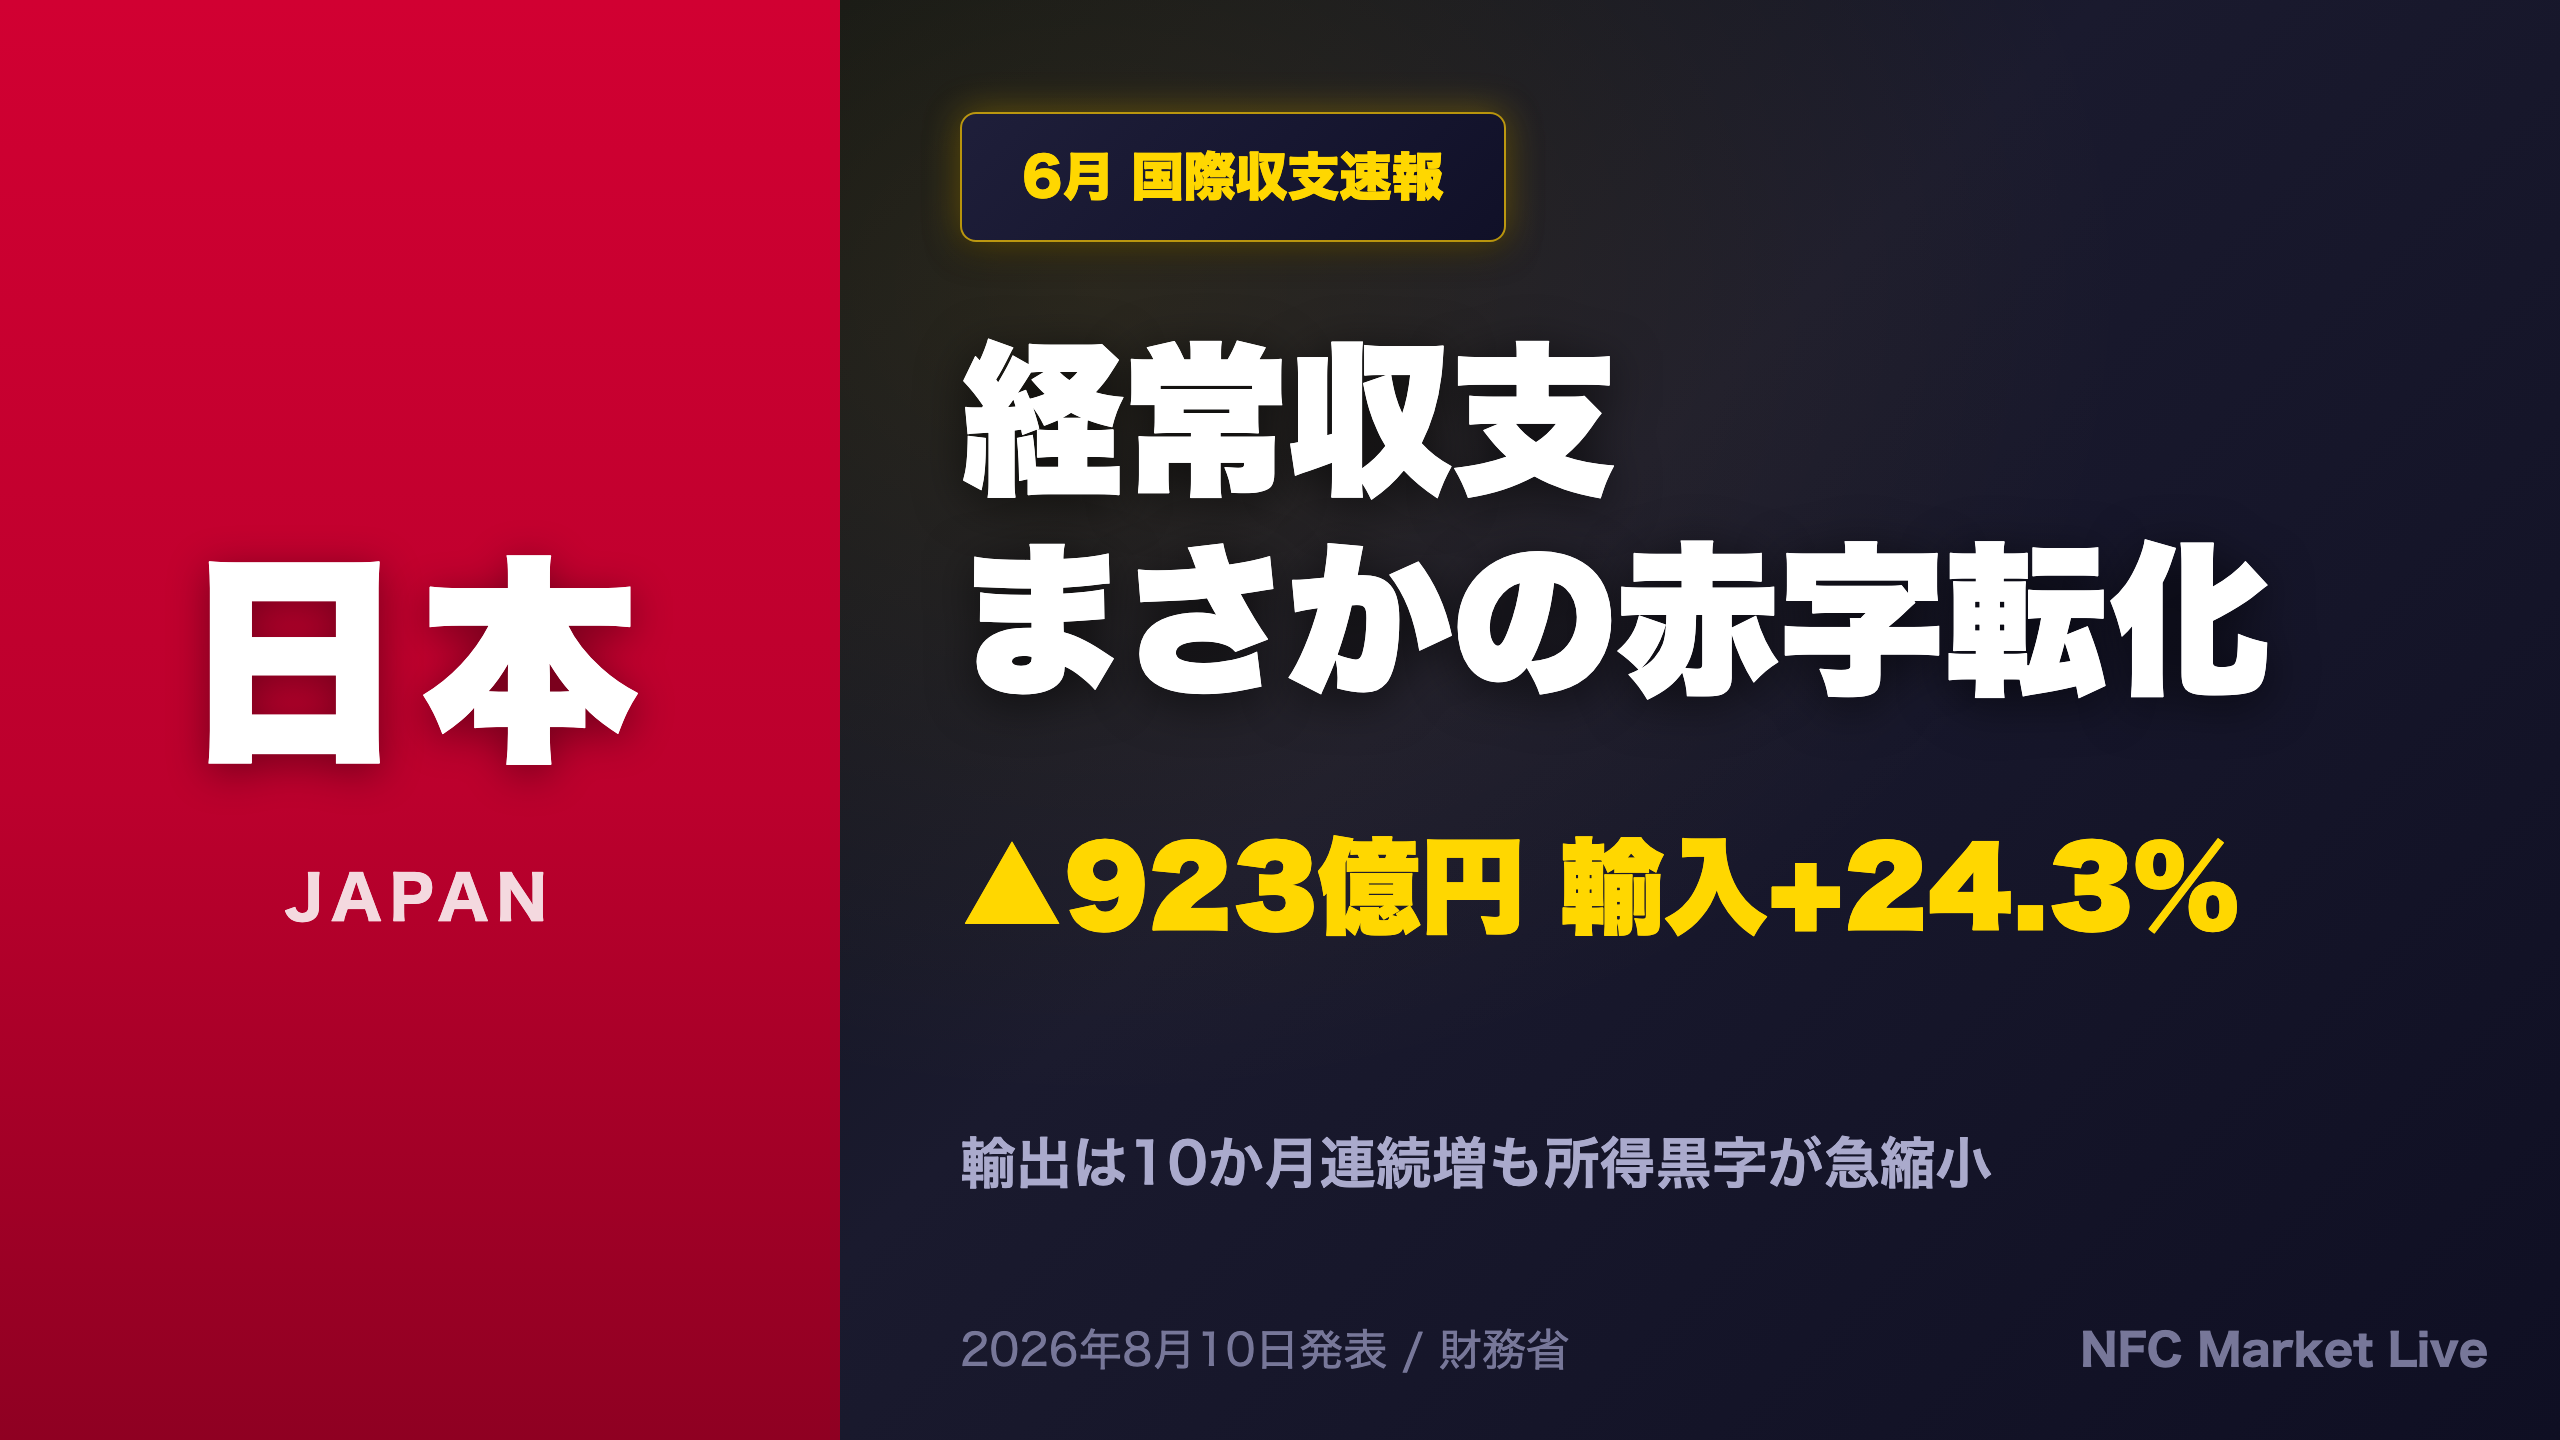
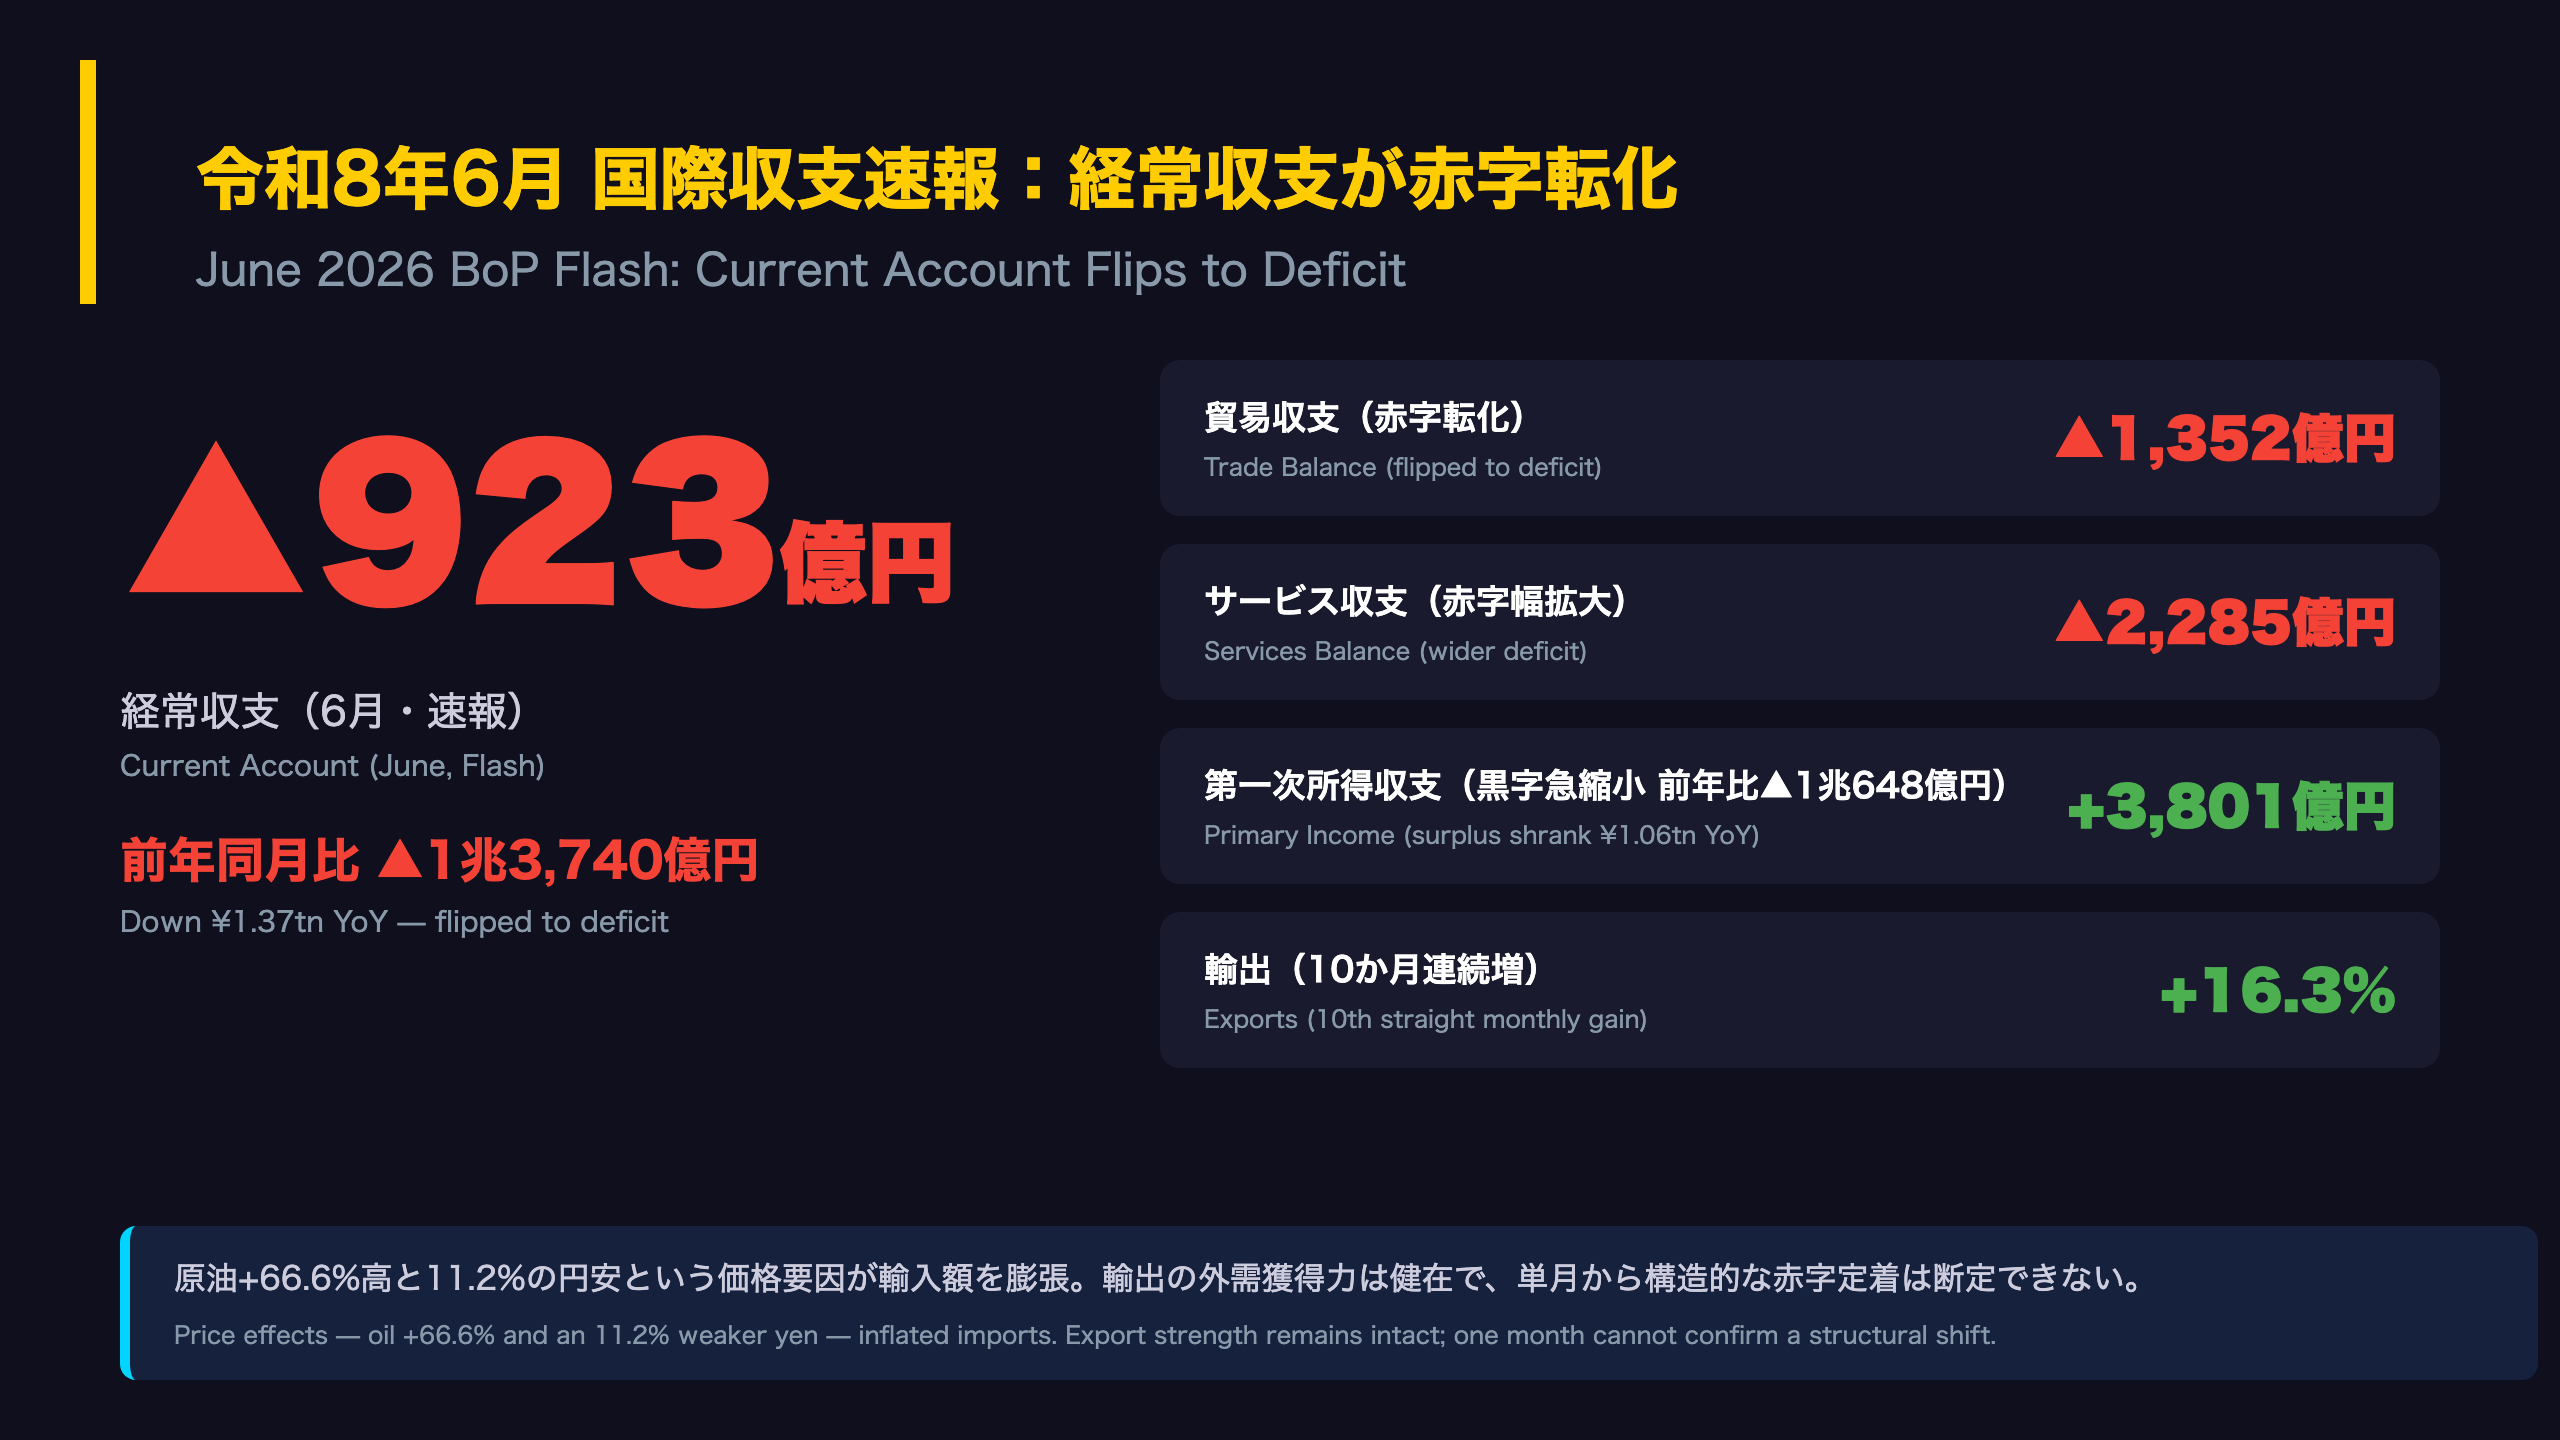
📊 Japan’s current account flipped to a rare ¥92.3bn deficit in June 2026, per the MOF’s balance of payments flash released Aug 10 — a ¥1.37tn YoY deterioration.
📉 The trade balance swung to deficit as imports surged +24.3% YoY, driven by a +66.6% jump in crude oil prices and an 11.2% weaker yen.
💡 Yet exports rose +16.3%, the 10th straight monthly gain, with semiconductors up +53.8% — external demand remains resilient.
⚠️ The biggest anomaly: primary income surplus collapsed to ¥380.1bn, while foreign investors dumped ¥2.9tn of Japanese equities and ¥1.6tn of JGBs.
We break down what this means for the yen, rates, and equities — both bull and bear cases.
The Ultimate Summary:経常収支▲923億円の赤字転化
Why a Monthly Current Account Deficit in Japan Is a Big Deal
Japan’s balance of payments data, compiled by the Ministry of Finance (MOF) and the Bank of Japan, is released monthly on a preliminary (flash) basis. Japan has run persistent current account surpluses for decades — not from trade, which has been volatile since the 2011 energy-import shift, but from primary income: dividends, interest, and reinvested earnings on Japan’s massive stock of overseas assets, the world’s largest net international investment position.
That is what makes June 2026 remarkable. The current account posted a ¥92.3bn deficit, versus a ¥3.97tn surplus just one month earlier — a swing of roughly ¥4tn. Outside of January, when seasonal factors routinely depress the balance, monthly deficits are extremely rare.
The anatomy of the swing
- Trade balance: -¥135.2bn, flipping to deficit as imports (+24.3% YoY) outpaced exports (+16.3%)
- Primary income: surplus collapsed to ¥380.1bn, down ¥1.06tn YoY — the single largest drag
- Services: -¥228.5bn, with the travel surplus shrinking as inbound visitors fell 6.8% YoY
International context
For comparison, the US runs chronic current account deficits financed by capital inflows; Japan’s structural surplus has historically been a pillar of yen stability. If Japan’s surplus erodes — even temporarily — the yen loses one of its fundamental supports, a dynamic FX markets watch closely. However, one month of data driven largely by a 66.6% oil price spike does not establish a trend. The July flash report will be the first test of whether this deficit was a one-off.
貿易収支の深掘り:量の輸出 vs 価格の輸入
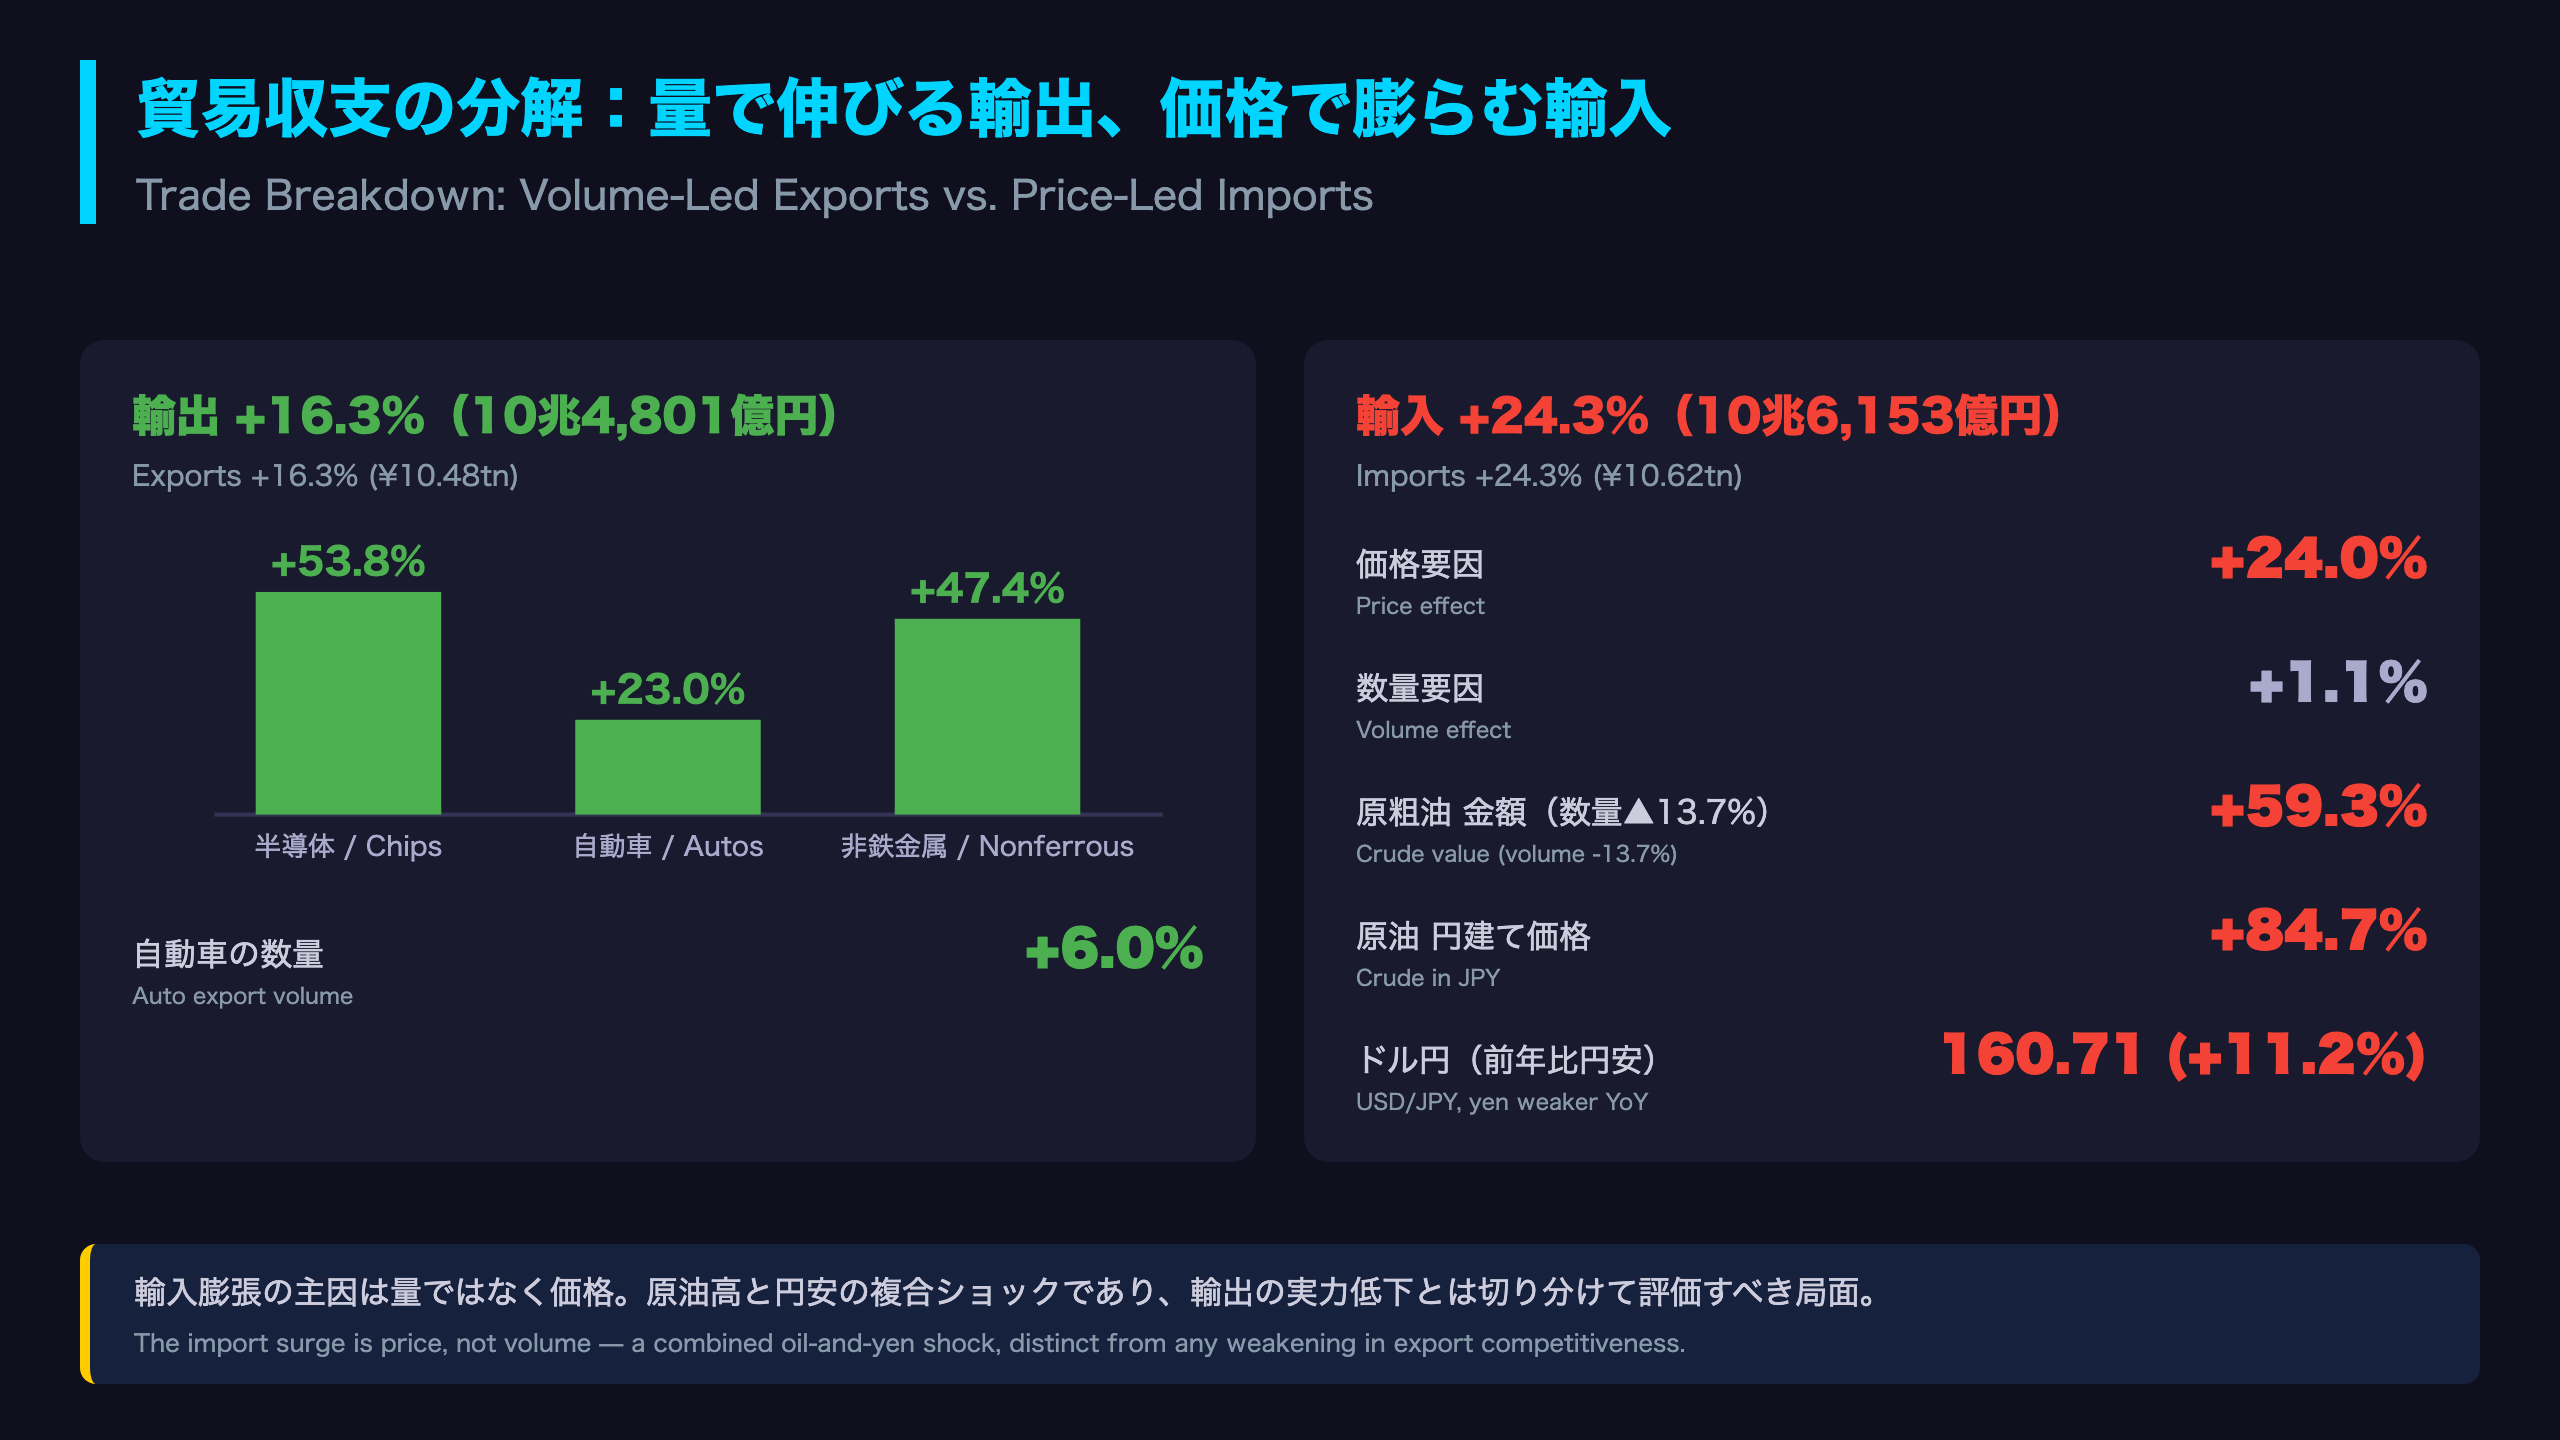
Two Trade Stories: Volume-Driven Exports vs. Price-Driven Imports
Japan publishes two closely related trade datasets: customs-basis trade statistics (from the MOF Customs Bureau) and the balance-of-payments-basis trade account. The BoP flash cross-references both, and the customs detail is where the real story lies.
Exports: genuine demand
Customs-basis exports hit ¥10.93tn, up 19.3% YoY. Autos rose 23.0% with volumes up 6.0% — real unit growth, not just price. Semiconductors and electronic components surged 53.8%, echoing the global AI-driven chip cycle also visible in Korean and Taiwanese export data. Shipments to Asia rose 22.6% and to North America 15.3%.
Imports: an almost pure price shock
Imports rose 25.4% on a customs basis, but volumes grew just 1.1% — prices did nearly all the work (+24.0%). The starkest example: crude oil import values jumped 59.3% while volumes fell 13.7%. Japan bought less oil and paid far more. Yen-based crude prices soared 84.7% YoY versus 66.6% in dollar terms, with the 11.2% weaker yen amplifying the burden — a dynamic familiar from Japan’s 2022 terms-of-trade shock.
Why it matters for markets
For FX investors, this distinction is crucial. A deficit caused by strong domestic demand would signal economic vigor; a deficit caused by imported cost inflation squeezes corporate margins and household purchasing power instead. It also mechanically increases dollar-buying flows by Japanese importers, a persistent structural source of yen weakness that operates regardless of interest-rate differentials.
最大の特異点:第一次所得収支の急縮小とインバウンド一服
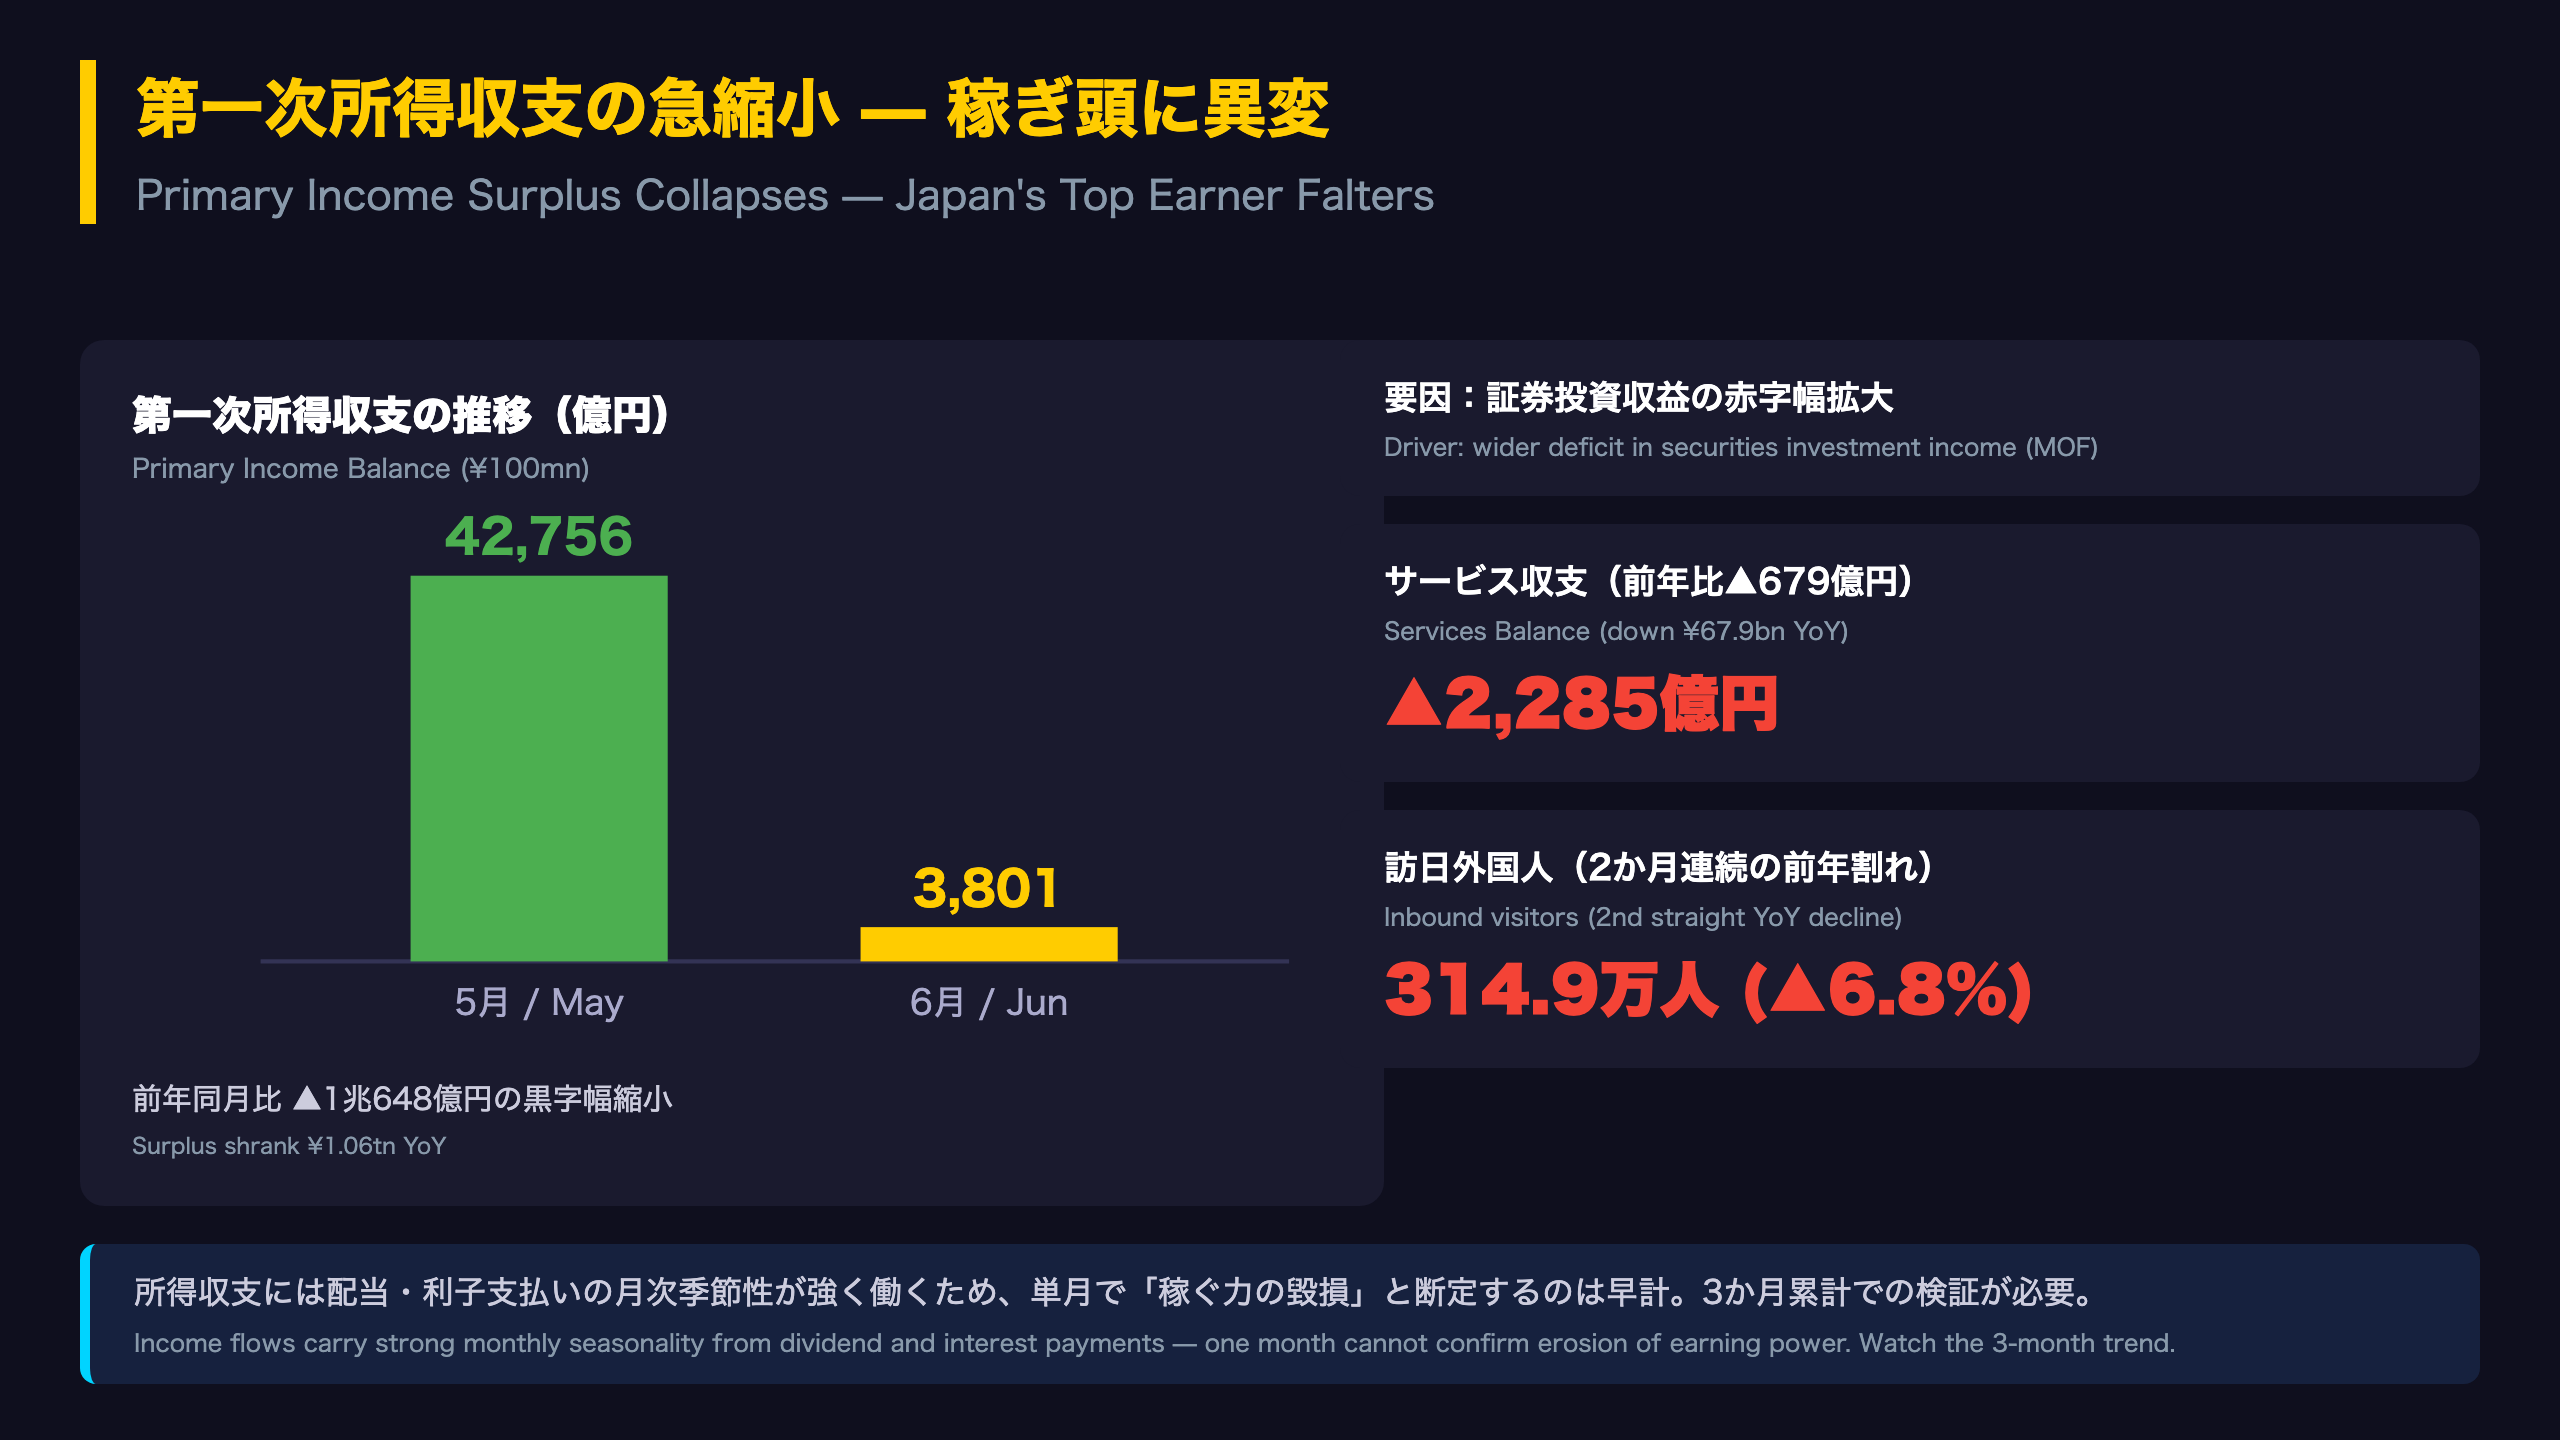
The Backbone Wobbles: Primary Income Under the Microscope
For readers unfamiliar with Japan’s external accounts: unlike Germany, whose surplus is trade-driven, Japan’s current account surplus rests on primary income — dividends, bond coupons, and reinvested earnings from roughly $10tn-plus in gross overseas assets accumulated over decades. This is why Japan can run trade deficits yet remain a surplus nation.
In June, that backbone wobbled. The primary income surplus fell to ¥380.1bn from ¥4.28tn in May — a ¥3.9tn month-on-month collapse and a ¥1.06tn YoY decline. The MOF’s stated reason: \”the deficit in securities investment income widened,\” an unusual phrasing since Japan’s securities income is normally deeply positive. One plausible factor: June is the peak month for Japanese corporate dividend payments, meaning large outflows to foreign shareholders of Japanese equities can compress the net balance. The flash report provides no detailed breakdown, so confirmation awaits the final figures.
Inbound tourism cooling
Japan’s services account includes the travel balance — the inbound tourism surplus that boomed post-COVID. June visitor arrivals fell 6.8% YoY to 3.15 million, the second straight monthly decline and an accelerating one. Notably, this is happening despite an 11.2% weaker yen, suggesting currency-driven affordability alone may no longer sustain visitor growth.
The balanced take
Bear case: both pillars of Japan’s surplus — investment income and tourism — softened simultaneously. Bull case: income flows are heavily seasonal; quarterly or semi-annual averages, not single months, are the statistically sound basis for judging Japan’s structural earning power. The July report will be the first test.
金融収支:海外勢の日本売りとフローの反転
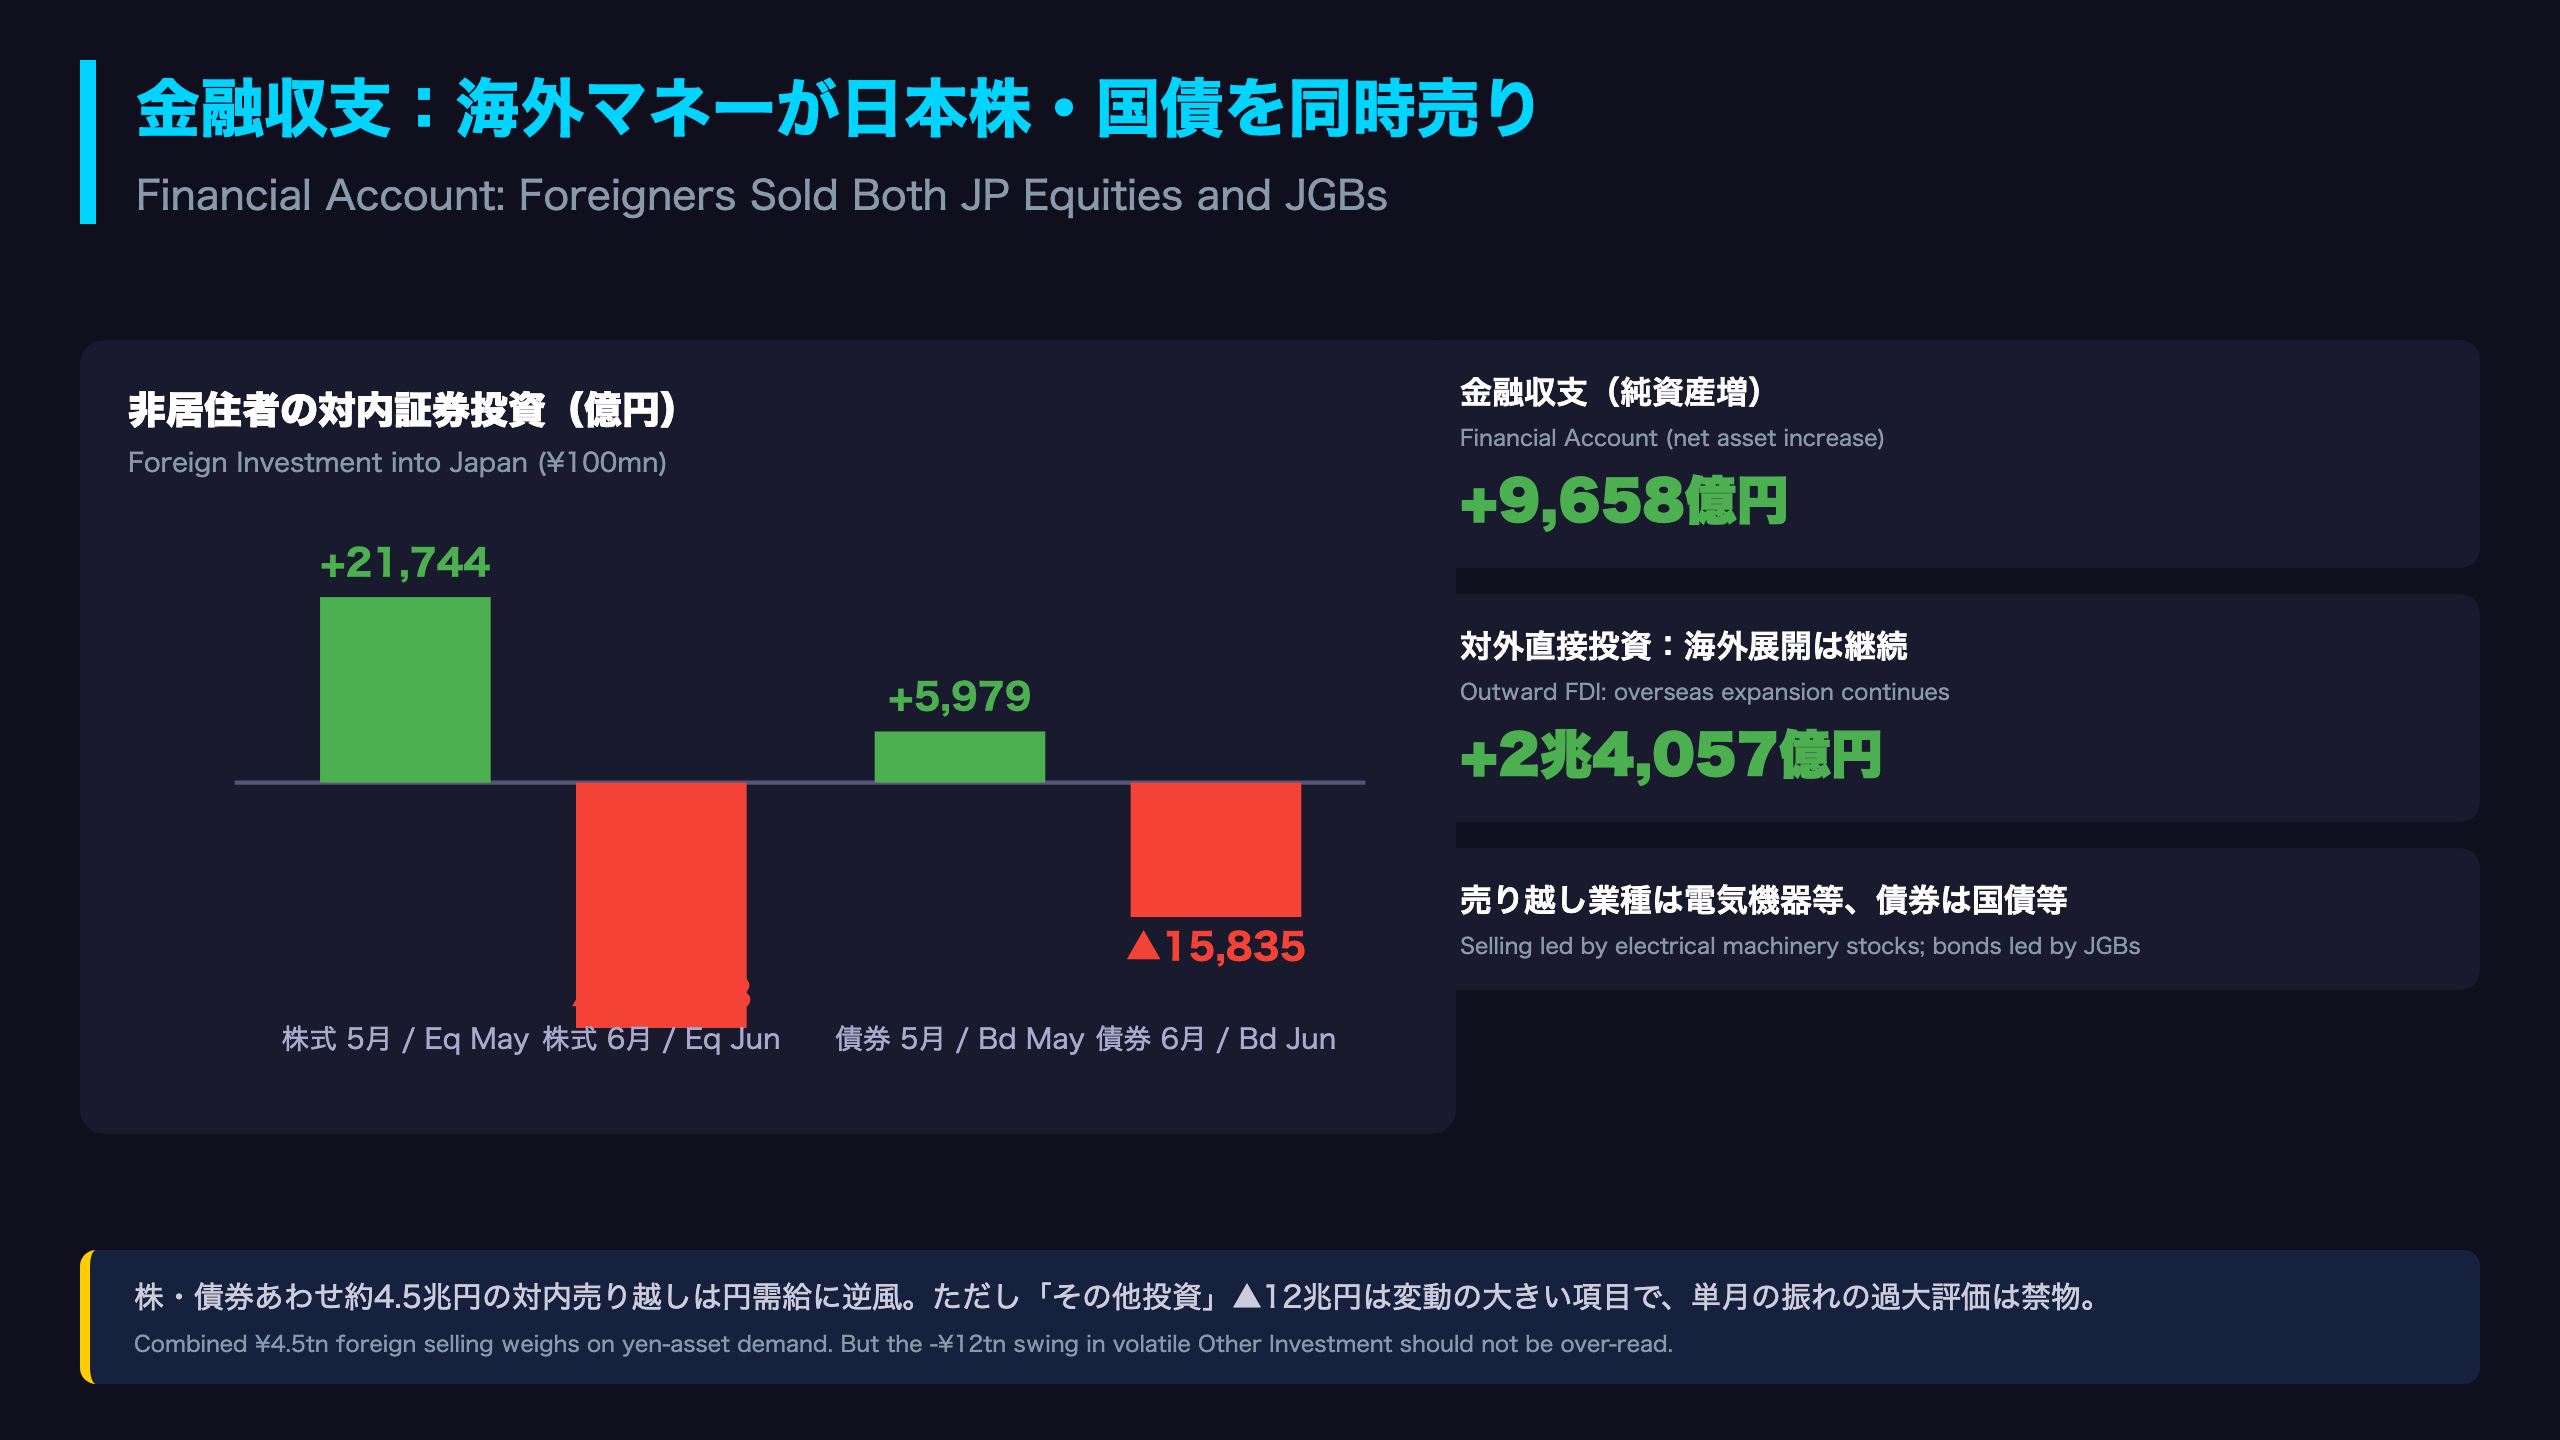
The Flow Reversal: Foreign Money Turns on Japan
Japan’s financial account tracks cross-border capital flows — who is buying and selling Japanese assets, and what Japanese investors are doing abroad. June’s data shows a stark reversal in foreign behavior.
Inbound flows flipped from buy to sell
- Japanese equities: foreigners net-sold ¥2.88tn in June, versus net purchases of ¥2.17tn in May — a swing of over ¥5tn in one month, concentrated in electrical machinery (tech hardware) names
- Medium/long-term bonds (mostly JGBs): net sales of ¥1.58tn, versus net purchases of ¥598bn in May
Simultaneous foreign selling of both equities and government bonds — roughly ¥4.5tn combined — is a meaningful drag on demand for yen-denominated assets. For context, foreign investors have been pivotal marginal buyers of Japanese equities since the 2023-24 governance-reform rally; sustained selling would remove a key market support.
Japanese corporates keep investing abroad
Outward FDI rose ¥2.41tn, following ¥3.29tn in May, driven by \”capital increases in overseas companies\” per the MOF. This structural outflow is a long-term yen-negative force, but it also seeds future primary income — the dividends these investments will eventually repatriate.
Handle volatile categories with care
\”Other investment\” swung from +¥14.69tn to -¥12.03tn month-on-month, and FX reserves from -¥11.44tn to +¥287bn. These categories capture interbank funding and reserve composition shifts and are inherently noisy. The flash report offers no explanation for May’s unusual reserve decline, and no inference about FX intervention can be drawn from this data alone.
インプリケーション:円・金利・株への含意と次のチェックポイント
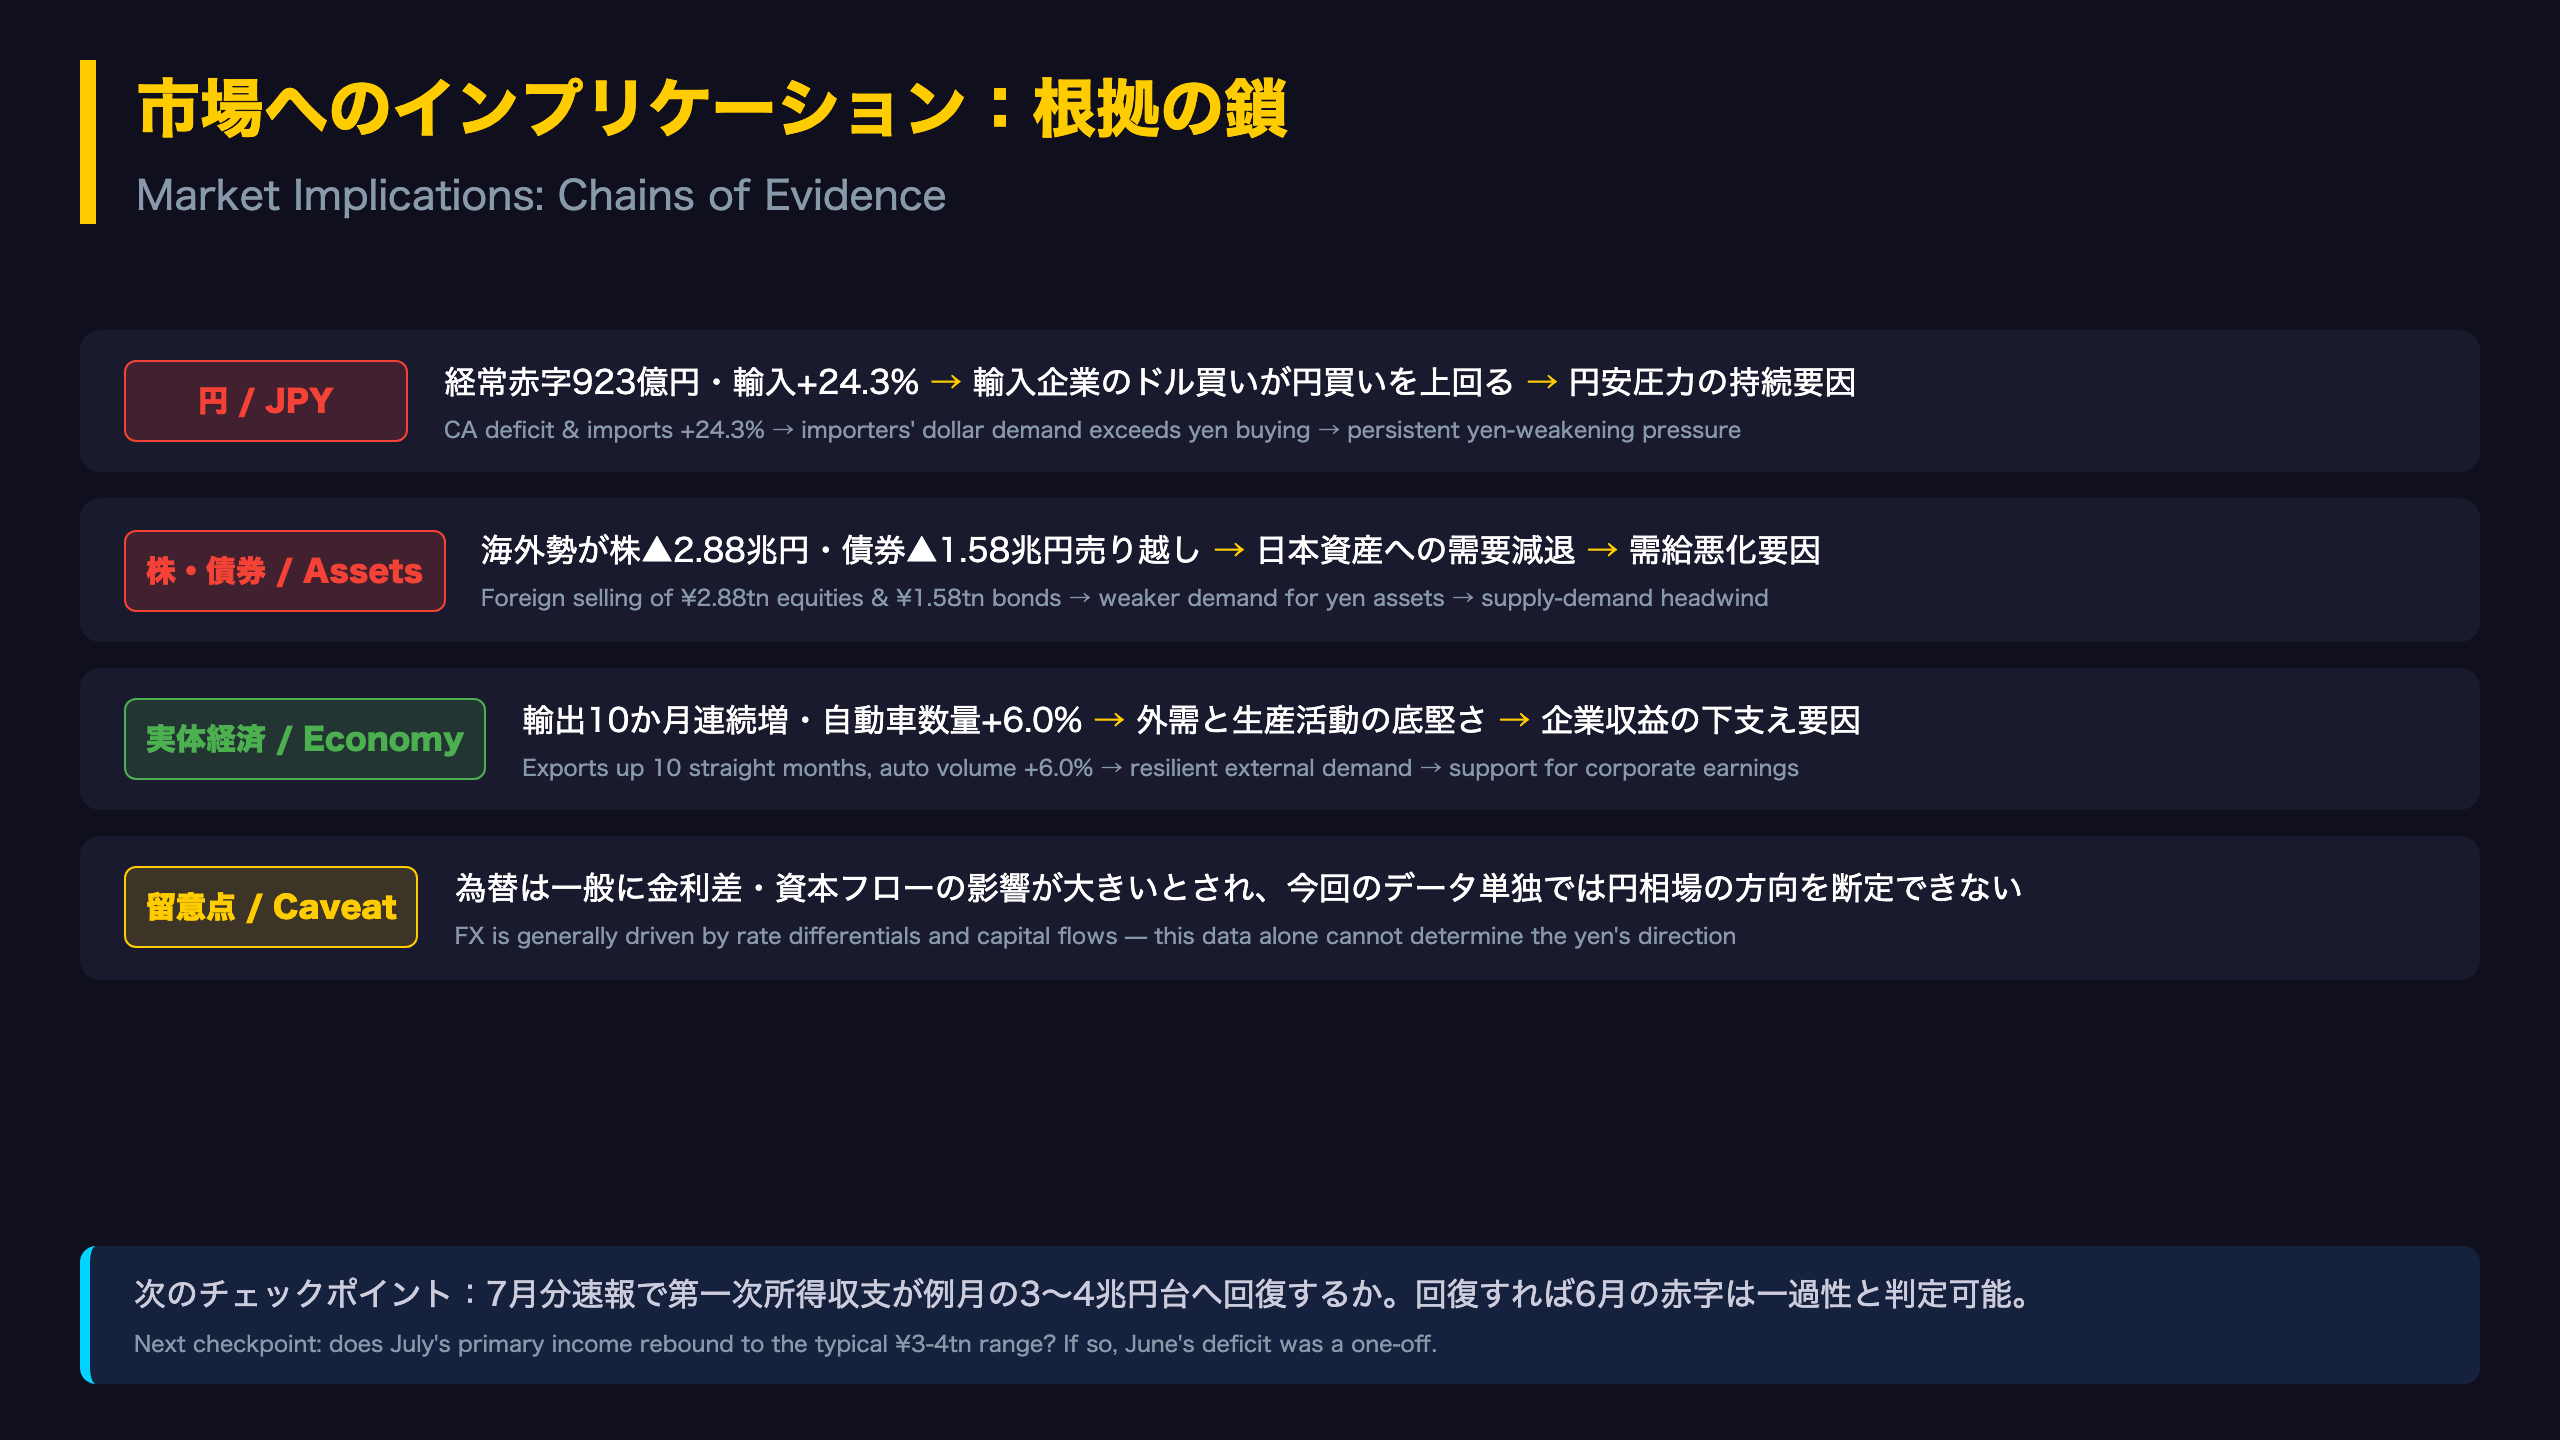
Market Implications: Three Chains of Evidence
Chain 1: The yen
A ¥92.3bn current account deficit with imports up 24.3% means importers’ real-demand dollar buying exceeds exporters’ yen buying — a persistent structural source of yen weakness. The monthly average USD/JPY of 160.71 (11.2% weaker YoY) already reflects this trend, and June’s flows reinforce it. Caveat: exchange rates are generally driven more by rate differentials and capital flows than trade flows, so this report alone cannot determine the yen’s path. Notably, unlike the US — where deficits are financed by reserve-currency demand — Japan’s yen lacks that structural buyer.
Chain 2: Japanese assets
Foreign net sales of ¥2.88tn in equities and ¥1.58tn in JGBs signal reduced overseas appetite for yen assets — a supply-demand headwind for Tokyo markets. The intriguing wrinkle: selling concentrated in electrical machinery even as semiconductor exports surged 53.8%. Flows and fundamentals are pointing in opposite directions, which often resolves within a quarter.
Chain 3: The bull case
Ten consecutive months of export growth, with auto volumes up 6.0%, confirms Japan’s manufacturing engine is running — a support for corporate earnings regardless of the BoP headline.
What to watch next
- July flash report (due early September): does primary income rebound to its typical ¥3-4tn monthly range? If yes, June’s deficit was a one-off.
- Oil and the yen: does the 84.7% yen-based crude price shock fade?
- Foreign flows: two-plus consecutive months of foreign selling would upgrade this from noise to signal.
The disciplined read: don’t overreact to one deficit month, but the twin softening in investment income and inbound tourism deserves a spot on every Japan watcher’s dashboard.
Disclaimer: This article is for informational purposes only. All investment decisions are made solely at your own risk.