📺 Watch the Full Video Analysis
This article was automatically generated by the NFC Market Live AI analysis system. (Updated: 2026-08-06 23:12 JST)
📄 Primary Source
U.S. Census Bureau
https://www.census.gov/wholesale/pdf/mwts/currentwhl.pdf
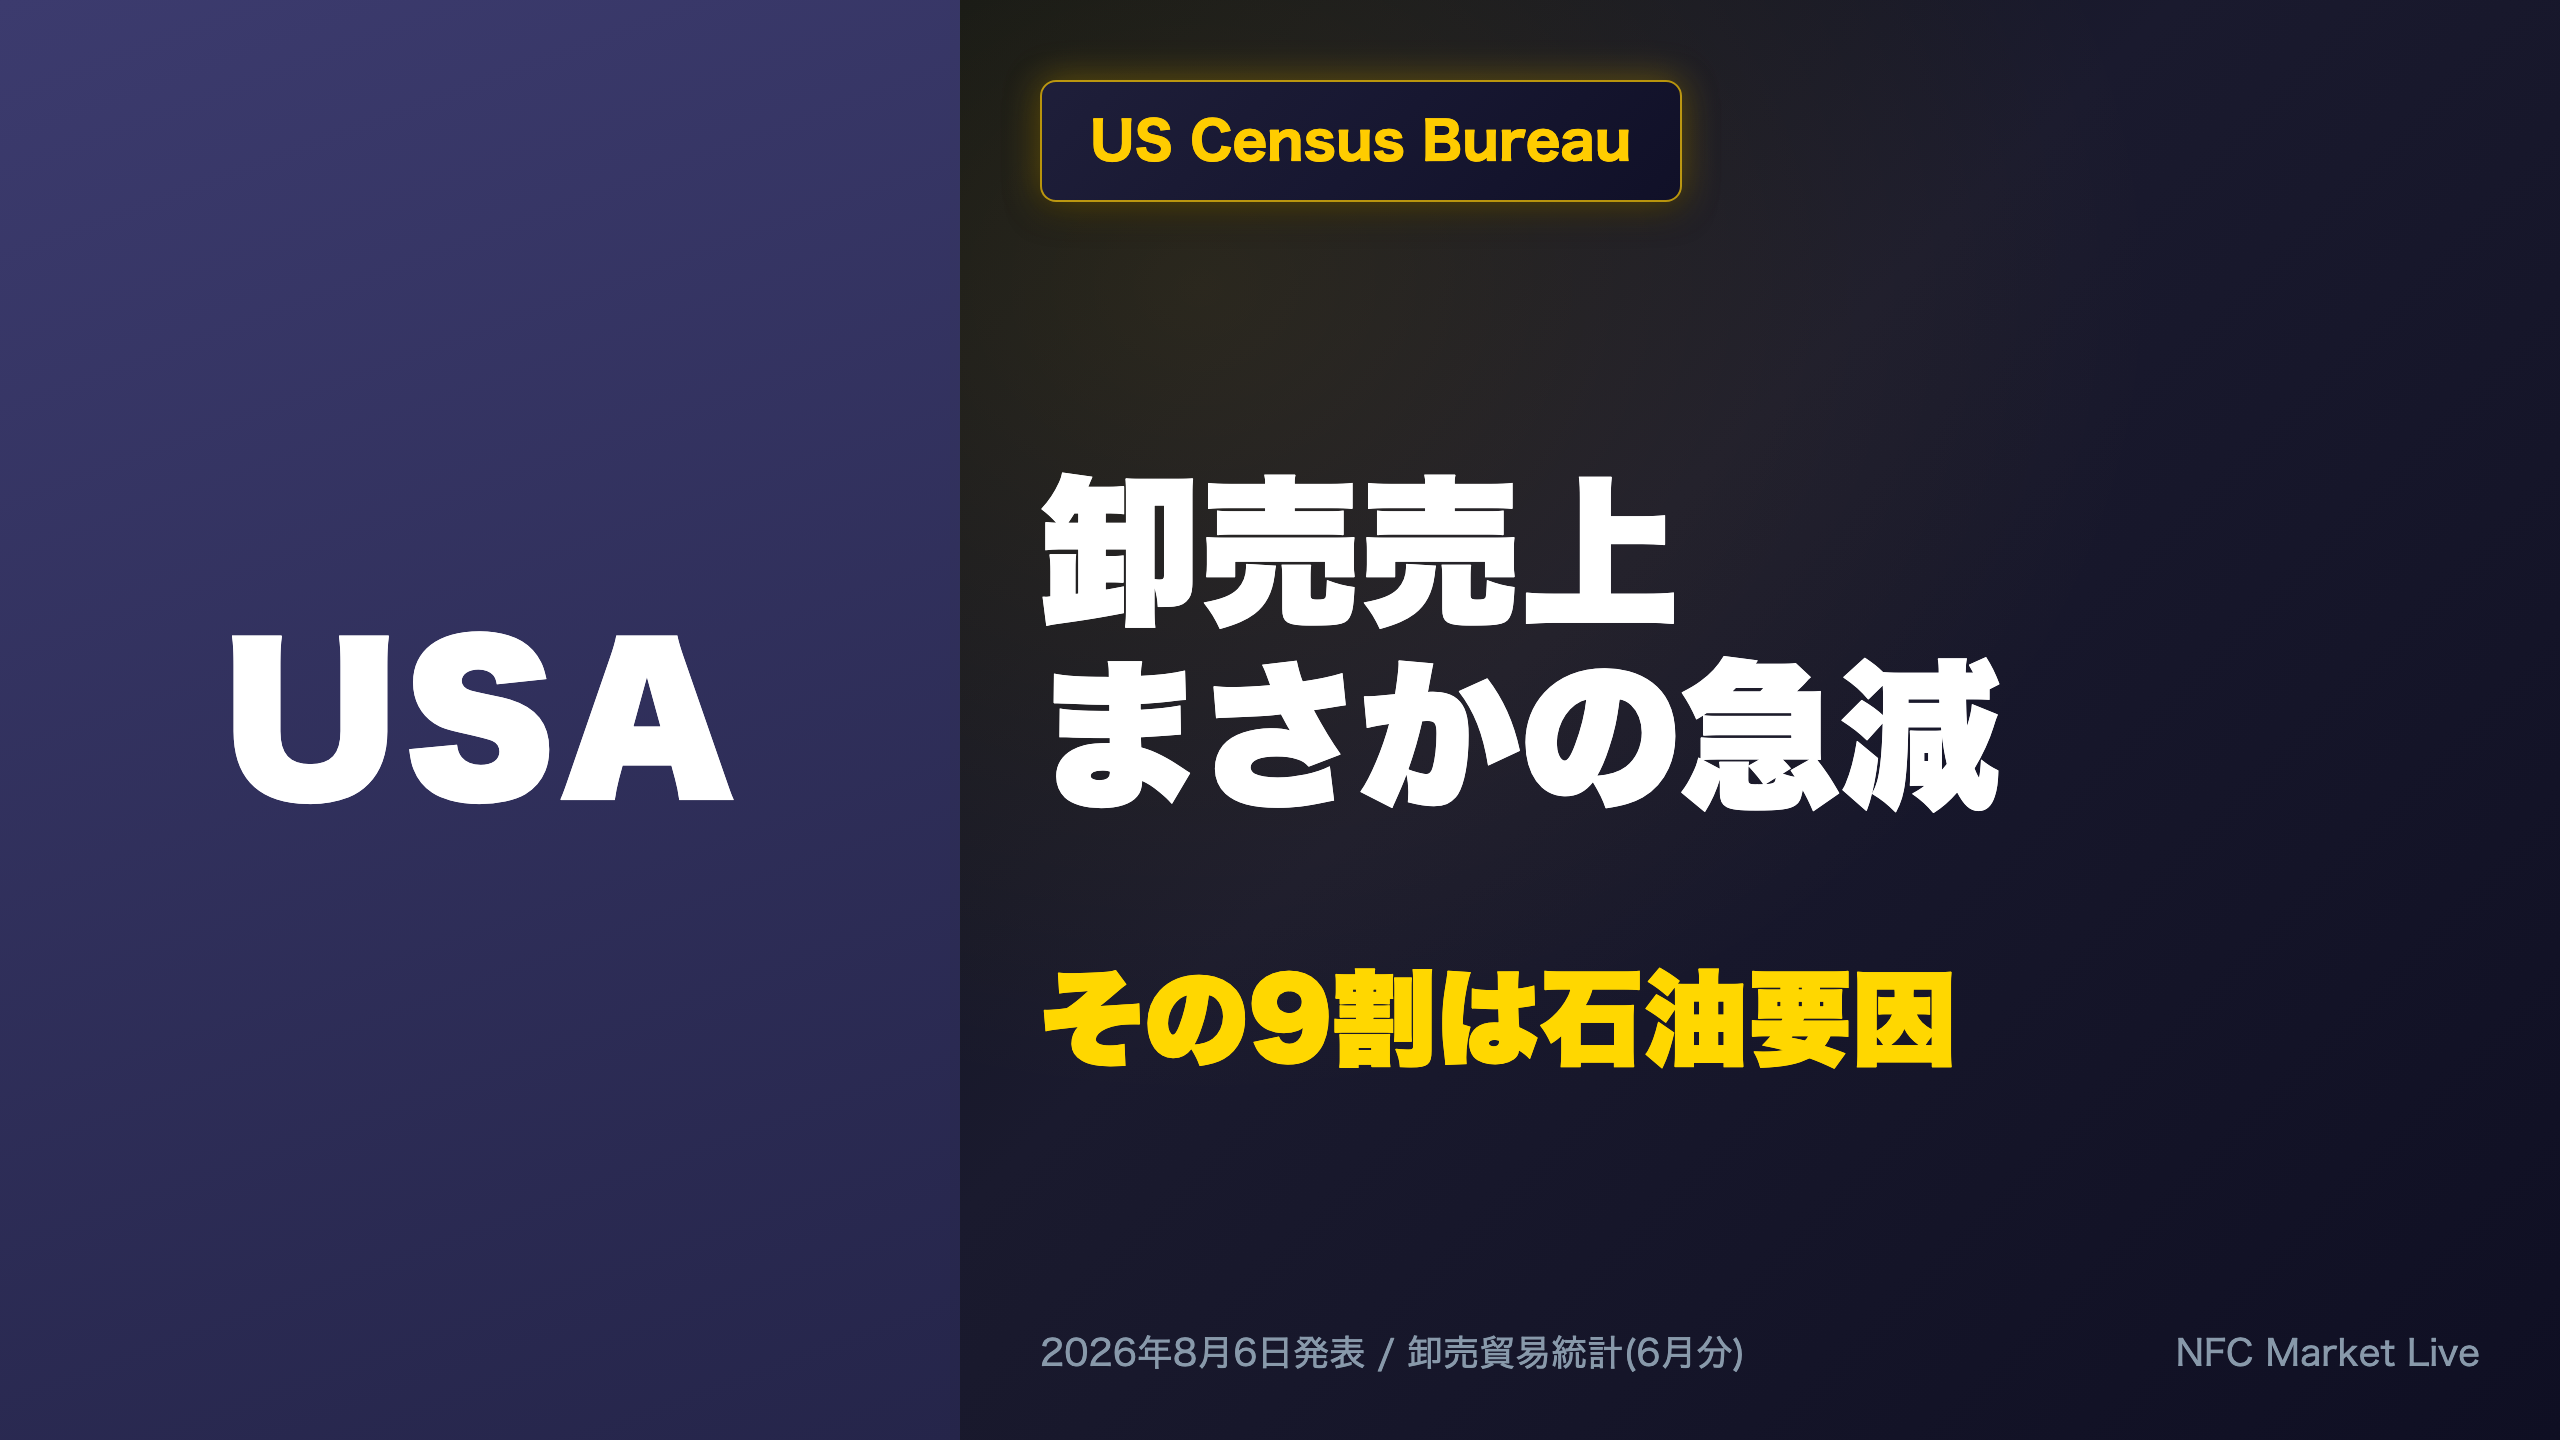
📊 Breaking down the US Census Bureau’s June 2026 Monthly Wholesale Trade report.
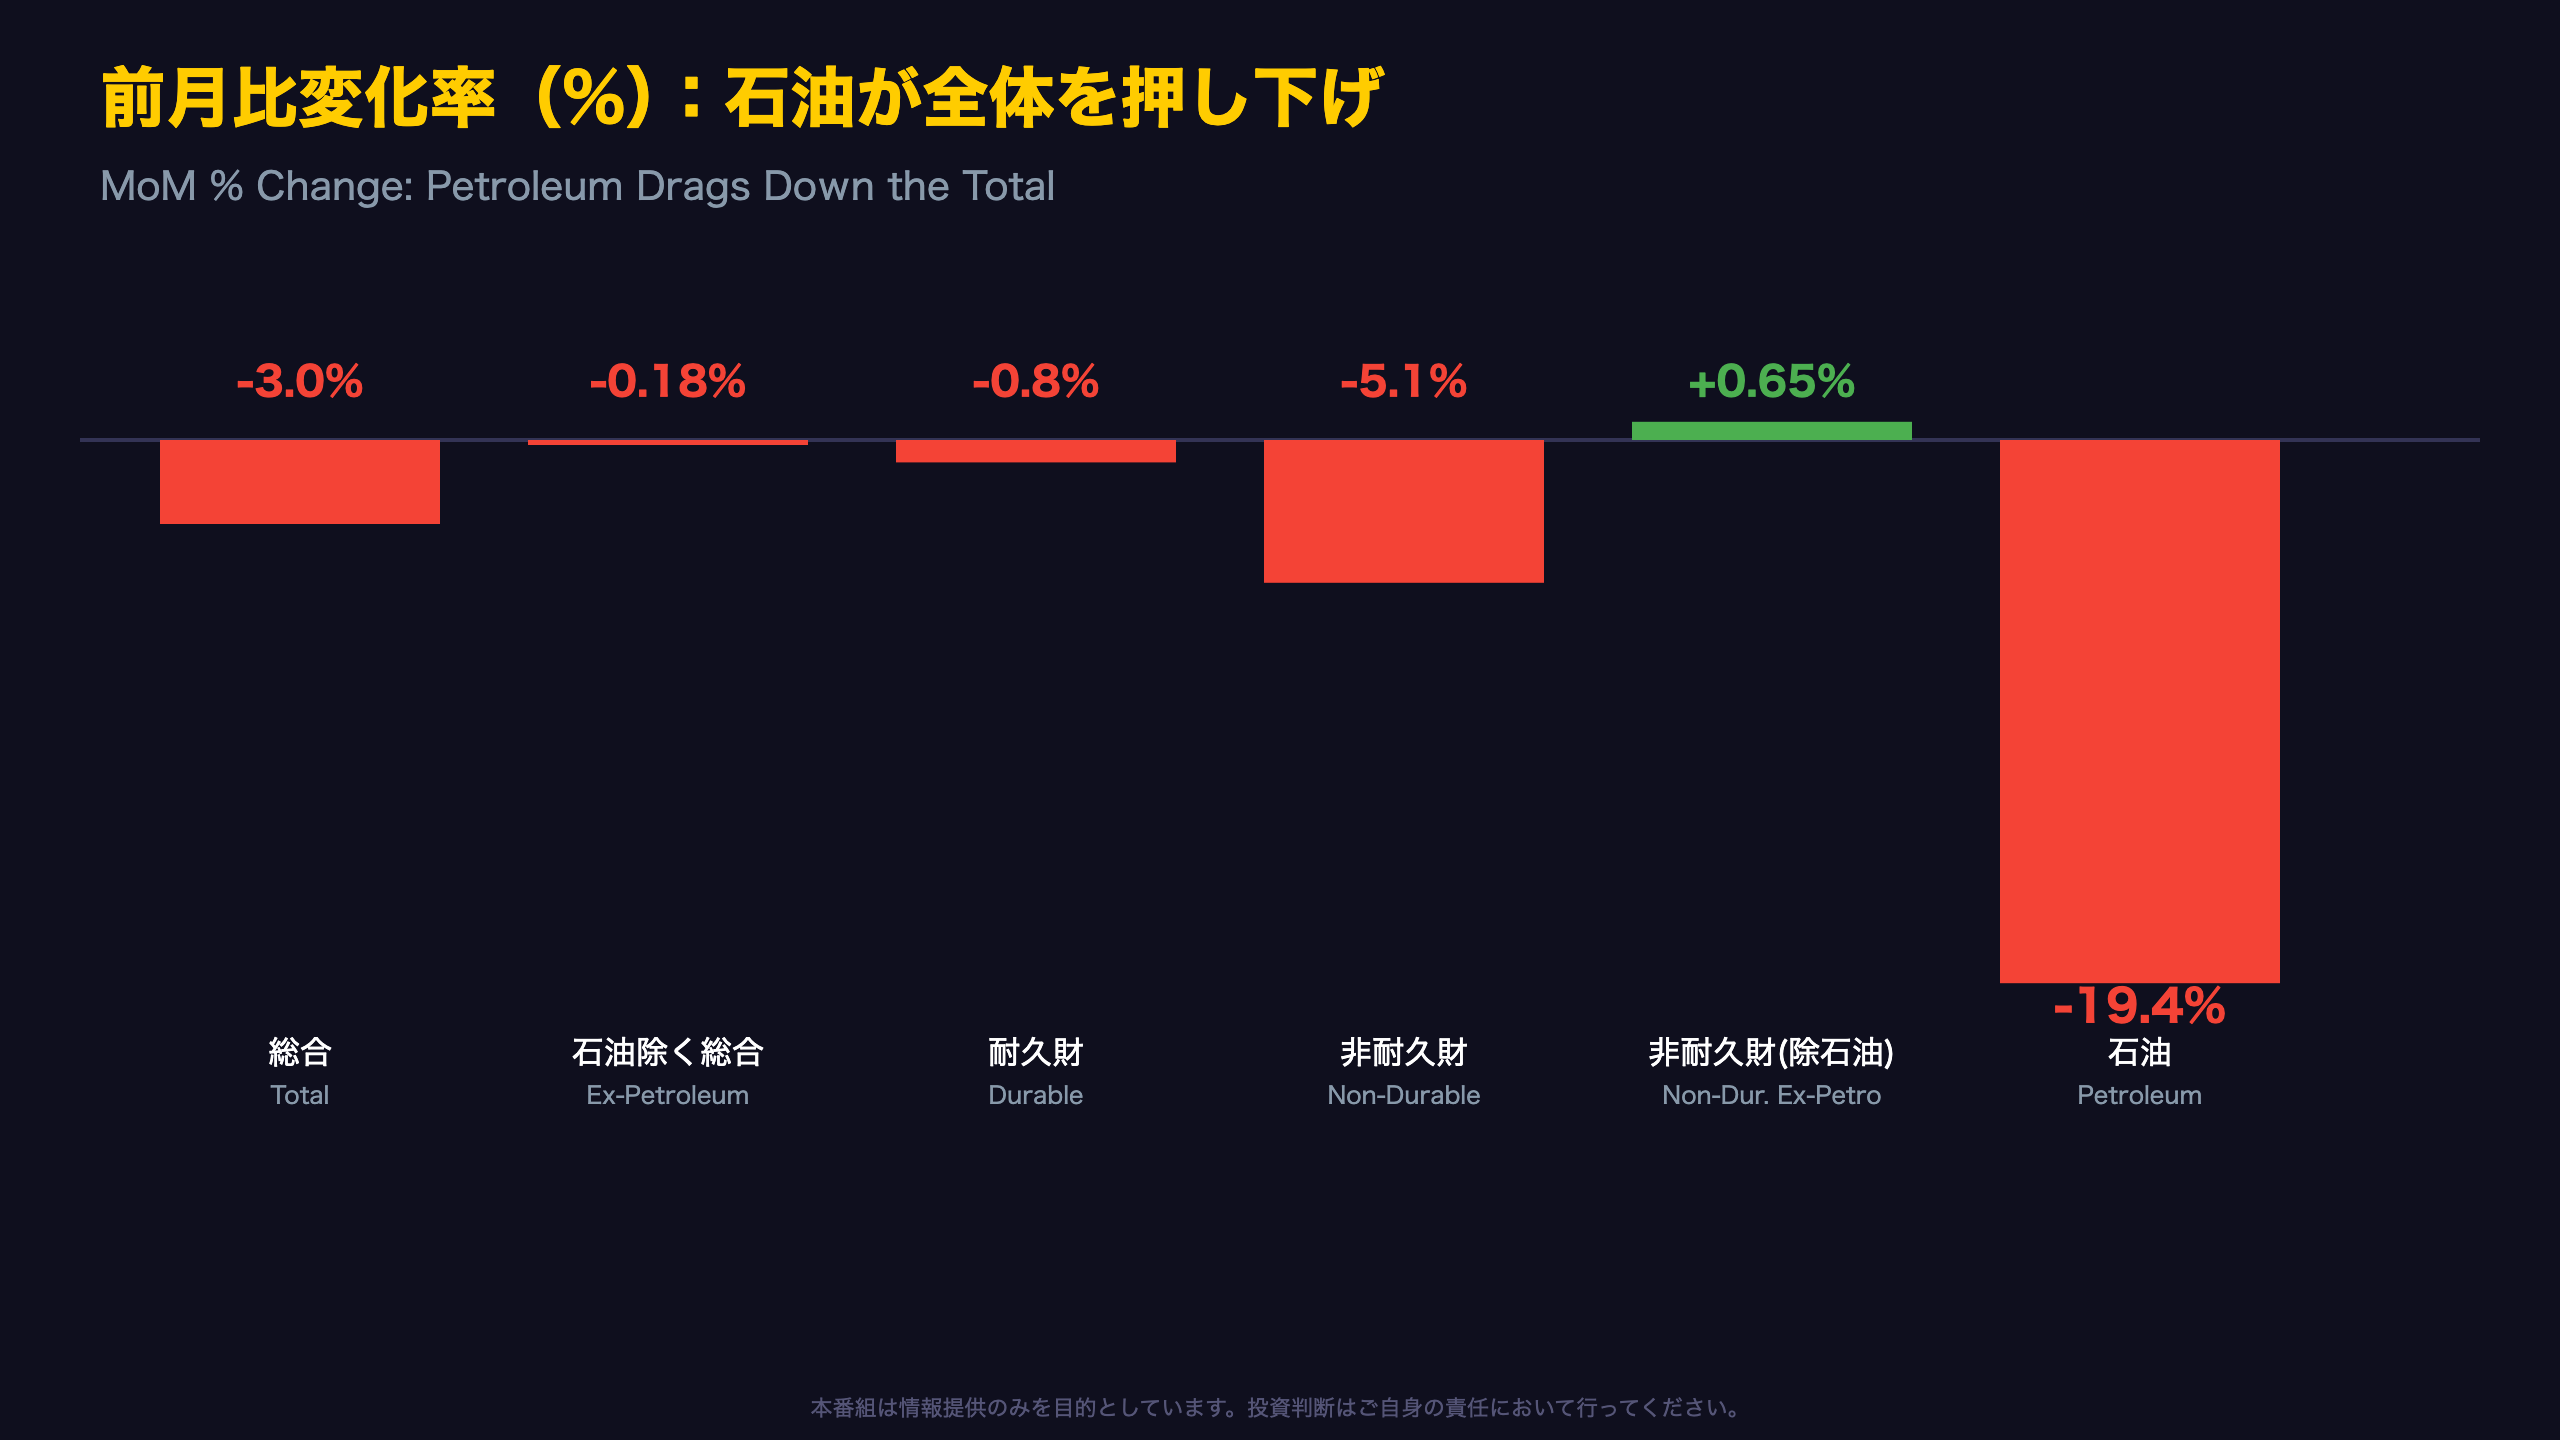
📉 Headline sales fell -3.0% MoM, but ~95% of that drop came from petroleum alone.
💡 Ex-petroleum sales were roughly flat, while YoY sales growth stayed in double digits at +14.1%.
⚠️ Inventories rose just +0.2% (not statistically significant), and the inventories-to-sales ratio of 1.19 remains below last year’s 1.30—signaling lean supply chains.
We unpack what this means for GDP and inflation.
総合サマリー:急減の裏にある2つの顔
What the Release Shows
The US Census Bureau’s Monthly Wholesale Trade Survey (MWTS) feeds into the Bureau of Economic Analysis’s GDP inventory calculations, though it covers only merchant wholesalers — not retailers or manufacturers. For June 2026, the report states:
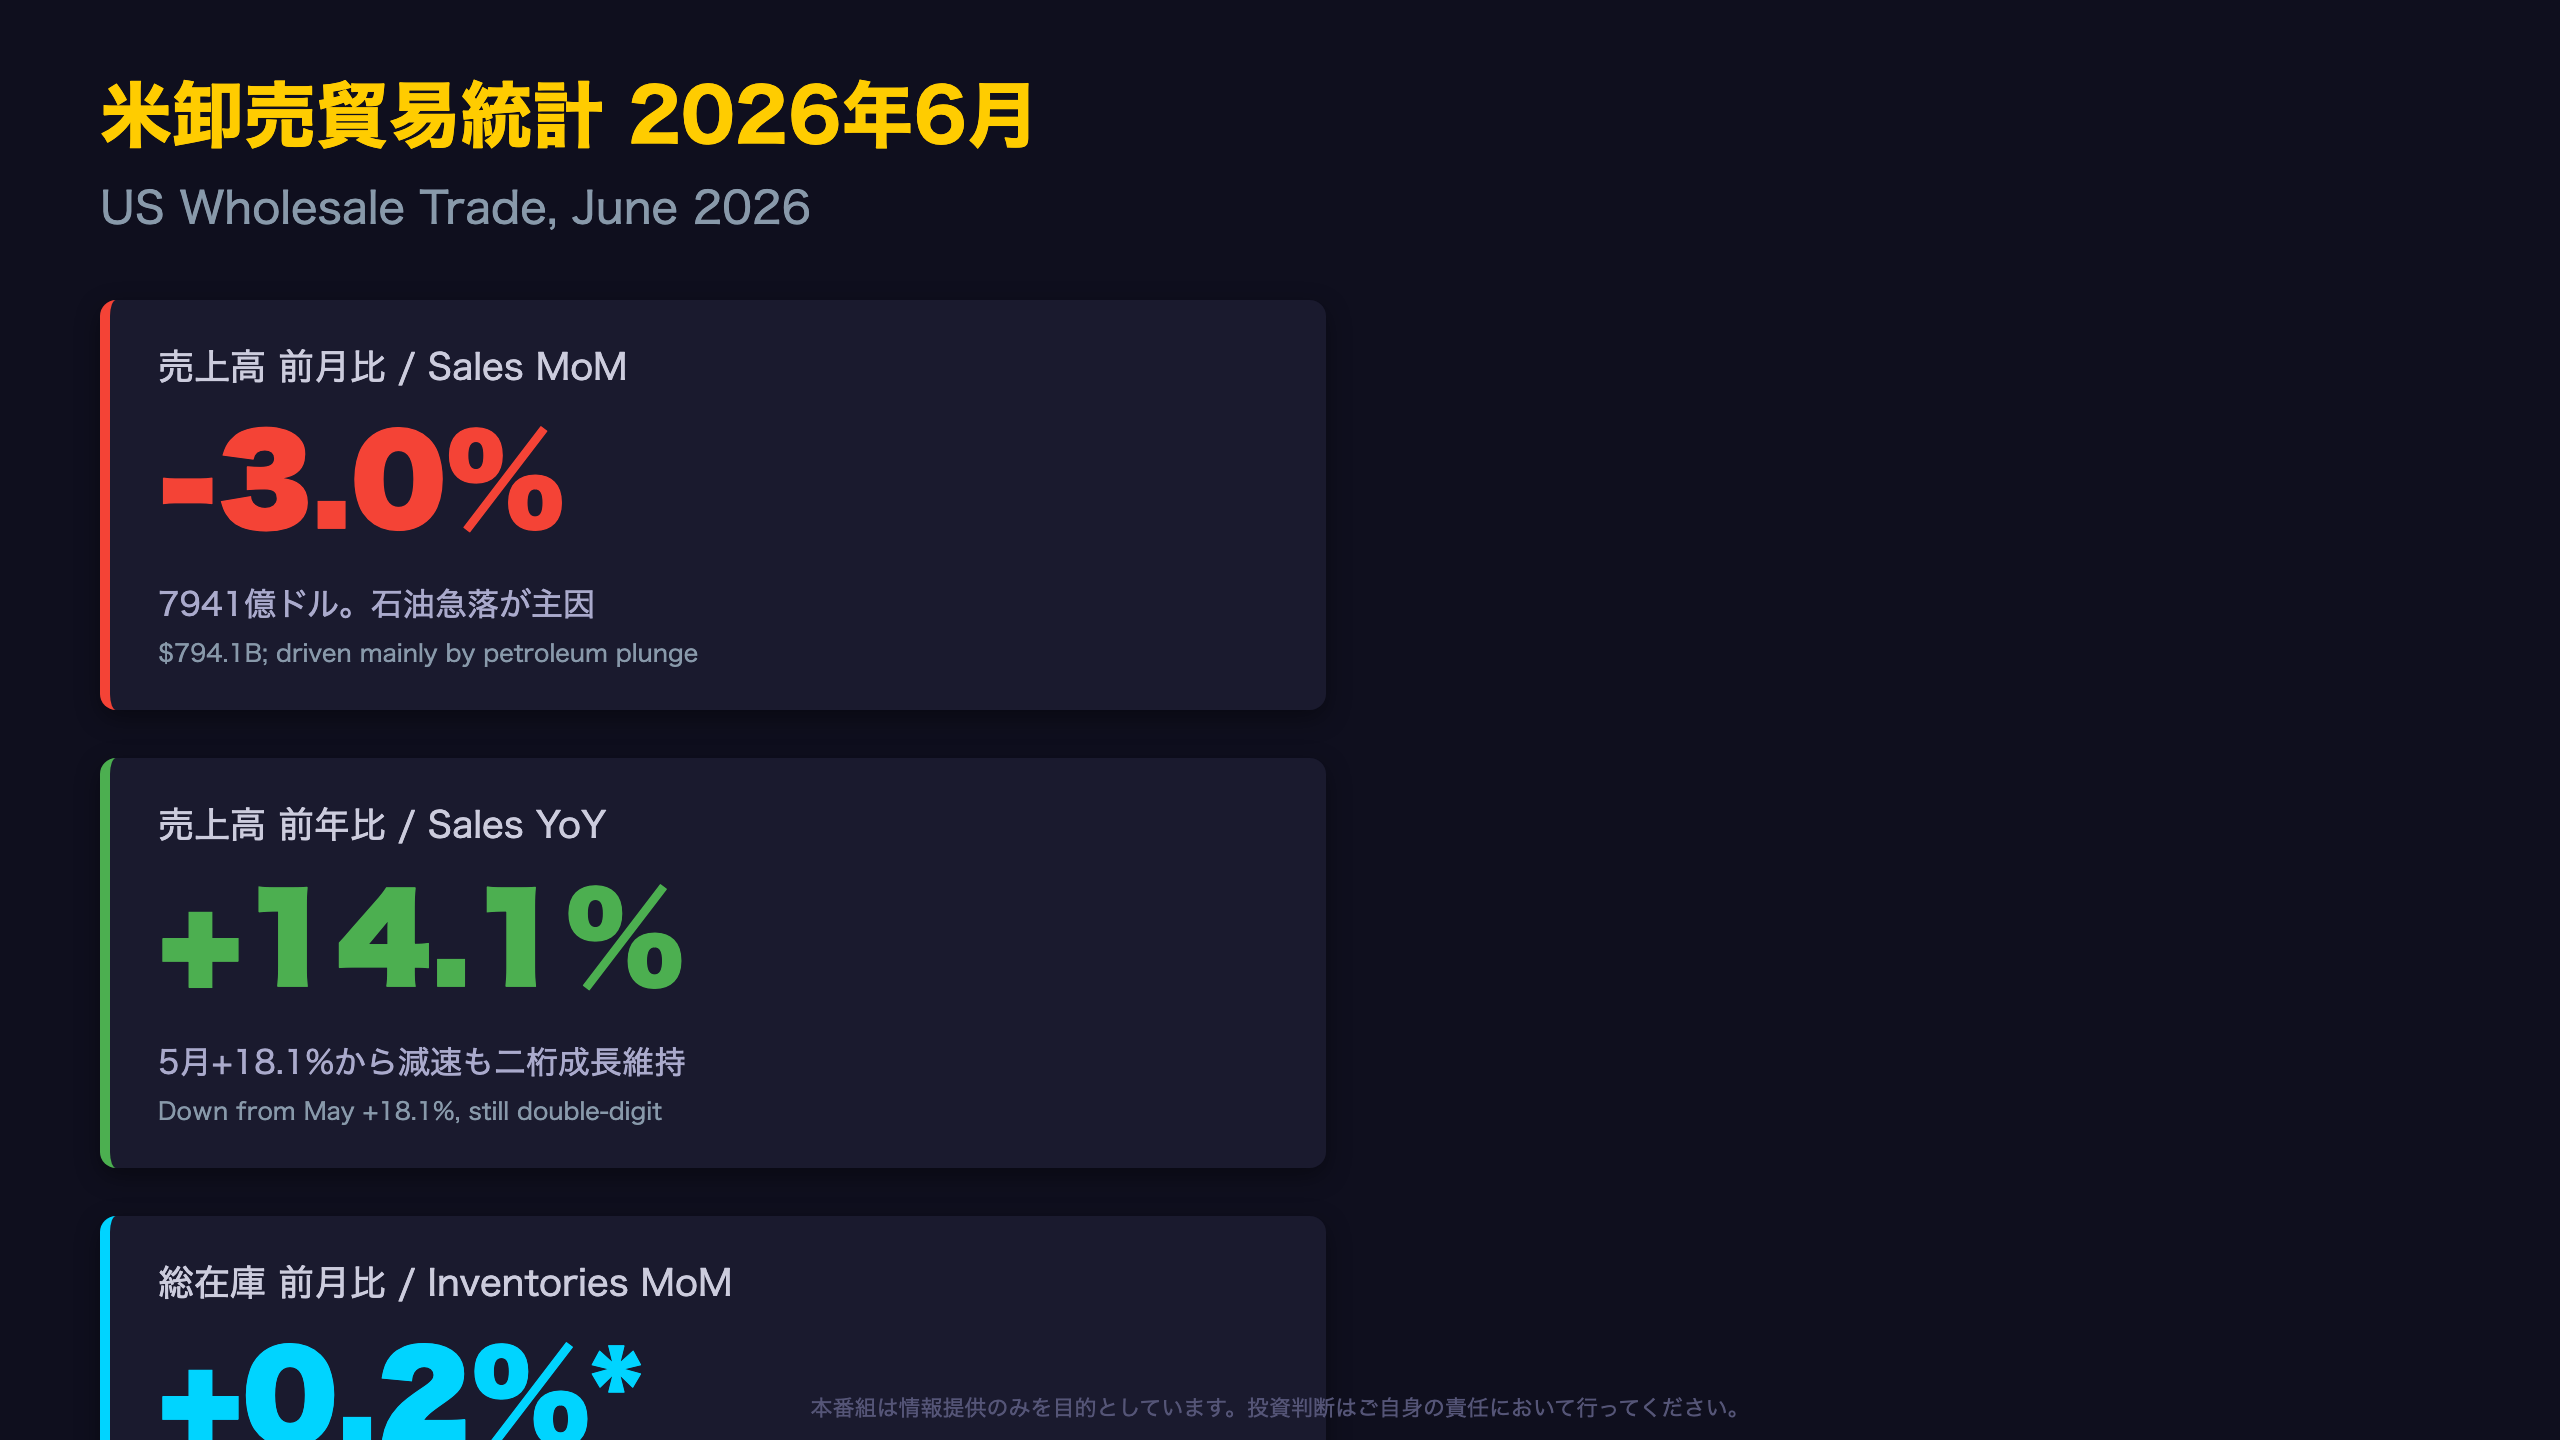
“were $794.1 billion, down 3.0 percent (±0.5 percent) from the revised May level, but were up 14.1 percent (±0.7 percent) from the revised June 2025 level.”
Revision History
The April-to-May sales change was revised up from +3.4% to +3.5%. The May-to-June inventory change was revised down from an advance +0.3% to +0.2% — a change so small its 90% confidence interval includes zero.
Comparable US Data
Unlike the ISM Manufacturing PMI’s inventory subindex, which is a diffusion index, MWTS provides dollar-denominated hard data, making it directly usable for GDP nowcasting models such as the Atlanta Fed’s GDPNow.
Bull vs. Bear Read
Bulls point to sustained double-digit YoY sales growth (14.1%). Bears flag the deceleration from May’s 18.1% YoY — a 4-point drop in a single month. Next release: September 10, 2026.
急減の正体:石油が9割を説明
Non-Petroleum Detail: Mostly Steady
US readers should note MWTS sales are seasonally adjusted but NOT price-adjusted — a swing in oil prices shows up entirely as a change in reported sales value.
- Apparel: +4.5% MoM, inventories -1.7% MoM (tightening)
- Chemicals: +1.4% MoM, +14.7% YoY — durable expansion
- Farm products: +2.1% MoM, +14.3% YoY
- Miscellaneous non-durables: -2.6% MoM, +0.3% YoY, roughly flat
Durable Goods Detail
Durable goods overall fell 0.8% MoM. Computer equipment fell a sharper 5.0% MoM, yet is still up 20.7% YoY, suggesting monthly noise rather than a trend reversal.
Statistical Caveat
The margin of error on the sales MoM figure is ±0.5% (90% CI). The calculated ex-petroleum decline of -0.18% sits comfortably within this noise band — this is analogous to how a spike in US retail sales driven by gasoline stations can mask flat ‘core’ retail sales. Strip out energy, and wholesale demand looks stable rather than contracting.
在庫・売上高比率1.19の実像
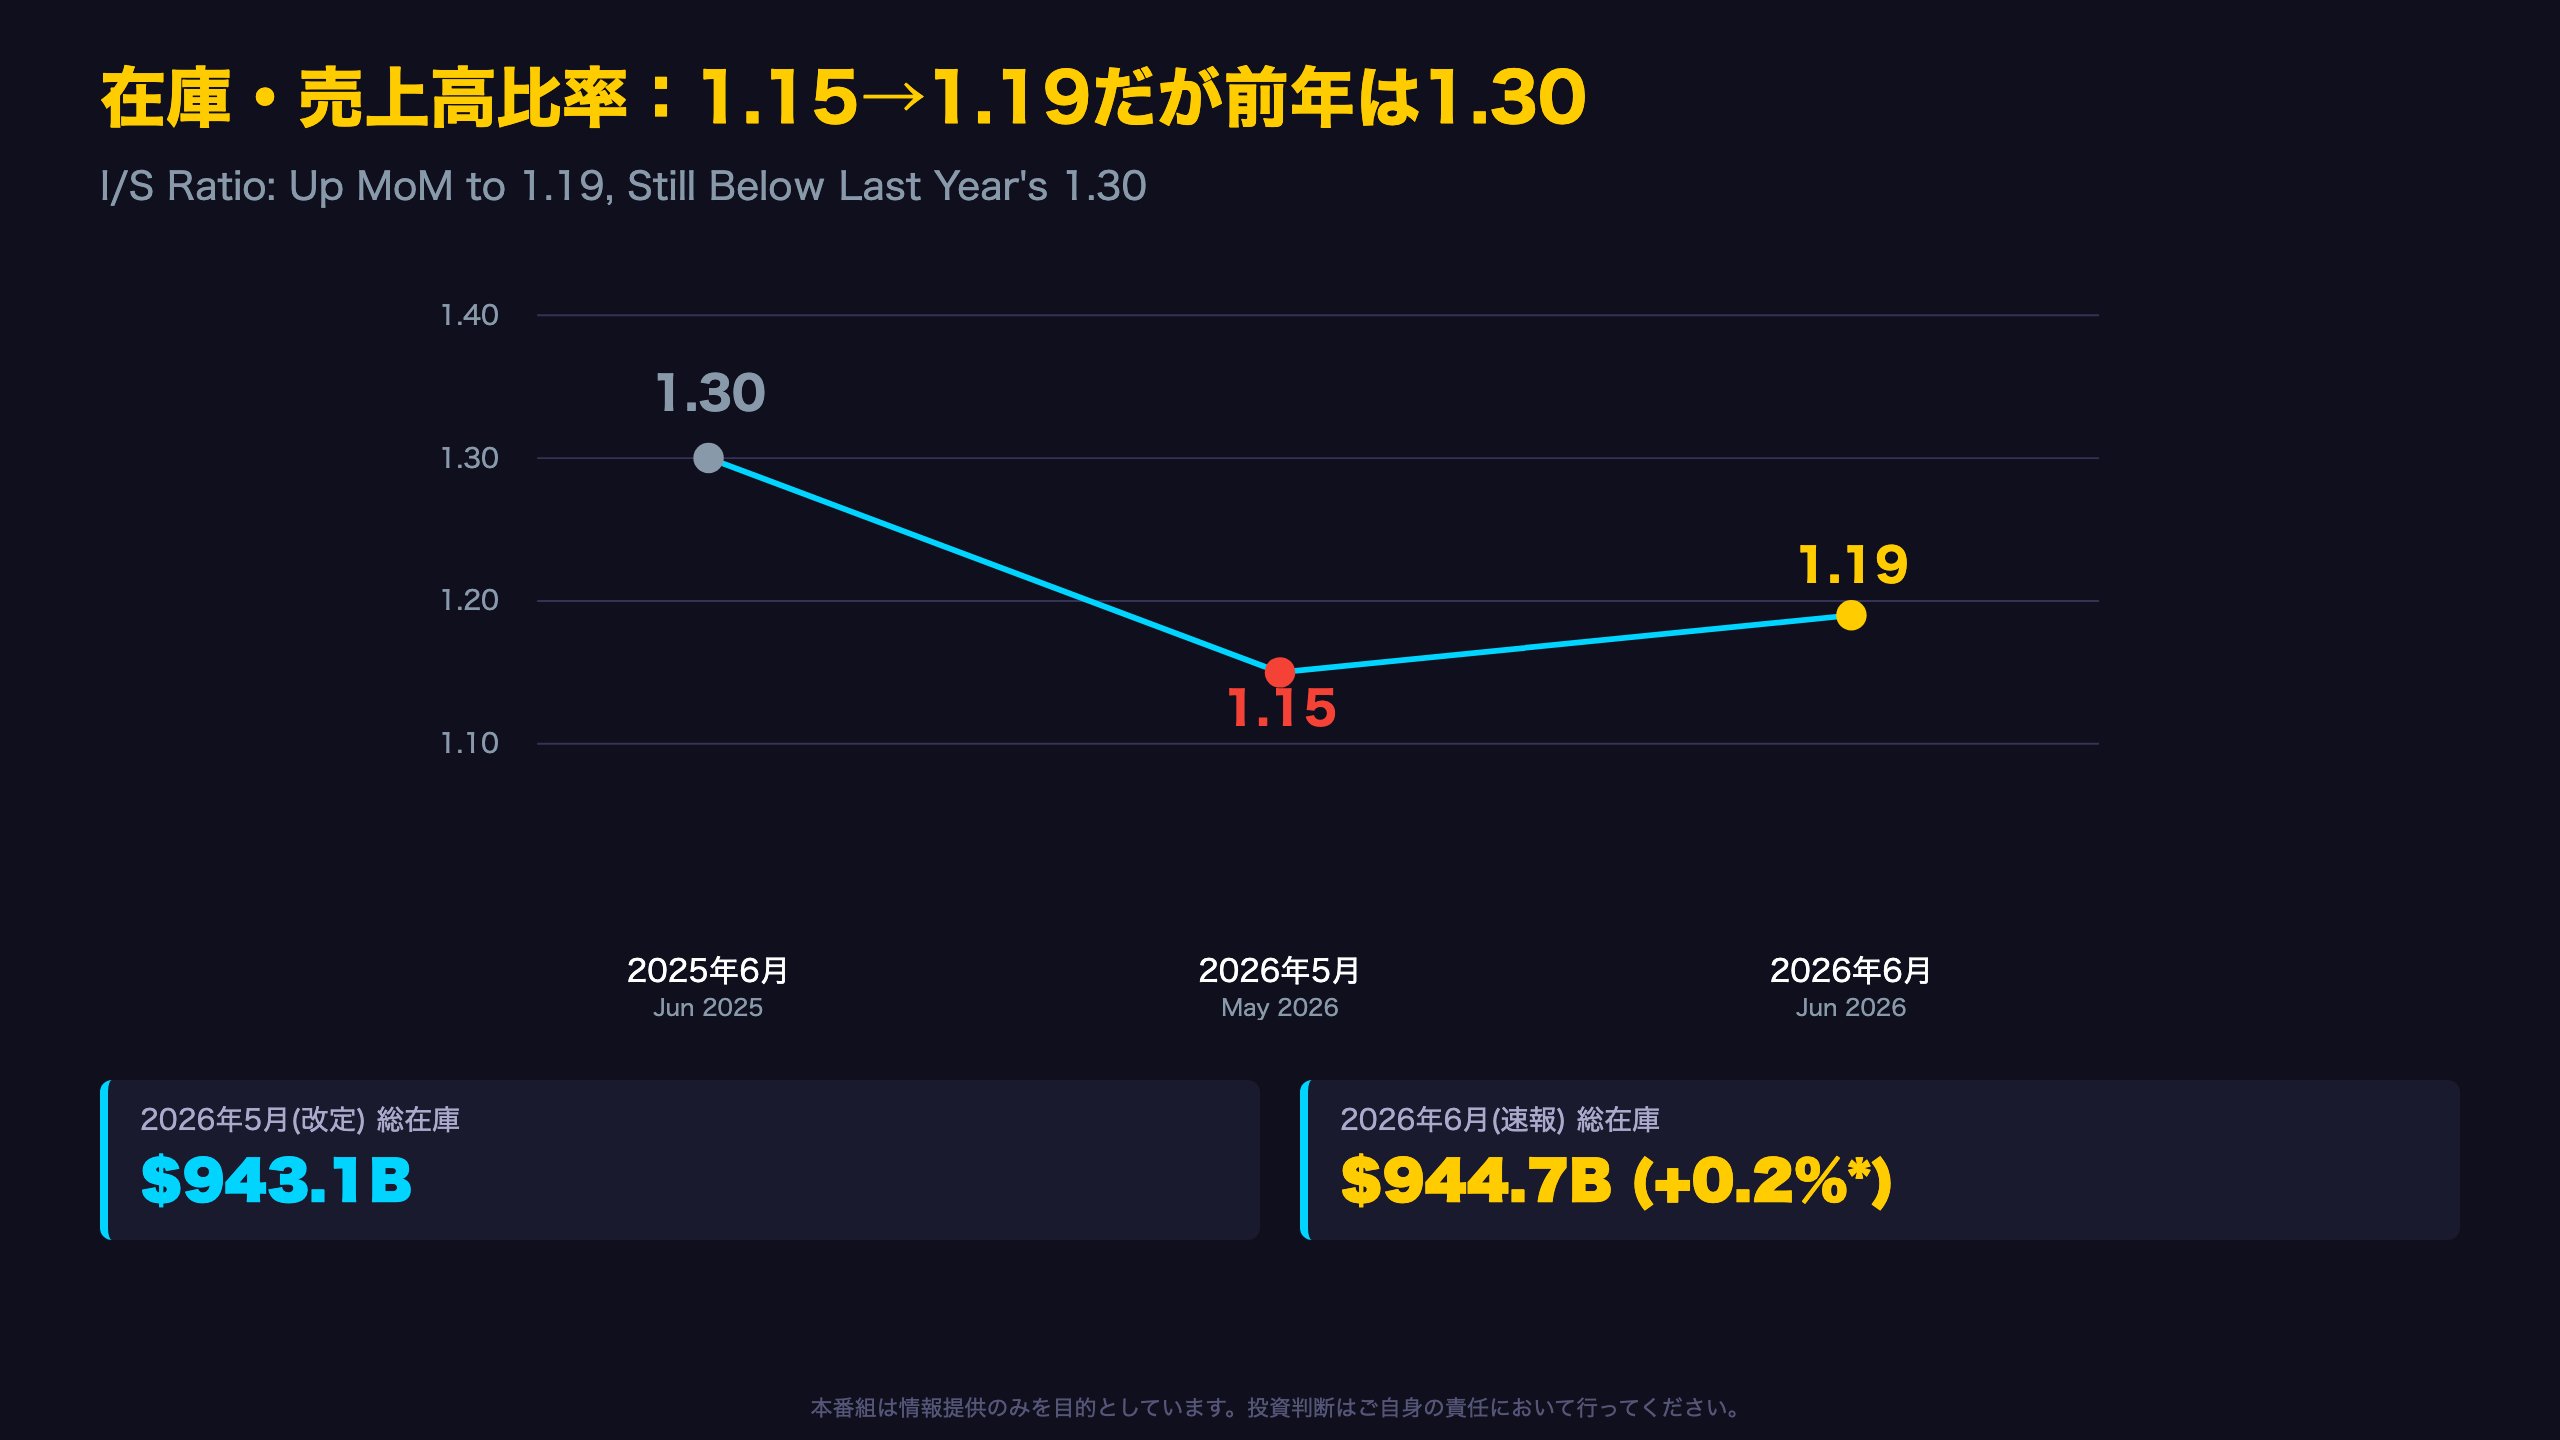
Inventories-to-Sales Ratio in Historical Context
The I/S ratio is the wholesale-sector equivalent of what equity analysts call ‘days of inventory’ — a lower number means faster turnover relative to sales, a sign of tight supply chains; a higher number signals potential overhang.
Chart Context
The Census Bureau’s own 2017-2026 chart plots the ratio between roughly 1.10 and 1.70. The pandemic-era supply shock pushed it to historic lows around 2021-2022, followed by a gradual recovery. June 2026’s 1.19 sits in the lower half of this decade-long range.
Table: Inventory Levels Across Report Vintages
| Release | Month | Inventories | Change |
|---|---|---|---|
| July report | Apr 2026 (r) | $940.7B | +0.7% |
| Aug report | May 2026 (re-revised) | $943.1B | +0.3% |
| Aug report | Jun 2026 (p) | $944.7B | +0.2%* |
*90% CI includes zero
Across the last two releases, the prior month’s growth rate has been revised upward — though two data points are not enough to call this a firm pattern.
The Other Side
A persistently low I/S ratio isn’t purely bullish — it also raises stockout risk if demand accelerates, echoing the 2021 semiconductor shortage dynamic. Watch September 10 for the July print to see if the ratio stabilizes near 1.15-1.19 or reverses higher.
業種別ヒートマップ:明暗の分かれる需給
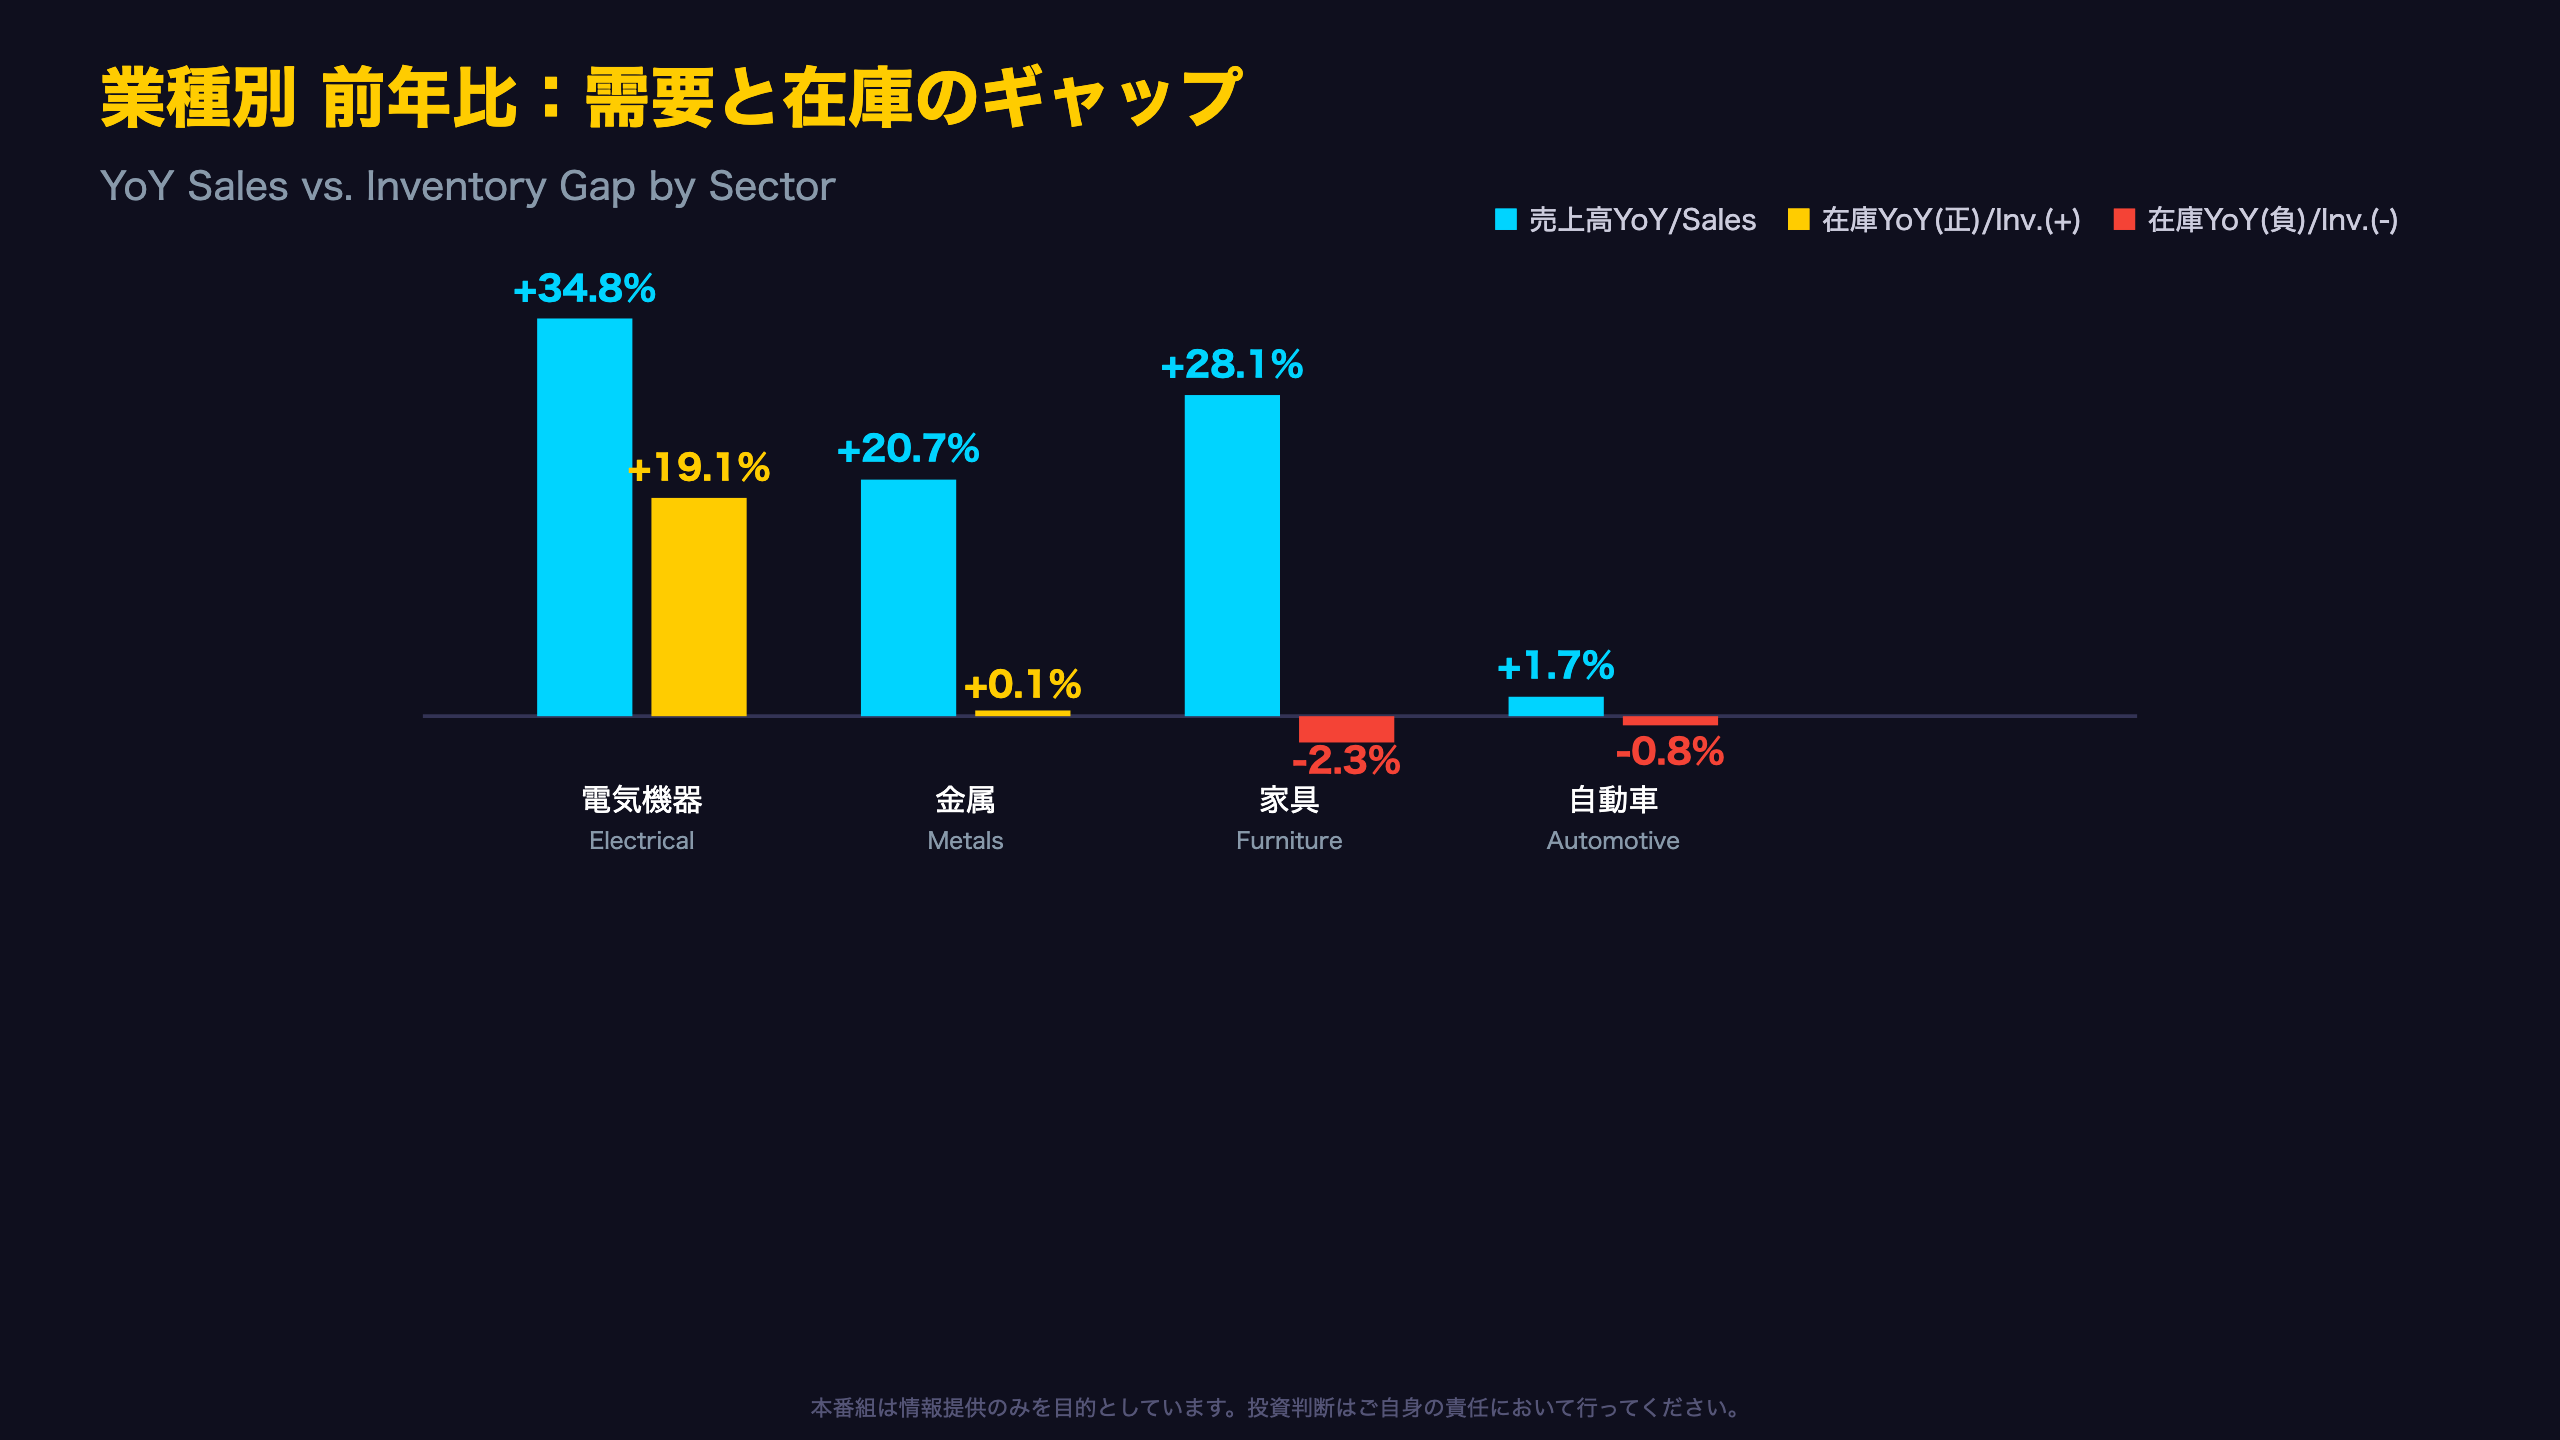
Sector Heatmap: A Possible AI-Capex Signature
NAICS 4236 (Electrical Equipment wholesale) covers distributors of items like switchgear, wiring, and power equipment — categories directly exposed to data center and grid buildout spending, a major theme in the current US capex cycle. This report cannot confirm end-use, but the magnitude of growth stands out.
The Metals Anomaly
Metals (NAICS 4235) sales are up 20.7% YoY while inventories are essentially flat (+0.1% YoY). One possible contributing factor is the 2025-2026 tariff environment on steel and aluminum imports, which may be altering wholesale restocking patterns — though this report alone cannot confirm the causal driver.
Table: YoY Comparison
| Sector | Sales YoY | Inventory YoY |
|---|---|---|
| Electrical | +34.8% | +19.1% |
| Metals | +20.7% | +0.1% |
| Furniture | +28.1% | -2.3% |
| Automotive | +1.7% | -0.8% |
Read-Through for Equities
Investors tracking industrial distributors may find this divergence relevant — strong demand paired with lean inventory can support pricing power for suppliers, but also signals vulnerability to supply disruption if demand keeps accelerating.
市場への含意:過剰在庫リスクは限定的
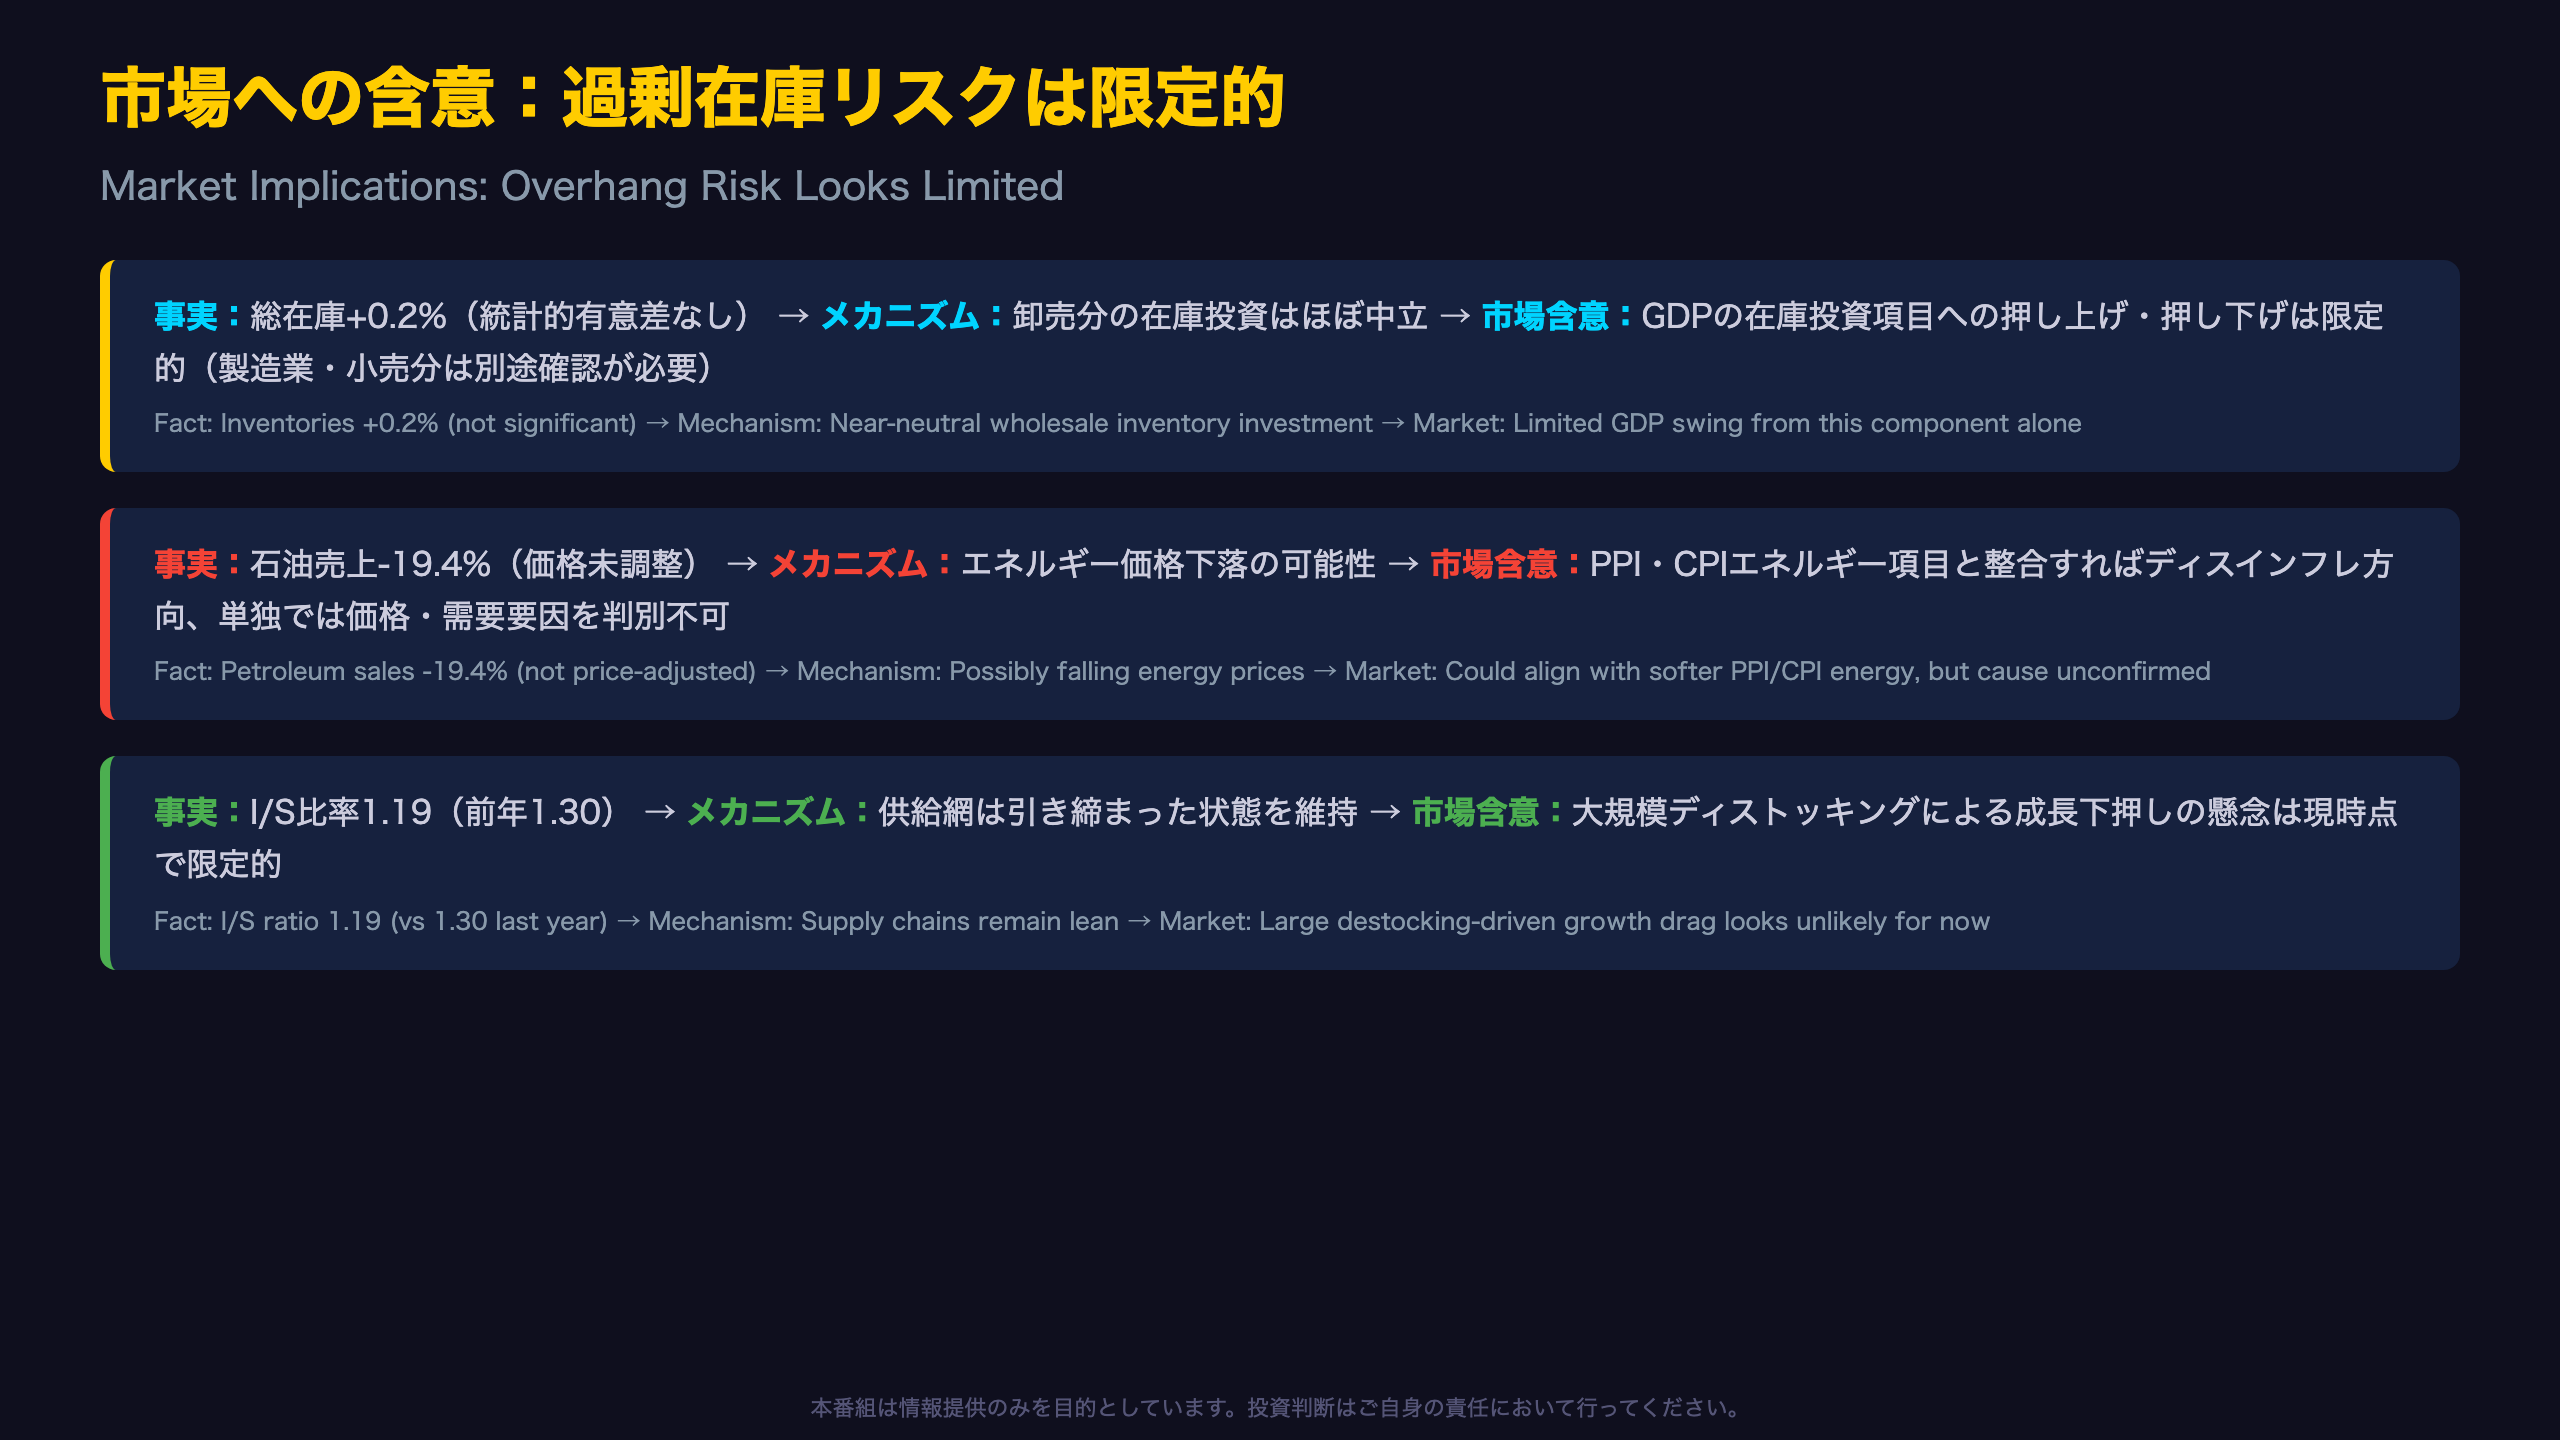
Connecting to Fed Policy and Markets
GDP Mechanics
Wholesale inventories are one of three inventory components (alongside retail and manufacturing) feeding into the BEA’s private inventories line in GDP. A statistically insignificant +0.2% MoM change suggests this component alone is unlikely to be a major swing factor for Q2 2026 GDP, though the full picture requires the retail and manufacturing releases too.
Inflation Angle
The -19.4% MoM plunge in petroleum sales (not price-adjusted) could reflect falling energy prices — worth cross-checking against the PPI energy component and CPI gasoline index when released. If aligned, it would support a modest disinflationary narrative; if not, it may reflect a genuine demand-side pullback instead.
Key Thresholds for July Data (Sept 10 release)
- Does YoY sales growth decelerate further below 14%?
- Does the I/S ratio push back above roughly 1.25, historically associated with destocking pressure?
- Do Electrical/Metals inventories accelerate faster than sales?
These are the concrete checkpoints for whether June’s pattern was noise or the start of a trend.
Disclaimer: This article is for informational purposes only. All investment decisions are made solely at your own risk.