
📺 Watch the Full Video Analysis
This article was automatically generated by the NFC Market Live AI analysis system. (Updated: 2026-08-04 23:13 JST)
📄 Primary Source
U.S. Bureau of Labor Statistics
https://www.bls.gov/news.release/pdf/jolts.pdf
📊 A deep dive into the June 2026 JOLTS report from the U.S. Bureau of Labor Statistics.
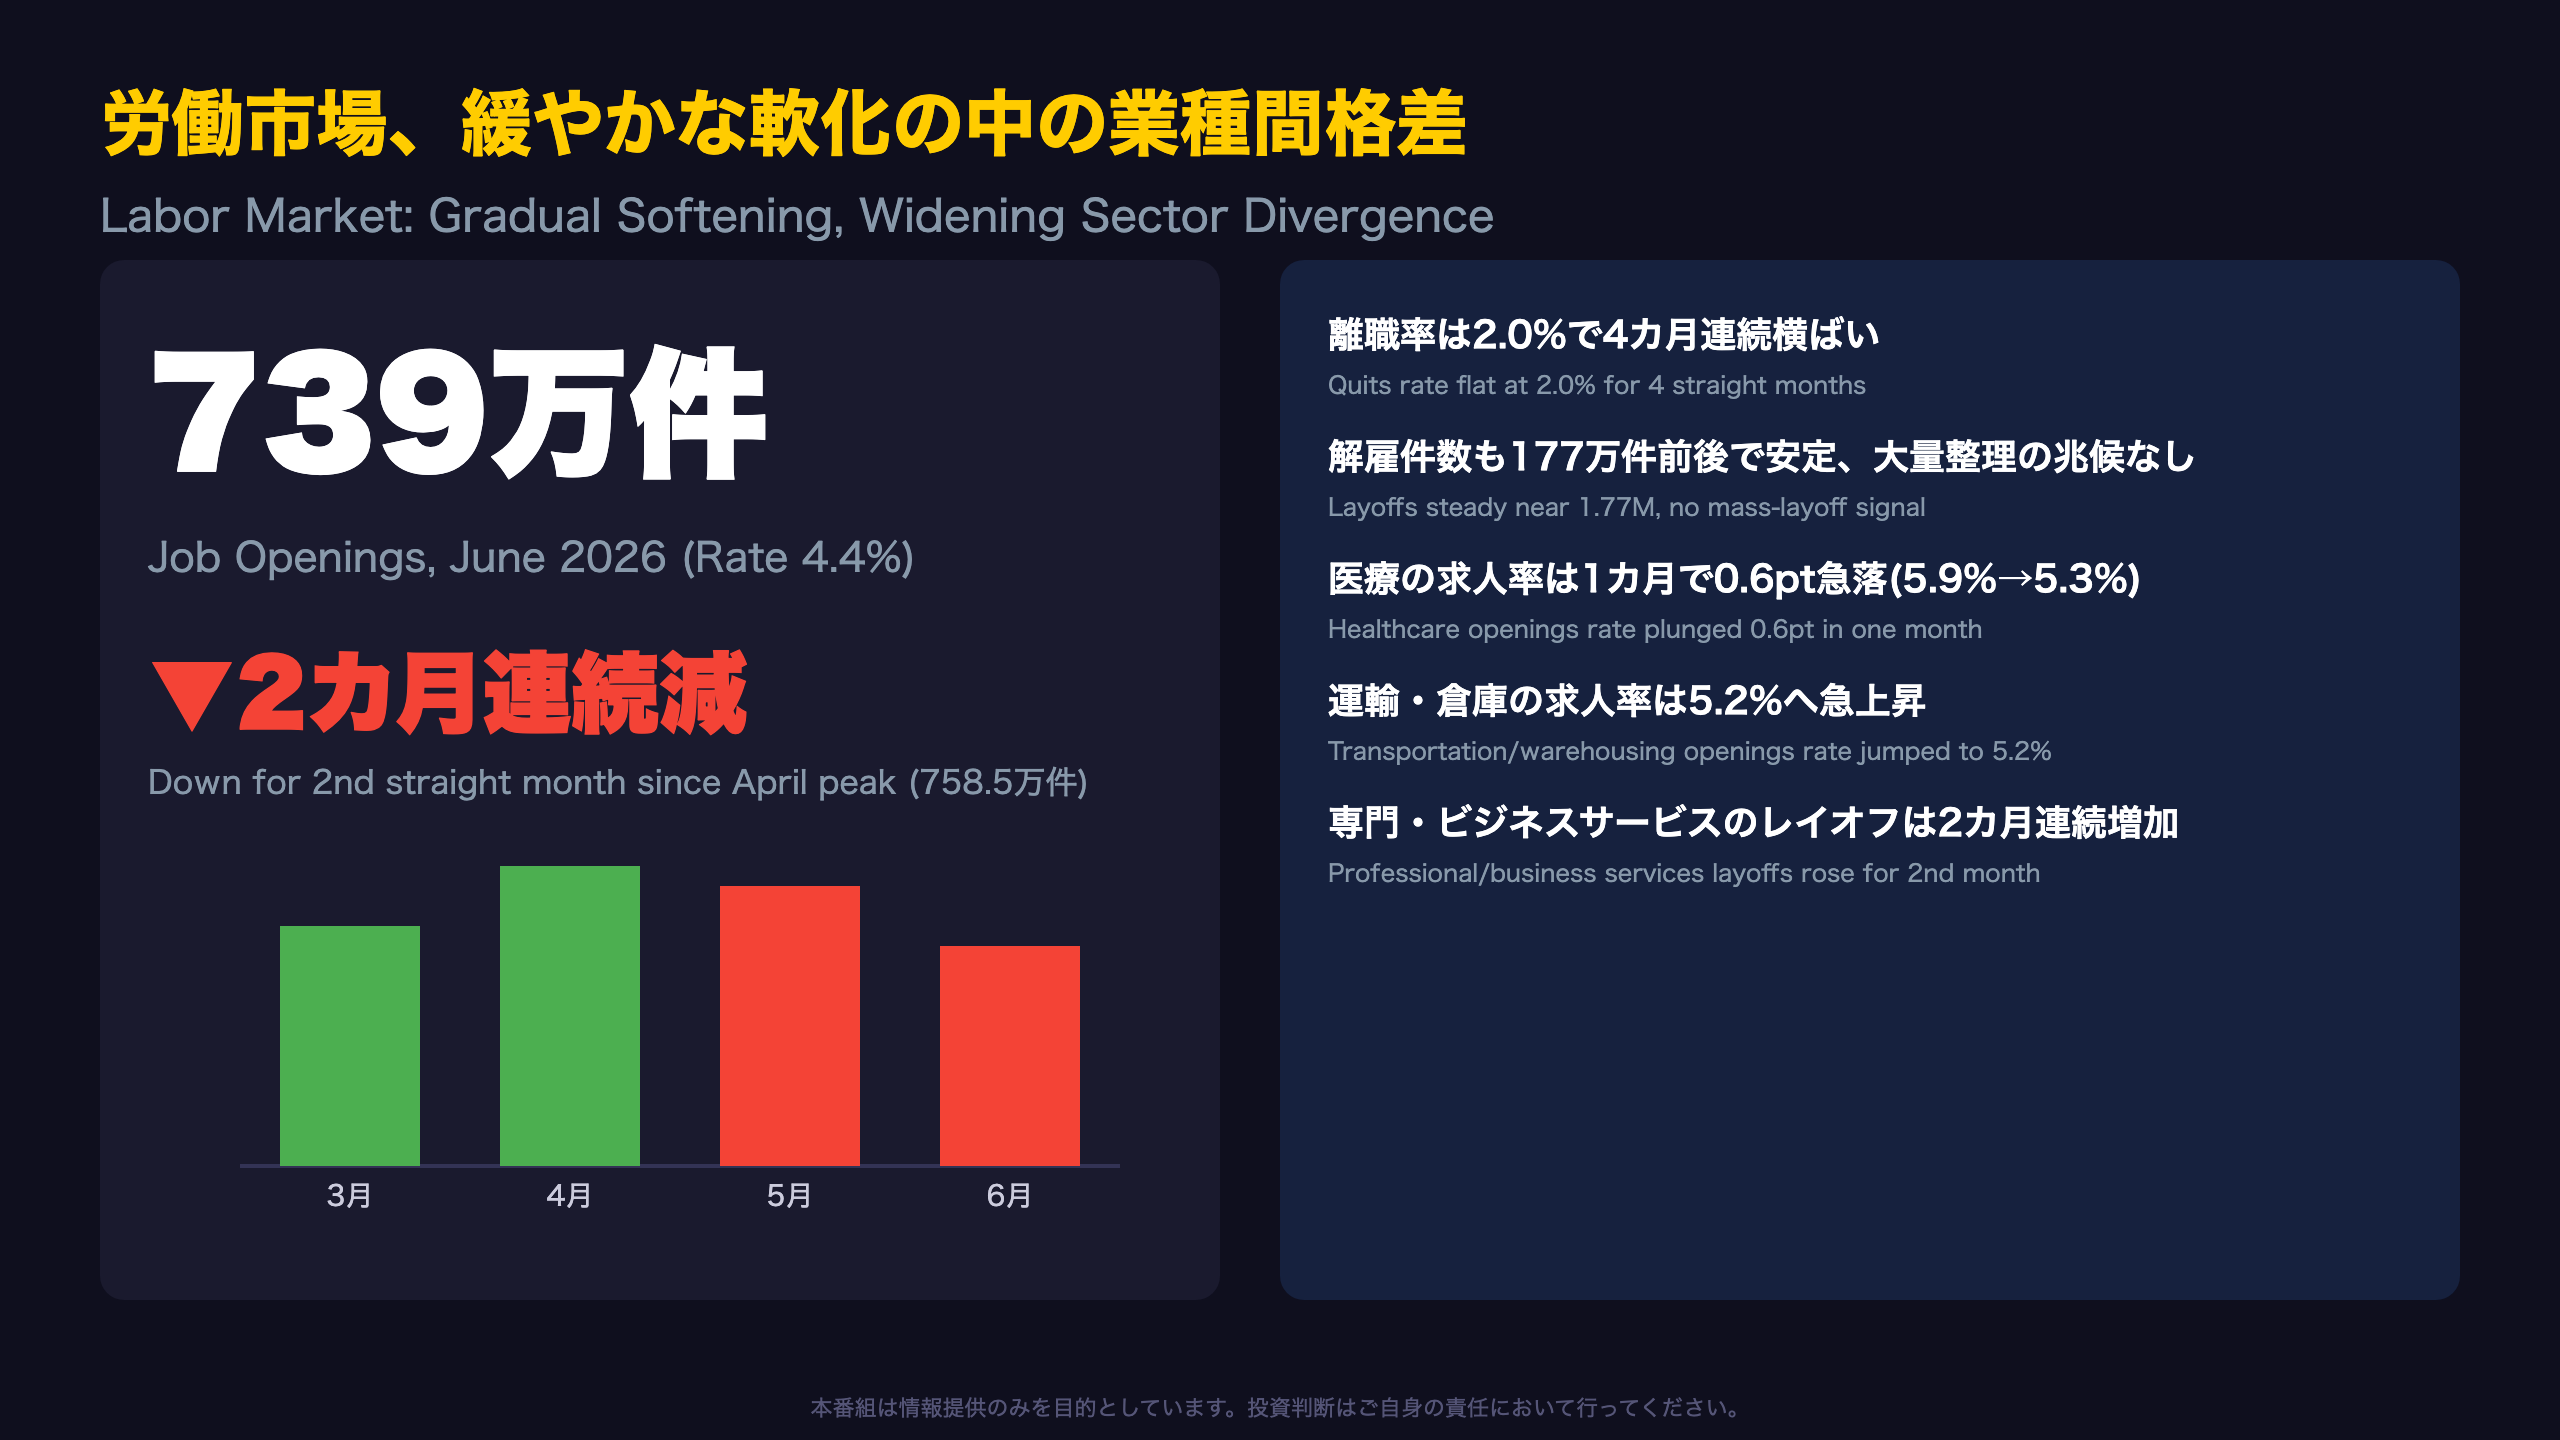
Job openings fell to 7.39 million — a second straight monthly decline — while the quits rate held flat at 2.0% for a fourth month.
💡 Healthcare openings rate plunged 0.6pt in a single month, while transportation/warehousing surged to 5.2%.
⚠️ Layoffs in professional and business services rose for a 2nd straight month, hinting at broadening white-collar adjustment.
📉 We break down the ‘low-hire, low-fire’ equilibrium hiding beneath the headline numbers.
労働市場、緩やかな軟化の中に潜む業種間の乖離
Job Openings: Reading Beyond “Little Changed”
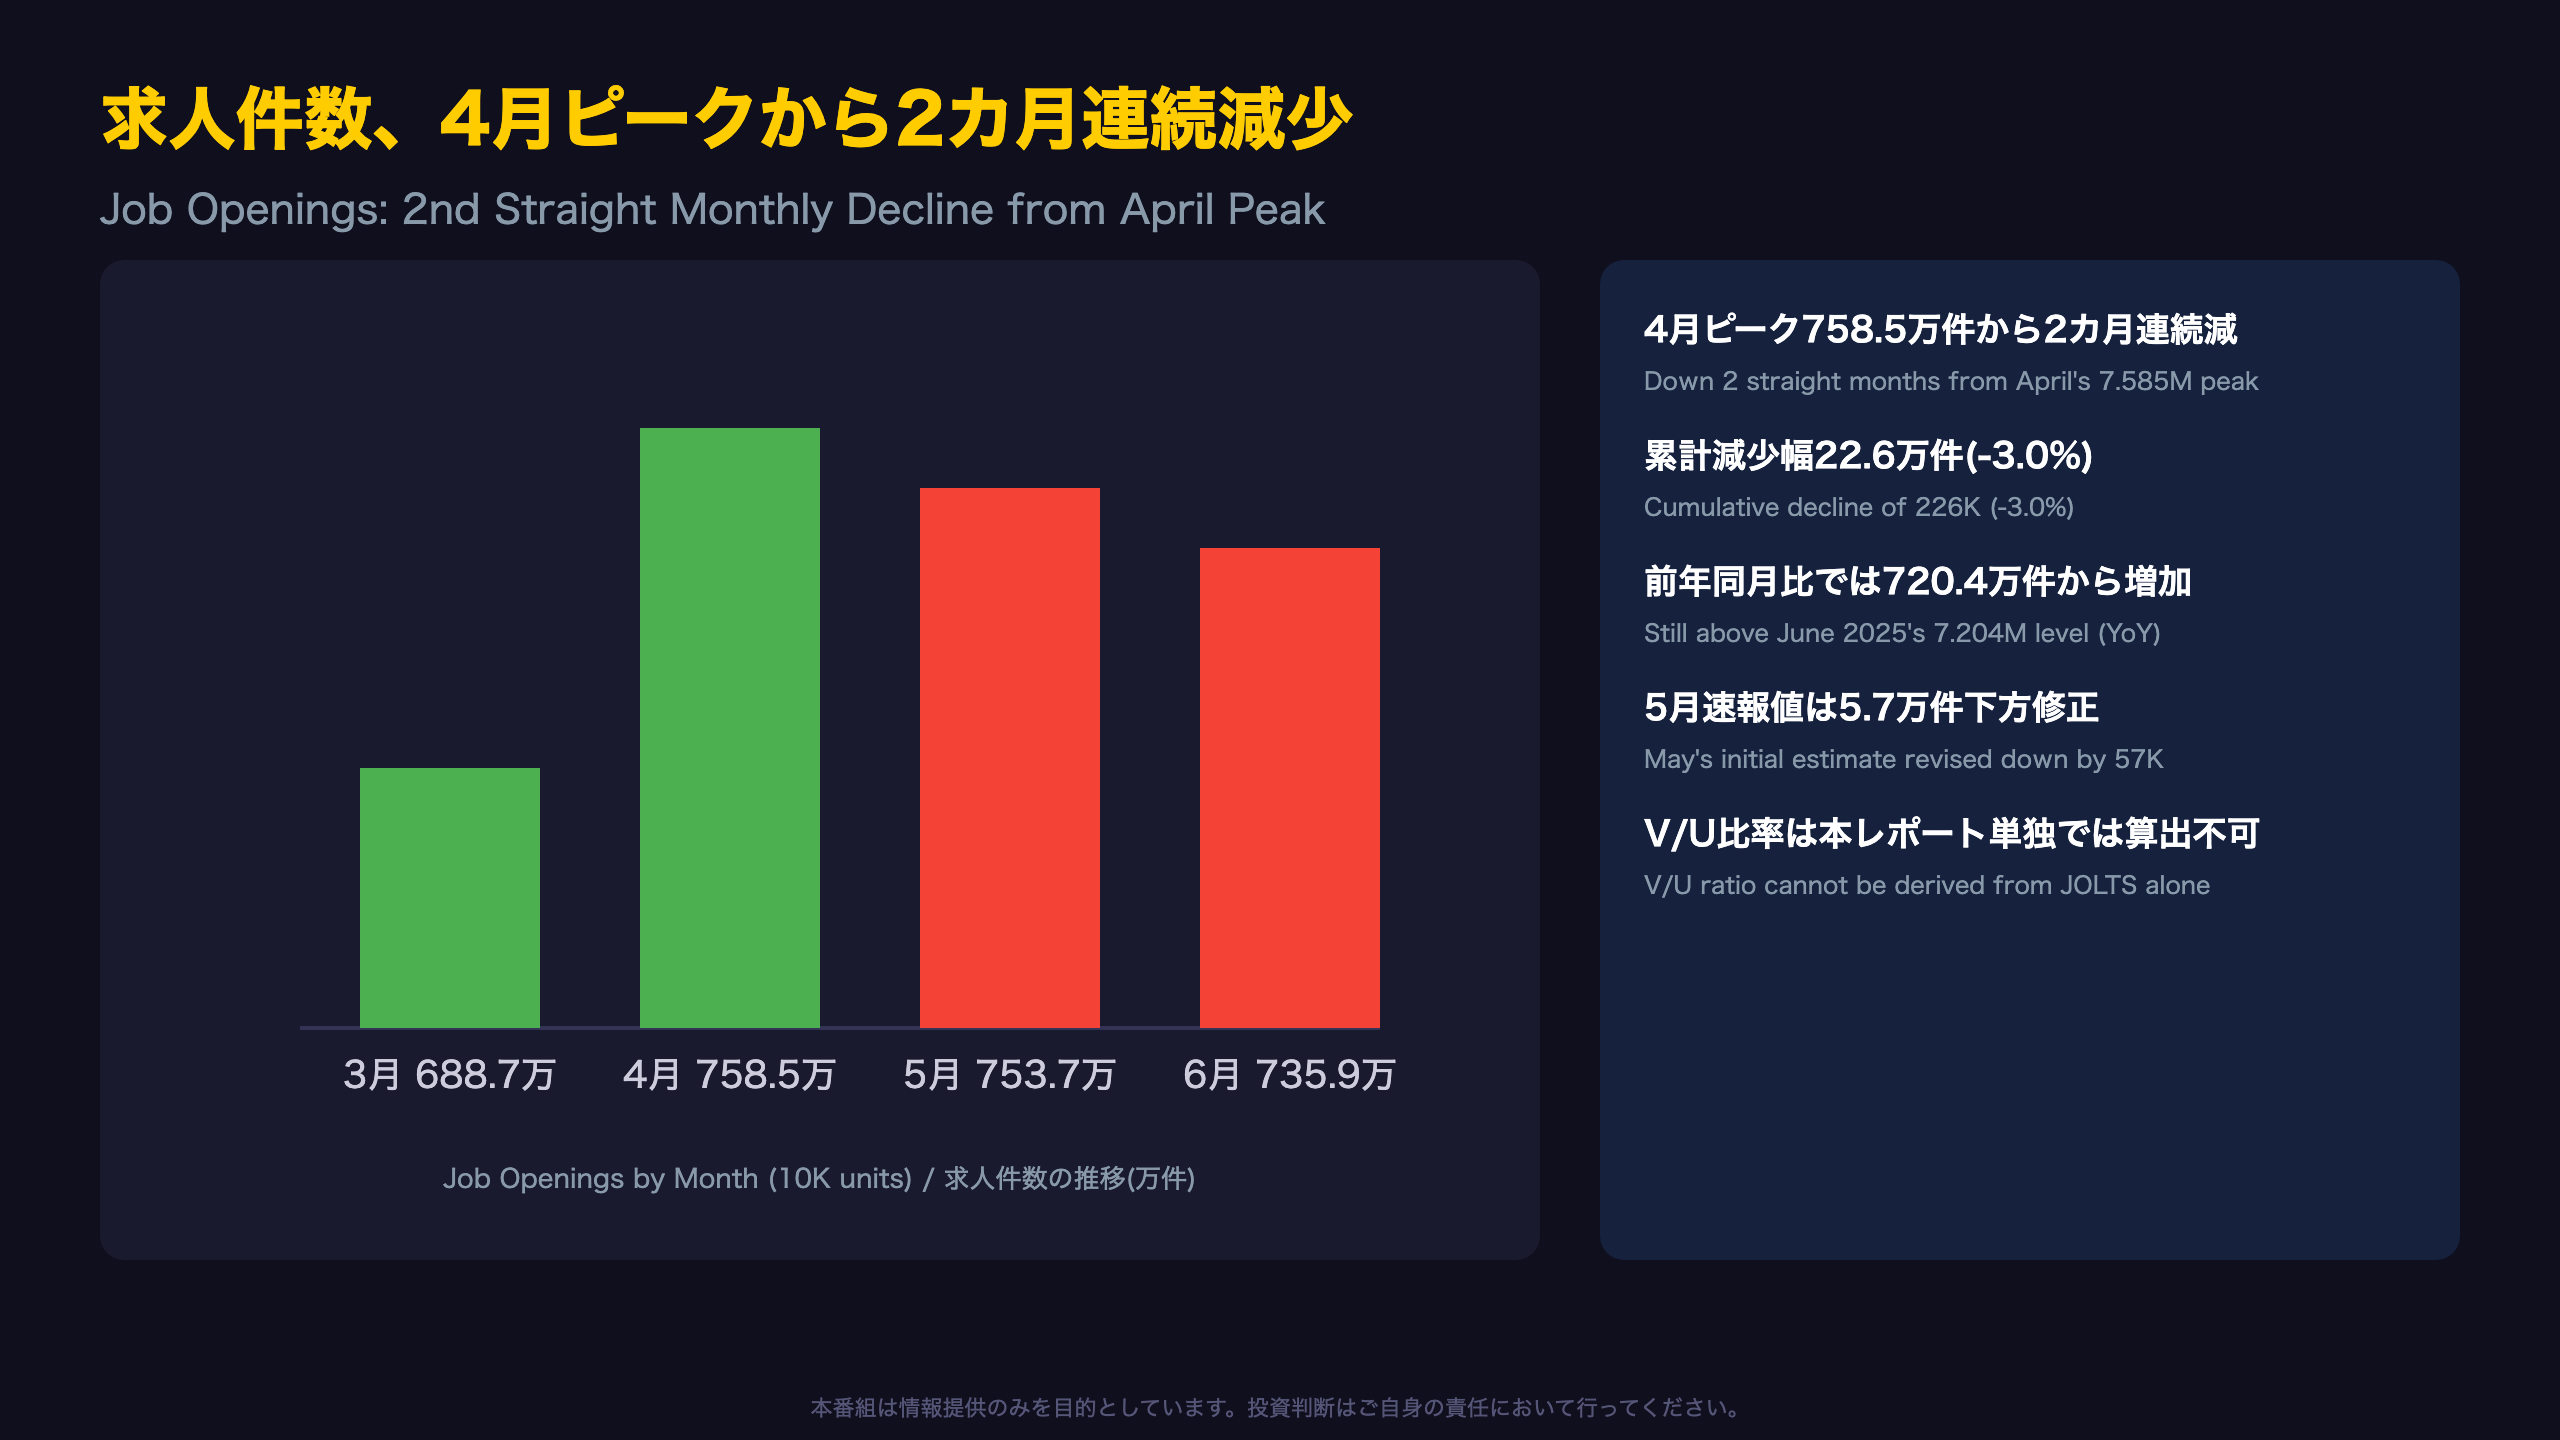
The Bureau of Labor Statistics (BLS) JOLTS survey — the U.S. equivalent of a vacancy and turnover census covering roughly 21,000 establishments — reported job openings at 7.36 million in June, technically “little changed” within its statistical margin. But the multi-month trajectory tells a more textured story: openings rose sharply from 6.89 million in March to 7.59 million in April, then slipped for two consecutive months to a revised 7.54 million in May and 7.36 million in June — a cumulative decline of about 226,000 (-3.0%) from the April peak.
Context for International Readers
Unlike the monthly Non-Farm Payrolls report, JOLTS is released with roughly a five-week lag and is one of the Fed’s preferred gauges of labor demand slack, alongside the unemployment rate. Because this release does not include the unemployment count, a precise Beveridge Curve (vacancy-to-unemployment) ratio cannot be computed from this data alone.
Revisions Matter
May’s initial estimate of 7.59 million was revised down by 57,000, even as hires, separations, and quits for May were all revised upward — a reminder that JOLTS’ preliminary prints carry meaningful measurement noise.
Year-over-Year Resilience
Compared to June 2025 (7.20 million, 4.3% rate), June 2026’s 7.36 million and 4.4% rate actually represent a modest year-over-year improvement, tempering the two-month sequential-softening narrative.
Market takeaway: a gradually cooling — but not collapsing — vacancy count is broadly consistent with the Fed’s ‘gradual normalization’ framing rather than an urgent recession signal. The next release, covering July data, is due September 1.
求人件数、4月ピークから2カ月連続で減少
Job Openings: Reading the Two-Month Pullback
Openings rose from 6.89 million (4.2%) in March to a 2026 high of 7.59 million (4.6%) in April, then eased to a revised 7.54 million (4.5%) in May and 7.36 million (4.4%) in June — two consecutive monthly declines. One reasonable reading (Level B) is that April’s spike itself may have been partly noise, with June settling closer to the March-April midpoint rather than signaling a fresh downtrend.
Why the V/U Ratio Can’t Be Computed Here
Unlike the “job openings rate” (openings ÷ [employment + openings]), the classic vacancy-to-unemployment (V/U) ratio requires the unemployment count from the concurrent Employment Situation report, which is not part of this JOLTS release. Readers should treat the JOLTS rate as a demand-side proxy only, not a full labor-market-slack indicator.
Revision Risk Is Real
May’s initial print of 7.59 million was cut by 57,000 in this release, even as hires, separations, and quits for May were all revised upward — illustrating that first-month JOLTS estimates carry non-trivial noise before later revision.
Bottom line: two months of sequential softening is a real trend worth watching, but it should be read alongside a still-favorable year-over-year comparison (7.20 million in June 2025 vs. 7.36 million in June 2026). The next release, covering July data, arrives September 1.
離職率2.0%、4カ月連続横ばいが示す労働者心理
Quits Rate: A Four-Month Plateau
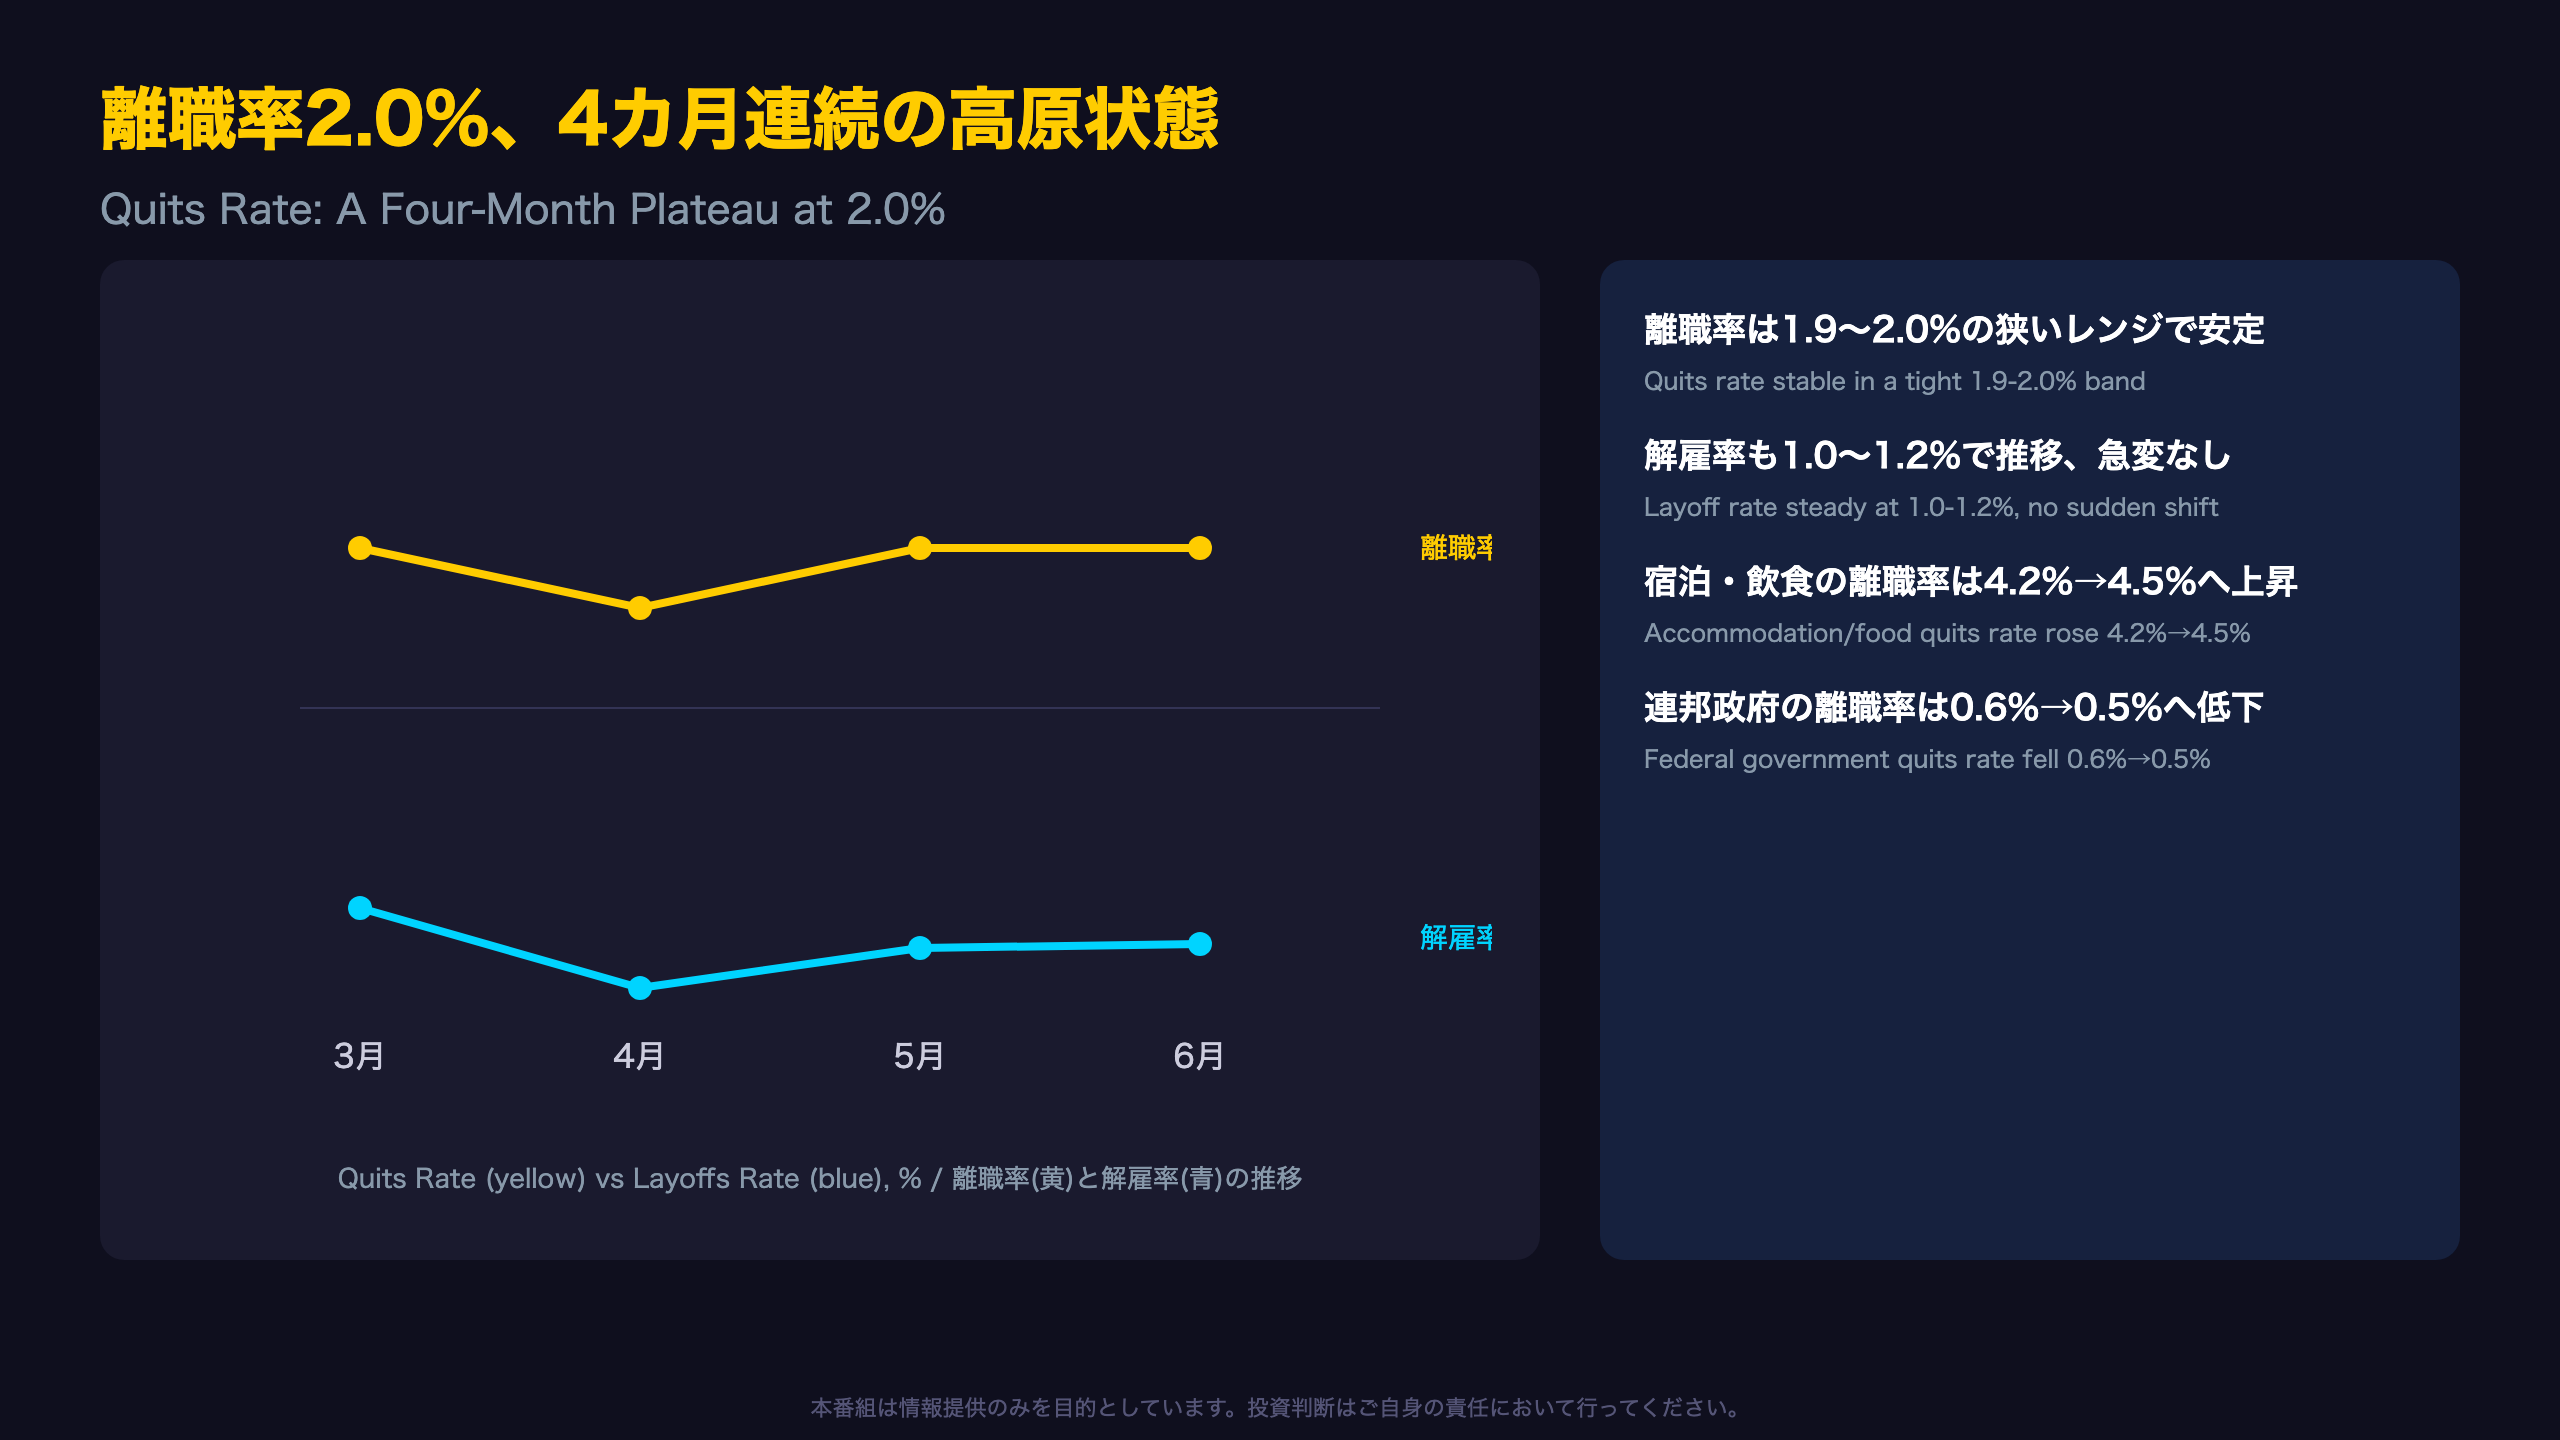
The quits rate — voluntary separations as a share of employment — is one of the Fed’s preferred proxies for worker bargaining power and confidence, since it reflects a willingness to leave a job in search of something better. The rate has held in a tight 1.9%-2.0% band for four straight months (2.0% in March, 1.9% in April, 2.0% in May, 2.0% in June), a stability that itself is a modest data point: it suggests worker confidence is neither collapsing nor re-accelerating.
Sector Divergence Beneath the Surface
Not all industries moved in lockstep. Accommodation and food services saw its quits rate climb from 4.2% in May to 4.5% in June (598K to 638K), and broader leisure and hospitality quits rose from 664K to 704K — suggesting service-sector workers may still feel comfortable switching jobs. Meanwhile, federal government quits fell from 0.6% to 0.5% (16K to 12K), a sign of reduced mobility in that segment specifically.
These are single-month, sector-specific data points and should not be read as evidence that “worker confidence has broadly strengthened” across the economy.
Layoffs: No Wave, But Some Noise
Layoffs and discharges have hovered near 1.7-1.9 million for four months (1.884M in March, a dip to 1.667M in April, then 1.761M and 1.766M in May/June) — consistent with the broader “low-hire, low-fire” characterization that has described the U.S. labor market through much of this cycle.
For U.S.-based readers: this pattern echoes what economists sometimes call a “frozen” labor market — low churn on both the hiring and firing side — distinct from either a tight, overheating market or a recessionary shakeout.
医療の求人急减速、運輸・倉庫は逆に加速

Healthcare’s Vacancy Squeeze May Be Easing
Healthcare and social assistance — long cited as the poster child of the post-pandemic labor shortage — posted a 0.6 percentage point drop in its job openings rate in a single month (5.9% in May to 5.3% in June), a large move by JOLTS standards. Looking at the broader run (5.5% in March, 5.6% in April, 5.9% in May, 5.3% in June), the sector appears to have peaked in May before reversing sharply.
Notably, hires in healthcare rose (632K to 701K) and the quits rate ticked up (1.8% to 1.9%) in the same month — a combination that could suggest the sector is finally succeeding in filling long-standing vacancies rather than simply losing demand (Level C: one plausible reading). A single month of data, however, is not enough to declare the structural healthcare shortage resolved.
Transportation and Federal Government: A Curious Contrast
Transportation, warehousing, and utilities posted the largest openings-rate increase in the release, up 1.3 points (3.9% to 5.2%, +97,000 openings) — the top industry gainer BLS specifically called out. Federal government openings also rose 1.3 points (3.6% to 4.9%, +39,000), but federal hires fell (34K to 28K) and federal quits fell (16K to 12K) in the same month.
That combination — more postings, fewer hires and fewer quits — hints that supply-side constraints (e.g., hiring freezes or budget uncertainty) may be limiting how quickly federal openings convert into actual headcount changes. This remains a single-month, single-sector observation and should not be generalized to the whole public sector.
For international readers: JOLTS’ industry breakdown, using 2022 NAICS classification, offers a granularity broadly comparable to Eurostat’s job vacancy statistics by NACE sector, though methodologies differ.
専門・ビジネスサービスのレイオフ2カ月連続増、大企業と中小企業で明暗
A Slow-Building Signal in White-Collar Employment
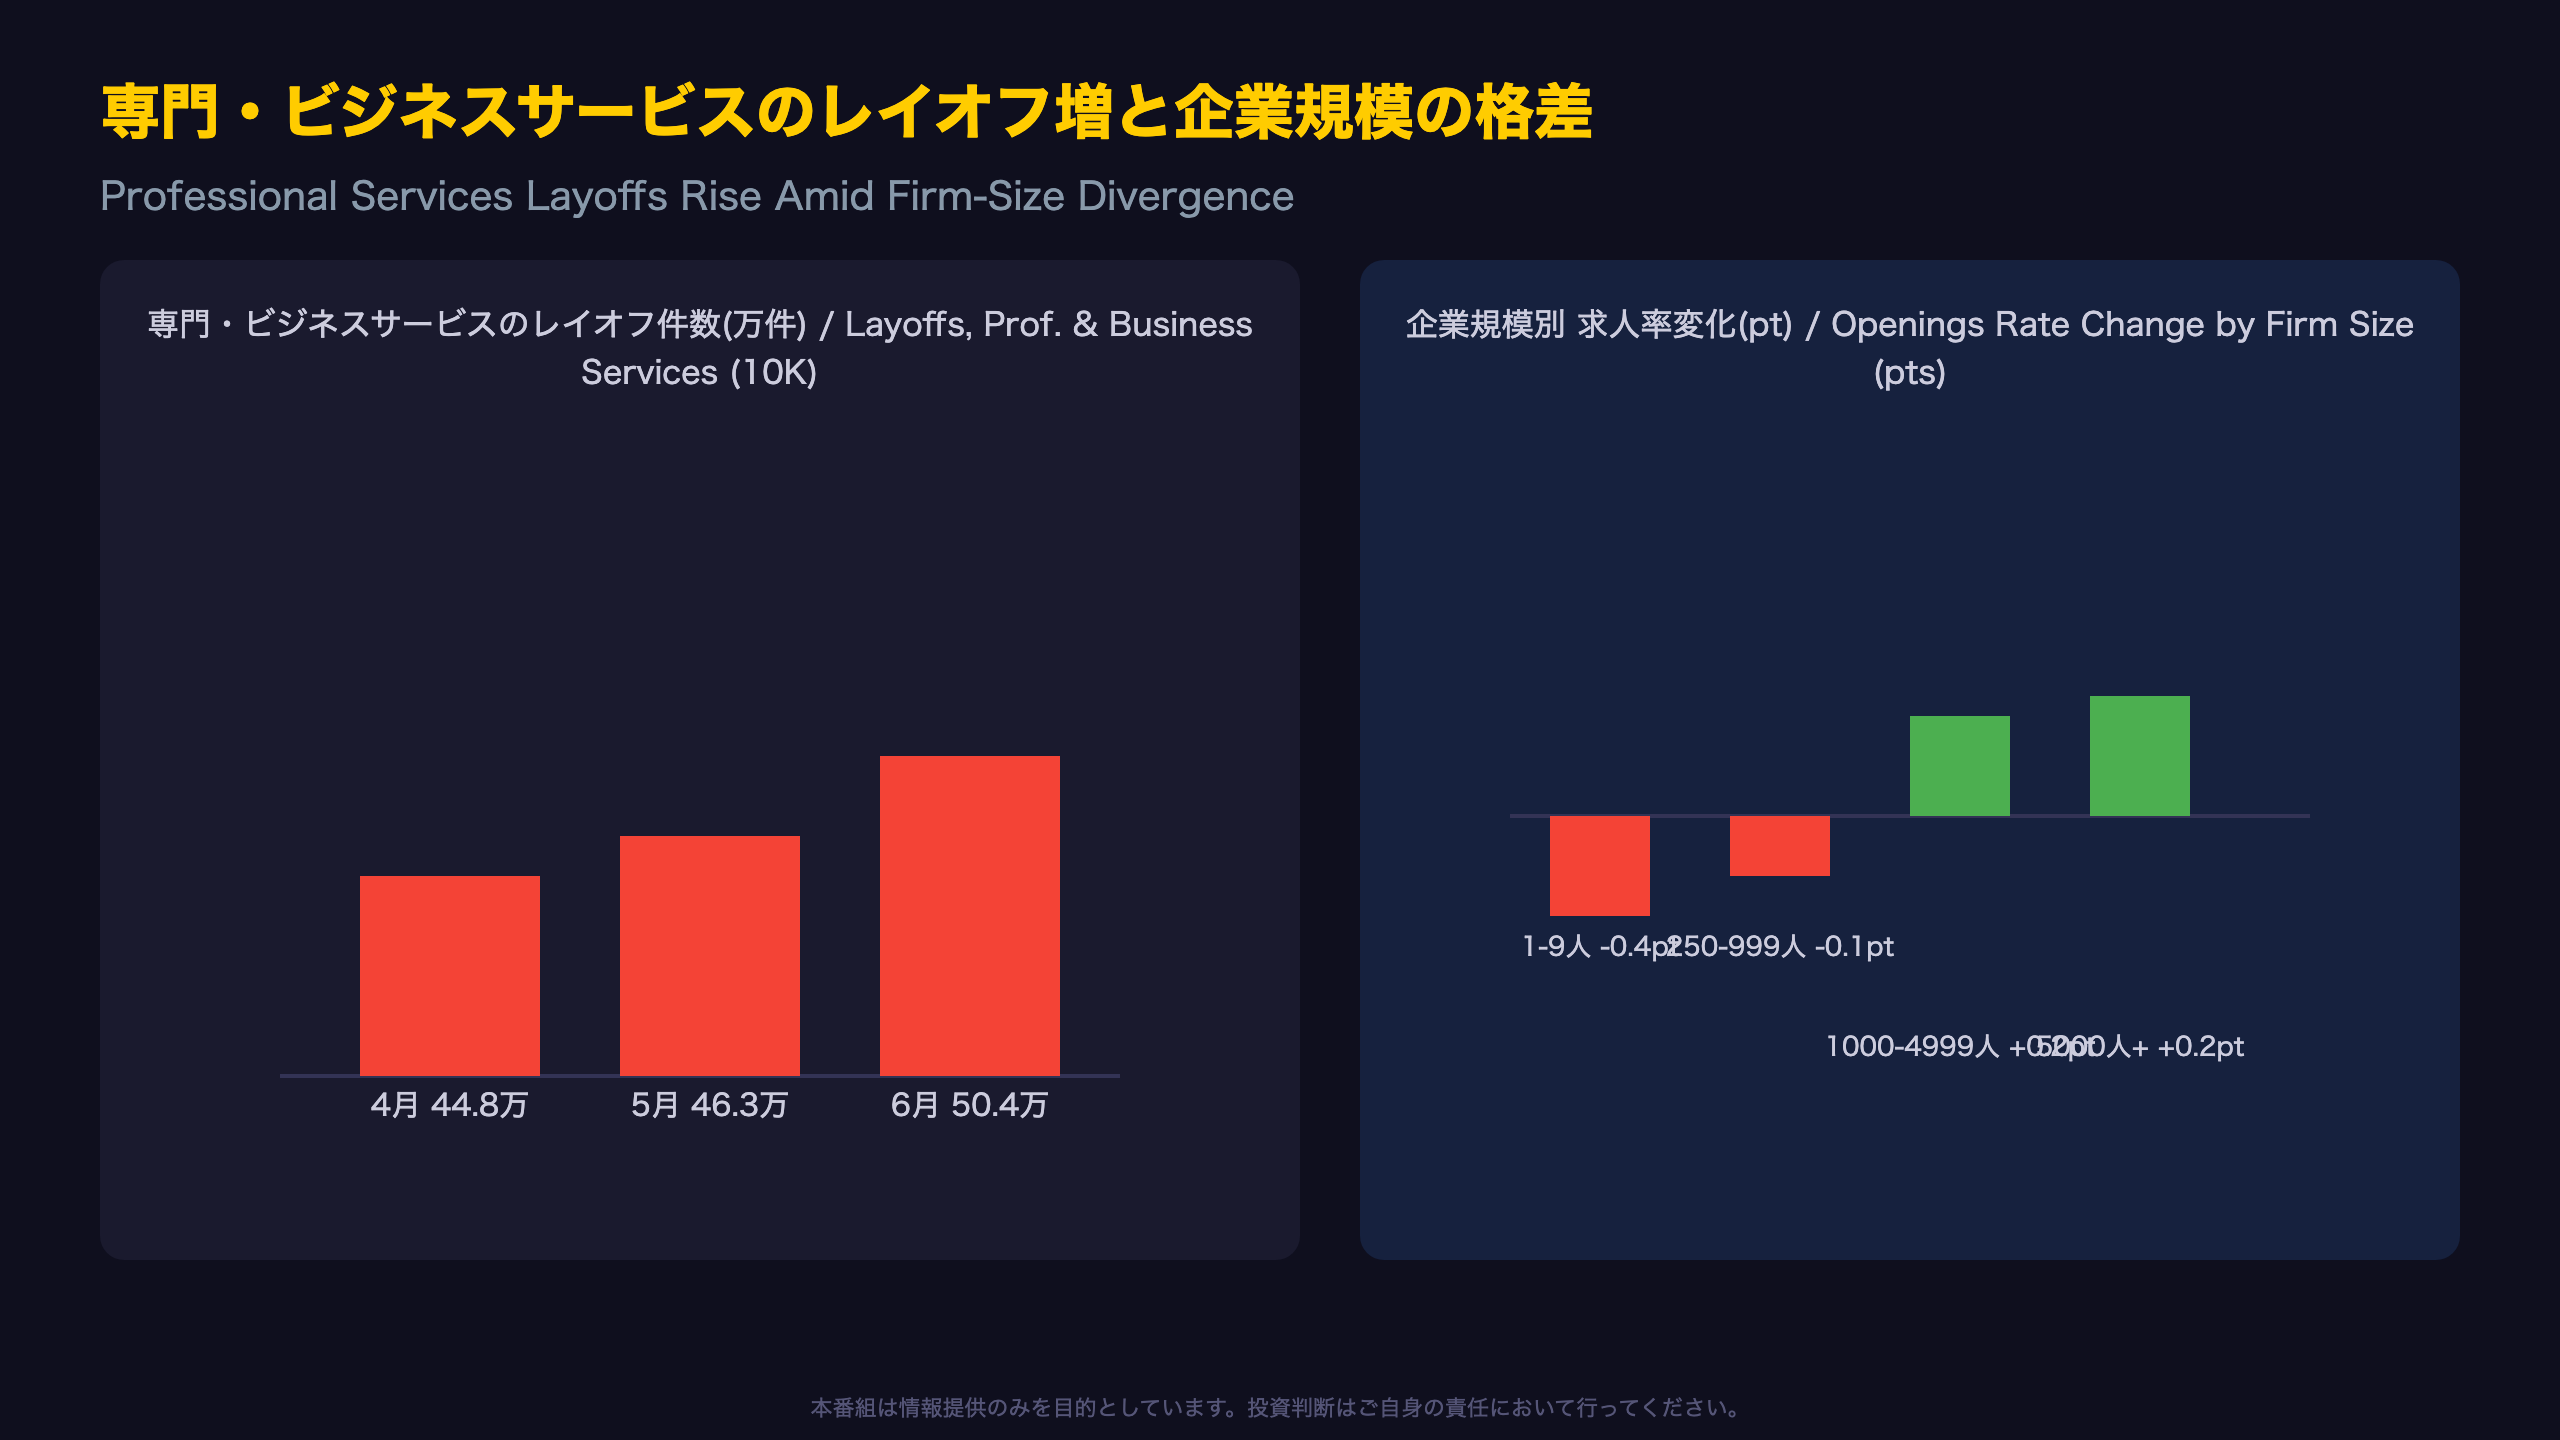
Layoffs in professional and business services — a category that includes consulting, legal, corporate support, and technology-adjacent services — rose for two consecutive months: 448,000 in April, 463,000 in May, and 504,000 in June, pushing the layoff rate from 2.1% to 2.2%. Combined with the sector’s job openings rate falling from 5.8% to 5.5% over the same period, the pattern (Level B: multiple months, same direction) suggests employers are both hiring less and trimming more within this historically high-wage segment.
A Widening Gap by Firm Size
Establishment-size data reveal a similar bifurcation. Small businesses (1-9 employees) saw their openings rate fall from 6.1% to 5.7%, and mid-sized firms (250-999 employees) slipped from 4.4% to 4.3%. By contrast, larger employers — 1,000-4,999 employees (5.6% to 5.8%) and 5,000+ employees (5.0% to 5.2%) — both posted increases. One plausible reading (Level C) is that larger firms have greater balance-sheet resilience and continue to post openings even as smaller firms turn more cautious, though a single month of data cannot confirm this as a durable structural shift.
What to Watch Next
The next JOLTS release (July data, due September 1) will be the key test of whether professional/business-services layoffs extend to a third consecutive monthly increase — a threshold that would meaningfully strengthen the case that white-collar labor adjustment is broadening rather than a one-off blip.
Context for global investors: this sector overlaps significantly with the employee base of large-cap technology, financial services, and consulting firms — names frequently covered in U.S. equity market commentary — making this JOLTS sub-index a useful, if imperfect, real-time proxy for corporate headcount sentiment ahead of quarterly earnings calls.
市場への示唆:「低採用・低解雇」均衡の中の構造変化

Market Implications, Traced Through the Chain of Evidence
Falling openings → cooling labor demand → groundwork for continued rate normalization
Job openings fell from 7.585 million in April to 7.359 million in June — two consecutive monthly declines. A sustained downtrend in vacancies is generally associated with cooling labor demand, which could reduce the Fed’s concern about an overheating labor market. That said, this is a general economic relationship — this single JOLTS release cannot, on its own, determine the outcome of the Fed’s next policy meeting.
Stable quits rate → unchanged bargaining power → contained (not resolved) wage-inflation risk
The quits rate has held at 2.0% for four straight months. A falling quits rate is typically linked to easing wage pressure, but a rate that is merely flat — not declining — suggests wage inflation risk is contained rather than actively subsiding.
Rising professional-services layoffs → broadening white-collar adjustment → a watch-point for high-wage-sensitive consumption and equities
Layoffs in professional and business services rose for two consecutive months (448K in April to 504K in June), hinting that employment adjustment in this segment may not be a one-off. Because this sector’s workforce skews toward higher-income, discretionary-spending-sensitive consumers, categories like dining out, travel, and luxury goods warrant continued monitoring alongside equities exposed to corporate professional-services demand.
Bottom Line
Taken together, this release is broadly consistent with a ‘soft landing’ narrative at the aggregate level, even as sector- and firm-size-level divergences widen beneath the surface. The next JOLTS release, covering July data, arrives September 1, 2026, and will be an important test of whether these divergent trends persist or reverse.
For global macro investors: JOLTS remains one of the Fed’s most closely watched real-time labor-demand indicators, alongside Non-Farm Payrolls and the Employment Cost Index. A continuation of the ‘low-hire, low-fire’ pattern documented here would be broadly consistent with market pricing for a gradual, rather than urgent, easing cycle — though this report alone cannot confirm the FOMC’s forward path.
Disclaimer: This article is for informational purposes only. All investment decisions are made solely at your own risk.