📺 Watch the Full Video Analysis
This article was automatically generated by the NFC Market Live AI analysis system. (Updated: 2026-08-04 23:10 JST)
📄 Primary Source
U.S. Census Bureau
https://www.census.gov/manufacturing/m3/prel/pdf/s-i-o.pdf
📊 The US Census Bureau just released May’s durable goods orders.
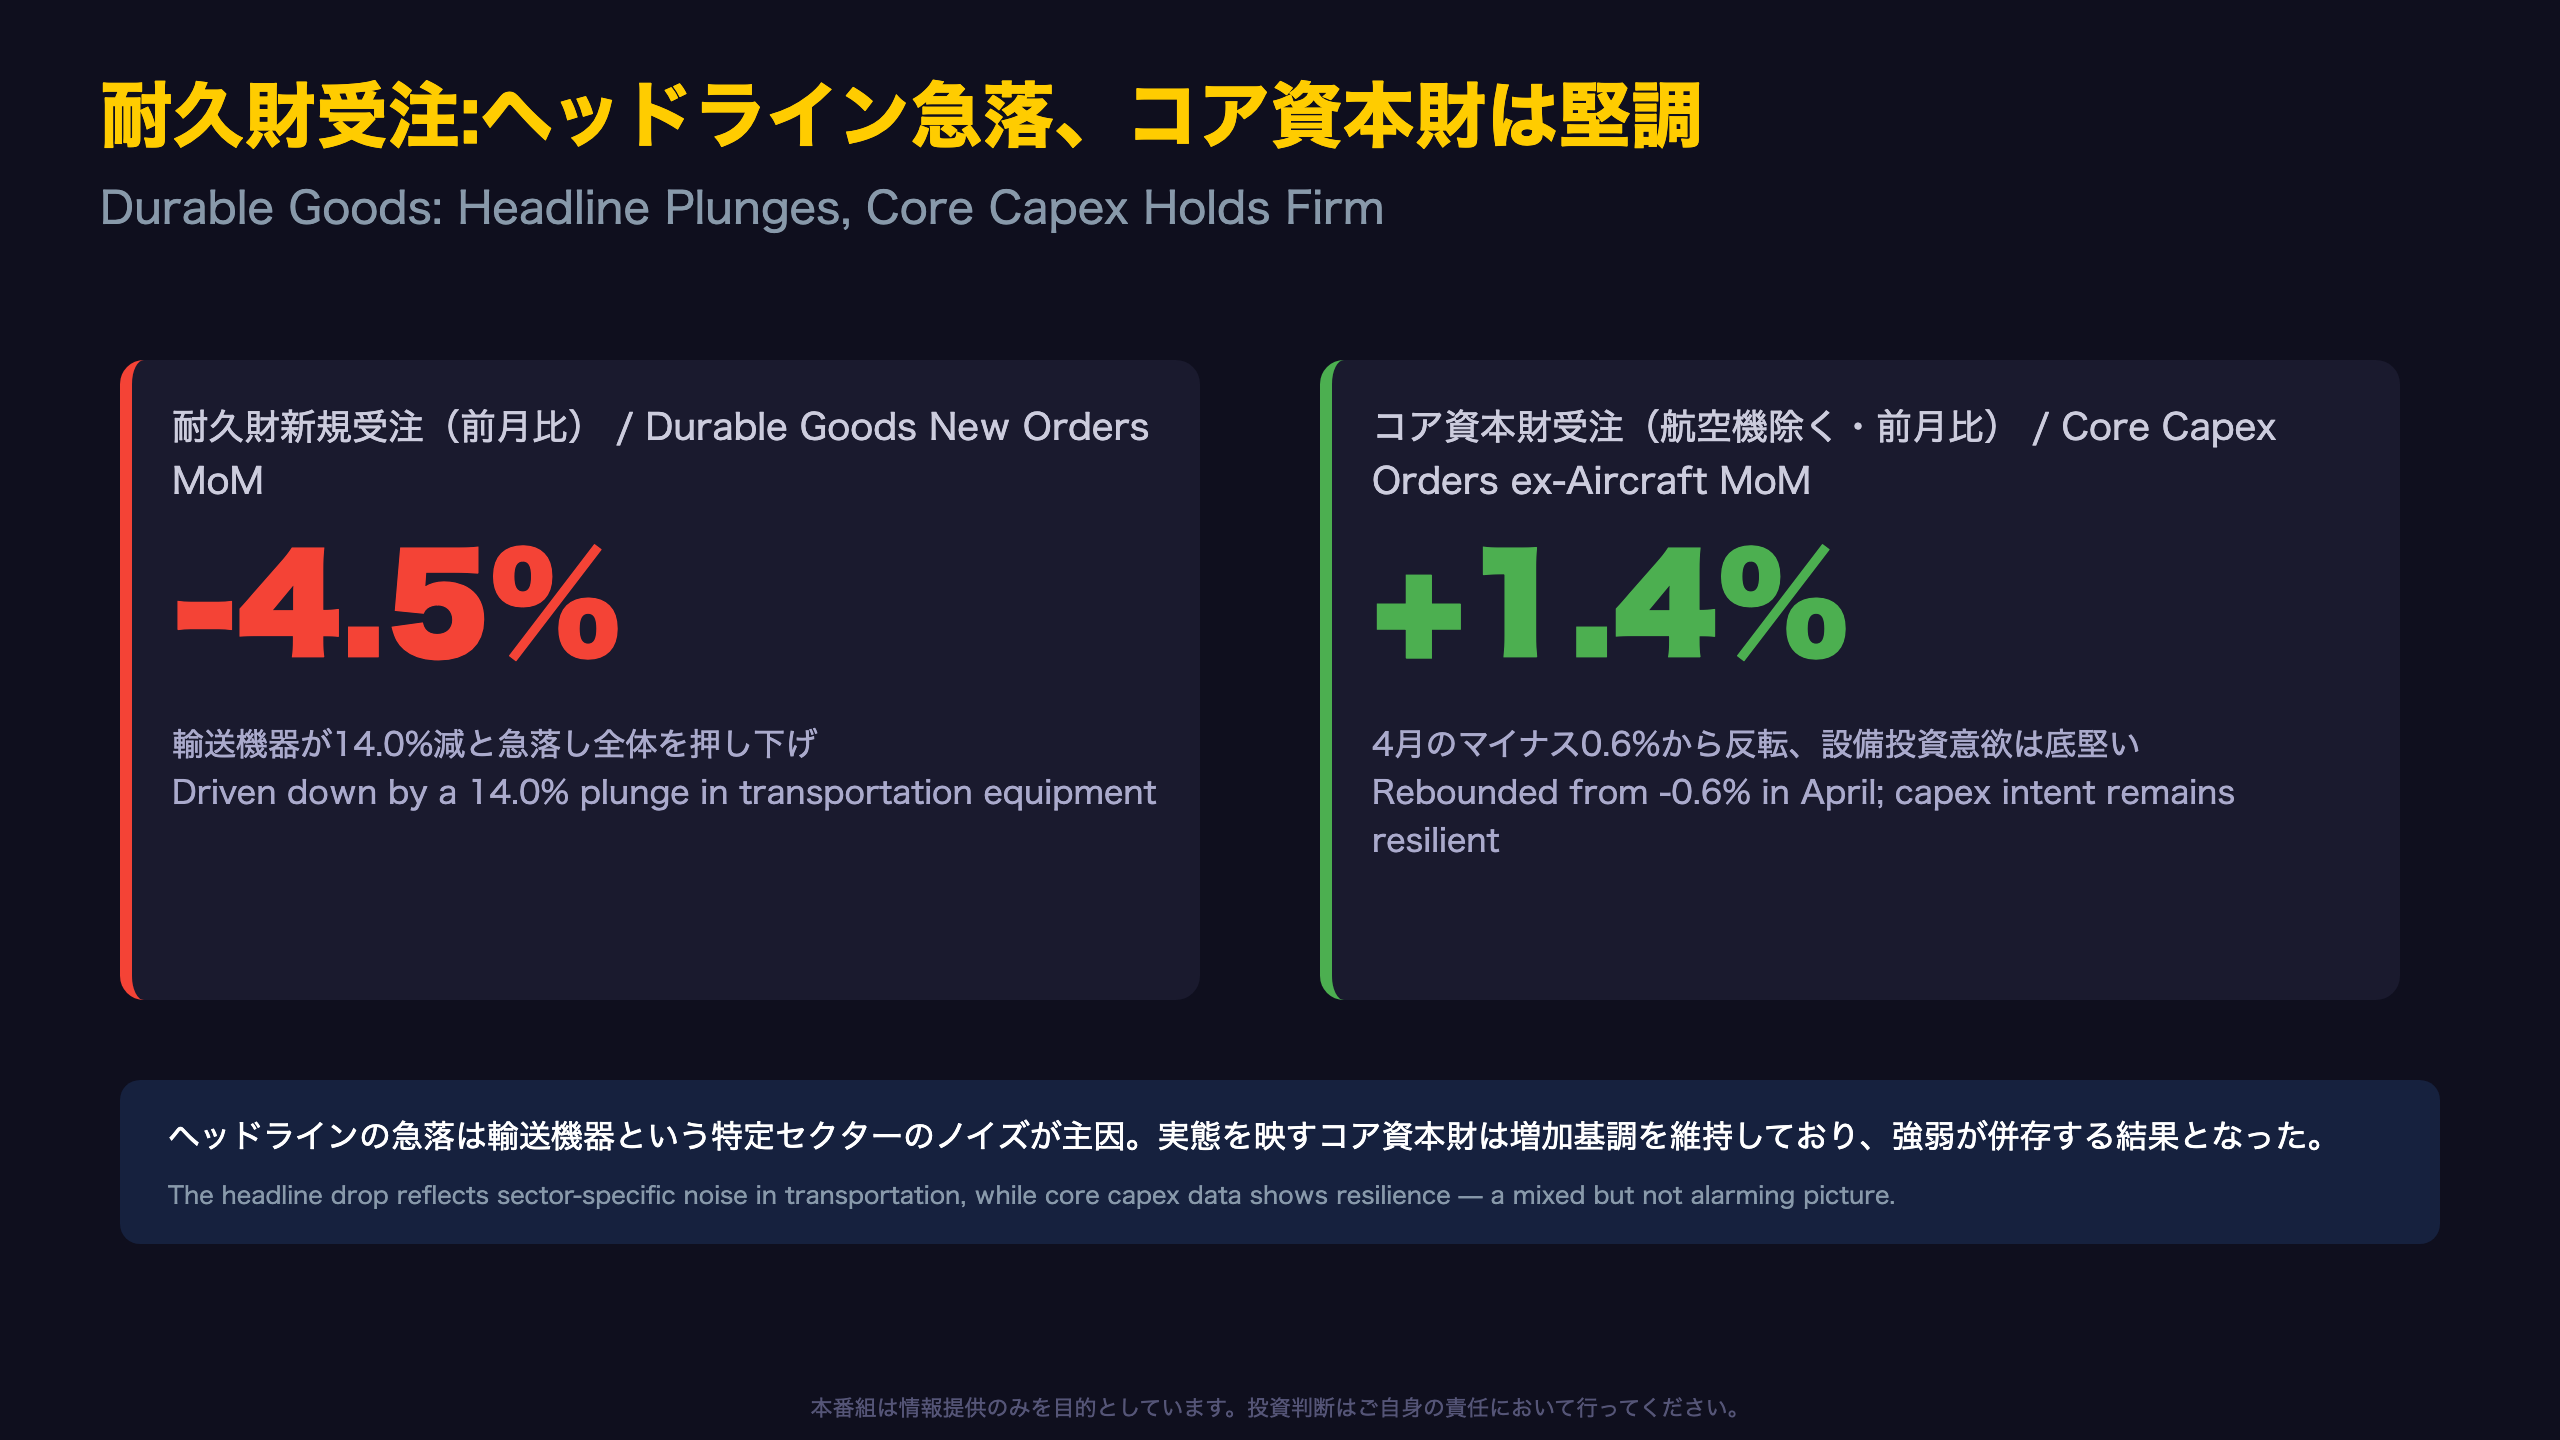
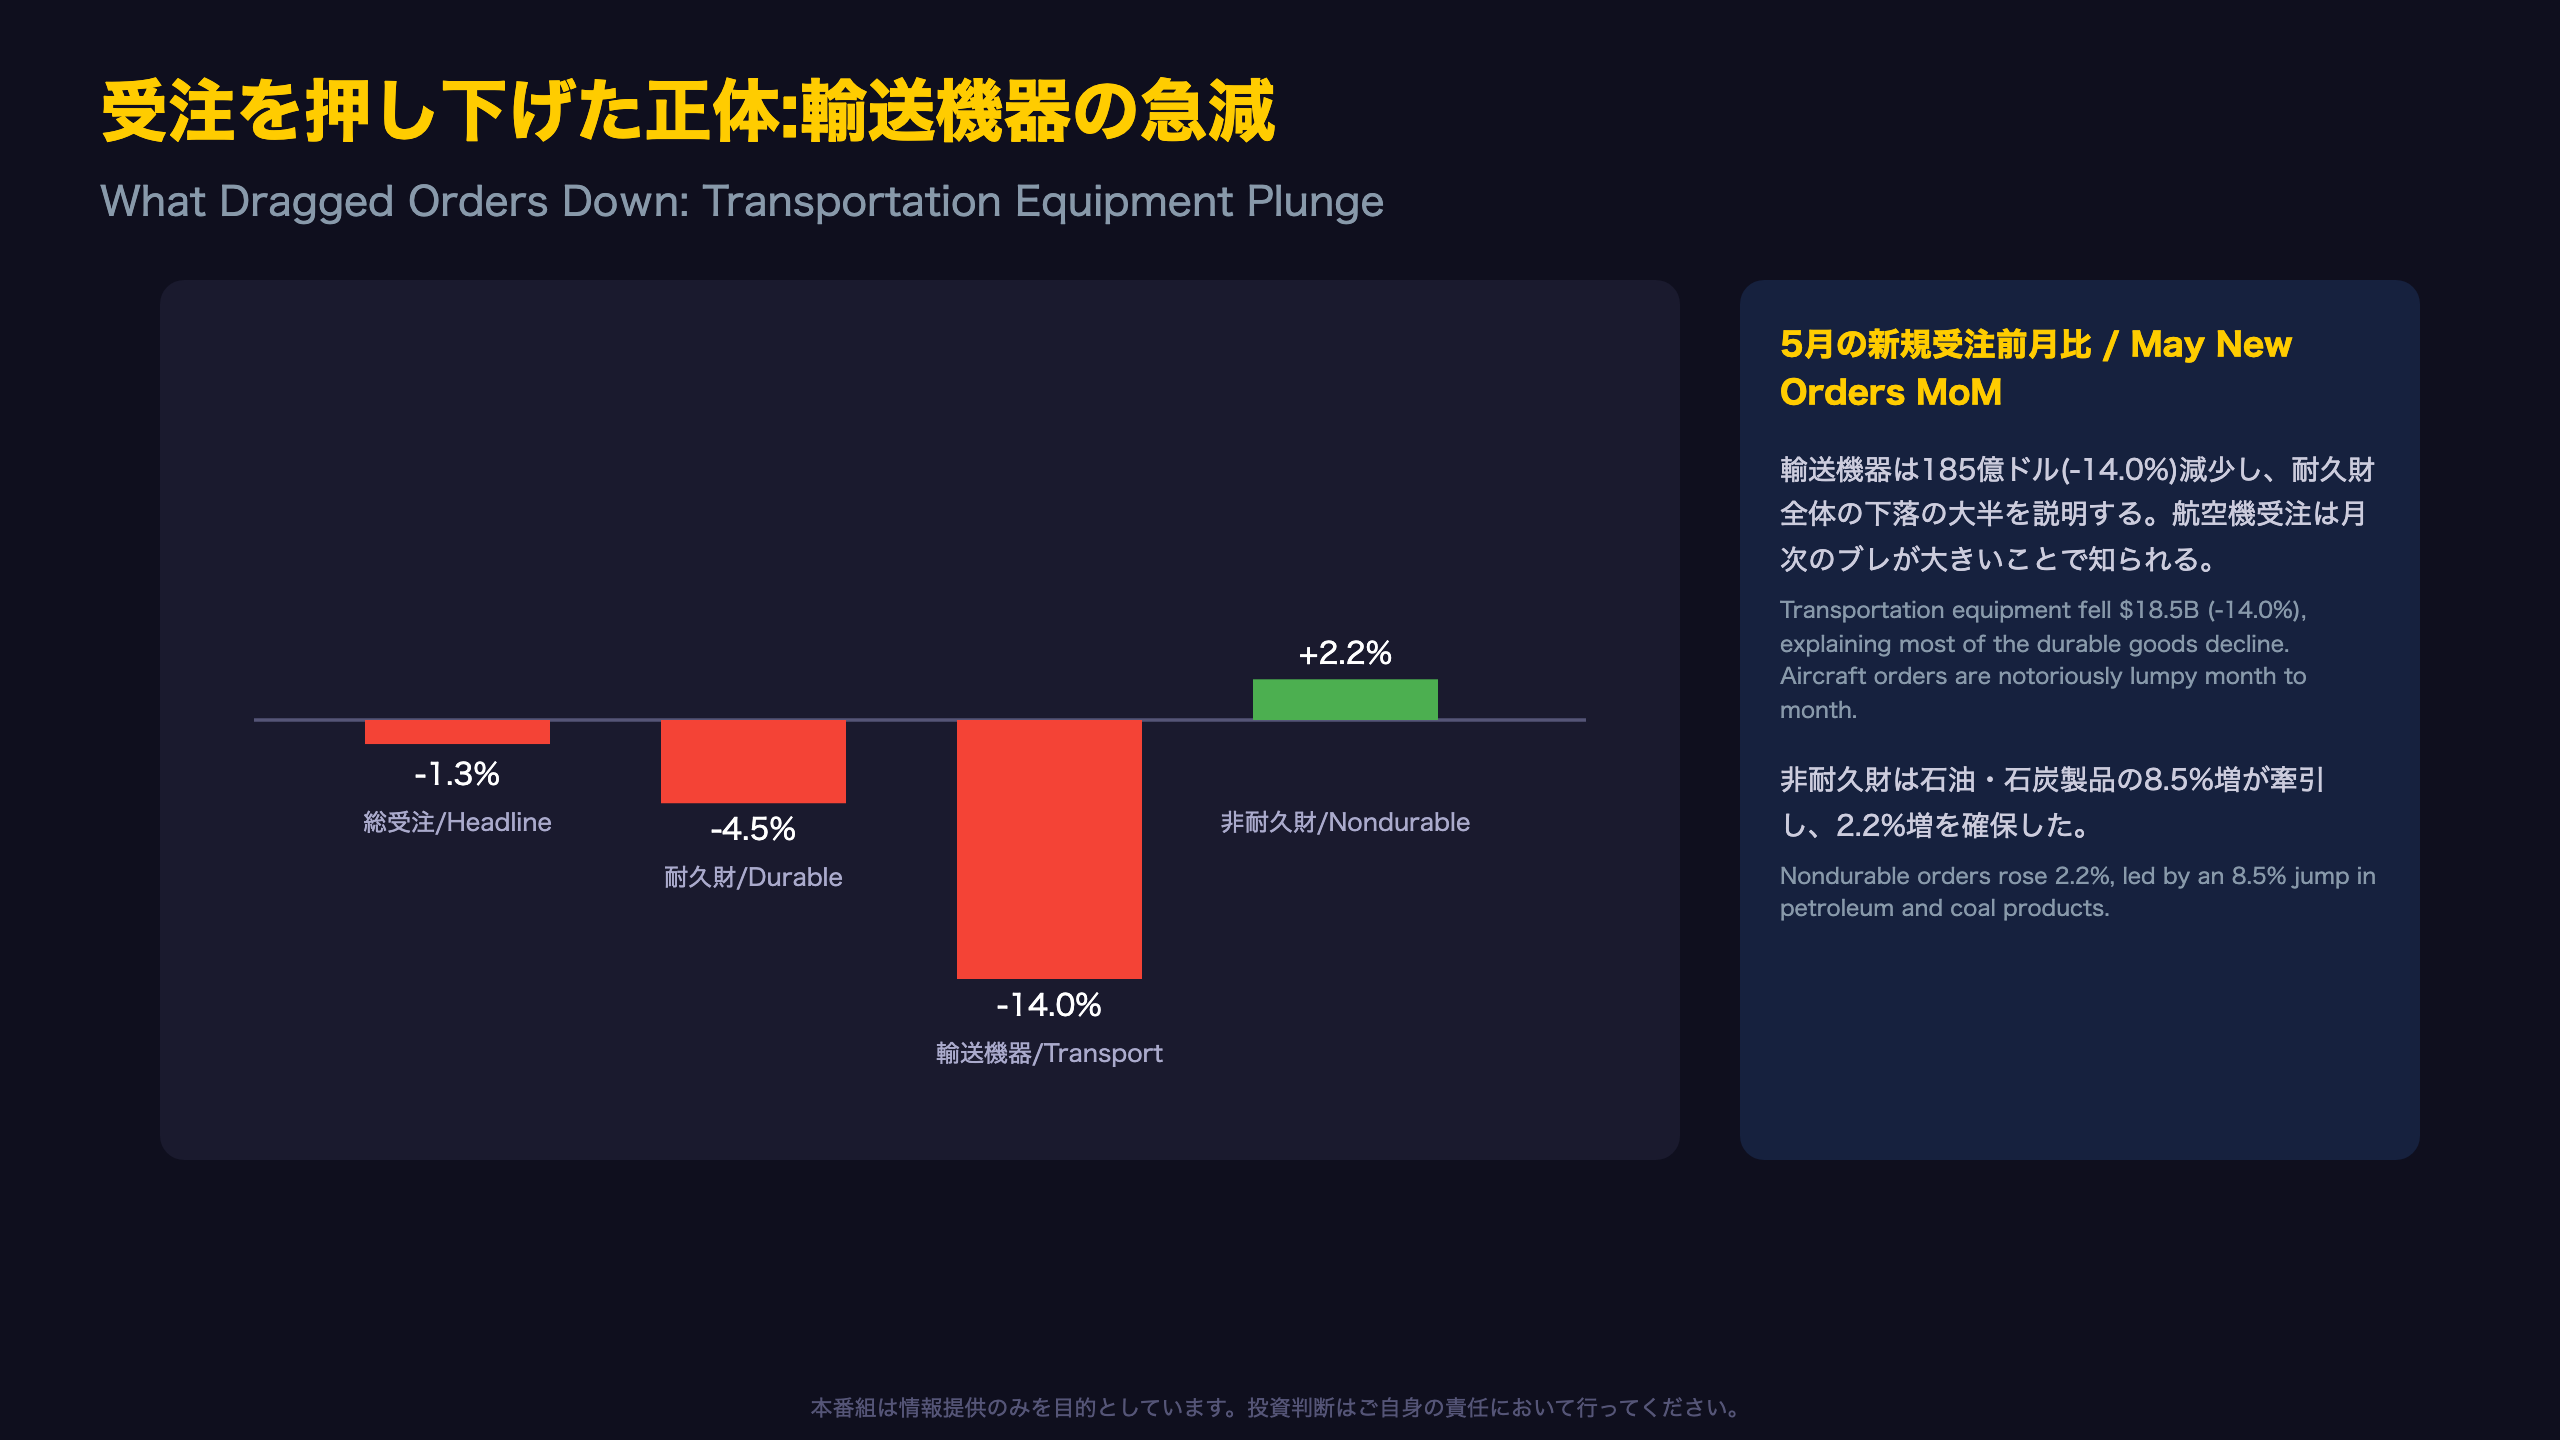
Headline durable goods orders fell -4.5% MoM, total new orders -1.3%.
📉 But dig into the details, and the picture flips.
The drop was concentrated in one volatile sector: transportation equipment (-14.0%).
📈 Core capital goods orders (nondefense, ex-aircraft) — the real business investment proxy — surprised with a +1.4% rebound.
Shipments also stayed positive at +0.1%.
💡 This release shows headline weakness coexisting with underlying resilience.
We break down what it means for the Fed, equities, and FX — with balanced, two-sided analysis.
⚠️ Next release: June Advance data on Jul 27, Full Report on Aug 4.
総合評価:ヘッドライン急落、コア資本財は堅調
Noise vs. Signal: The Structural Divergence
Headline durable goods orders are notoriously volatile — the accompanying 12-month chart (Jun 2025–May 2026) shows swings from -8.0% to +5.3%. This month’s -1.3% headline decline falls well within that historical range, making it premature to read a single month’s drop as a recession signal.
From the release: “New orders for manufactured goods in May, down following four consecutive monthly increases, decreased $8.5 billion or 1.3 percent to $657.4 billion.”
Meanwhile, core capital goods orders (nondefense, excluding aircraft) — the proxy that the Fed and BEA analysts watch for private business investment plans — rebounded to +1.4% in May from -0.6% in April. Still, over the past three months (-0.6% → +3.8% in March → +1.4% in May), this remains within a normal range rather than a clear breakout trend.
Bull and Bear Cases
- Bull case: Core capex orders and shipments both stayed in positive territory, suggesting capex intentions remain intact.
- Bear case: Both the unfilled orders/shipments ratio and inventory/shipments ratio declined, which could also reflect softening demand rather than tight supply-demand balance.
The next data points — June’s Advance Report (Jul 27) and Full Report (Aug 4) — will reveal whether this rebound is durable or a one-month blip. Note that the M3 survey panel represents roughly 58% of manufacturing shipment value per the 2022 Economic Census, so revisions are common.
受注を押し下げた正体:輸送機器の急減
Sector Breakdown: Where the Decline Concentrated
Within durables, transportation equipment was overwhelmingly the largest drag. New orders for transportation equipment fell 14.0% ($18.5 billion) to $113.4 billion — partly a mean-reversion after a 22.4% surge in April driven by lumpy aircraft bookings (Boeing and peers report orders on an irregular cadence).
Beyond Transportation
- Machinery: $43.4B, +2.1%
- Computers and electronic products: $29.4B, roughly flat (+0.2%)
- Primary metals: $30.8B, +3.6%
Excluding transportation, most major capital-goods-adjacent sectors stayed in positive territory — reinforcing that the headline weakness was concentrated in one volatile category rather than broad-based across manufacturing.
From the release: “Transportation equipment, also down following two consecutive monthly increases, drove the decrease, $18.5 billion or 14.0 percent to $113.4 billion.”
On the nondurable side, petroleum and coal products jumped 8.5%. Since M3 data is “not adjusted for price changes,” this nominal increase could partly reflect crude oil price movements rather than a genuine volume increase — a nuance often missed when comparing to U.S. CPI or PPI energy components.
コア資本財受注が示す設備投資の底力
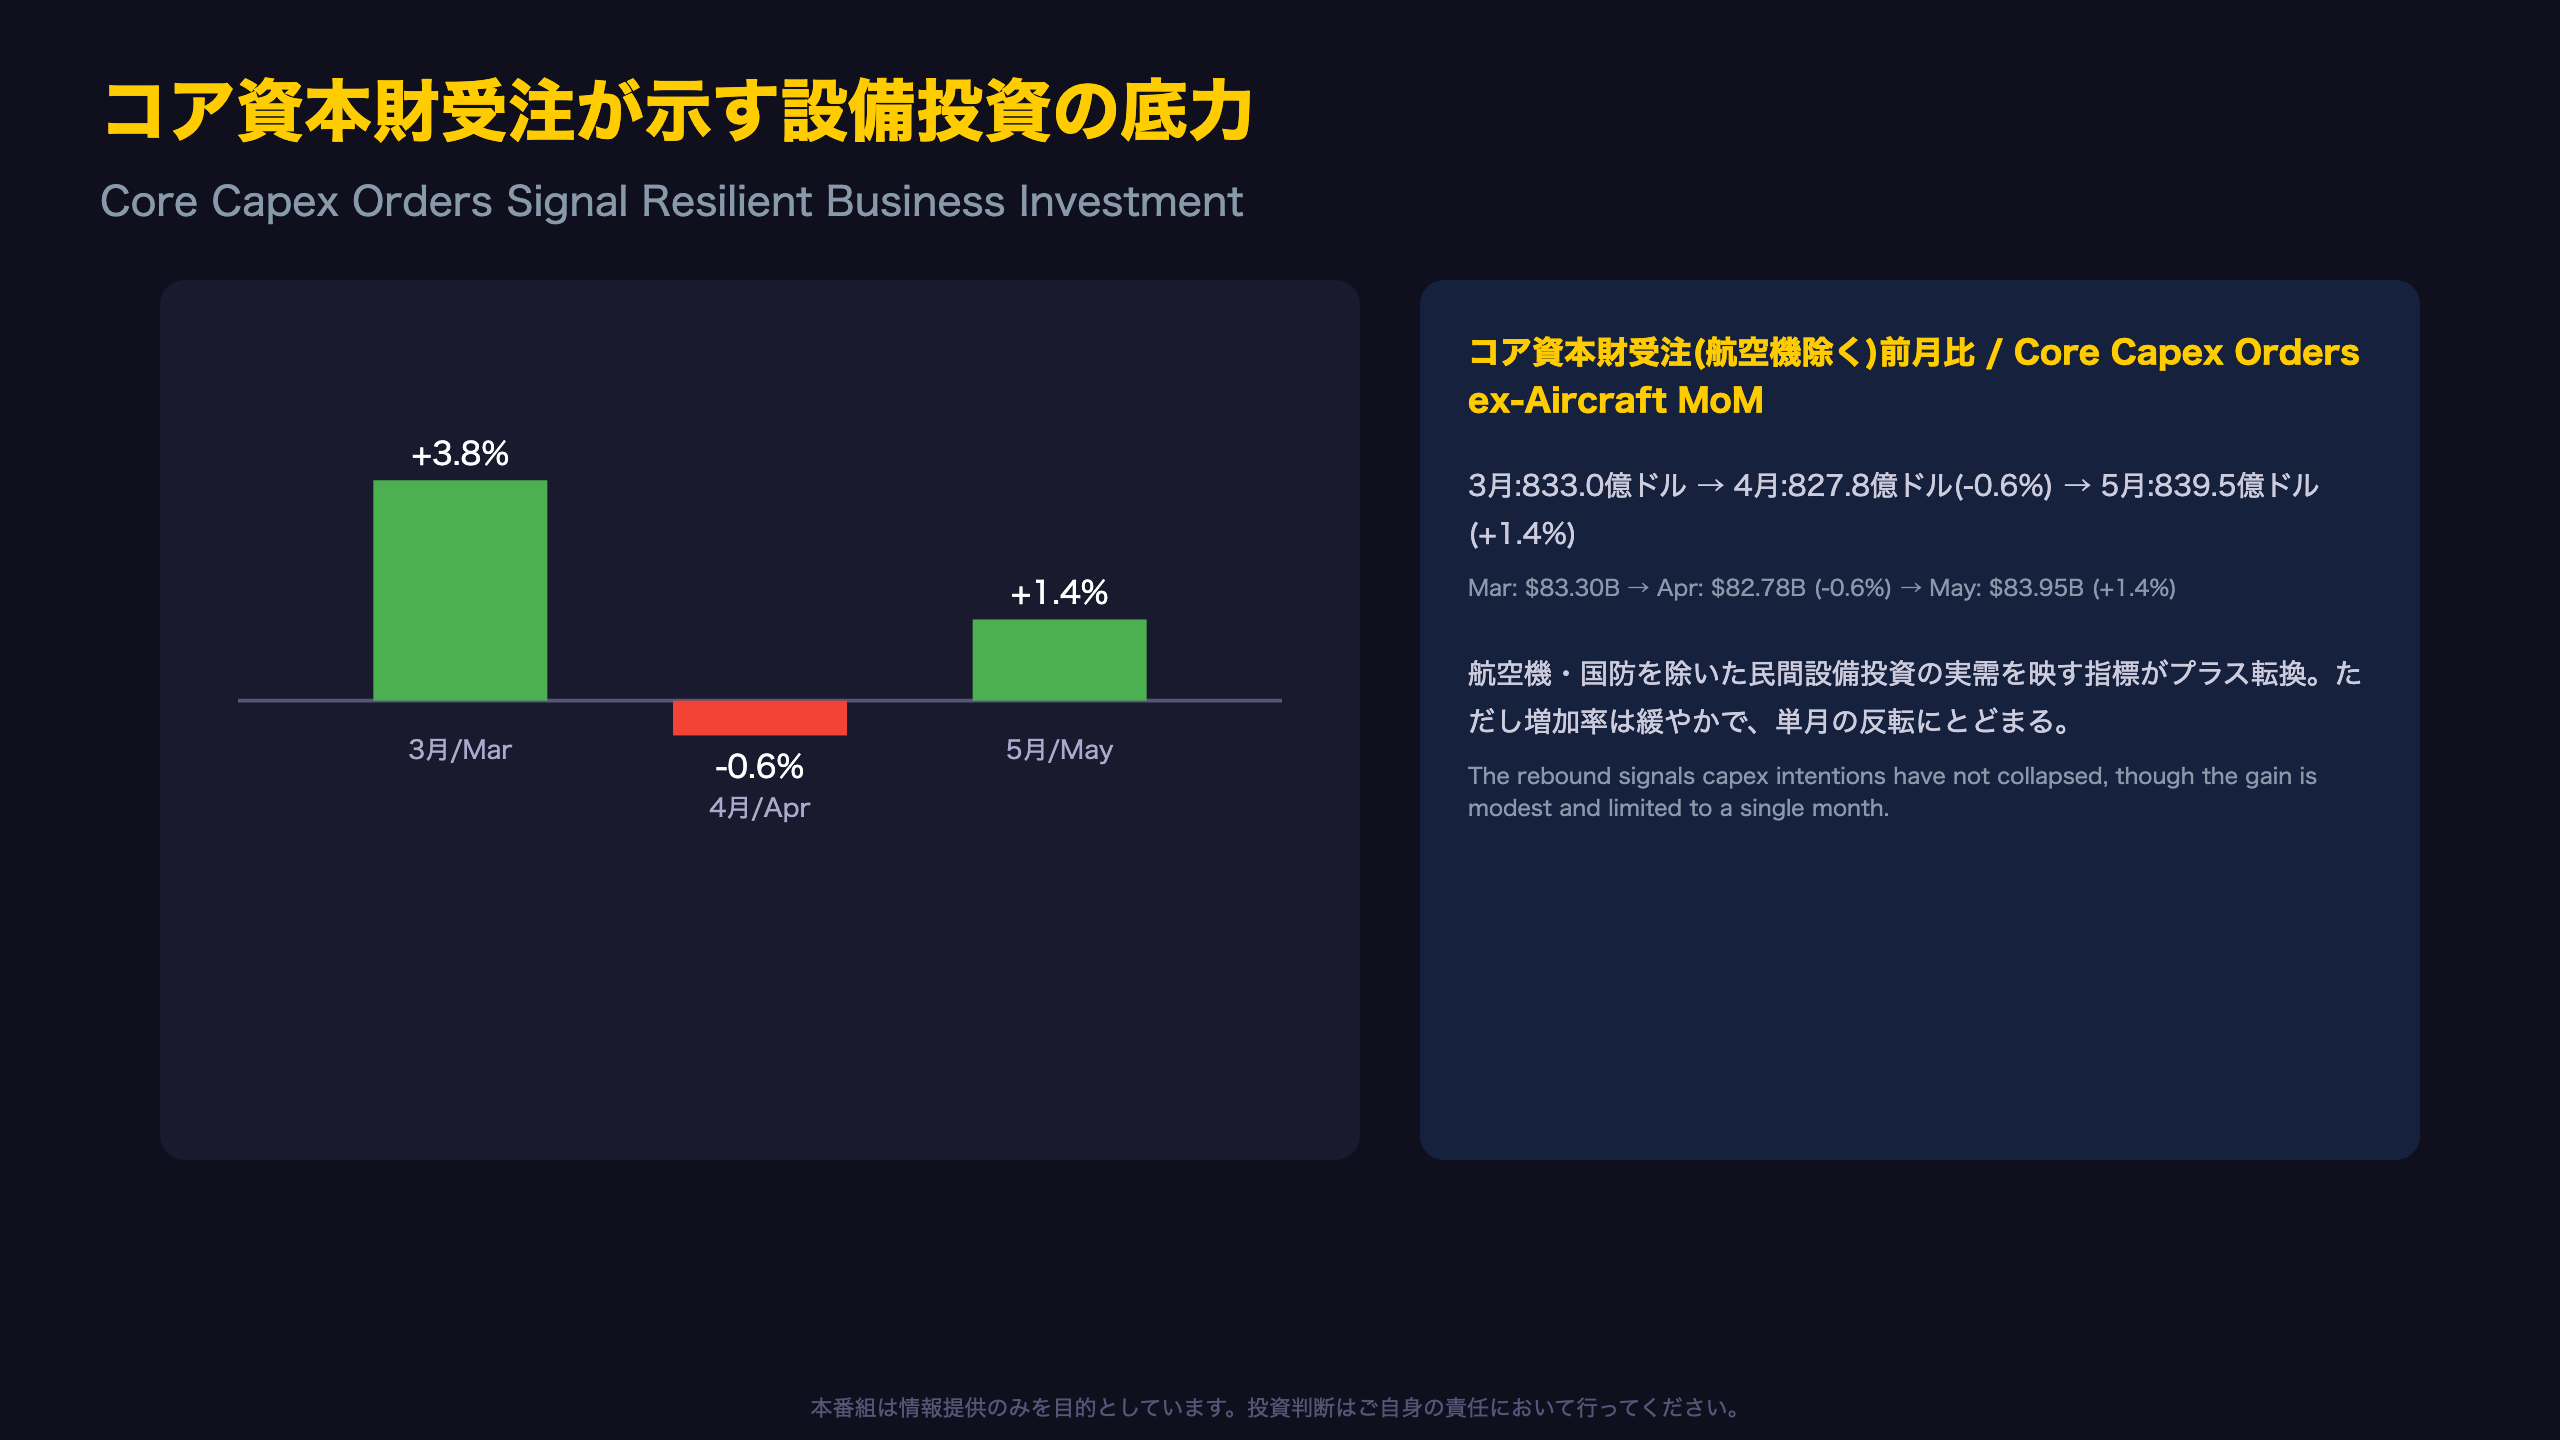
Reading the Core Capex “Rebound”
The Census Bureau publishes nondefense capital goods orders excluding aircraft — commonly called “core capex orders” — as the go-to proxy that the Federal Reserve and Wall Street economists use to gauge business investment intentions, since it strips out lumpy aircraft and defense contracts.
Three-Month Trend
- March: $83.30B
- April: $82.78B (-0.6%)
- May: $83.95B (+1.4%)
Looking at the three-month trend, core capex orders have essentially been flat around the $83 billion mark. That makes it hard to say definitively whether May’s rebound marks a genuine inflection point or just monthly noise — March alone posted a +3.8% swing, underscoring how volatile even the “core” series can be.
Bull read: Despite a higher-for-longer rate environment, business capex intentions have not deteriorated meaningfully — a sign the corporate sector isn’t retrenching.
Bear read: The growth rate remains modest, offering limited evidence of an acceleration in investment appetite. U.S. investors should cross-reference the BEA’s upcoming GDP release, where equipment investment is one subcomponent of nonresidential fixed investment, for a fuller confirmation of this trend.
出荷の伸び鈍化とGDPへの波及
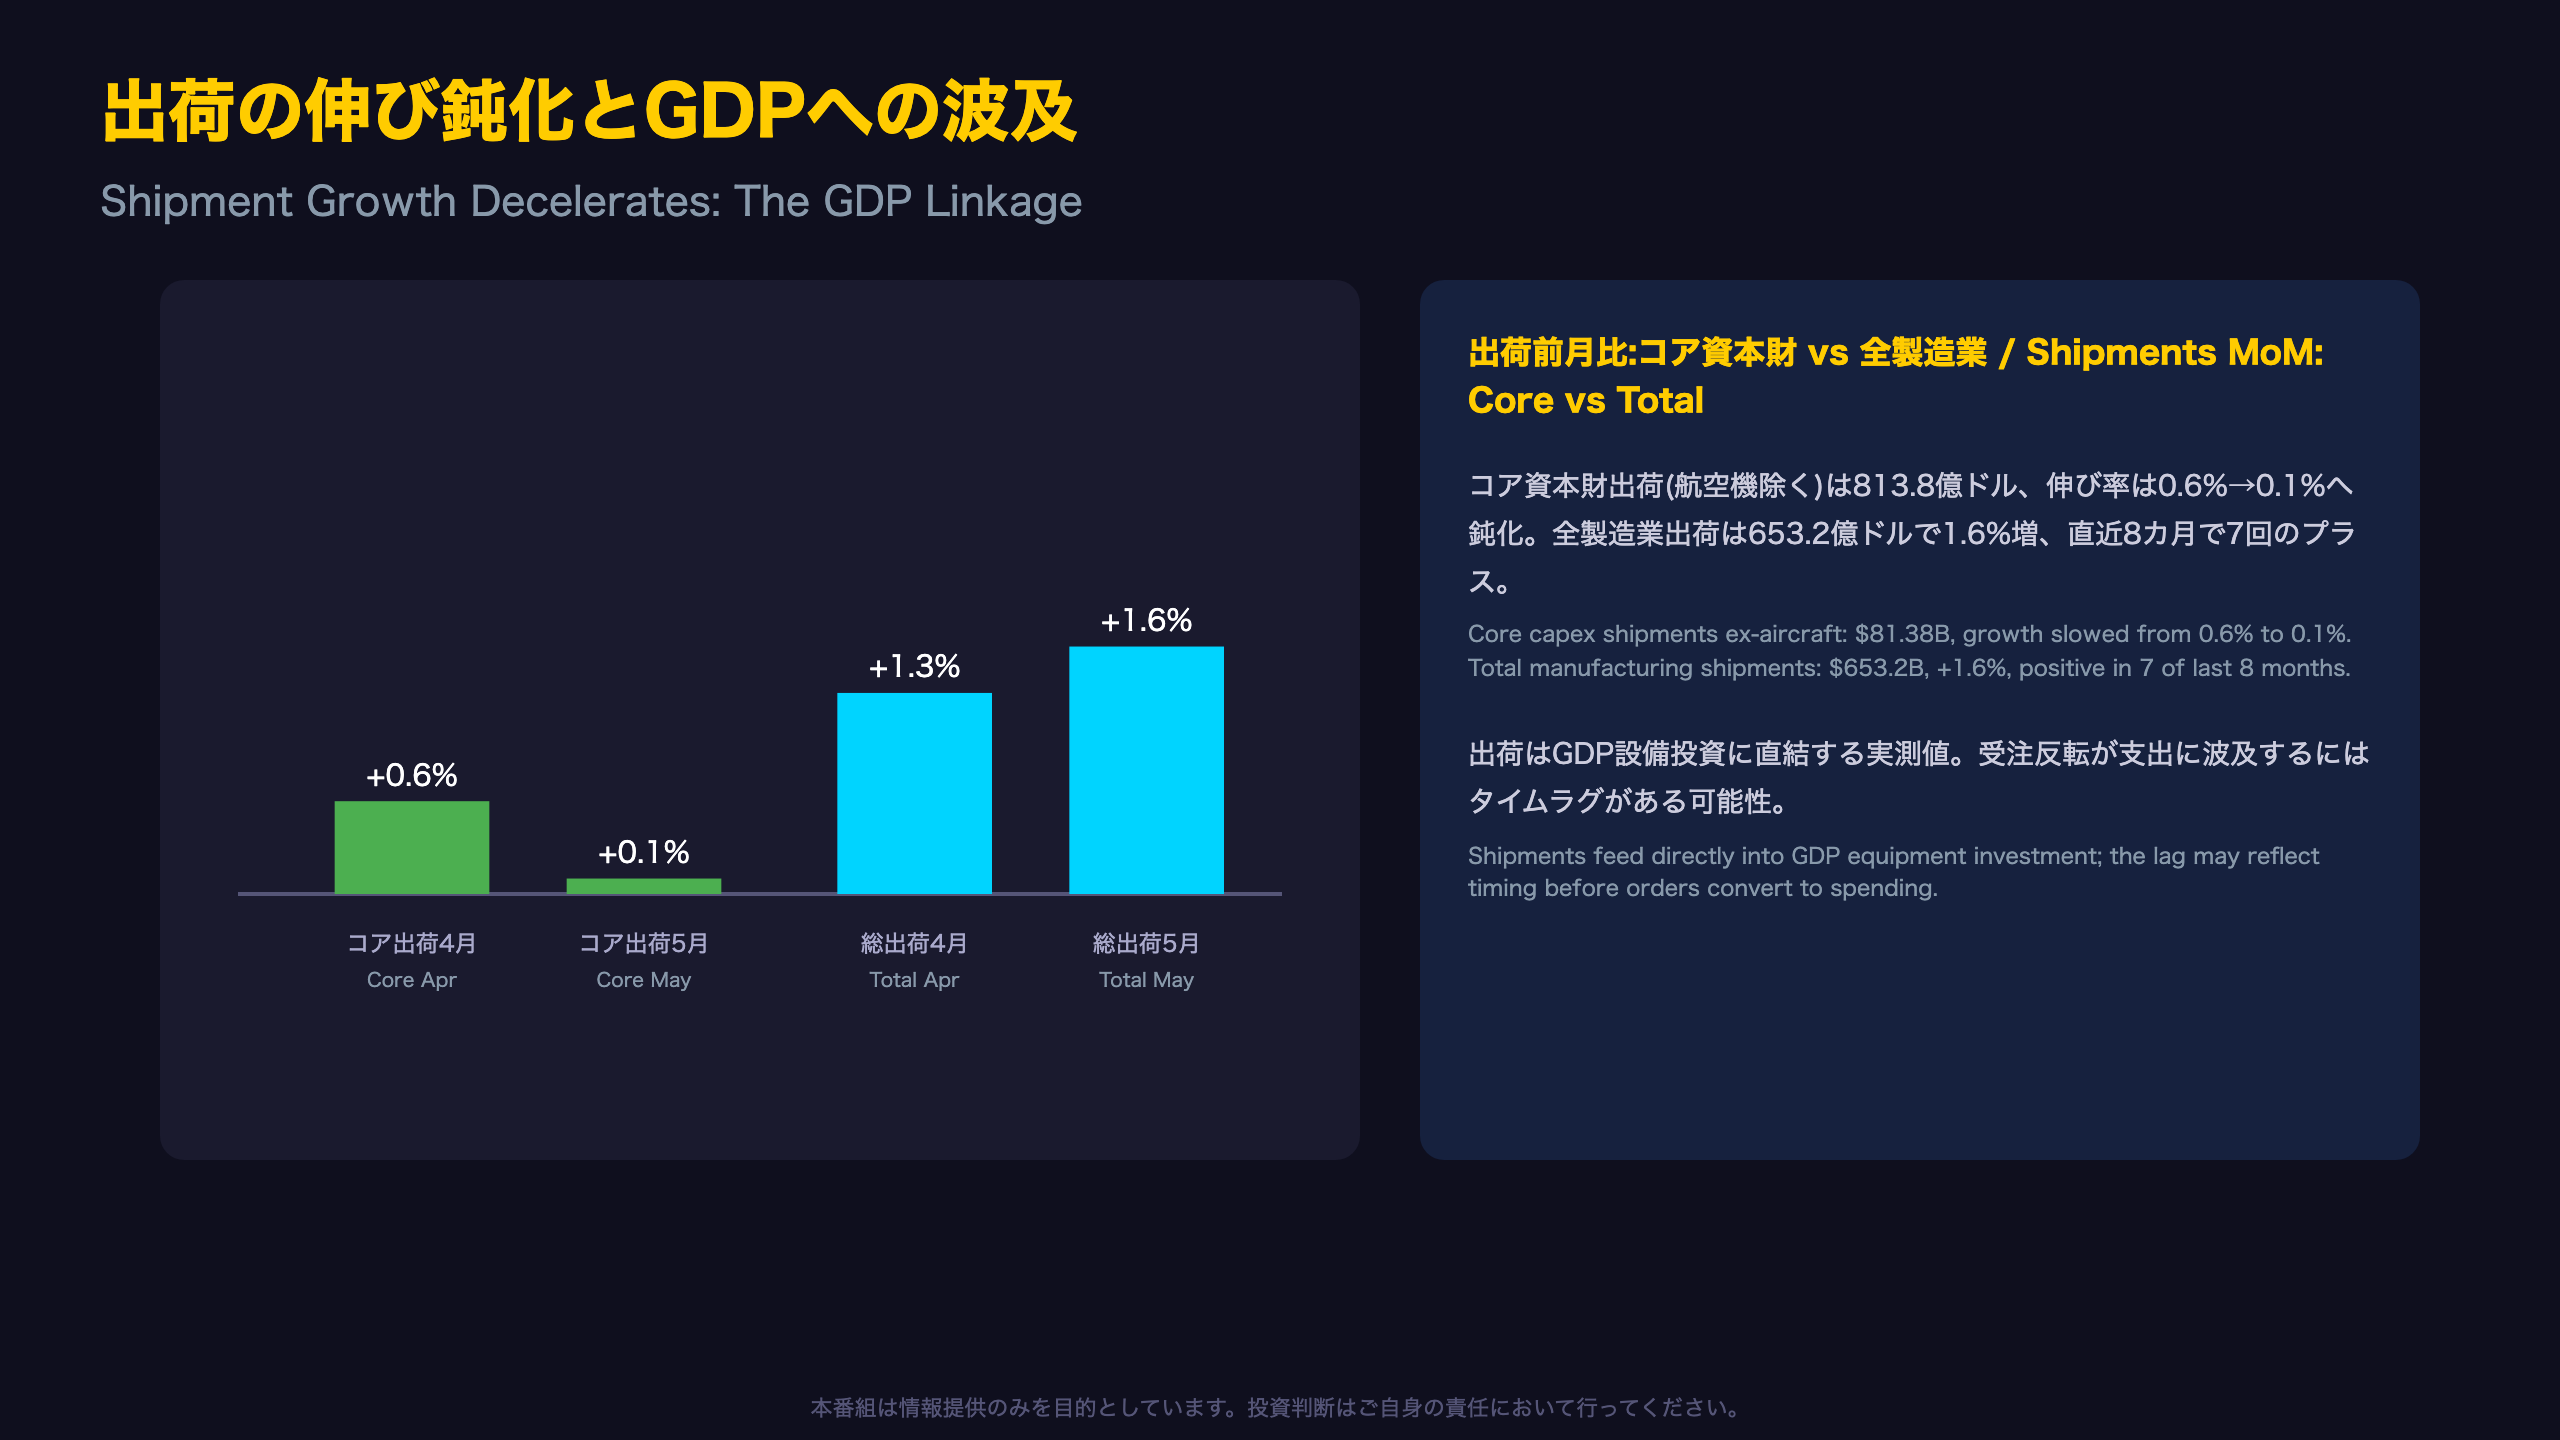
Shipments Are What Actually Feed Into GDP
While new orders are a forward-looking indicator, it is shipments data that the Bureau of Economic Analysis (BEA) uses directly to estimate the equipment investment component of U.S. GDP. Core capital goods shipments (nondefense, ex-aircraft) — the cleanest capex proxy — rose just +0.1% in May to $81.38B, decelerating from +0.6% in April.
Three-Month Shipment Trend
- March: $80.83B
- April: $81.29B (+0.6%)
- May: $81.38B (+0.1%)
Total manufacturing shipments, by contrast, look healthier: $653.2B, +1.6%, up in 7 of the last 8 months.
From the release: “Shipments, up seven of the last eight months, increased $10.3 billion or 1.6 percent to $653.2 billion.”
For U.S. investors, this divergence — decelerating core capex shipments vs. robust total shipments — is worth tracking ahead of the next GDP release, since equipment investment is one of the more volatile subcomponents of nonresidential fixed investment. A single-month deceleration is not yet enough evidence to conclude capex spending is stalling; it may simply reflect the lag between order rebounds and actual delivery and billing.
需給バランス:在庫・受注残高比率の低下
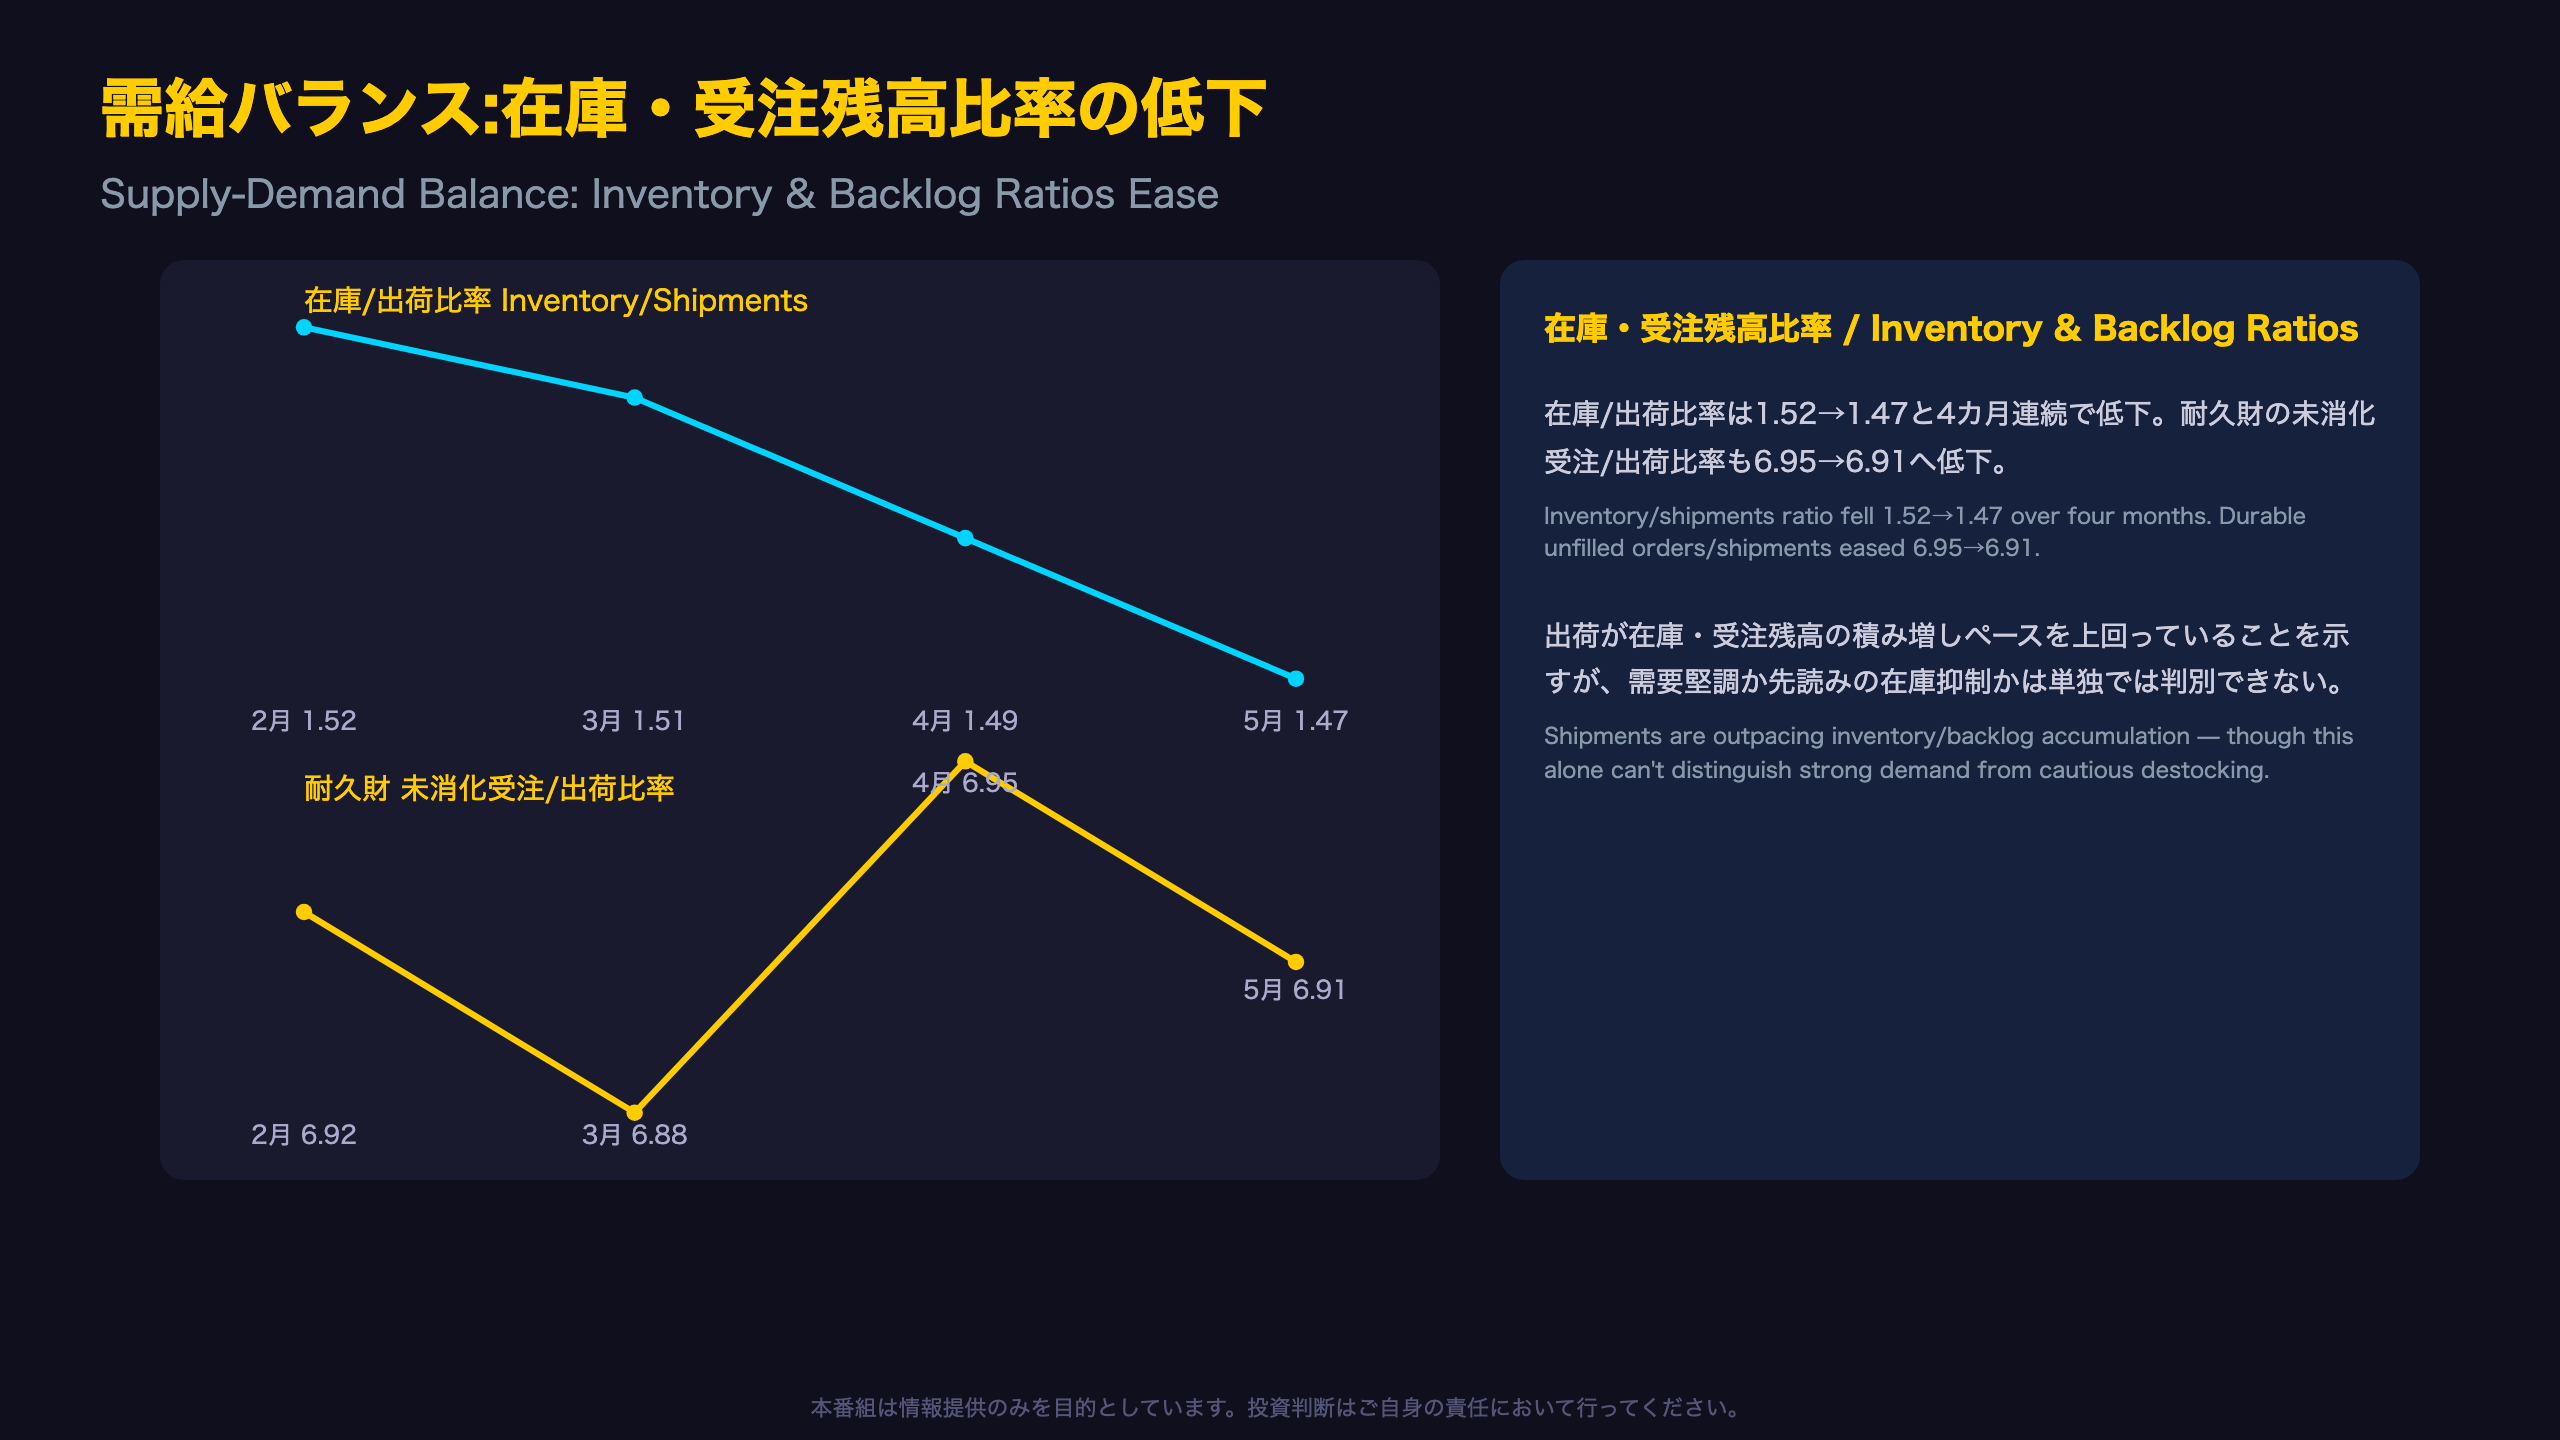
Two Ratios That Reveal the Supply-Demand Balance
The inventory-to-shipments ratio and the unfilled-orders-to-shipments ratio (durable goods only) serve as useful supplementary gauges of manufacturing supply-demand tightness. Both ratios declined this month, meaning shipments (production/supply) grew faster than the buildup in backlogs and inventories.
Four-Month Trend
| Month | Inventory/Shipments | Durable Unfilled Orders/Shipments |
|---|---|---|
| Feb | 1.52 | 6.92 |
| Mar | 1.51 | 6.88 |
| Apr | 1.49 | 6.95 |
| May | 1.47 | 6.91 |
The inventory ratio has now declined for four straight months, suggesting manufacturers are not sitting on excess stock. However, this alone cannot distinguish between two competing narratives: (1) demand is strong enough that shipments are outpacing restocking, or (2) firms are deliberately holding back inventory investment in anticipation of a demand slowdown.
From the release: “The inventories-to-shipments ratio was 1.47, down from 1.49 in April.”
The backlog ratio ticked up in April (6.95) before easing back to 6.91 in May — a sign that order backlogs are being worked through at a broadly stable pace, though a slowdown in new order growth could eventually pull this ratio down further. U.S. investors comparing this to the ISM Manufacturing PMI’s supplier deliveries and inventories subindices may find a complementary read on the same dynamic.
市場へのインプリケーション
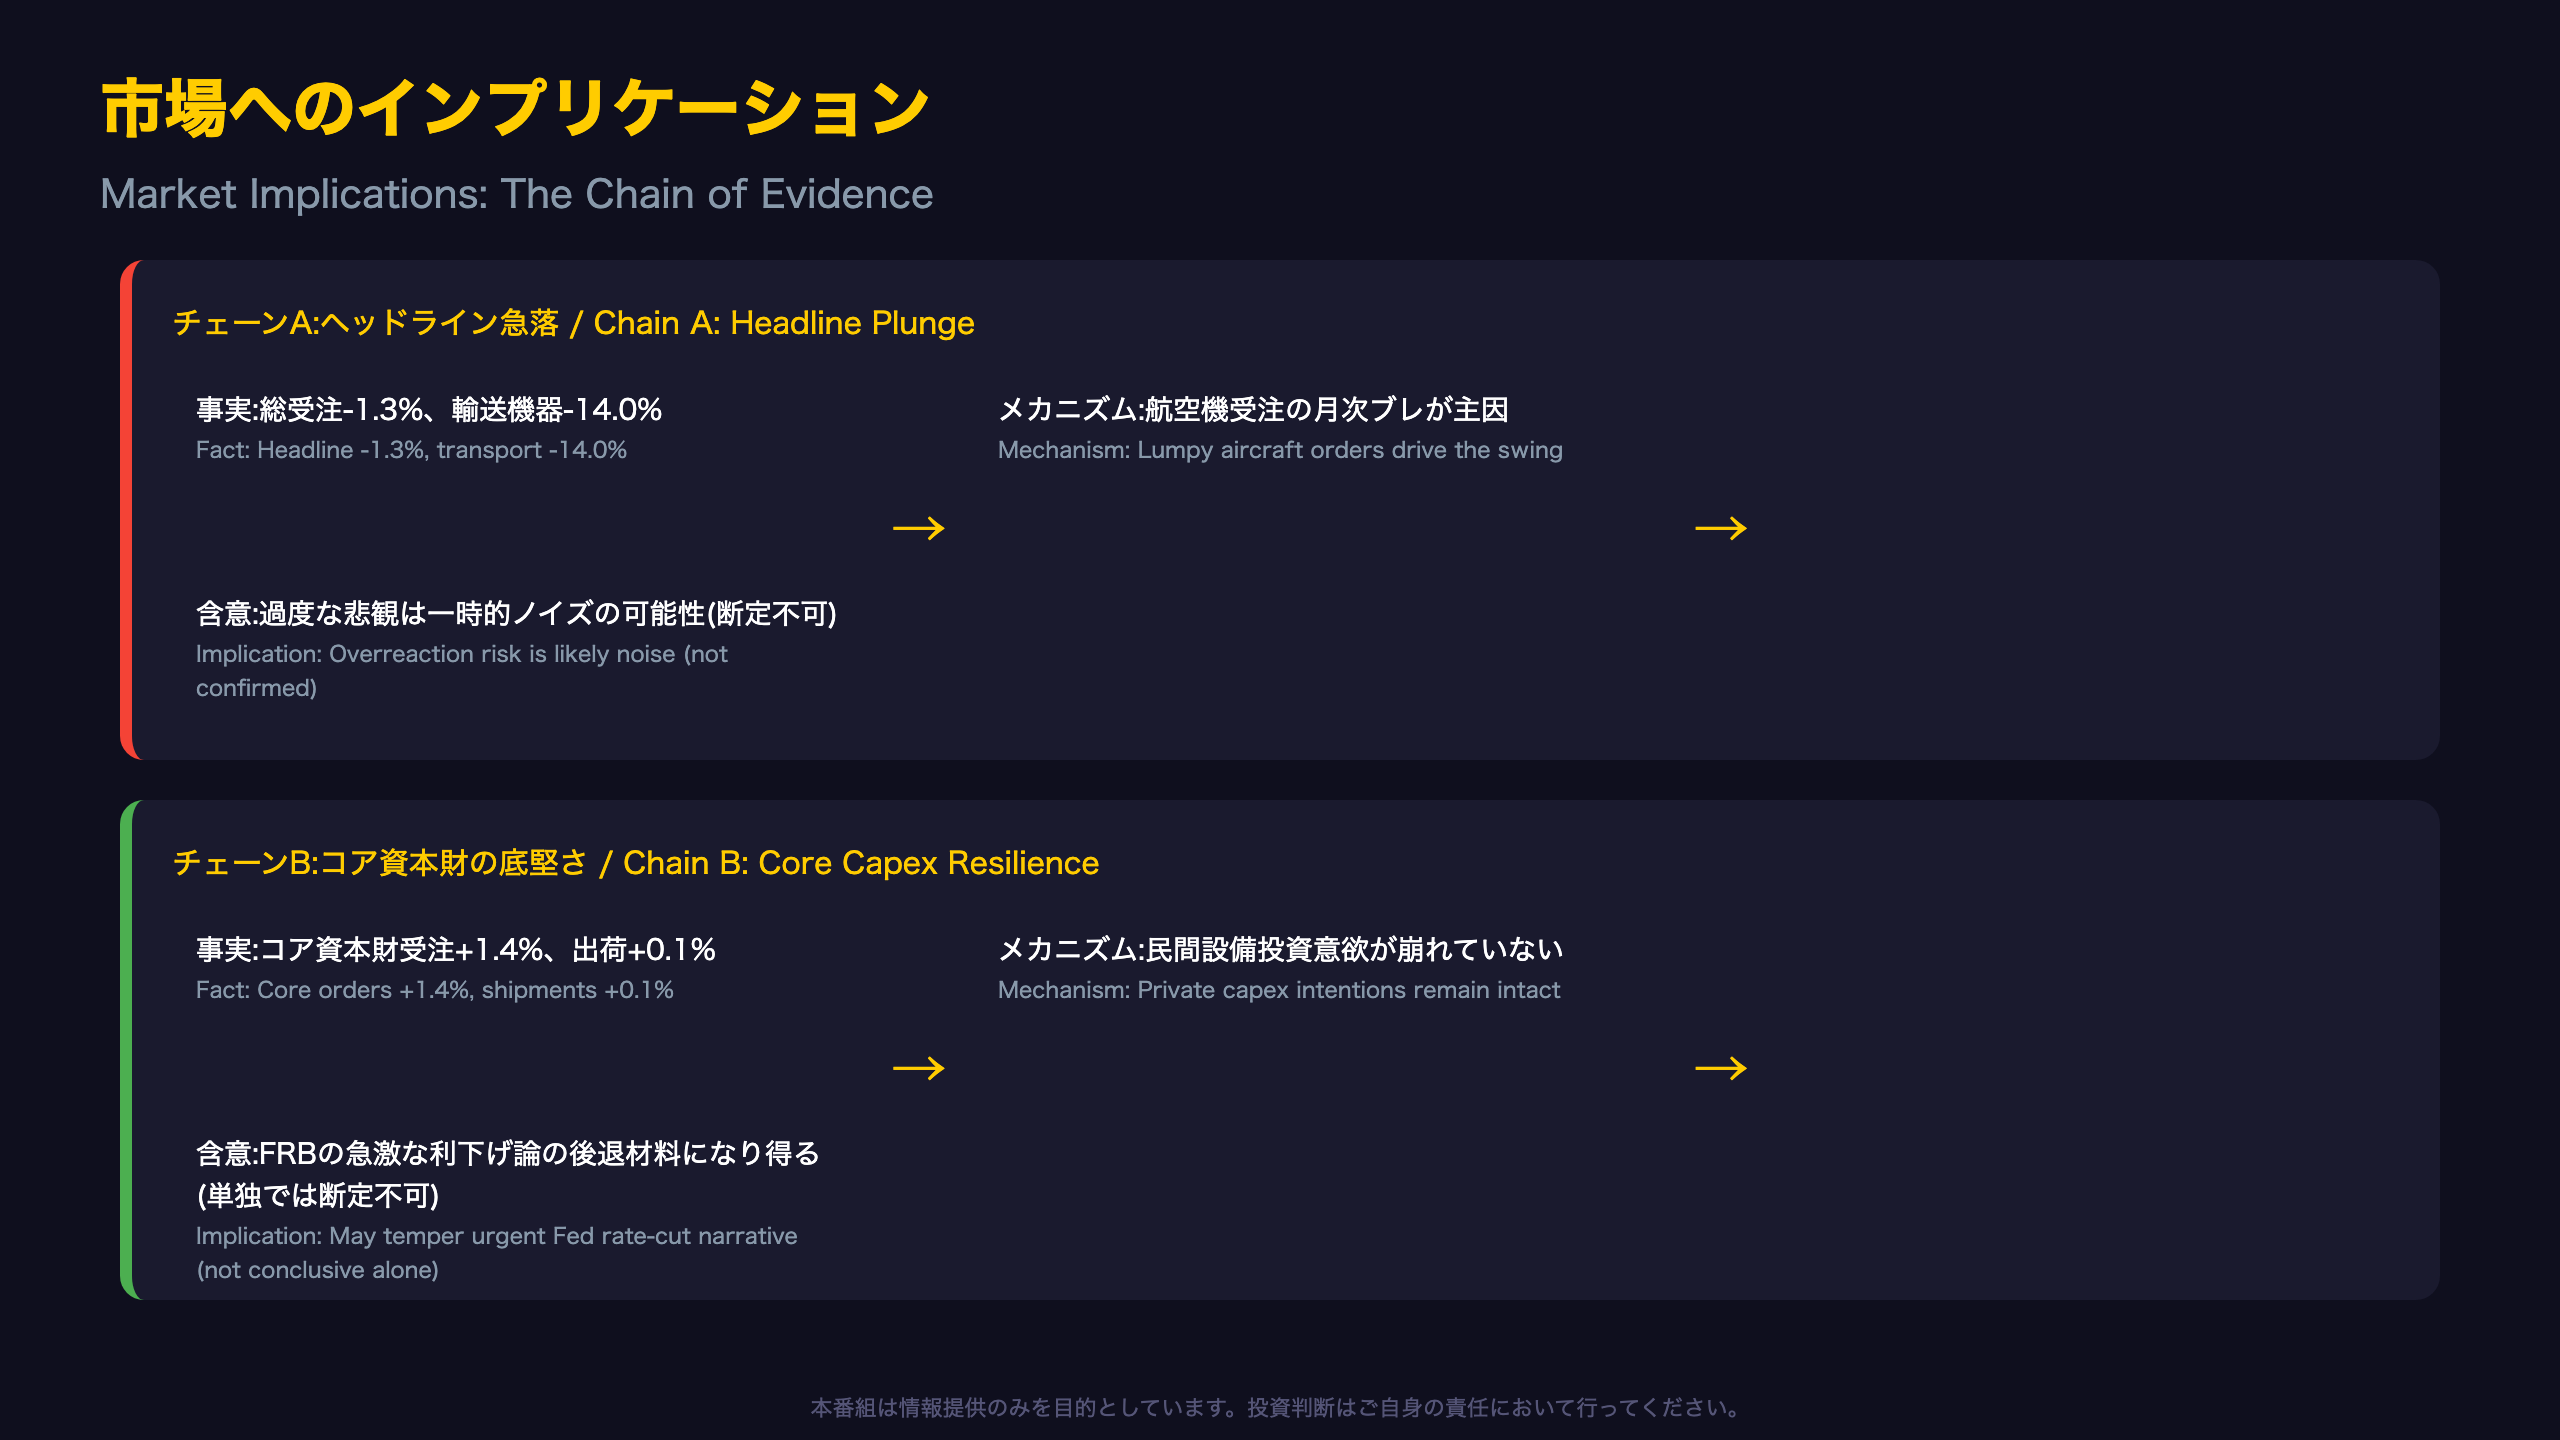
What Markets Should Take Away
The most important takeaway from this release is the clear separation between headline weakness and underlying resilience. For rates and FX traders tracking the Fed’s reaction function, looking past the aircraft-driven headline to the core capex series is essential.
Transmission Channels to Watch
- Rates & USD: The resilience in core capex orders weakens the case for the Fed to cite a “corporate investment slowdown” as a reason to accelerate rate cuts — though this single report cannot determine Fed policy on its own.
- Equities: Investors in capital-goods-adjacent sectors (machinery, electronic components) should track core capex orders/shipments trends rather than react to the durable goods headline.
- Long-end yields: The deceleration in core capex shipment growth (0.6% → 0.1%) could be read as a modest downward signal for near-term capex-driven growth expectations.
In general, a single month of durable goods data is unlikely to shift Fed policy on its own, but a sustained run of resilient core capex data over several months could reinforce a narrative of reduced recession risk — though this report alone cannot confirm that trend.
The next data points are the June Advance Report (July 27) and Full Report (August 4). These releases will be critical in determining whether May’s core capex rebound represents the start of a trend or was simply monthly noise — a distinction that matters greatly for how the Fed and markets interpret the manufacturing sector’s health going forward.
Disclaimer: This article is for informational purposes only. All investment decisions are made solely at your own risk.