📺 Watch the Full Video Analysis
This article was automatically generated by the NFC Market Live AI analysis system. (Updated: 2026-08-03 07:07 JST)
📊 This week’s global bond market story: the US Treasury curve is steepening sharply.
The 2-year yield tumbled 0.14pt while the 10y-2y spread widened from +0.34pt to +0.45pt.
📉 In Europe, UK Gilts fell to 5.01%, while OAT-Bund and BTP-Bund spreads both widened 2bp, signaling lingering fiscal risk concerns.
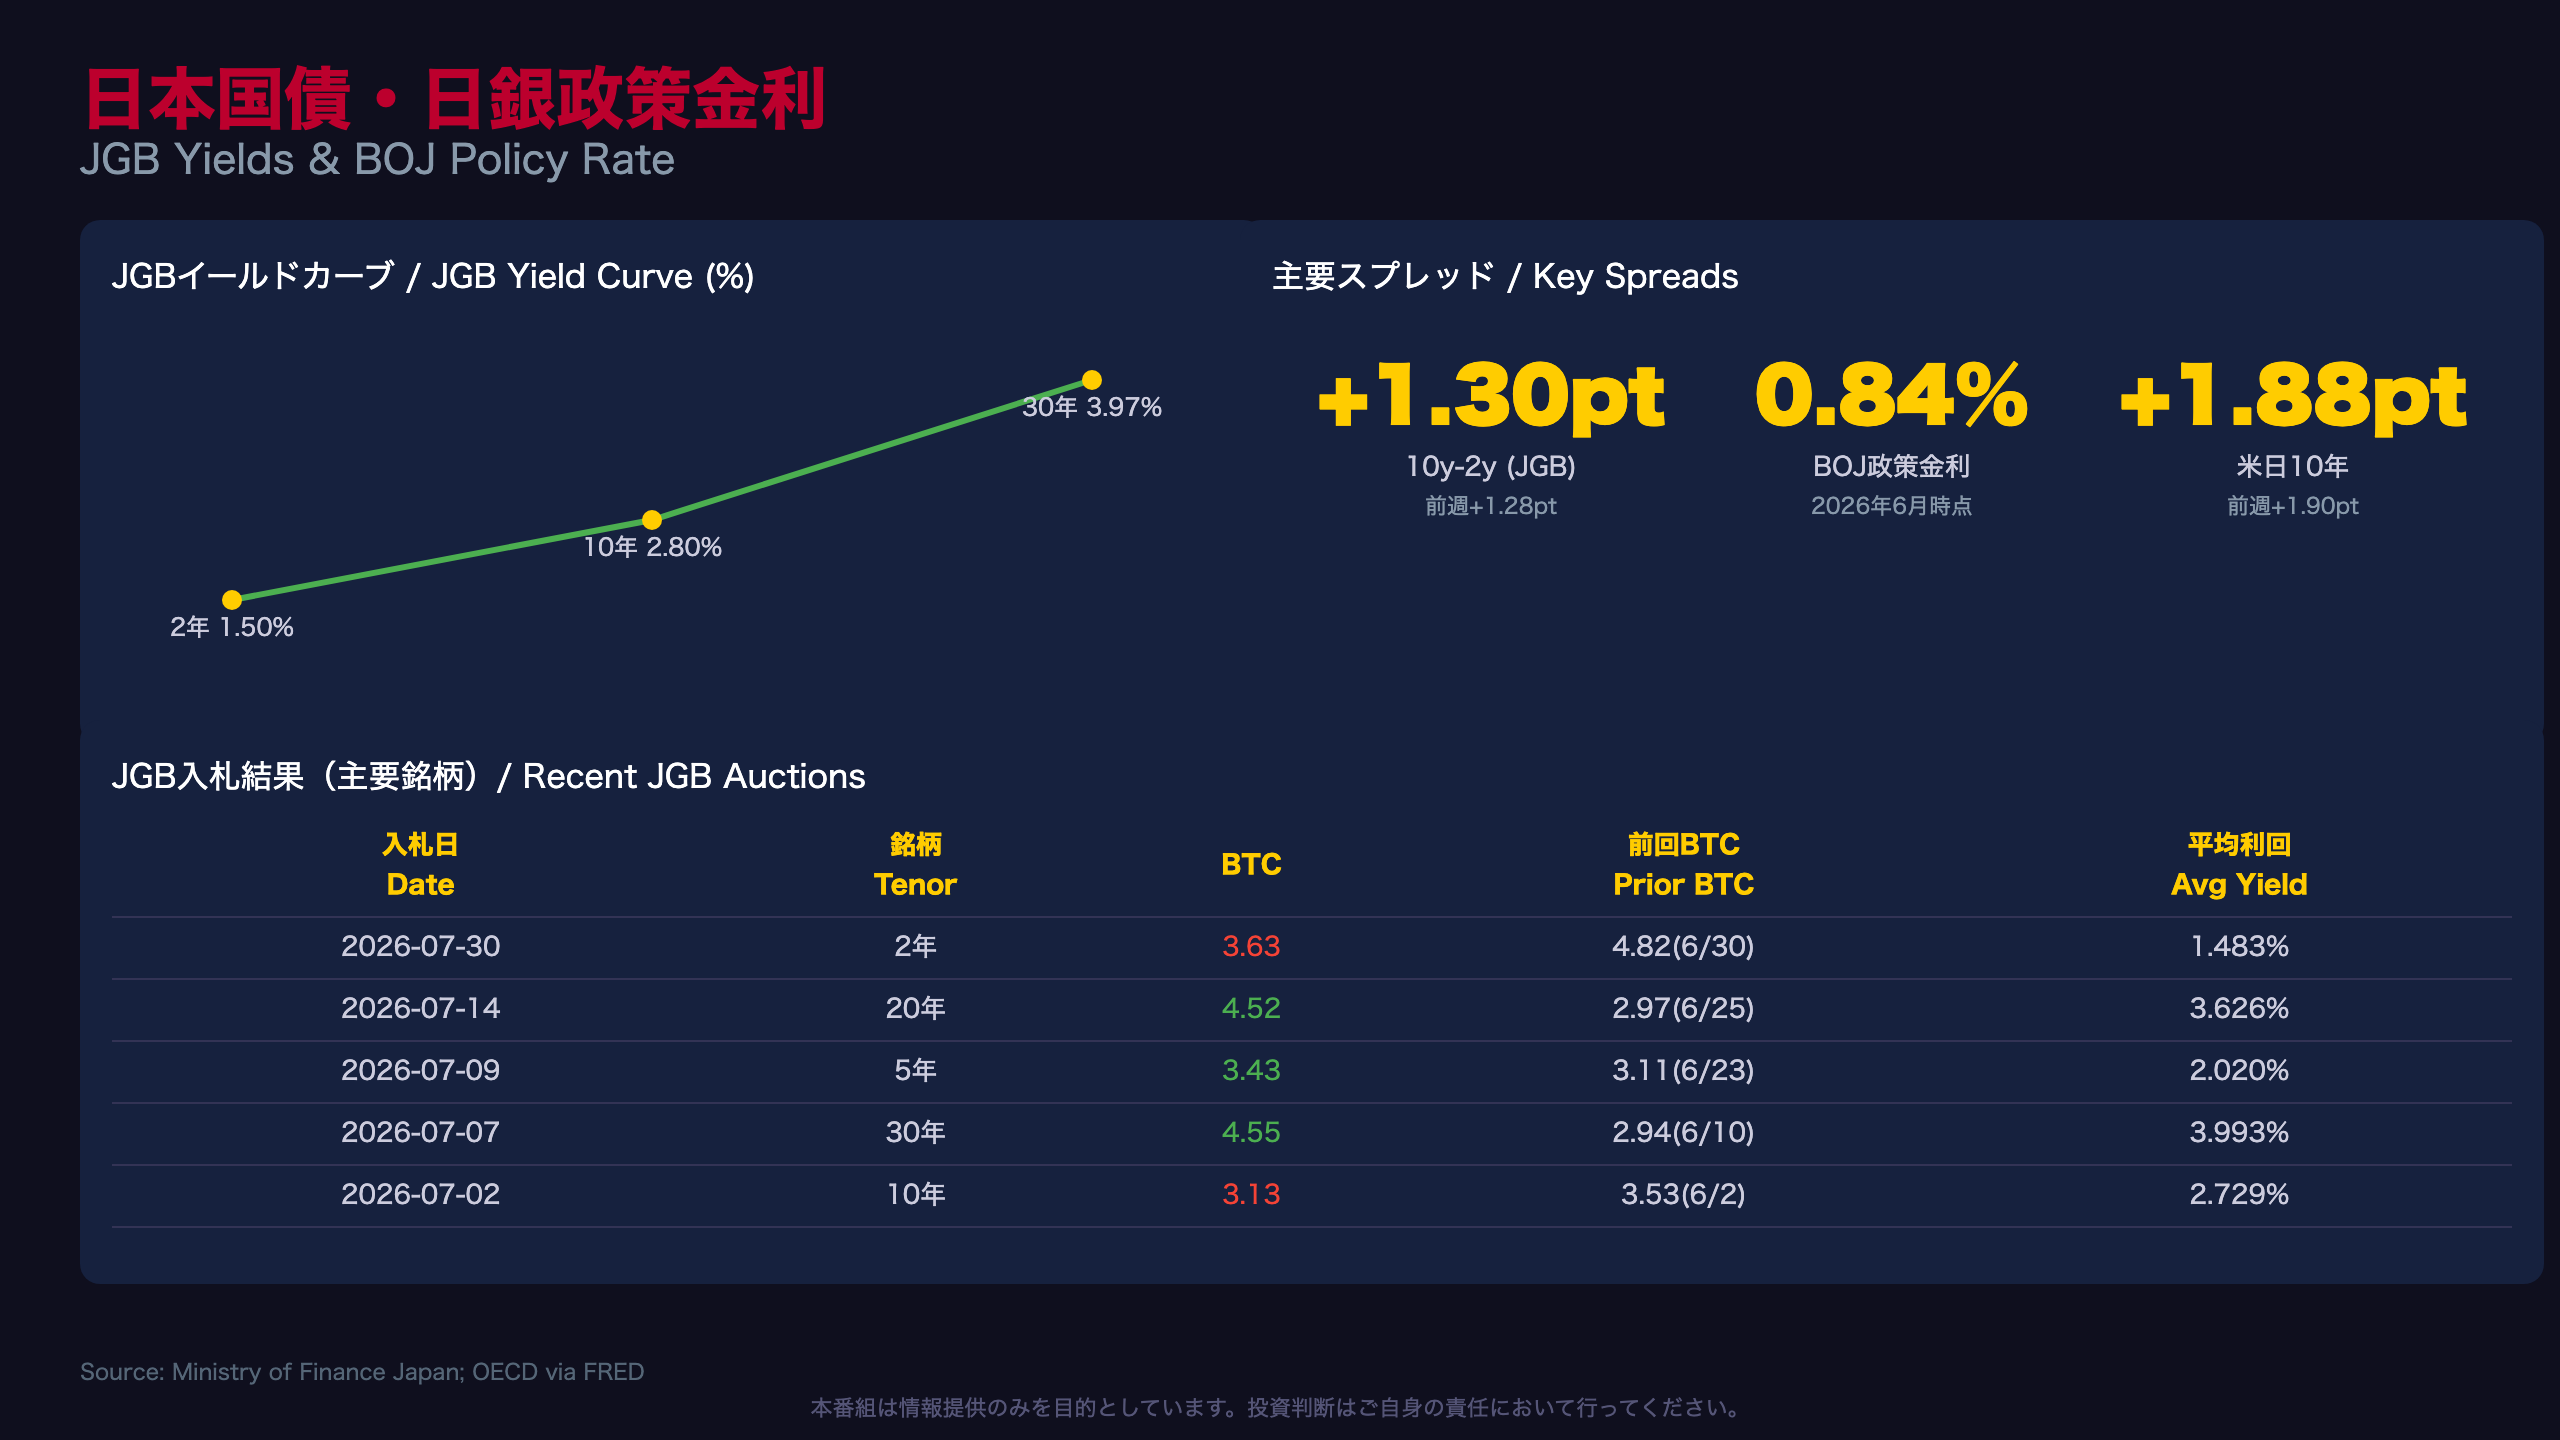
🇯🇵 JGB yields eased across the curve; the 2-year auction bid-to-cover dropped to 3.63 from 4.82 previously.
💡 US-Japan and US-Germany 10y spreads both narrowed. NFC’s HMM regime models flagged shifts in both the ECB and BOE.
Full breakdown of auctions, European spreads, JGB demand, and FX implications inside.
グローバル金利スナップショット / Global Rate Snapshot
Reading the Steepening Signal
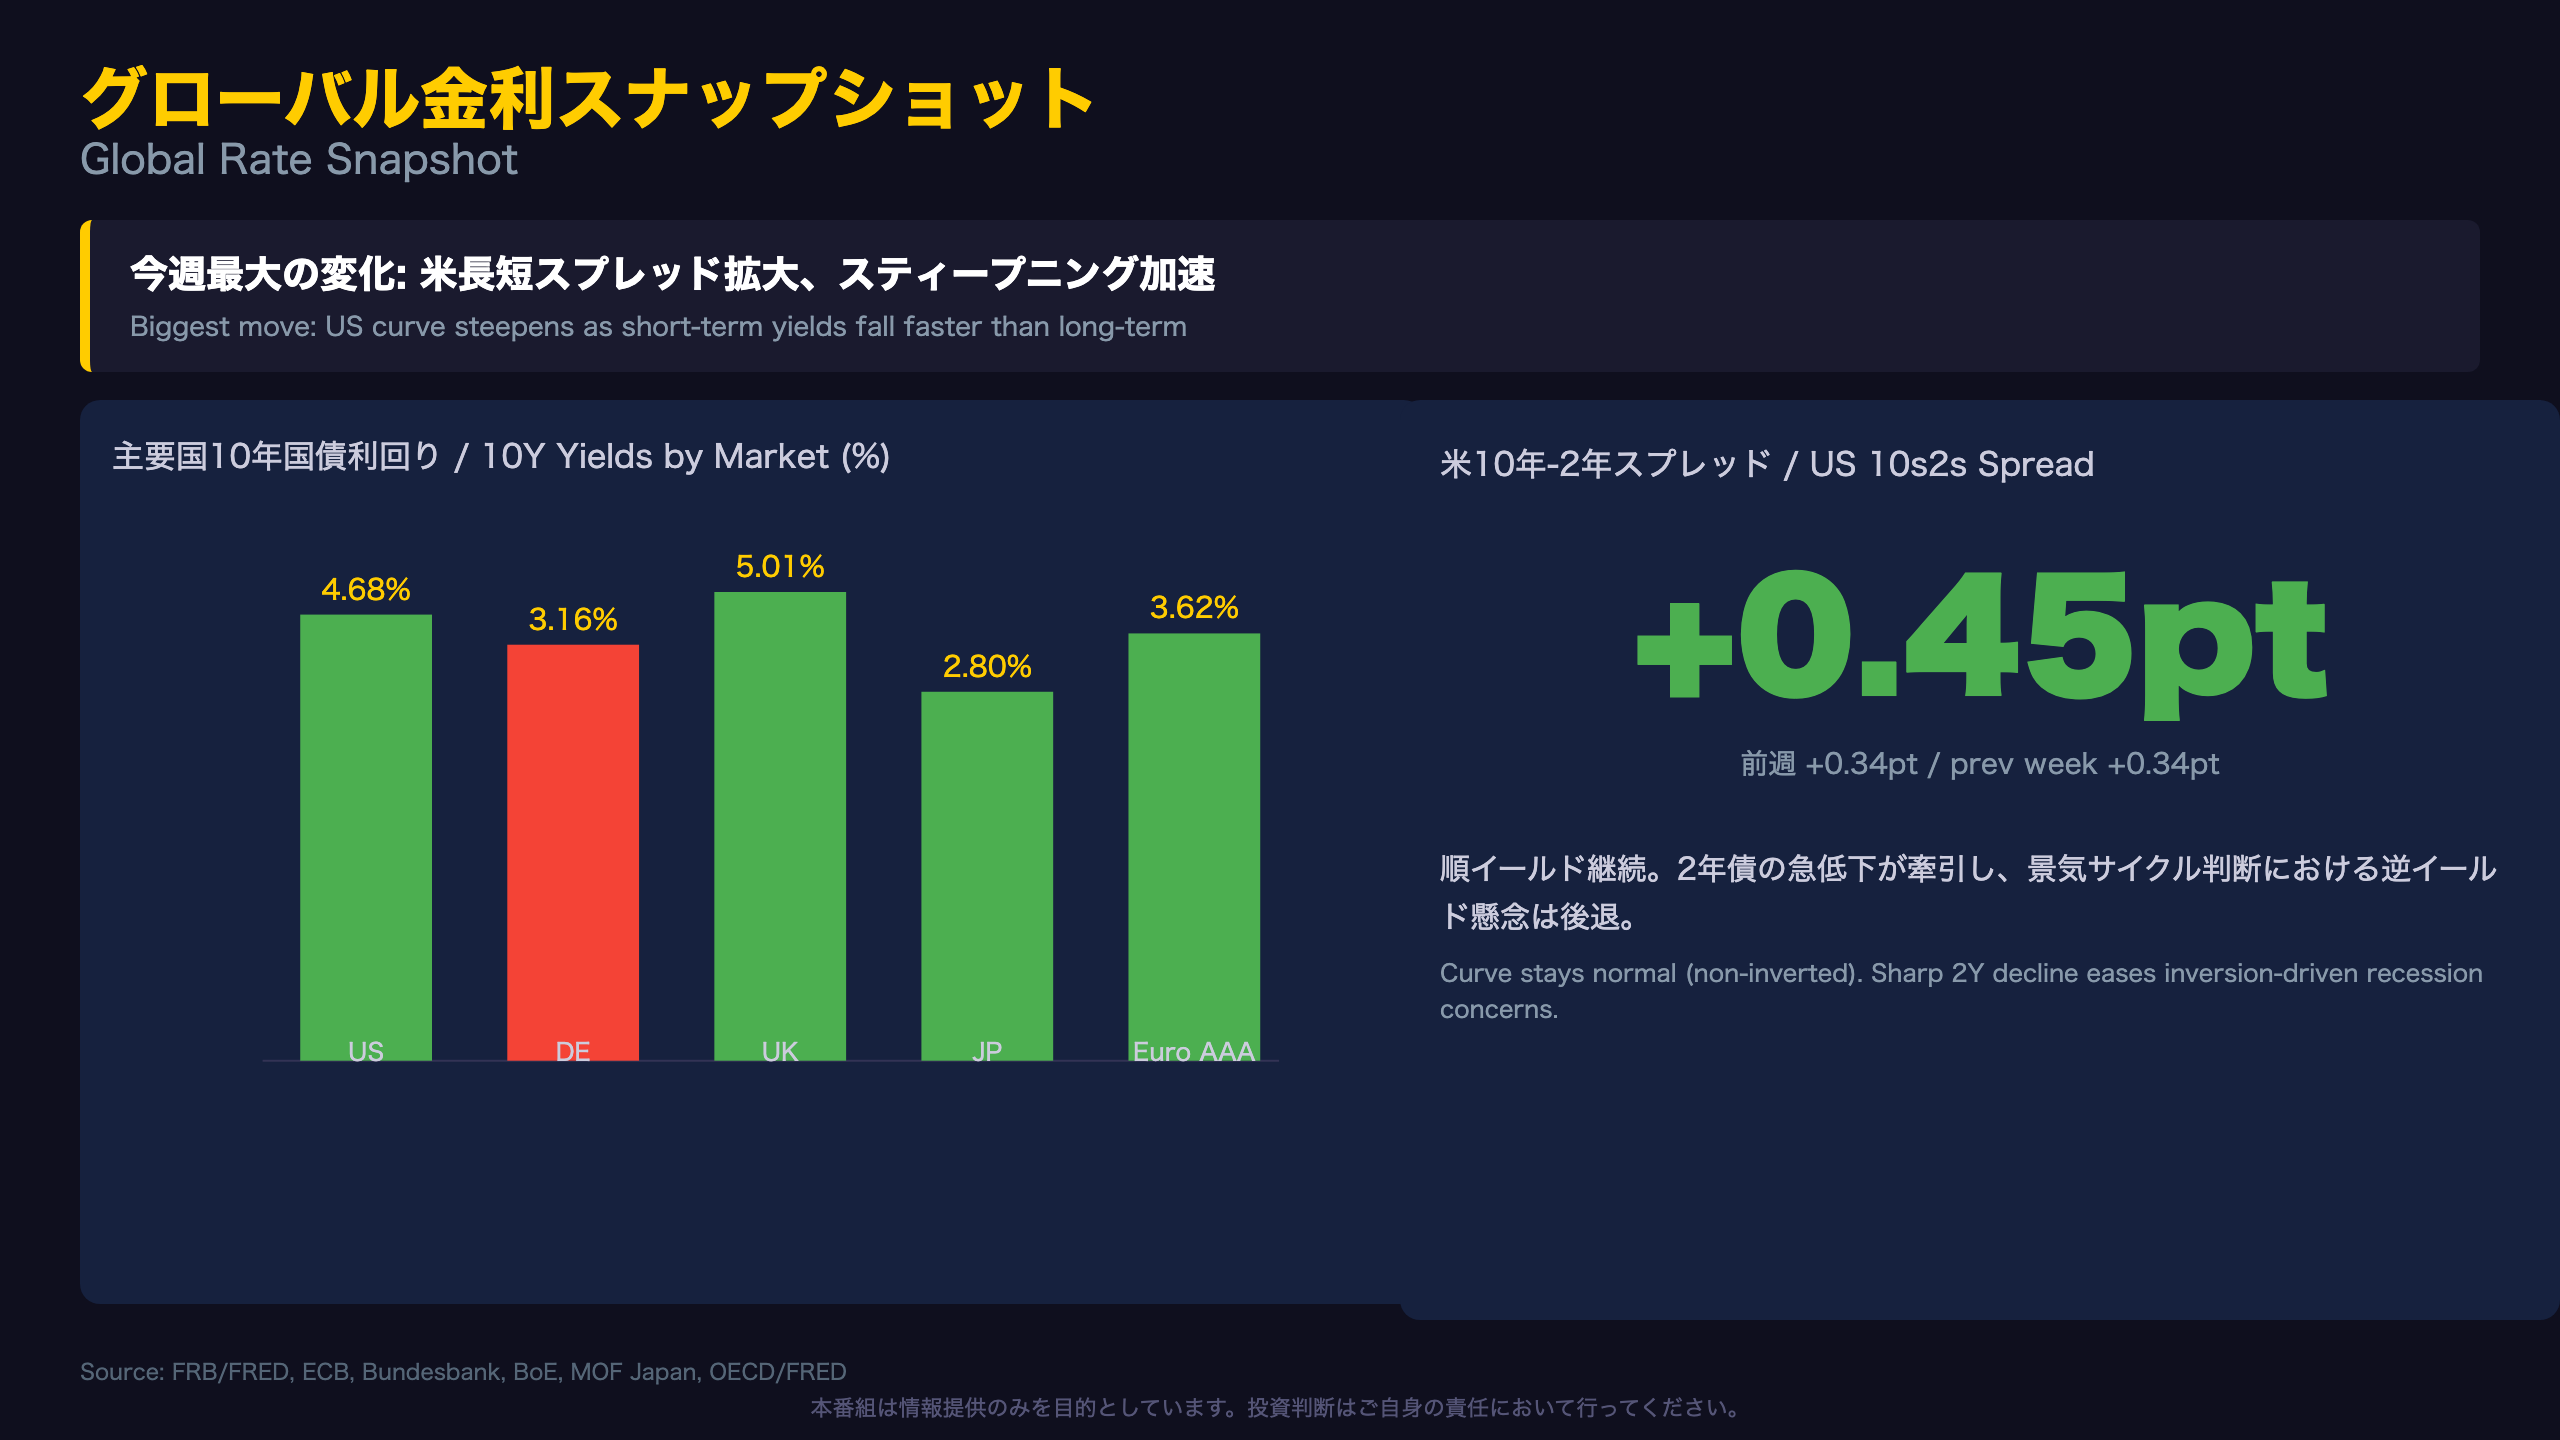
The US Treasury curve is exhibiting a classic “bull steepening” pattern this week: the 2-year yield’s decline (-0.14pt) outpaced the 30-year’s modest rise (+0.04pt). This marks a reversal from the prior week (July 23), when both the 2-year (+0.21pt) and 10-year (+0.14pt) had actually risen — making this week’s shift notable.
10-Year Yields Across Markets (as of ~July 30, 2026)
| Market | Yield | WoW Change |
|---|---|---|
| US Treasury | 4.68% | -0.03pt |
| German Bund | 3.16% | +0.03pt (5-day) |
| UK Gilt | 5.01% | -0.09pt |
| Japan JGB | 2.80% | -0.01pt |
| Euro Area AAA | 3.62% | -0.03pt |
For US-based readers unfamiliar with the term, the “10s2s spread” (10-year minus 2-year Treasury yield) is a widely watched recession indicator in the US, similar to how the Fed’s own economists monitor it. The current +0.45pt reading confirms the curve remains in a normal, non-inverted state — a contrast to the deeply inverted curves seen in 2023.
Note that France’s OAT and Italy’s BTP figures are still June-dated monthly data, not real-time — any near-term update to these could materially shift the European risk-premium narrative discussed later in this report.
米国債入札 Deep Dive / US Treasury Auctions
Decoding the Auction Data
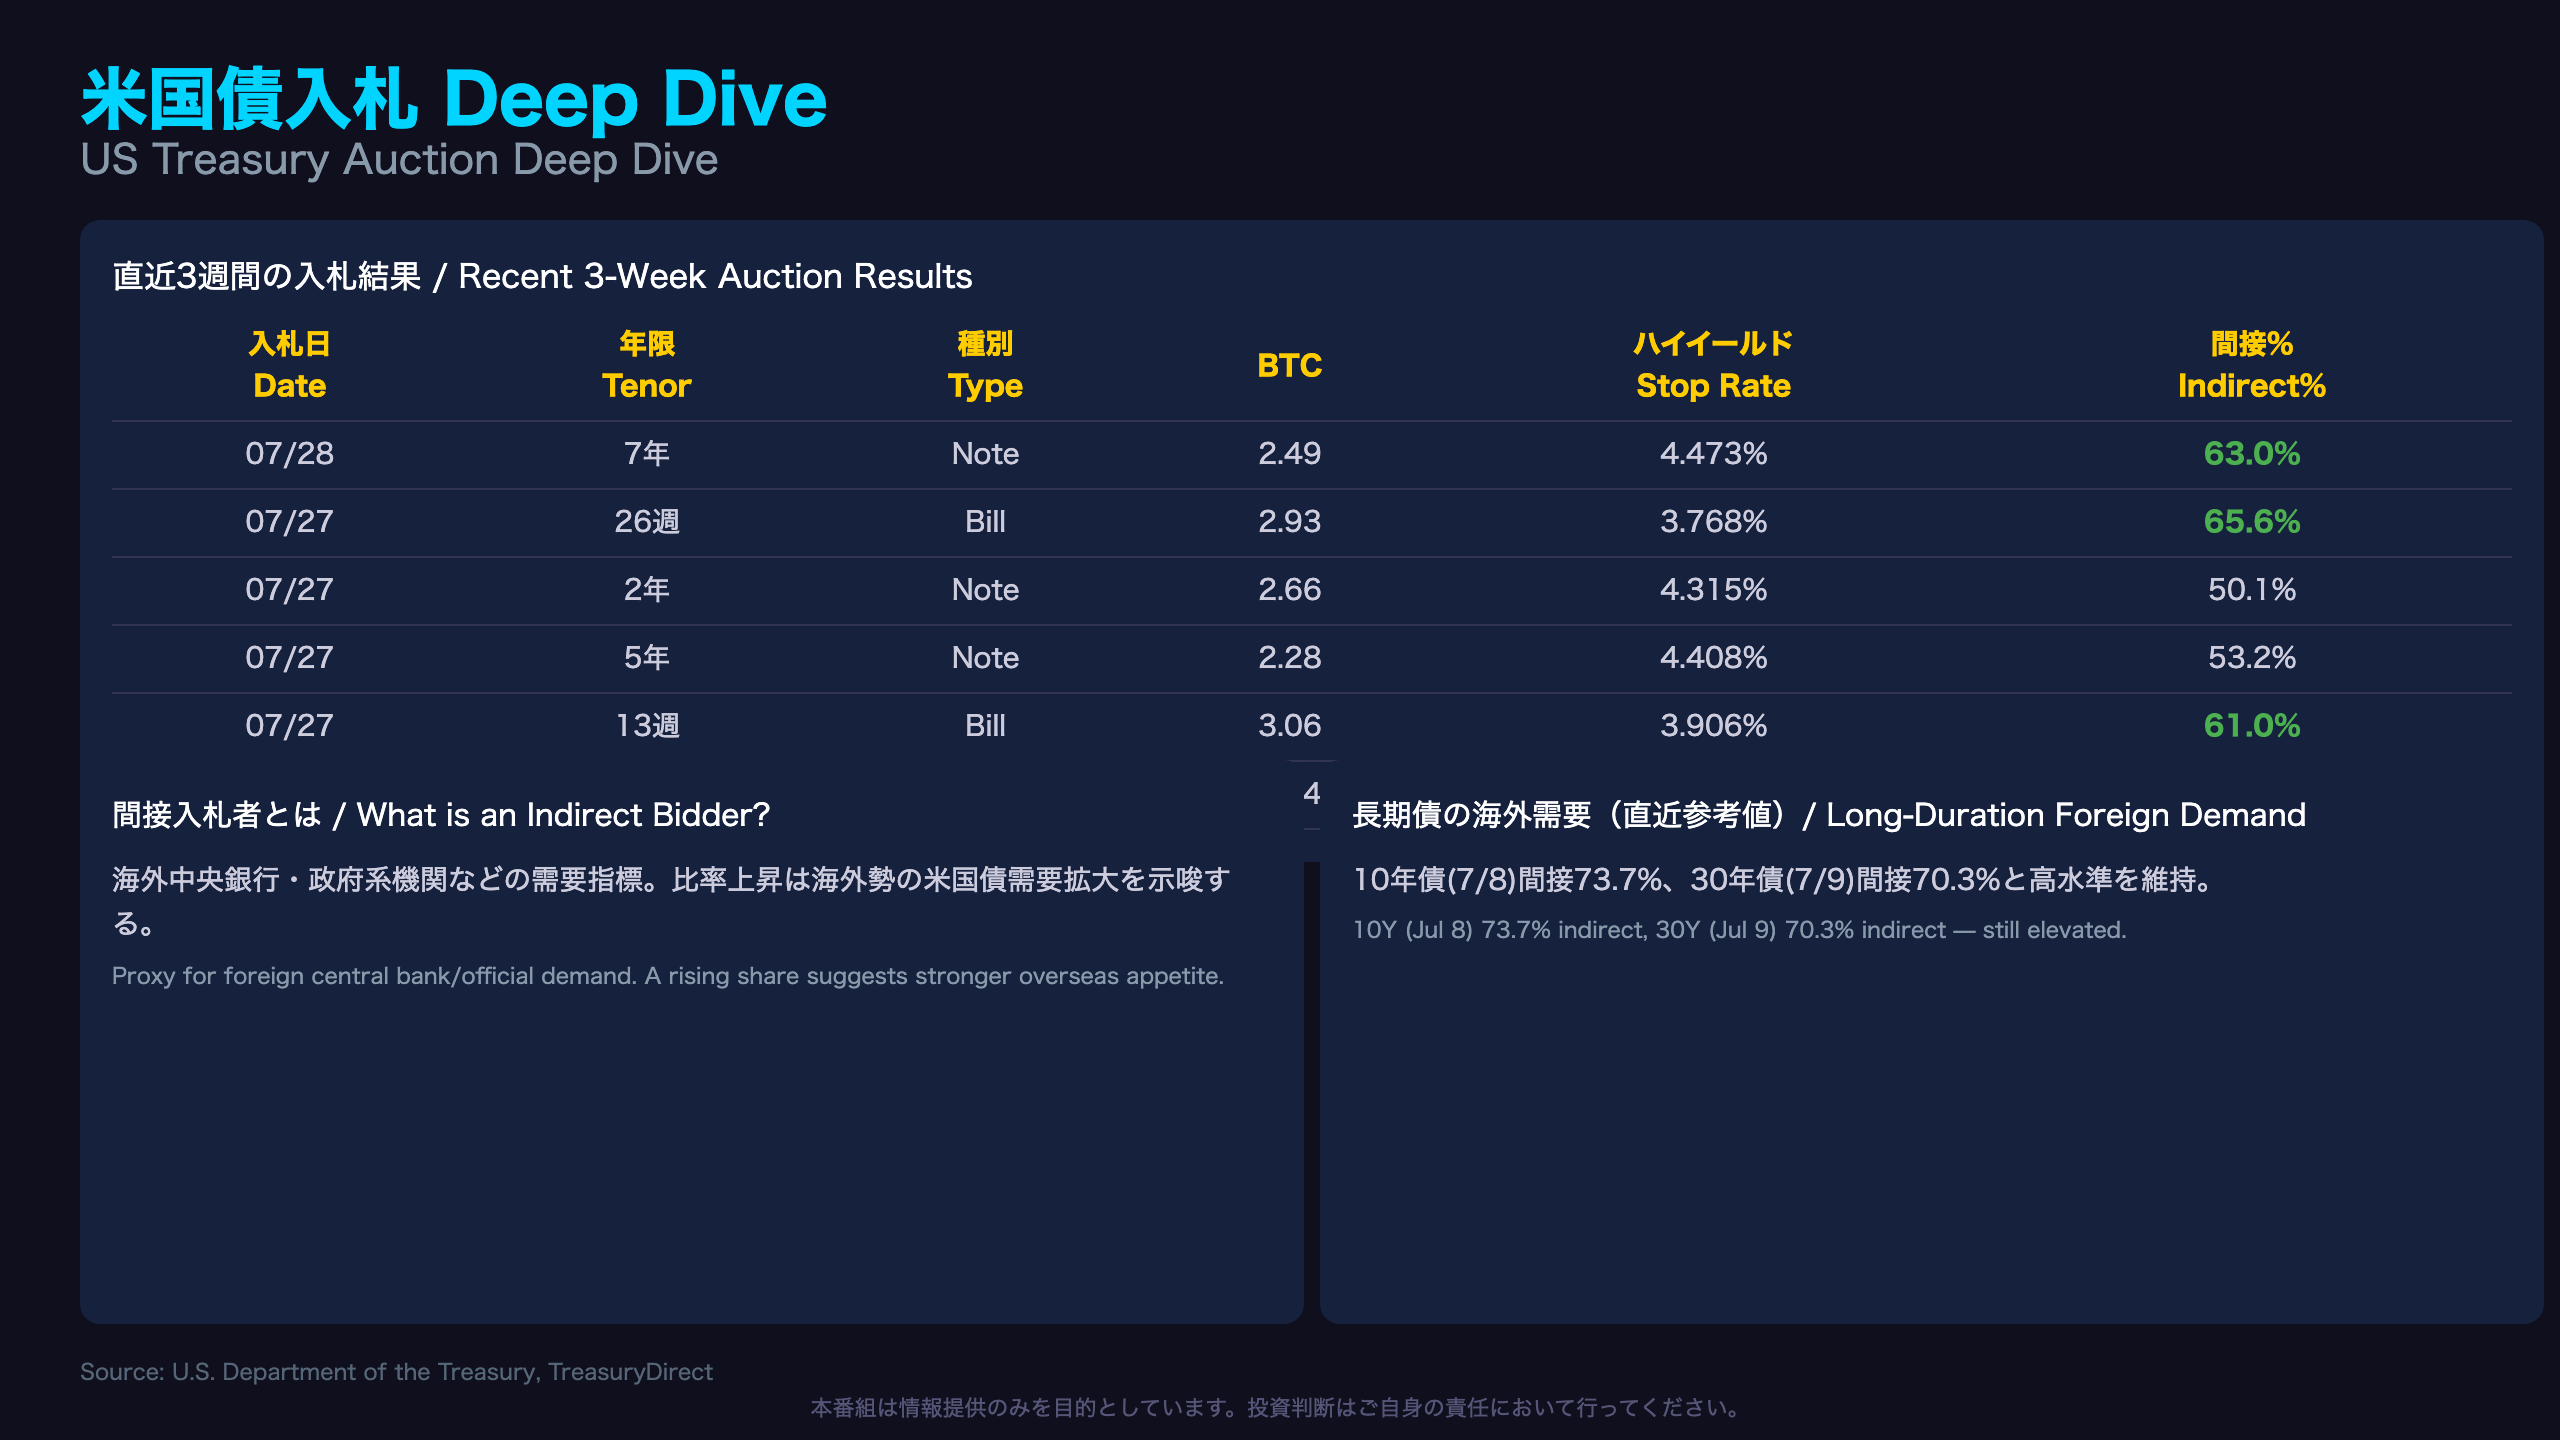
The most important metric in any Treasury auction result is the “indirect bidder” share — as the original glossary notes, this category captures foreign central banks and official institutions, making it the best available proxy for overseas demand for US government debt.
Bill Auctions: Week-over-Week
| Tenor | Auction Date | Bid-to-Cover | Indirect % | Prior Indirect % |
|---|---|---|---|---|
| 26-Week | Jul 28 | 2.93 | 65.6% | 53.4% (Jul 20) |
| 13-Week | Jul 27 | 3.06 | 61.0% | 50.9% (Jul 20) |
| 4-Week | Jul 30 | 2.80 | 57.3% | 57.5% (Jul 23) |
For US and international readers: a bid-to-cover (BTC) ratio above 2.5 is generally considered healthy demand by Treasury market convention, and the roughly 12-point jump in indirect participation on the 26-week and 13-week bills is notable — though bill auctions are inherently more volatile month-to-month than coupon note auctions, so this shouldn’t be over-extrapolated into a durable trend just yet.
Coupon Notes: Steady, Not Spectacular
The 5-year note (BTC 2.28) and 7-year note (BTC 2.49) auctioned this week were unremarkable relative to historical patterns — neither a red flag nor a standout. What matters more for dollar-funding dynamics is that the most recent 10-year (Jul 8, BTC 2.59, 73.7% indirect) and 30-year (Jul 9, BTC 2.44, 70.3% indirect) auctions both showed indirect participation above 70%, suggesting foreign appetite for long-duration Treasuries has not deteriorated even as the fiscal deficit debate continues in Washington.
ヨーロッパ債券市場 / European Bond Markets
Why the Euro Area “AAA” Yield Diverges from the Bund
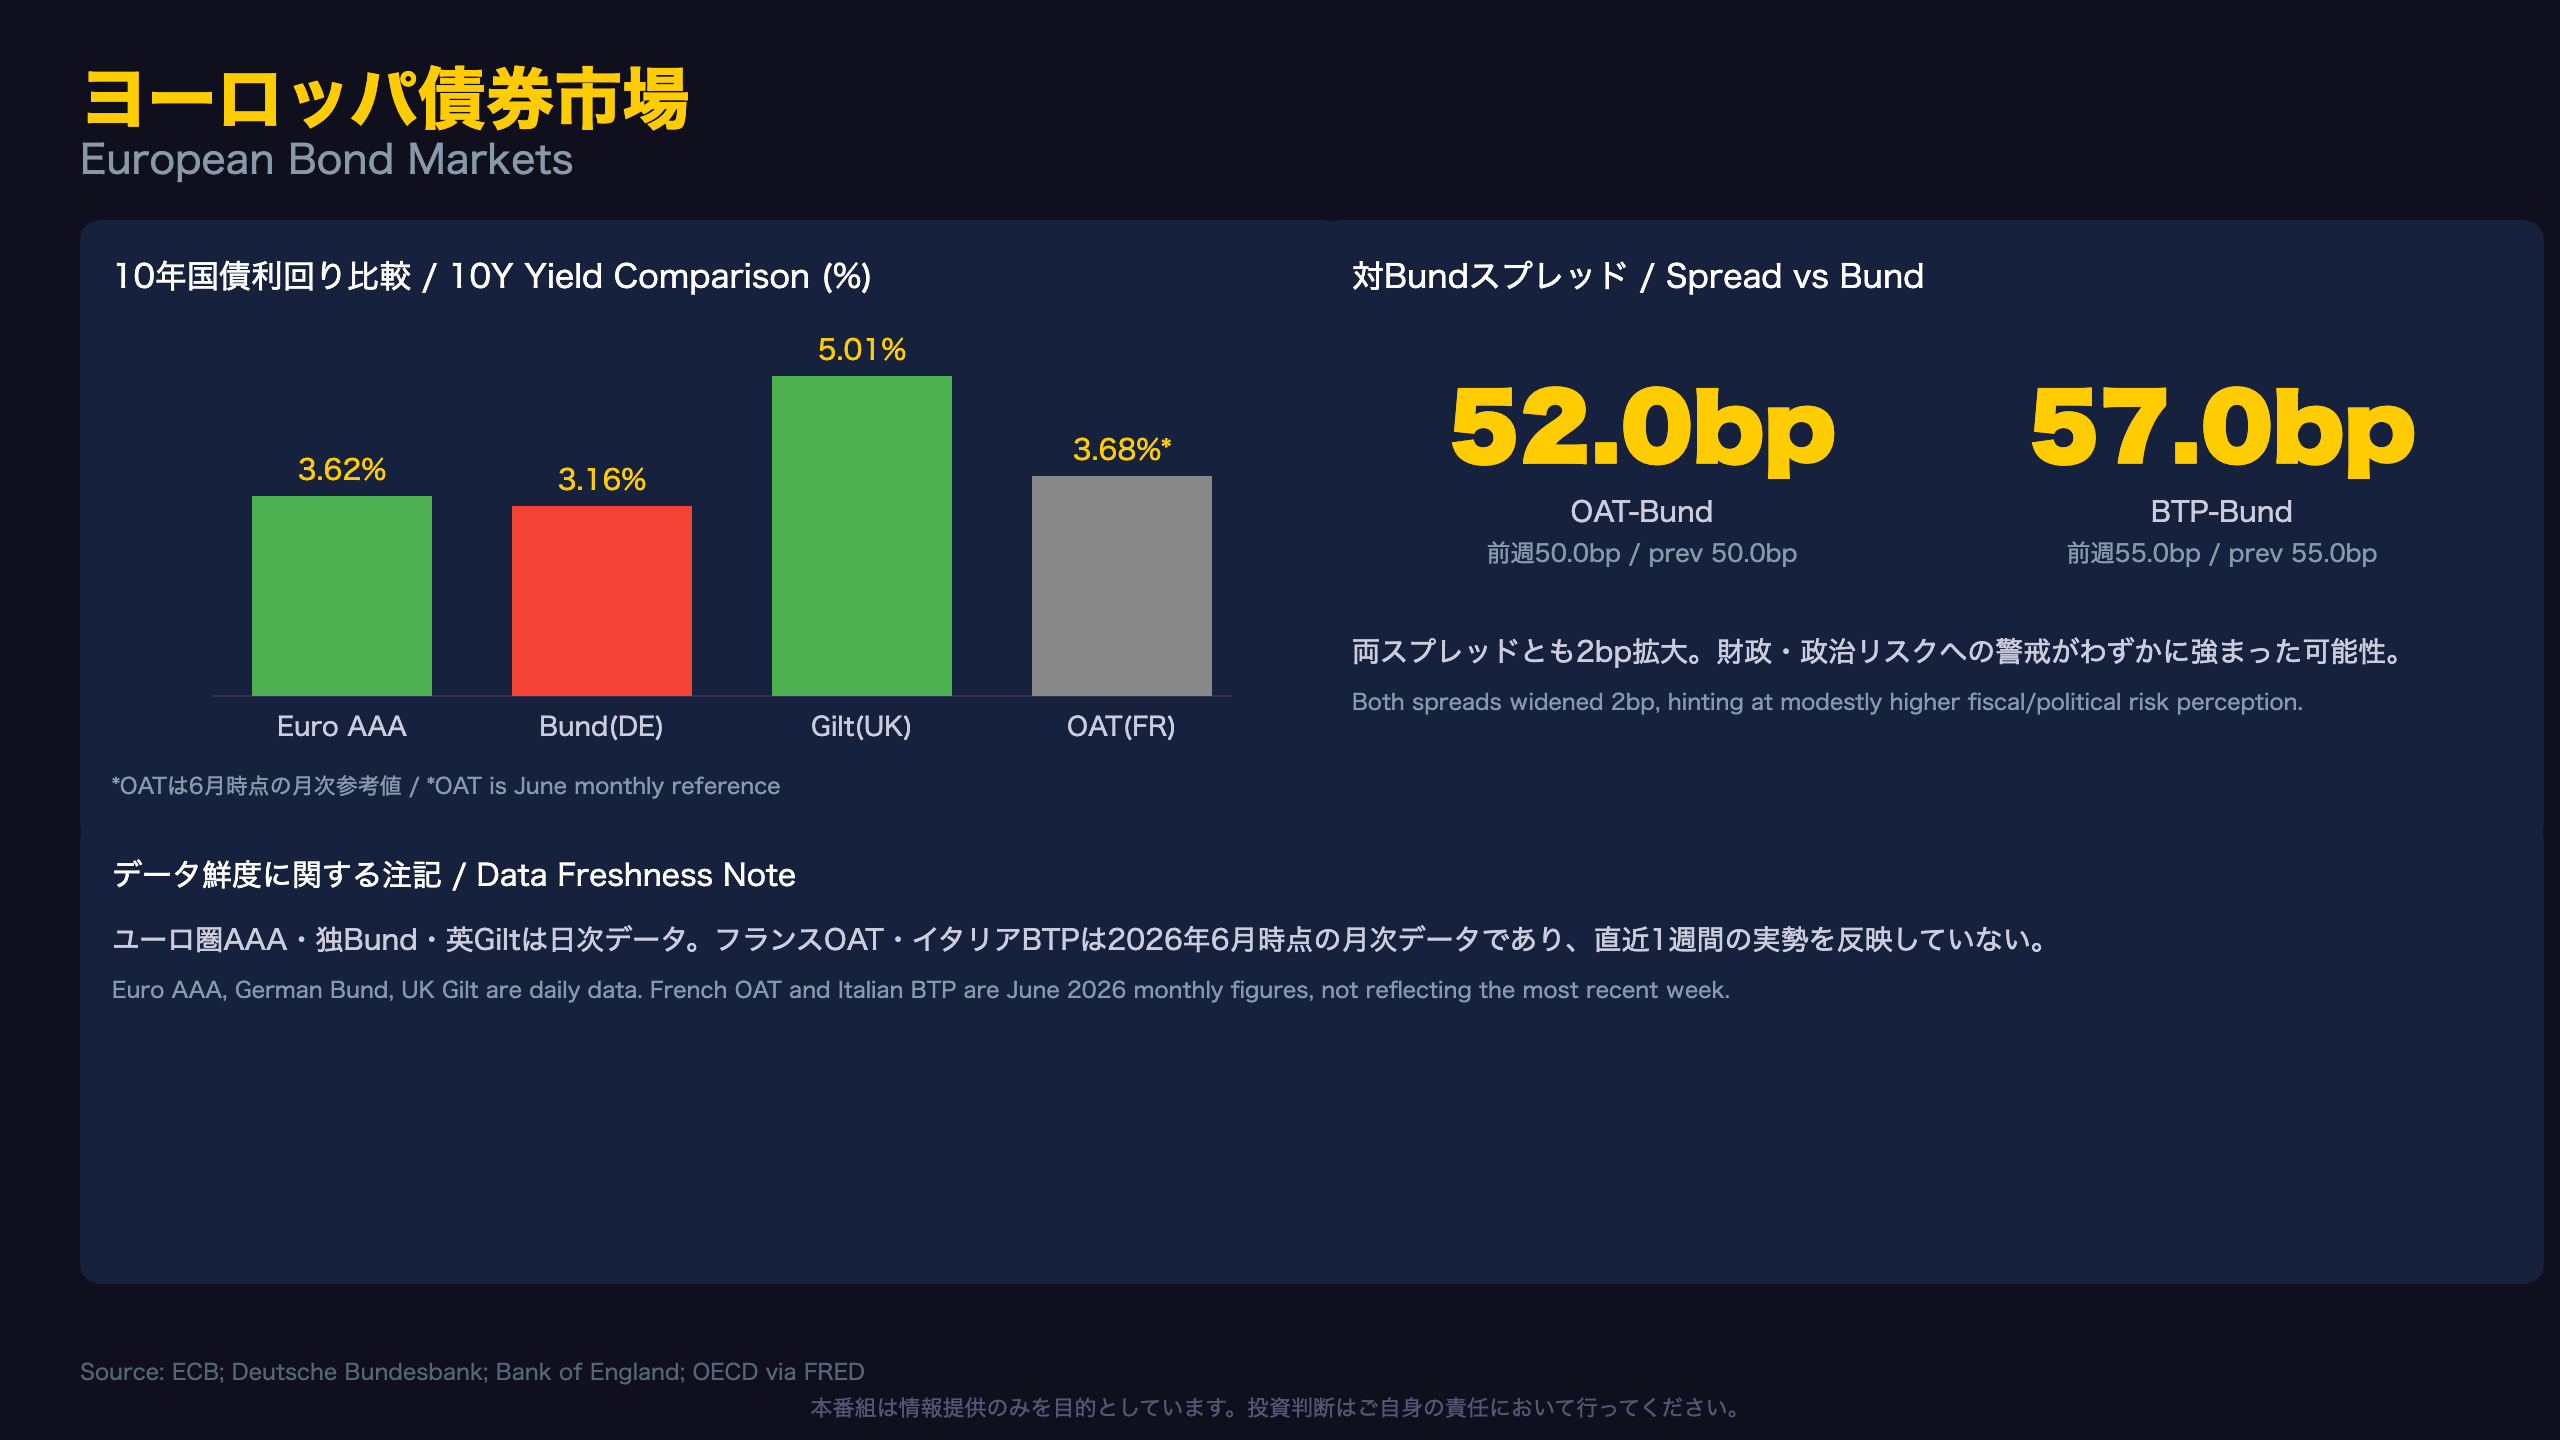
One subtlety for non-European readers: the ECB’s euro-area AAA yield (3.62%) sits meaningfully above the German Bund alone (3.16%). That’s because the AAA composite is a weighted blend across multiple top-rated euro sovereigns (Germany, Netherlands, Austria, and others), not just Germany — so movements in the composite shouldn’t be read as pure Bund proxy.
Peripheral Spreads vs. Bund
| Spread | This Week | Last Week | Change |
|---|---|---|---|
| OAT-Bund | 52.0bp | 50.0bp | +2bp |
| BTP-Bund | 57.0bp | 55.0bp | +2bp |
Important context: France’s OAT and Italy’s BTP yields themselves are unchanged from June (monthly data), so the entire 2bp widening in both spreads is mechanically attributable to the small move in the German Bund yield, not necessarily any deterioration in French or Italian fiscal conditions. This is a good example of why reading a single spread number without checking its components can mislead — the honest read here is “possibly reflecting Bund-side movement,” not a genuine risk escalation in the periphery.
UK Gilts: The Standout Mover
The UK 10-year Gilt fell 0.09 points week-over-week — the largest decline among major markets covered, reversing the prior week’s +0.15pt rise. For US investors comparing this to Fed-driven Treasury moves, this reversal deserves attention given the BOE’s own model regime shifted from “Hawkish Hold” to “Restrictive” over the same period — a connection explored further in the FX implications section.
日本国債・日銀政策金利 / JGB & BOJ
Making Sense of the 2-Year Auction’s Sharp BTC Drop
The July 30th 2-year JGB auction posted a bid-to-cover (BTC) ratio of 3.63 — a steep 1.19-point drop from the June 30th auction’s 4.82. Compared against the past several 2-year auctions (5.24 on Apr 30, 3.70 on May 29, 4.82 on Jun 30), this reading sits toward the lower end of the recent range.
For readers new to JGB auctions: Japan’s Ministry of Finance defines BTC as total bids divided by the amount allotted — a higher number signals stronger demand. This week’s decline is one data point suggesting some unevenness in short-end demand, though the “tail” metric (stop-out yield minus average yield, a key gauge of bidder dispersion) was not disclosed this round (shown as “—” in the source data), so we can’t quantify the degree of any demand softness with precision.
Super-Long Tenors Tell a Different Story
| Tenor | Auction Date | BTC | Prior BTC (June) |
|---|---|---|---|
| 20-Year | Jul 14 | 4.52 | 2.97 (Jun 25) |
| 30-Year | Jul 7 | 4.55 | 2.94 (Jun 10) |
Both the 20-year and 30-year auctions saw bid-to-cover ratios improve markedly versus their June predecessors — a sign that demand for Japan’s super-long bonds, often driven by domestic life insurers and pension funds seeking duration, remains solid. The 10-year auction (Jul 2, BTC 3.13), however, actually weakened from its prior reading (Jun 2, BTC 3.53), highlighting that demand strength varies meaningfully by tenor rather than moving uniformly.
What This Means for BOJ Watchers
The 10s2s term spread’s modest widening (from +1.28pt to +1.30pt) is driven mainly by the short end falling faster, not a signal of imminent BOJ policy change. The BOJ policy rate held at 0.84% as of the June 2026 reading — for context, this remains far below the Fed’s rate, which is the core driver of the persistent US-Japan carry differential discussed next.
FX・CFDへの含意 / Trade Implications
Cross-Checking HMM Regime Shifts Against Bond Market Data
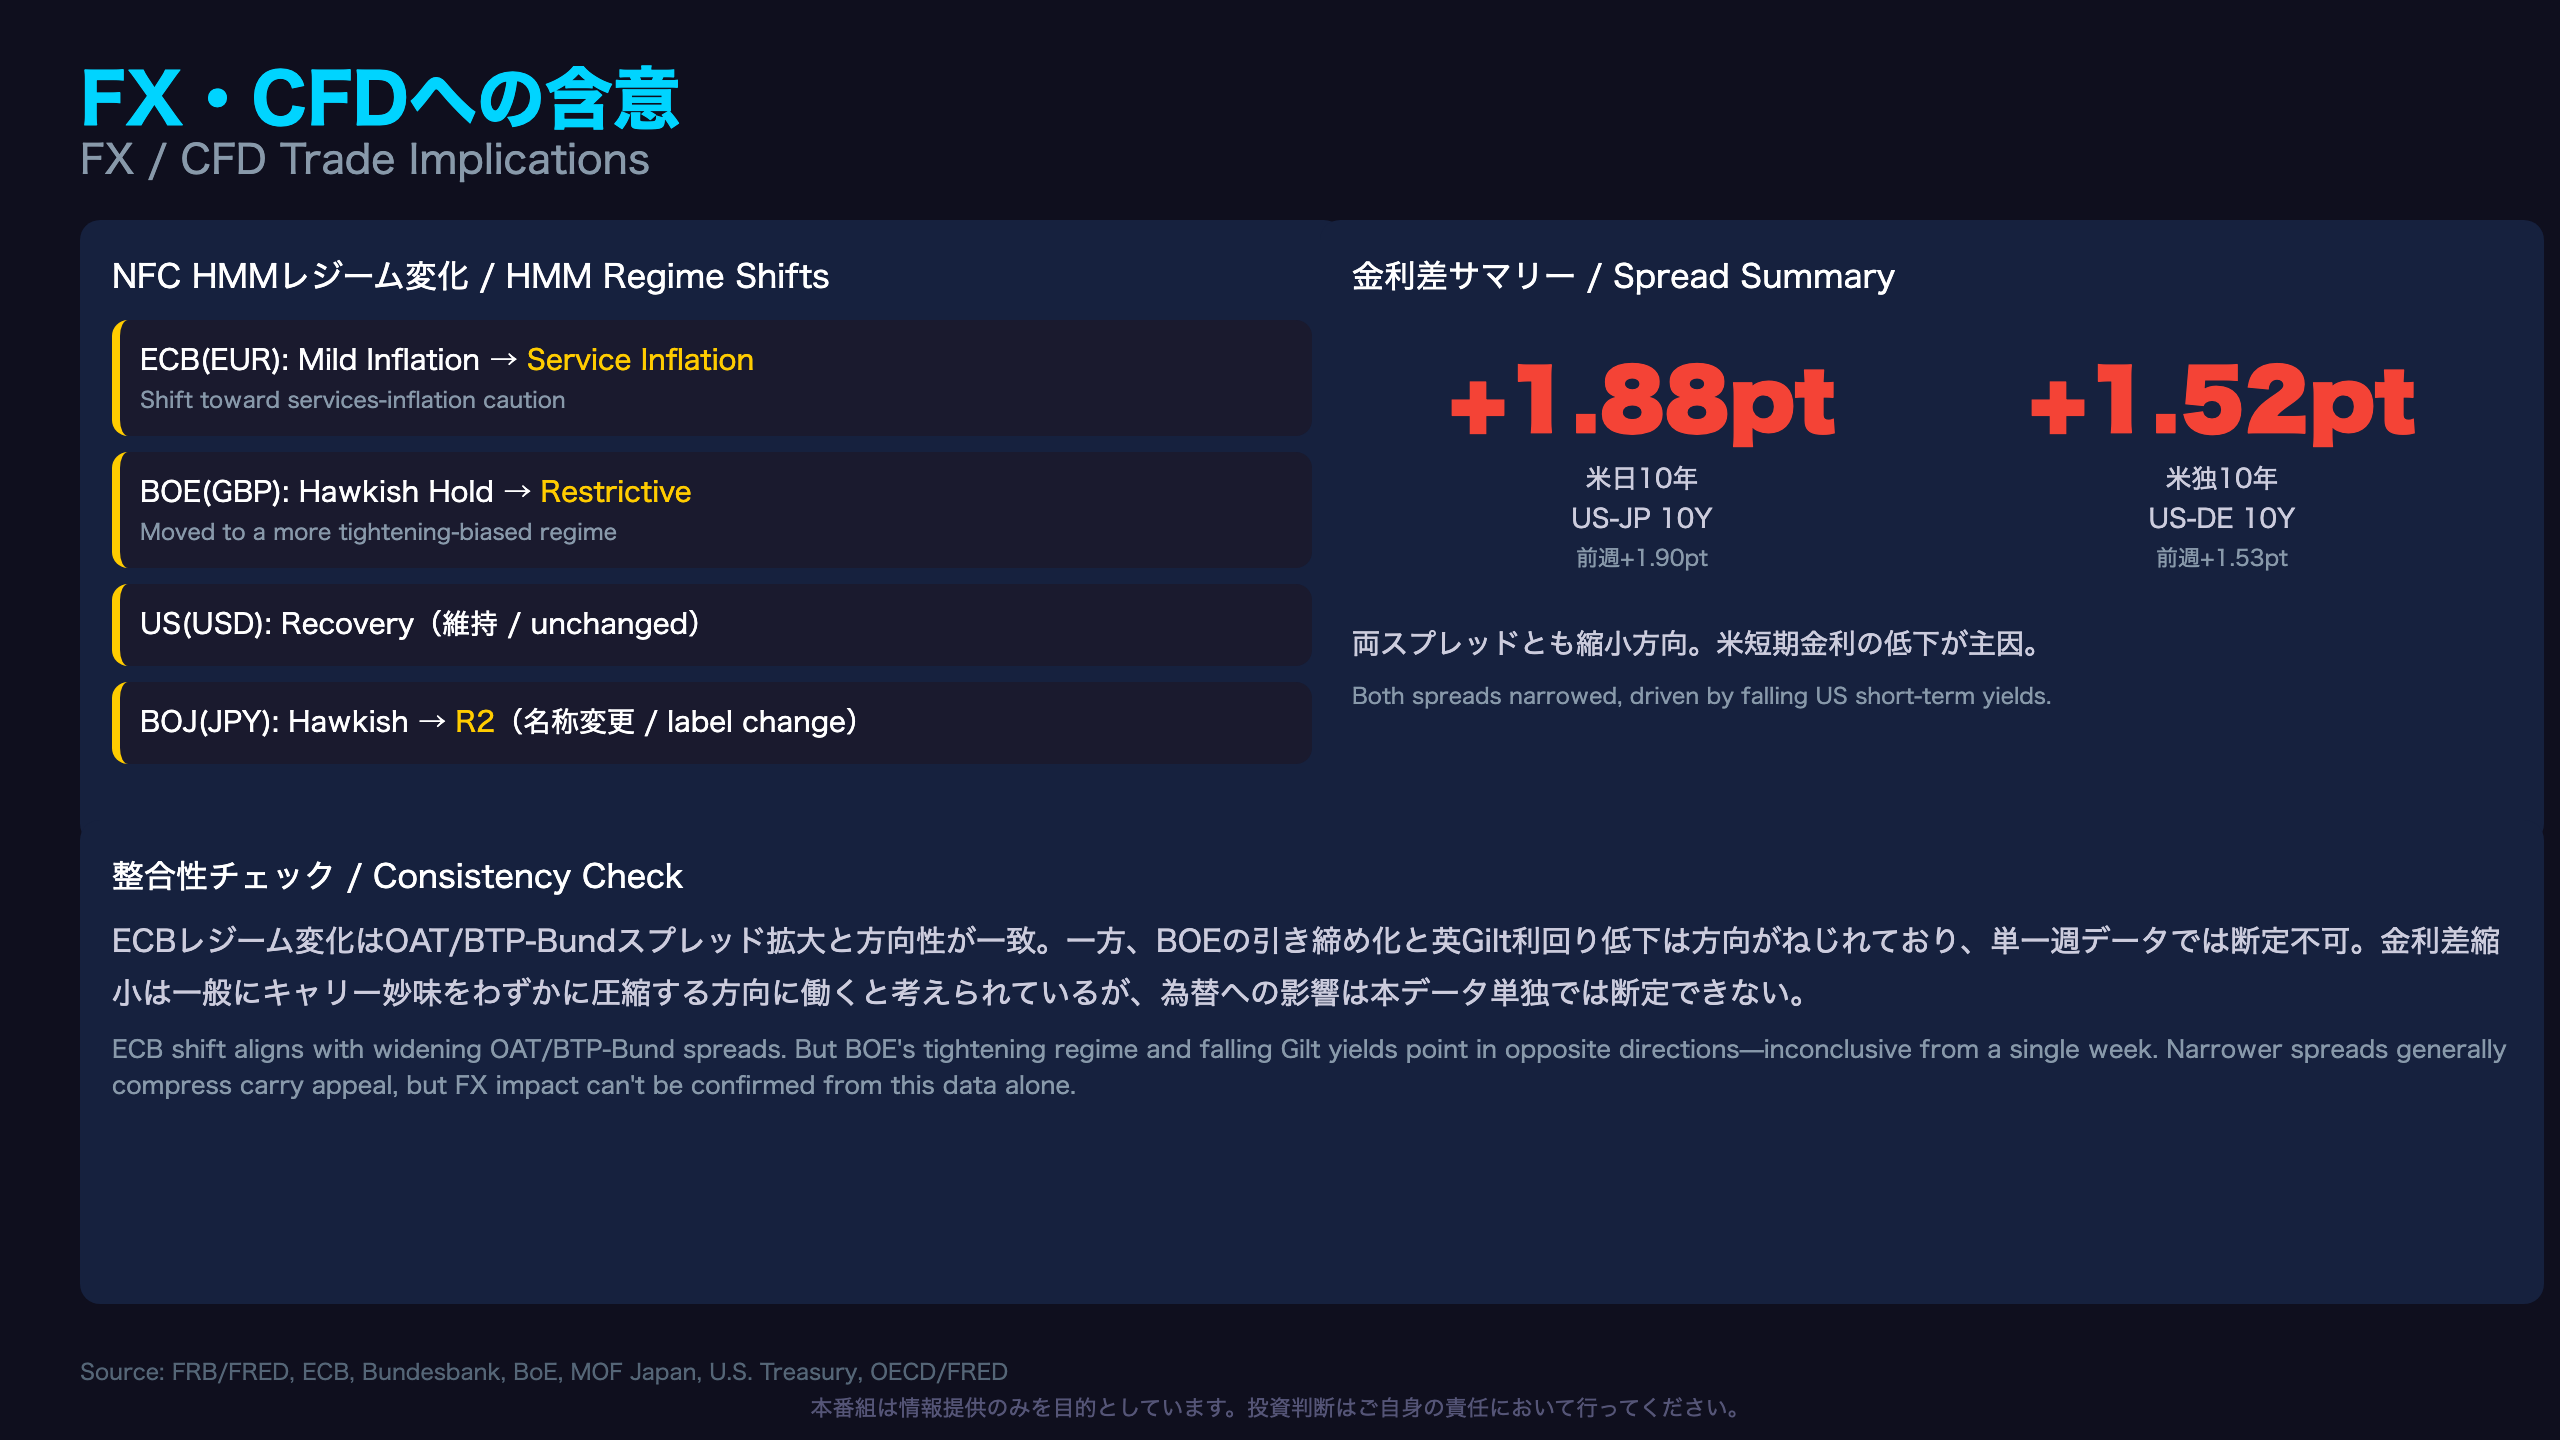
The most notable regime shift this week is the ECB model moving from “Mild Inflation” to “Service Inflation” — a label that typically signals heightened concern about sticky services-sector price pressure. This shift is directionally consistent with this week’s 2bp widening in both the OAT-Bund and BTP-Bund spreads. That said, some of that spread widening may be mechanically attributable to the small uptick in the German Bund yield itself rather than a genuine deterioration in periphery risk, so readers should be cautious about over-attributing causation to the regime change alone.
A Curious Twist: BOE Regime vs. Gilt Yields
The BOE model shifted from “Hawkish Hold” to “Restrictive” — a move toward a more tightening-oriented regime. Yet the UK 10-year Gilt yield actually fell this week, from 5.09% to 5.01%. For US and international readers used to the standard “tighter policy = higher yields” heuristic, this combination might look contradictory at first glance. One plausible read: the market may already have priced in the tightening bias, and this week’s move reflects a technical retracement or forward-looking expectations of an eventual policy pivot. However, a single week of data cannot confirm this interpretation — it merits watching over the coming weeks.
Carry Trade Implications
Both the US-Japan 10-year spread (from +1.90pt to +1.88pt) and the US-Germany 10-year spread (from +1.53pt to +1.52pt) narrowed slightly this week, driven mainly by the US 2-year yield’s outsized 0.14-point decline relative to Japan and Germany. As a general rule of thumb familiar to FX carry traders, a narrowing rate differential tends to modestly compress the return profile of carry positions in the relevant currency pair (e.g., long USD/JPY, long USD funded in EUR) — but this single week of data alone cannot determine any specific directional outcome for spot exchange rates.
Disclaimer: This article is for informational purposes only. All investment decisions are made solely at your own risk.