📺 Watch the Full Video Analysis
This article was automatically generated by the NFC Market Live AI analysis system. (Updated: 2026-08-02 08:39 JST)
📊 This week’s global macro roundup
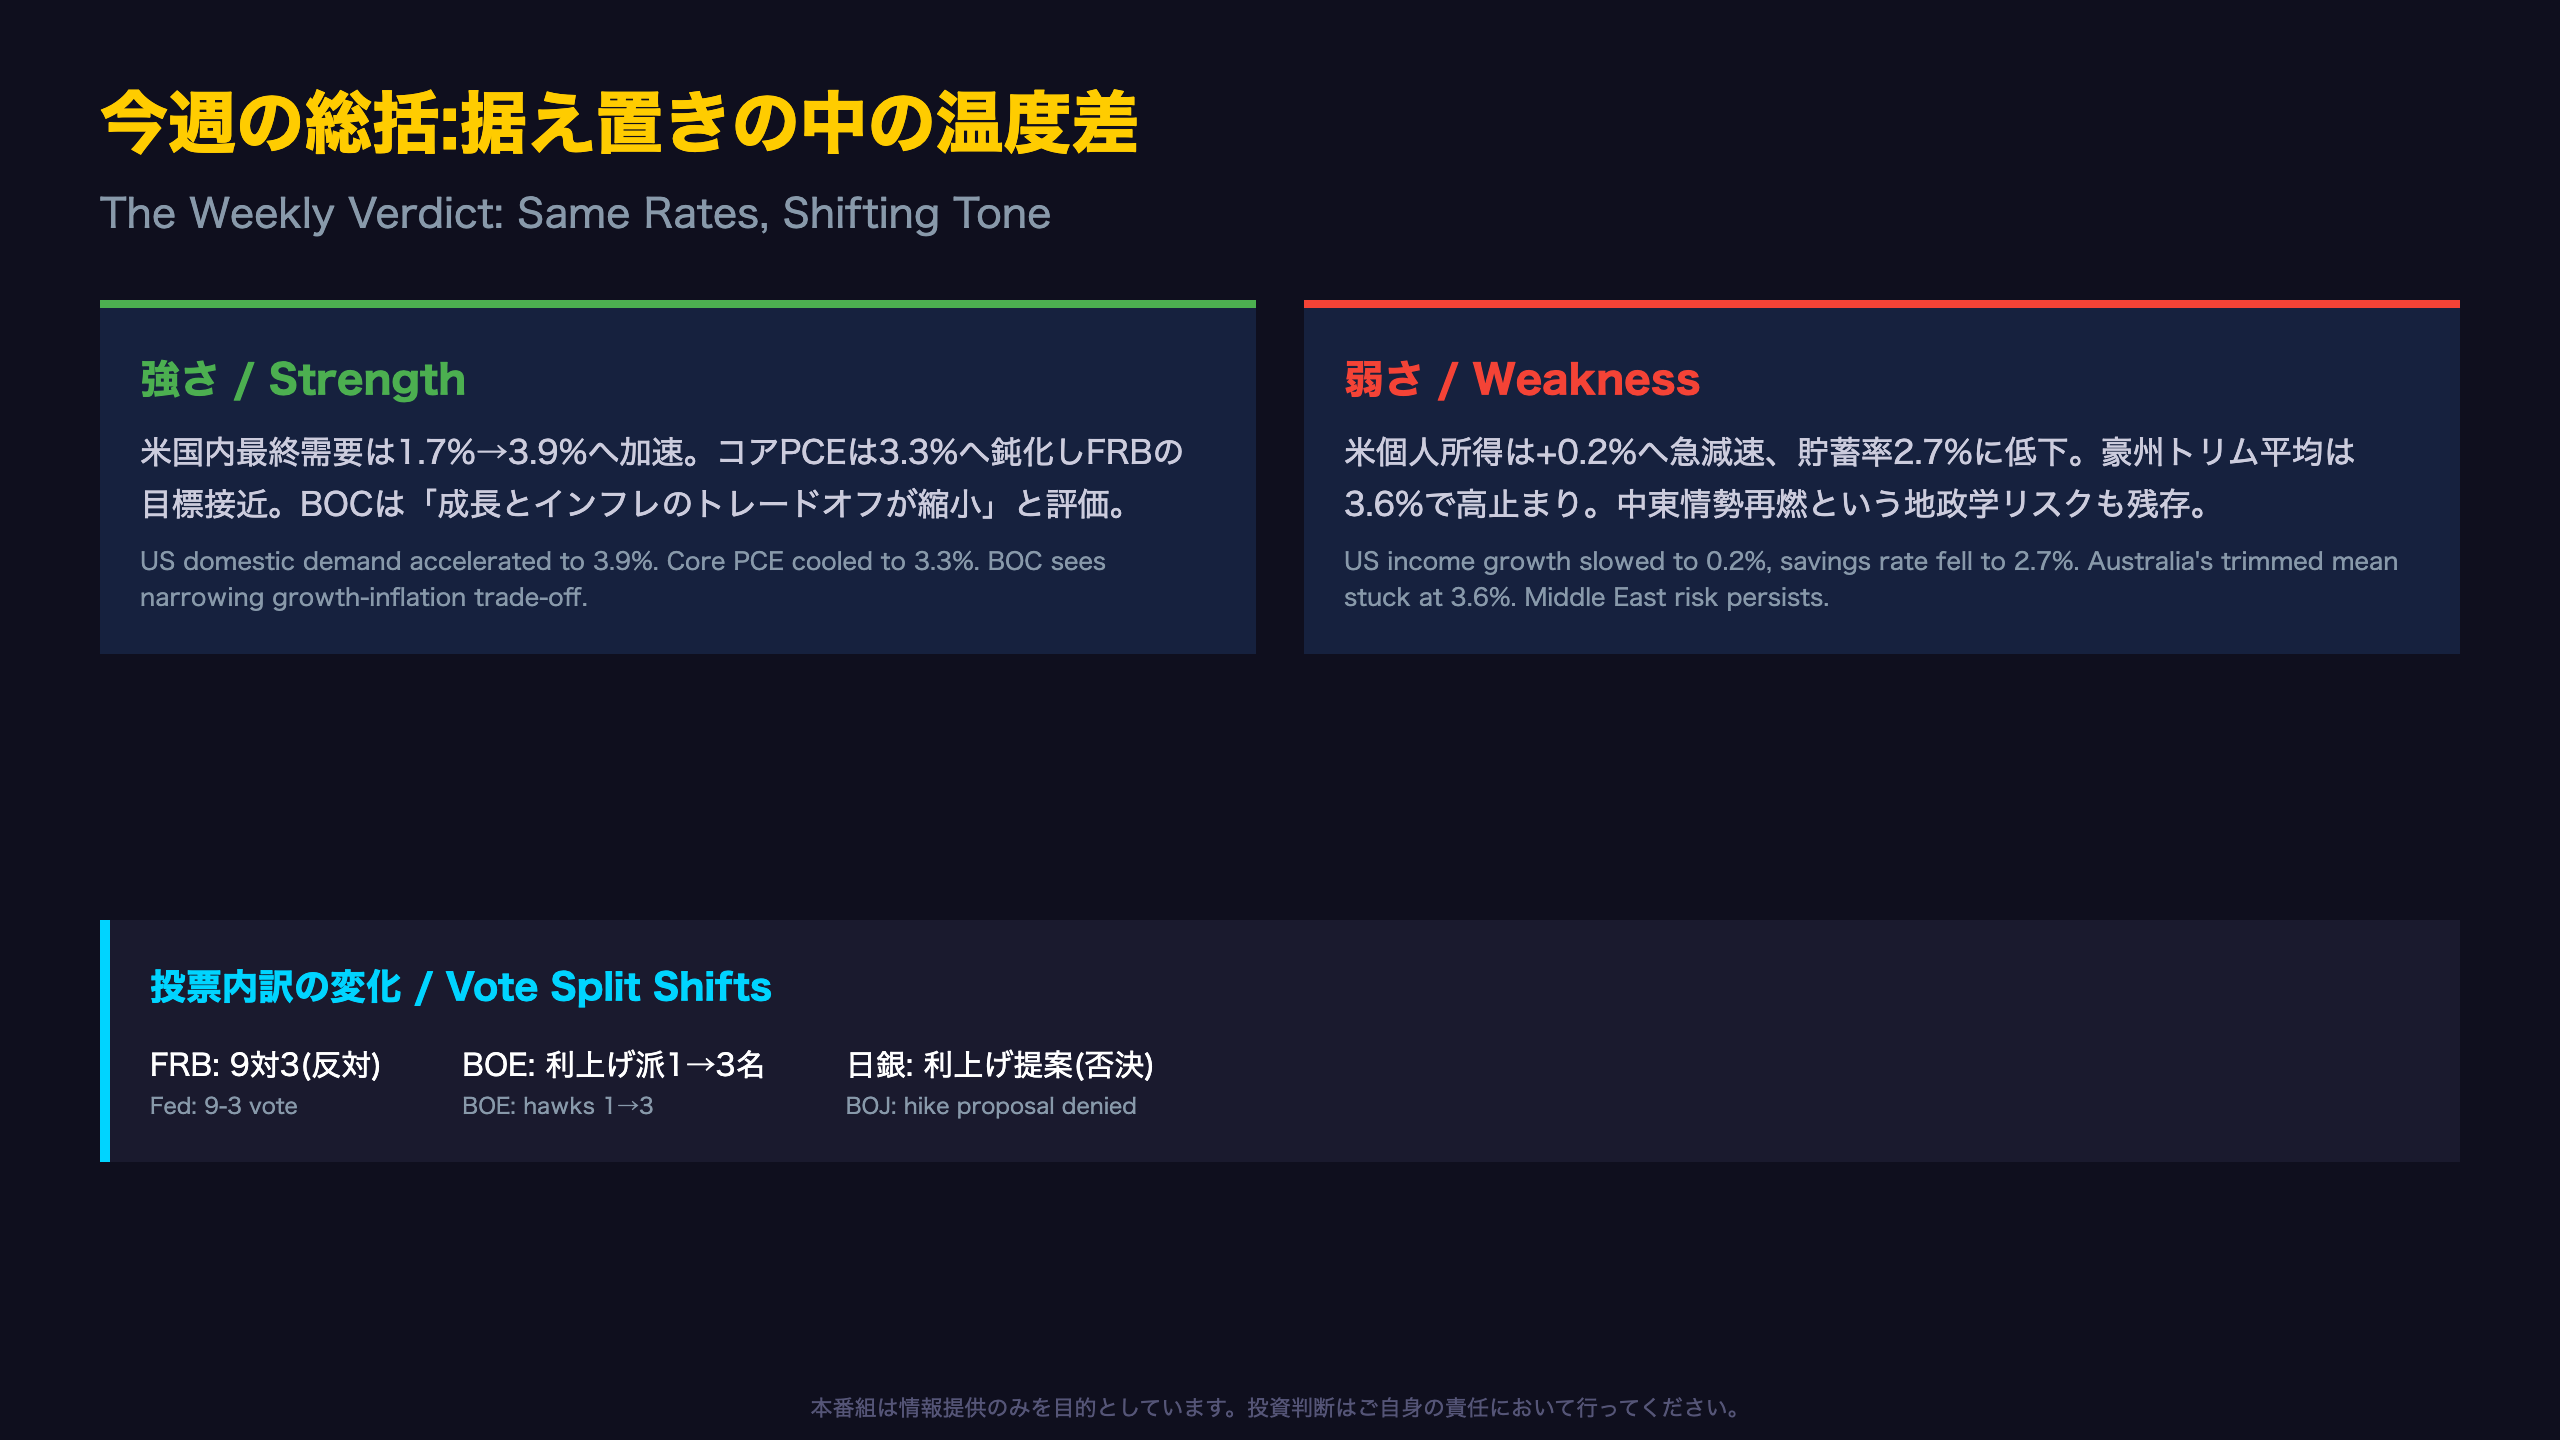
The Fed, BOJ, BOE, and BOC all held policy rates steady this week—but their language and vote splits revealed a quiet hawkish shift.
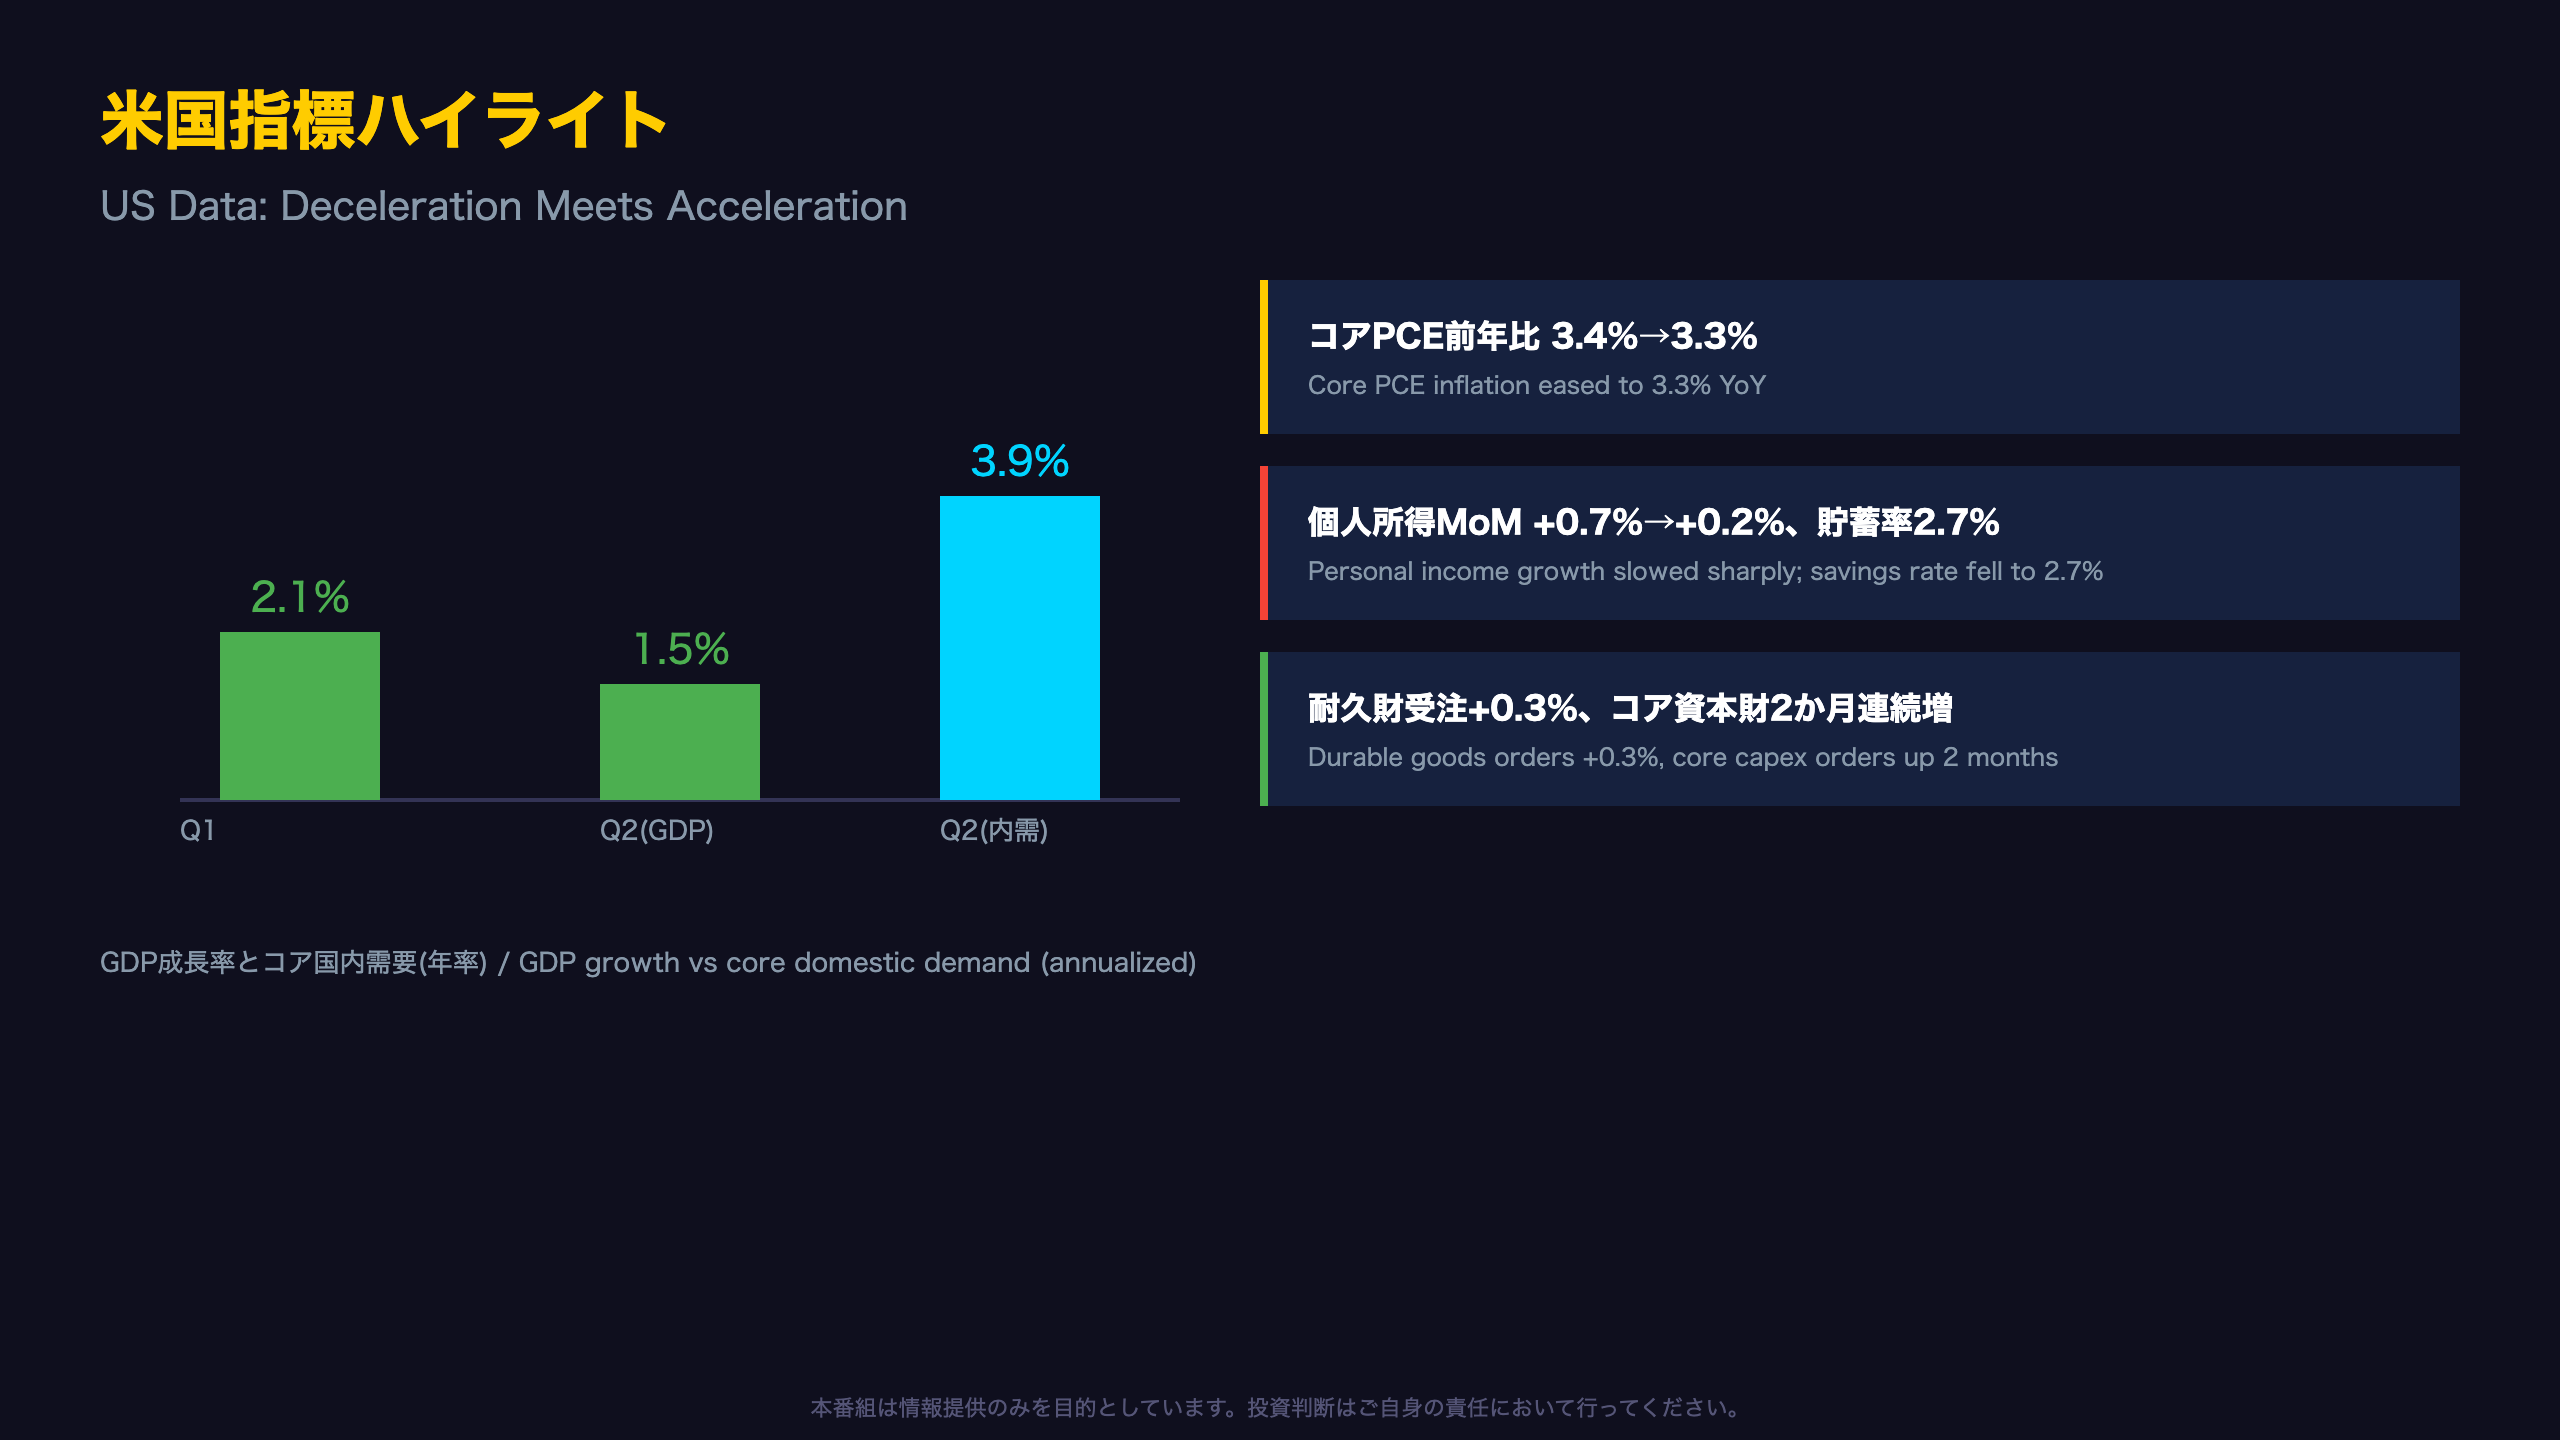
📈 US GDP decelerated to 1.5% annualized, yet domestic final demand accelerated to 3.9%
📉 Eurozone HICP rose to 2.9%, Australian trimmed mean stayed elevated at 3.6%
🏦 BOJ’s Takata proposed a hike (voted down); BOE hawkish dissents rose from 1 to 3
💡 Next week brings the US jobs report, ISM indices, and Japan’s coincident index. Full analysis in the video.
NFC 週間経済レビュー / Weekly Global Macro Digest
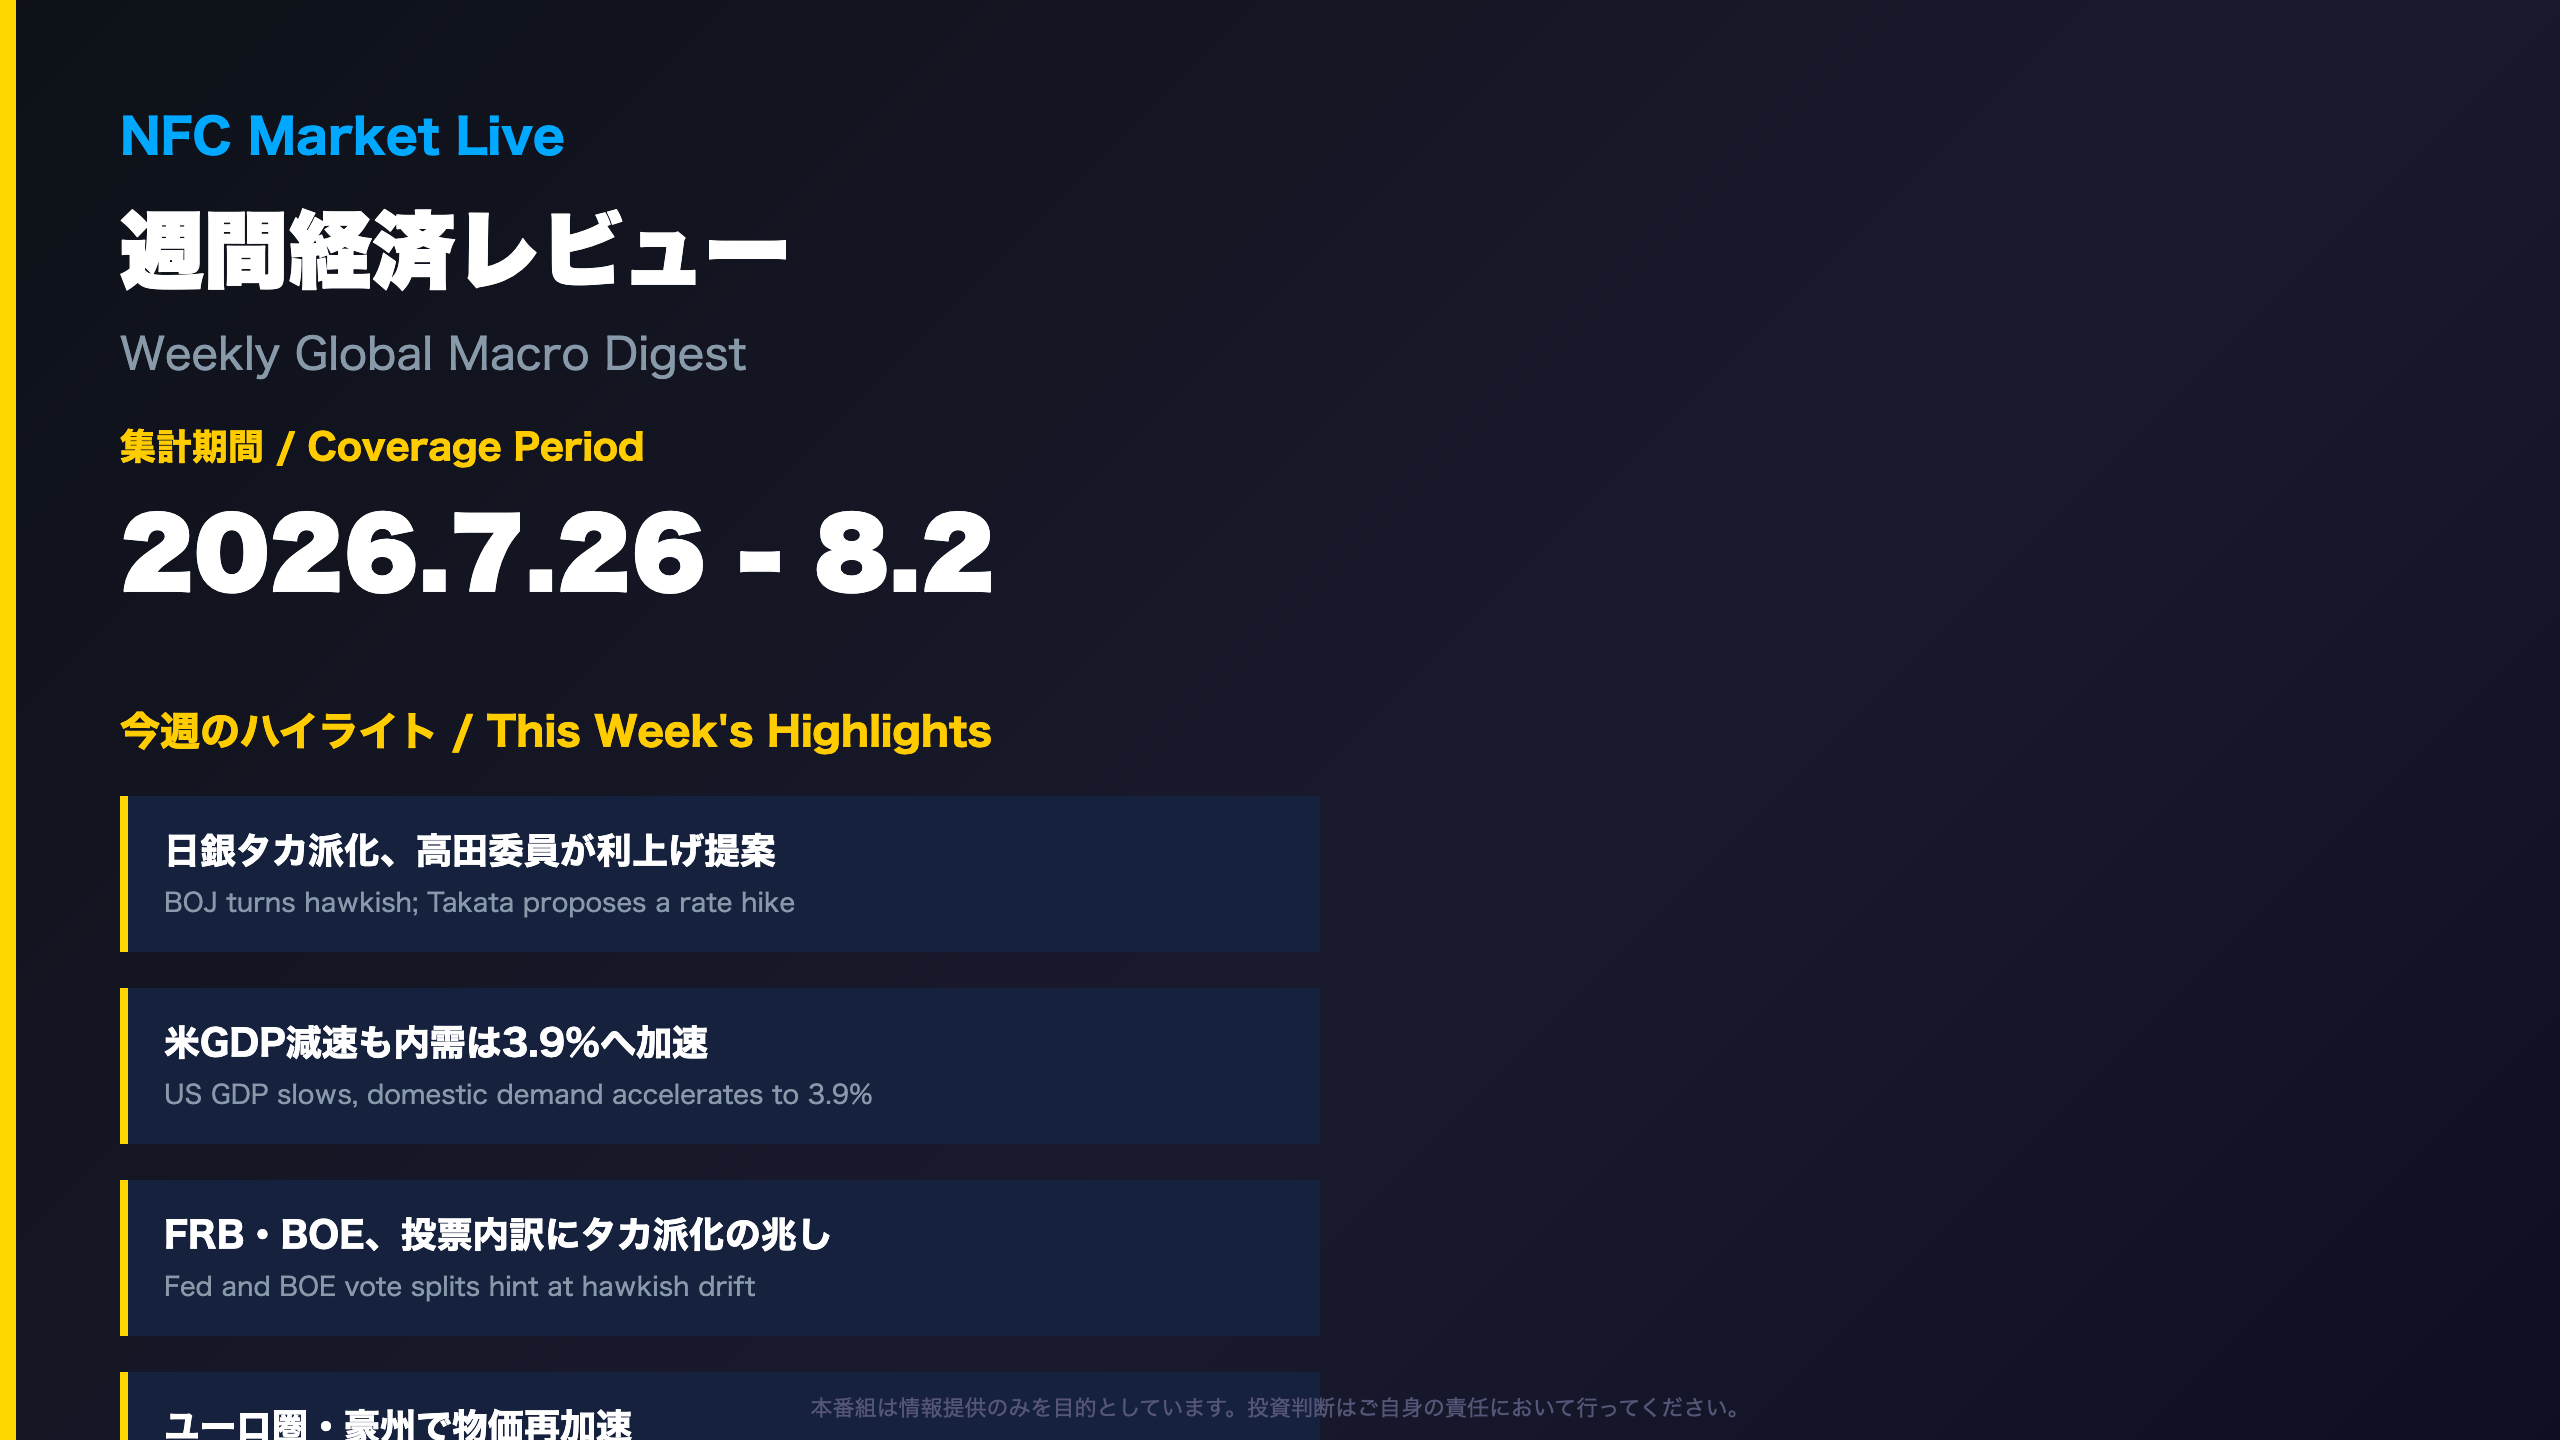
Weekly Global Macro Digest: July 26 – August 2, 2026
This week’s NFC Market Live review covers a dense week of central bank events and economic data releases spanning the US, Japan, Europe, Australia, Canada, and Brazil.
Five major central banks—the Federal Reserve, Bank of Japan, Bank of England, and Bank of Canada, alongside the ECB’s ongoing policy stance—held meetings or published minutes this week. All maintained current rate levels, yet each showed subtle but consistent hawkish shifts in tone, voting patterns, or forward guidance language.
Meanwhile, key macro data emerged: US GDP growth decelerated to 1.5% annualized while core domestic demand accelerated to 3.9%; Eurozone HICP inflation rose to 2.9%; Australian trimmed mean inflation stayed elevated at 3.6%; and Brazil’s IPCA sharply decelerated to 0.16% month-on-month. This episode examines both the resilience and the risks embedded in this week’s global data flow, deliberately avoiding one-sided narratives in either direction.
今週の総括:据え置きの中の温度差 / The Weekly Verdict
This Week’s Surprise: Words, Not Actions
The biggest story this week wasn’t a policy change—it was a shift in language. At the FOMC press conference, new Fed Chair Kevin Warsh remarked that “participants are learning to play the ball, not the referee,” signaling a deliberate retreat from forward guidance. A reporter pointed out the fed funds rate sits roughly 100bp below many Taylor Rule estimates, suggesting markets are independently pricing in tighter conditions than the Fed has explicitly signaled.
“The Committee agreed that the trade-off between growth and inflation had narrowed” — Bank of Canada minutes
Strength vs. Weakness Matrix
| Strength Signals | Weakness Signals |
|---|---|
| US domestic final demand accelerated to 3.9% | US personal income growth slowed to 0.2% |
| Core PCE cooled to 3.3% | Australian trimmed mean inflation stuck at 3.6% |
| BOC cites narrowing policy trade-off | Middle East conflict resurgence |
Neither narrative alone captures this week’s full picture. Under NFC’s regime-diagnostic model (a proprietary hidden Markov model used to classify central bank policy stances), the ECB sits in a “Service Inflation” regime with only 32% confidence, reflecting elevated uncertainty around sticky household and corporate inflation expectations. The Bank of Canada, by contrast, shows the highest confidence (63%) among ten central banks tracked—a reminder that not all central banks are equally “readable” right now. The next FOMC meeting is roughly seven to eight weeks away.
米国指標ハイライト:減速の中の加速 / US Data: Deceleration Meets Acceleration
Two Faces of US GDP
The BEA’s advance estimate put Q2 2026 real GDP growth at 1.5% annualized, down from Q1’s finalized 2.1%. Nominal GDP grew 7.9%, and the roughly 6.4-point gap between nominal and real growth underscores just how much inflation is still distorting the headline figures.
“The contributors to the increase in real GDP in the second quarter were increases in consumer spending, investment, and exports that were partly offset by a decrease in government spending.”
Why “Real Final Sales to Domestic Purchasers” Matters
Headline GDP includes volatile components like inventories and net exports that can distort quarter-to-quarter readings. Real final sales to private domestic purchasers strips these out, capturing the “sticky” core of consumption and investment demand. This measure jumped from a downward-revised 1.7% in Q1 to 3.9% in Q2—a sharp single-quarter acceleration that will be confirmed (or revised) in the second estimate due August 26.
The Income-Inflation Disconnect
While core PCE inflation eased slightly from 3.4% to 3.3%, personal income growth collapsed from 0.7% to just 0.2% month-on-month, and the savings rate slipped from 3.0% to 2.7%. The BEA attributed June’s drop in farm income to “payment patterns under the 2025 American Relief Act,” suggesting a possible rebound ahead if this proves temporary. Bulls point to the improvement in real disposable income (0.2% to 0.3%) as evidence of consumer resilience; bears note that savings-drawdown-driven spending has natural limits. The next data point—July’s release on August 26—will be key to resolving this tension. For international readers: the PCE index is the Fed’s preferred inflation gauge, distinct from the more widely quoted CPI used by many other central banks.
グローバル物価ハイライト:濃淡分かれるインフレ / Global Inflation: A Divergent Picture
Energy Is Whipsawing Headline Inflation
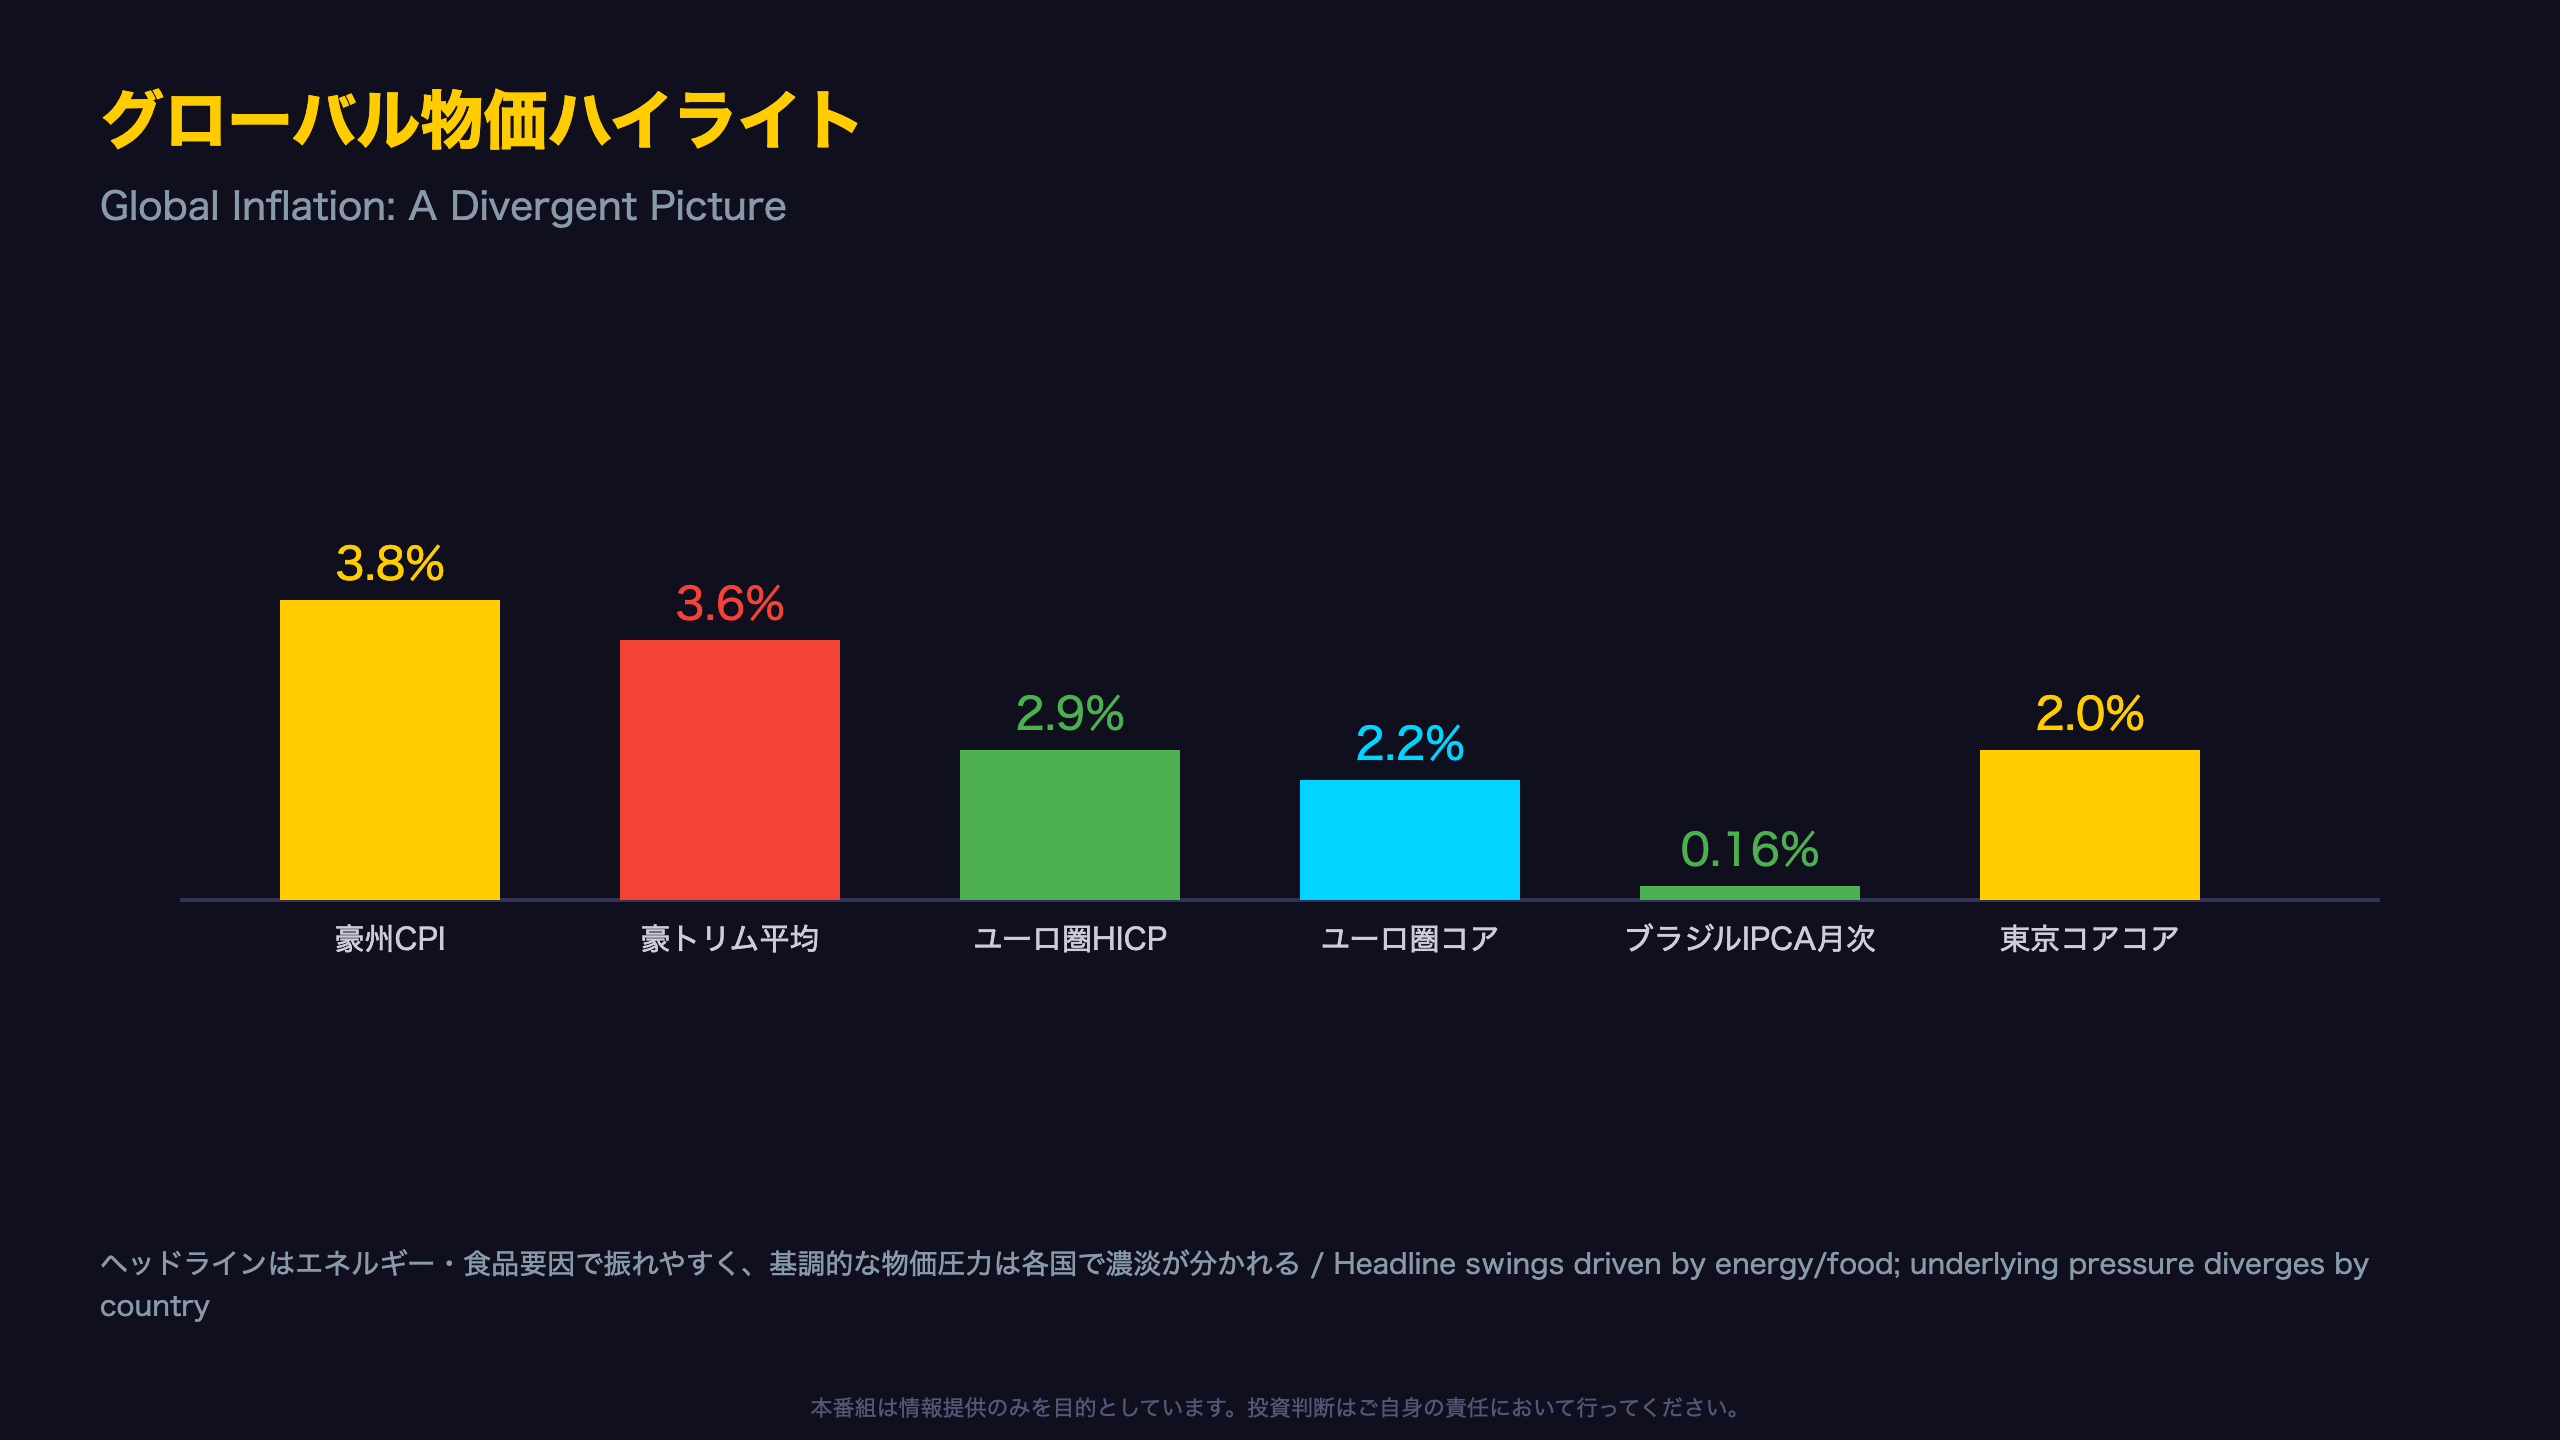
Eurostat’s flash estimate showed Eurozone headline HICP accelerating from 2.8% to 2.9%, driven almost entirely by energy prices surging from 8.5% to 10.0% year-on-year. The release states: “energy (10.0%, compared with 8.5% in June).” Core inflation—excluding energy, food, alcohol and tobacco—held flat at 2.2%, suggesting the reacceleration is a base-effect and energy-driven phenomenon rather than broad-based price pressure.
Table: Global Inflation Snapshot
| Region | Metric | Value | vs. Prior |
|---|---|---|---|
| Australia | Headline CPI | 3.8% | Eased from prior month |
| Australia | Trimmed mean | 3.6% | Unchanged, still elevated |
| Eurozone | Headline HICP | 2.9% | Up from 2.8% |
| Eurozone | Core HICP | 2.2% | Flat |
| Brazil | IPCA (monthly) | 0.16% | Sharply down from 0.58% |
| Tokyo | Core-core CPI | 2.0% | Up from 1.7% |
Is Brazil’s Deceleration Temporary?
Brazil’s IPCA decelerated for four straight months, from a 2026 peak of 0.88% in March to just 0.16% in June, driven mainly by a reversal in food prices. Core inflation fell in lockstep from 0.64% to 0.11%. Notably, the central bank’s (Banco Central do Brasil, or BCB) Focus survey—an official weekly market consensus tracker used directly by policymakers—showed Selic rate expectations unchanged for five straight weeks, suggesting markets may view this deceleration as temporary rather than structural. For context, Australia’s “trimmed mean” is a core inflation measure similar to the US’s trimmed-mean PCE, designed to filter out volatile outliers.
中央銀行政策スタンスの現在地 / Central Bank Policy Stances
Comparing Five Central Banks’ “Holds”
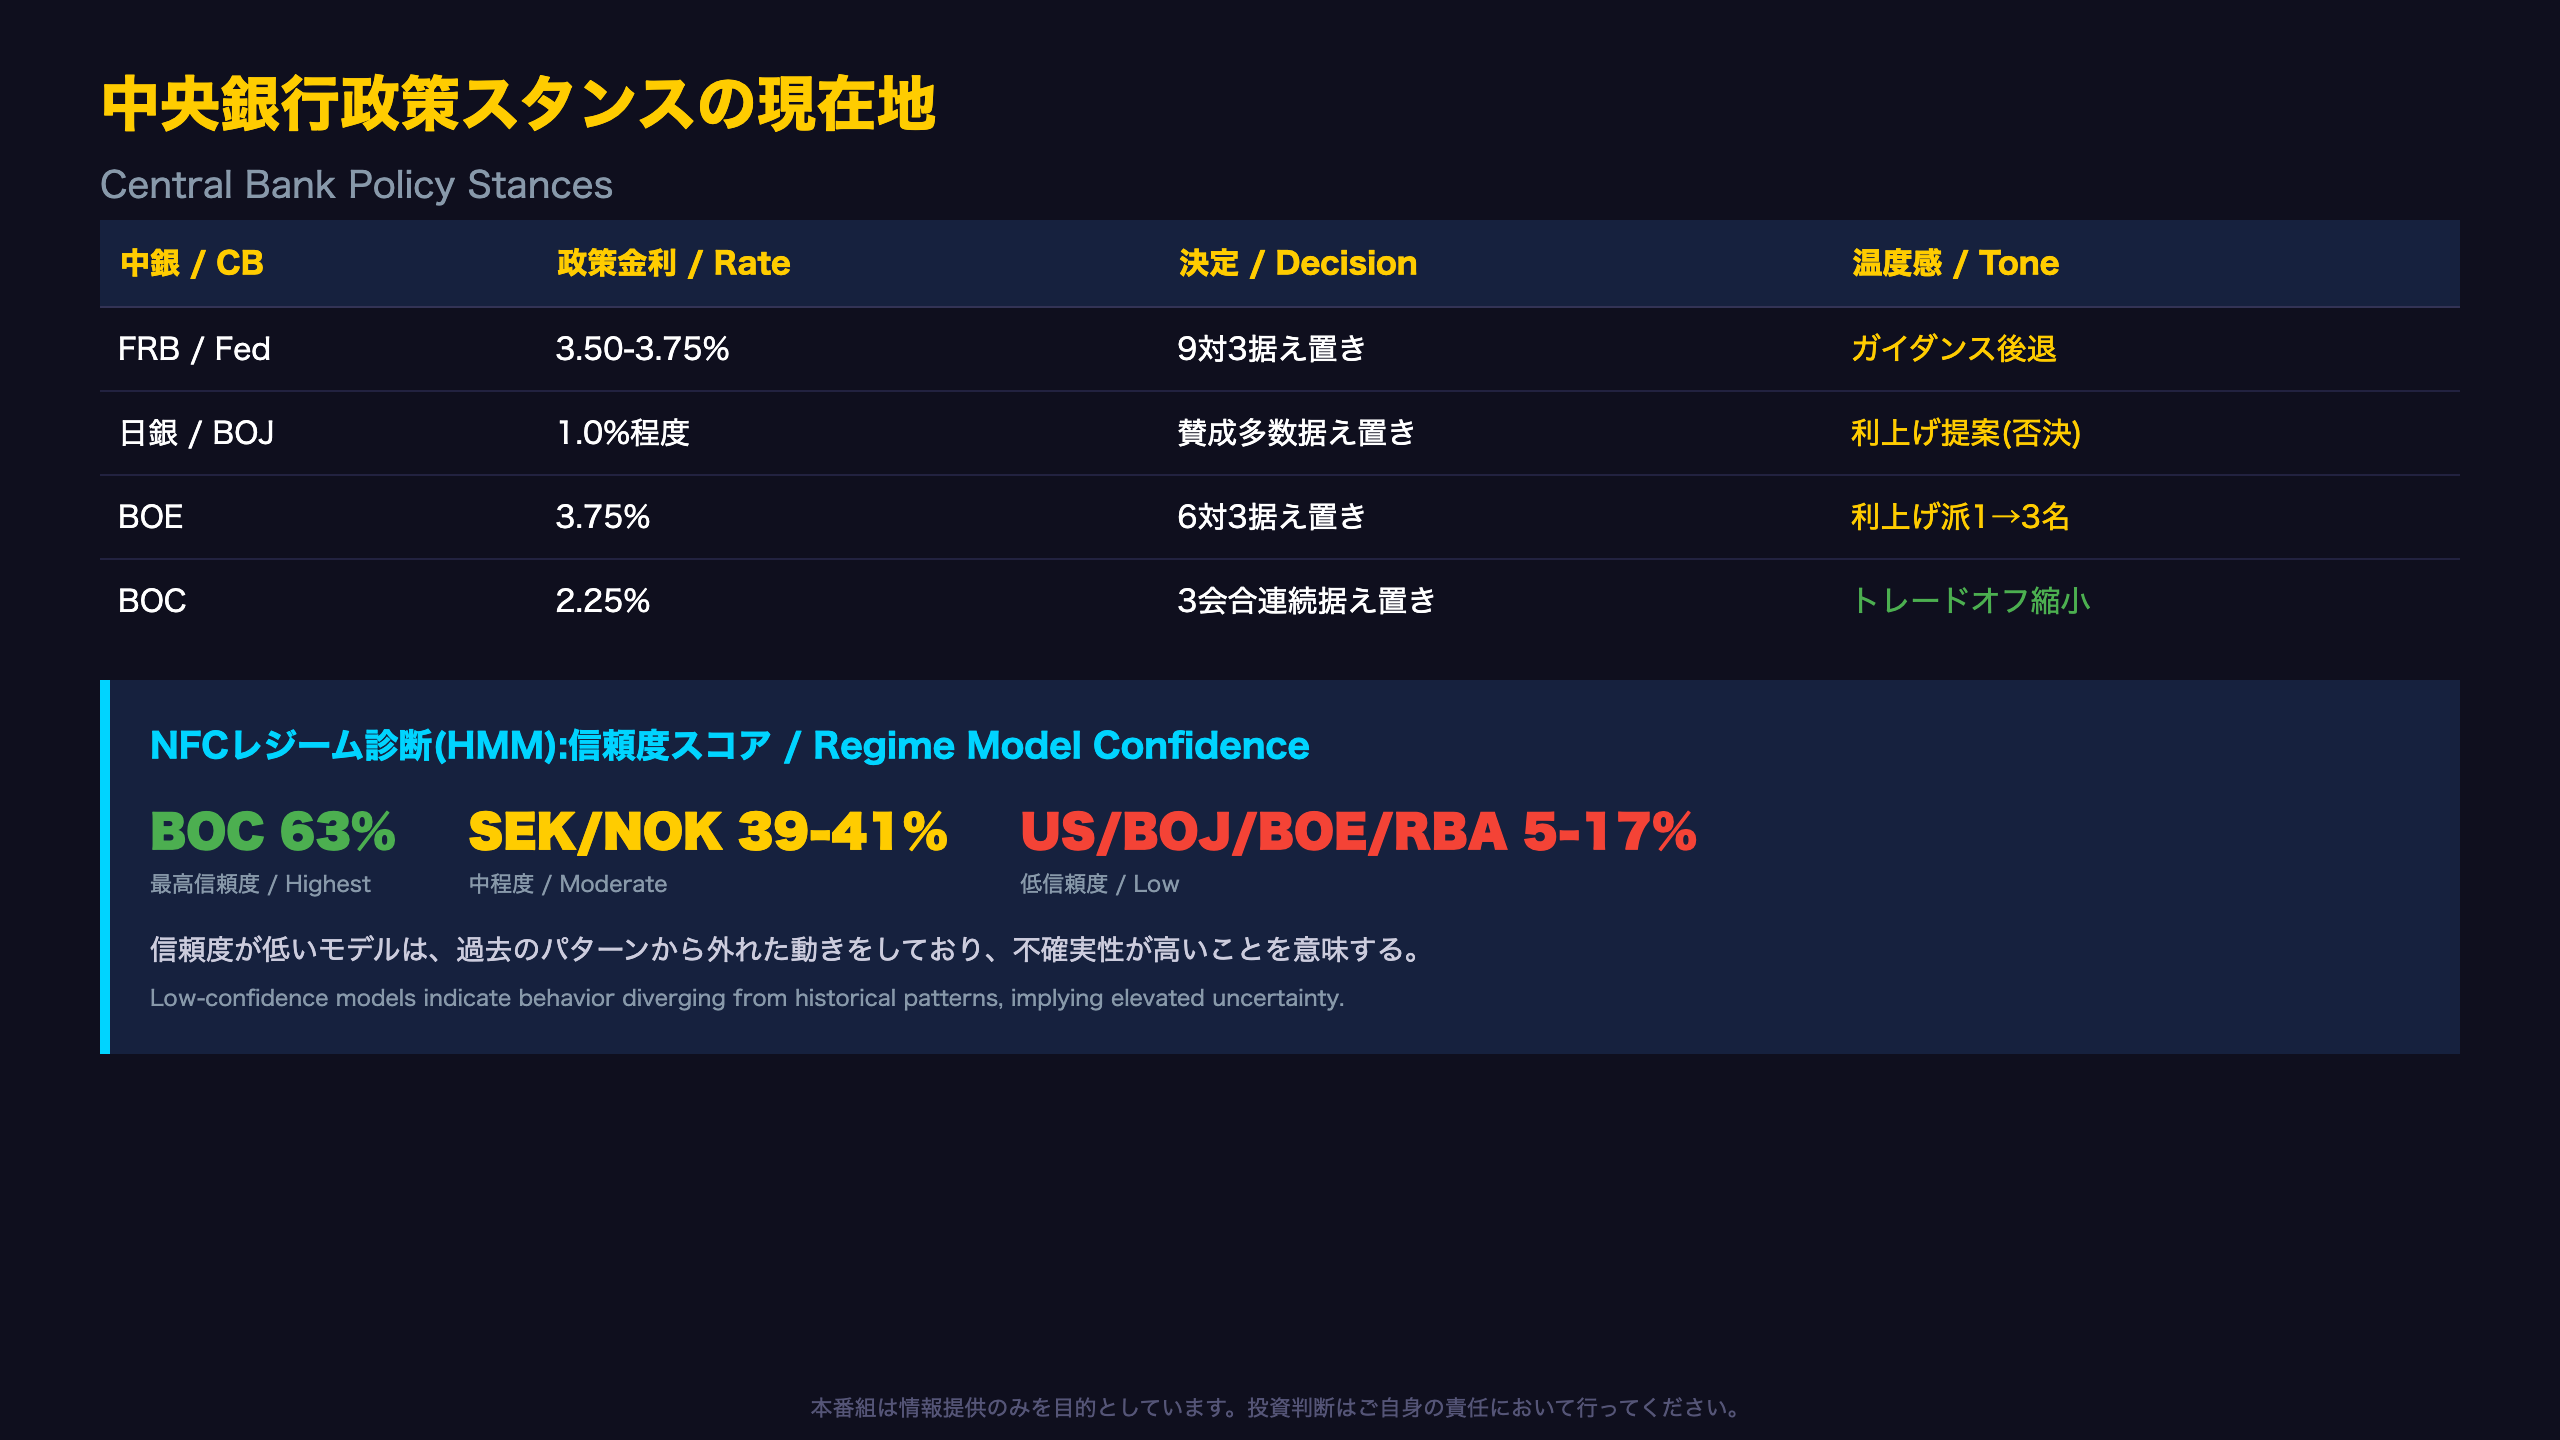
| Central Bank | Policy Rate | Decision | Tone |
|---|---|---|---|
| Federal Reserve | 3.50-3.75% | Held, 9-3 vote | Retreating from forward guidance |
| Bank of Japan | ~1.0% | Held, majority vote | Takata’s hike proposal voted down |
| Bank of England | 3.75% | Held, 6-3 vote | Hawkish dissents rose from 1 to 3 |
| Bank of Canada | 2.25% | Held for 3rd meeting | Cites narrowing growth-inflation trade-off |
The Fed’s “Play the Ball, Not the Referee” Strategy
At the press conference, Fed Chair Kevin Warsh said “participants are learning to play the ball, not the referee,” describing a deliberate shift where markets react to real economic data rather than parsing Fed rhetoric—which he called “a change for the better.” Reporters pushed back, questioning whether this approach gives markets enough forward visibility.
BOJ’s Hawkish Tone and Outlook Report
The Bank of Japan’s quarterly Outlook Report (a comprehensive policy and forecast document published four times a year) revised down its FY2026 core CPI forecast (excluding fresh food) from +2.8% to +2.5%. However, the core-core measure (excluding both fresh food and energy) was revised by only 0.1 point, suggesting the underlying inflation trend remains largely intact—the downgrade reflects temporary government energy subsidies, not weakening demand. Governor Ueda explicitly stated the BOJ would avoid “falling behind the curve,” and for the first time named AI-related demand and yen depreciation as explicit upside inflation risks alongside Middle East tensions.
What the Regime Model Reveals About “Readability”
Under NFC’s proprietary hidden Markov model (HMM) regime-diagnostic framework—which classifies each central bank’s policy stance based on historical data patterns—the Bank of Canada shows the highest confidence level (63%) among ten models tracked. Sweden’s Riksbank and Norway’s Norges Bank show moderate confidence, while the US, BOJ, BOE, RBA, RBNZ, and Mexico’s Banxico all register low confidence, meaning their current behavior sits unusually far from historical regime centroids. This divergence suggests either genuine regime shifts underway or elevated policy unpredictability across much of the developed and emerging market central bank landscape.
今週の番組制作費 / Production Cost Corner
Behind the Scenes: Fully AI-Generated Production
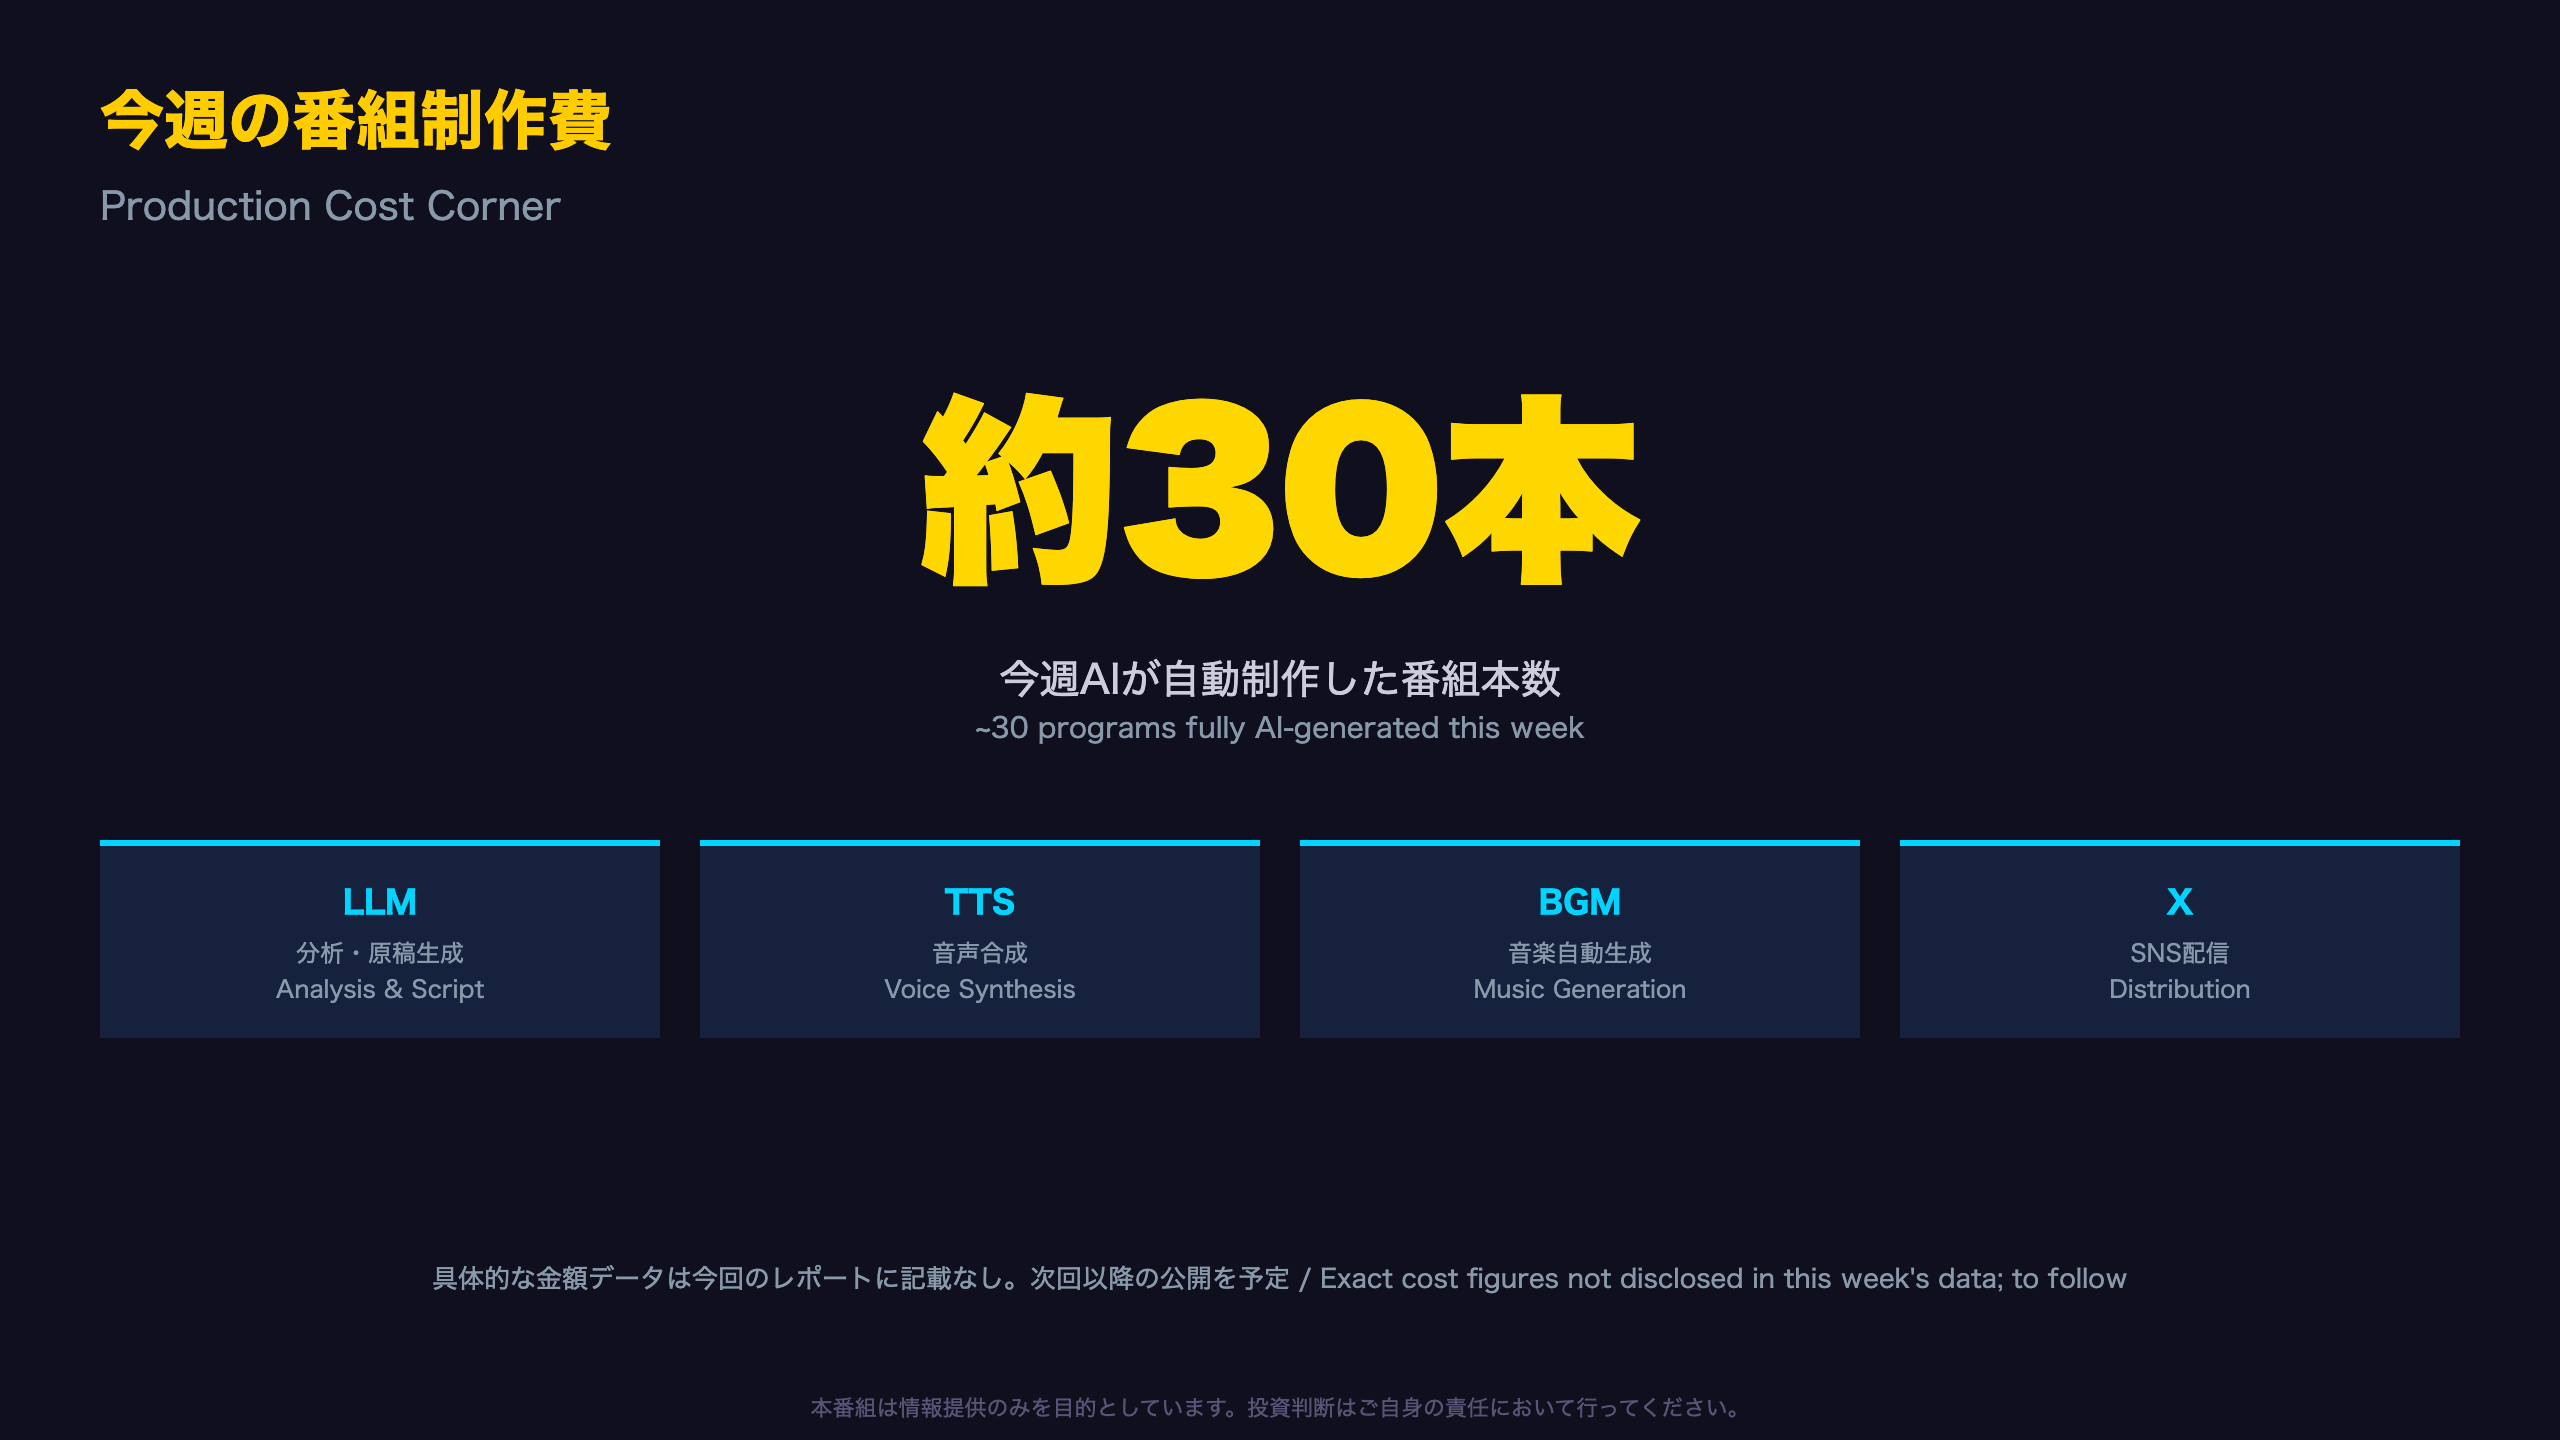
NFC Market Live’s programs are produced through an end-to-end AI pipeline: source documents from statistical agencies, corporate filings, and central bank publications are parsed and analyzed by a large language model (LLM), converted into narration via text-to-speech (TTS) synthesis, paired with AI-generated background music, and packaged into social media assets—all without manual scriptwriting.
This Week’s Output Volume
Based on the data available, NFC Quant Desk generated approximately 30 distinct reports during the week of July 26 to August 2, 2026. This included roughly 6 central-bank-focused episodes (BOJ Outlook Report and press conference, FOMC press conference, BOE minutes and Monetary Policy Report, BOC minutes), 5 corporate earnings episodes (UPS, Visa, Microsoft, Amazon, Apple), around 15 macro data episodes (GDP, CPI, employment, durable goods, personal income, and more), and several additional market-focused reports.
On Cost Transparency
Production costs are typically broken down into four categories: LLM inference costs, TTS (text-to-speech) synthesis costs, BGM (background music) generation costs, and social media (X/Twitter) distribution costs. However, this week’s source data pack did not include specific dollar or yen figures for these categories. In line with strict no-fabrication policies, we are withholding numerical estimates and plan to disclose exact costs in a future update once verified figures are available.
Why Disclose This At All?
The fully automated production model itself represents an experiment in the cost structure of financial media. By continuing to disclose program volume and the production pipeline transparently, we aim to help viewers understand exactly how this content is generated—an increasingly relevant question as AI-generated financial media becomes more common globally.
来週の注目イベントカレンダー / Next Week’s Calendar
Confirmed Events for Next Week (Aug 3-7)
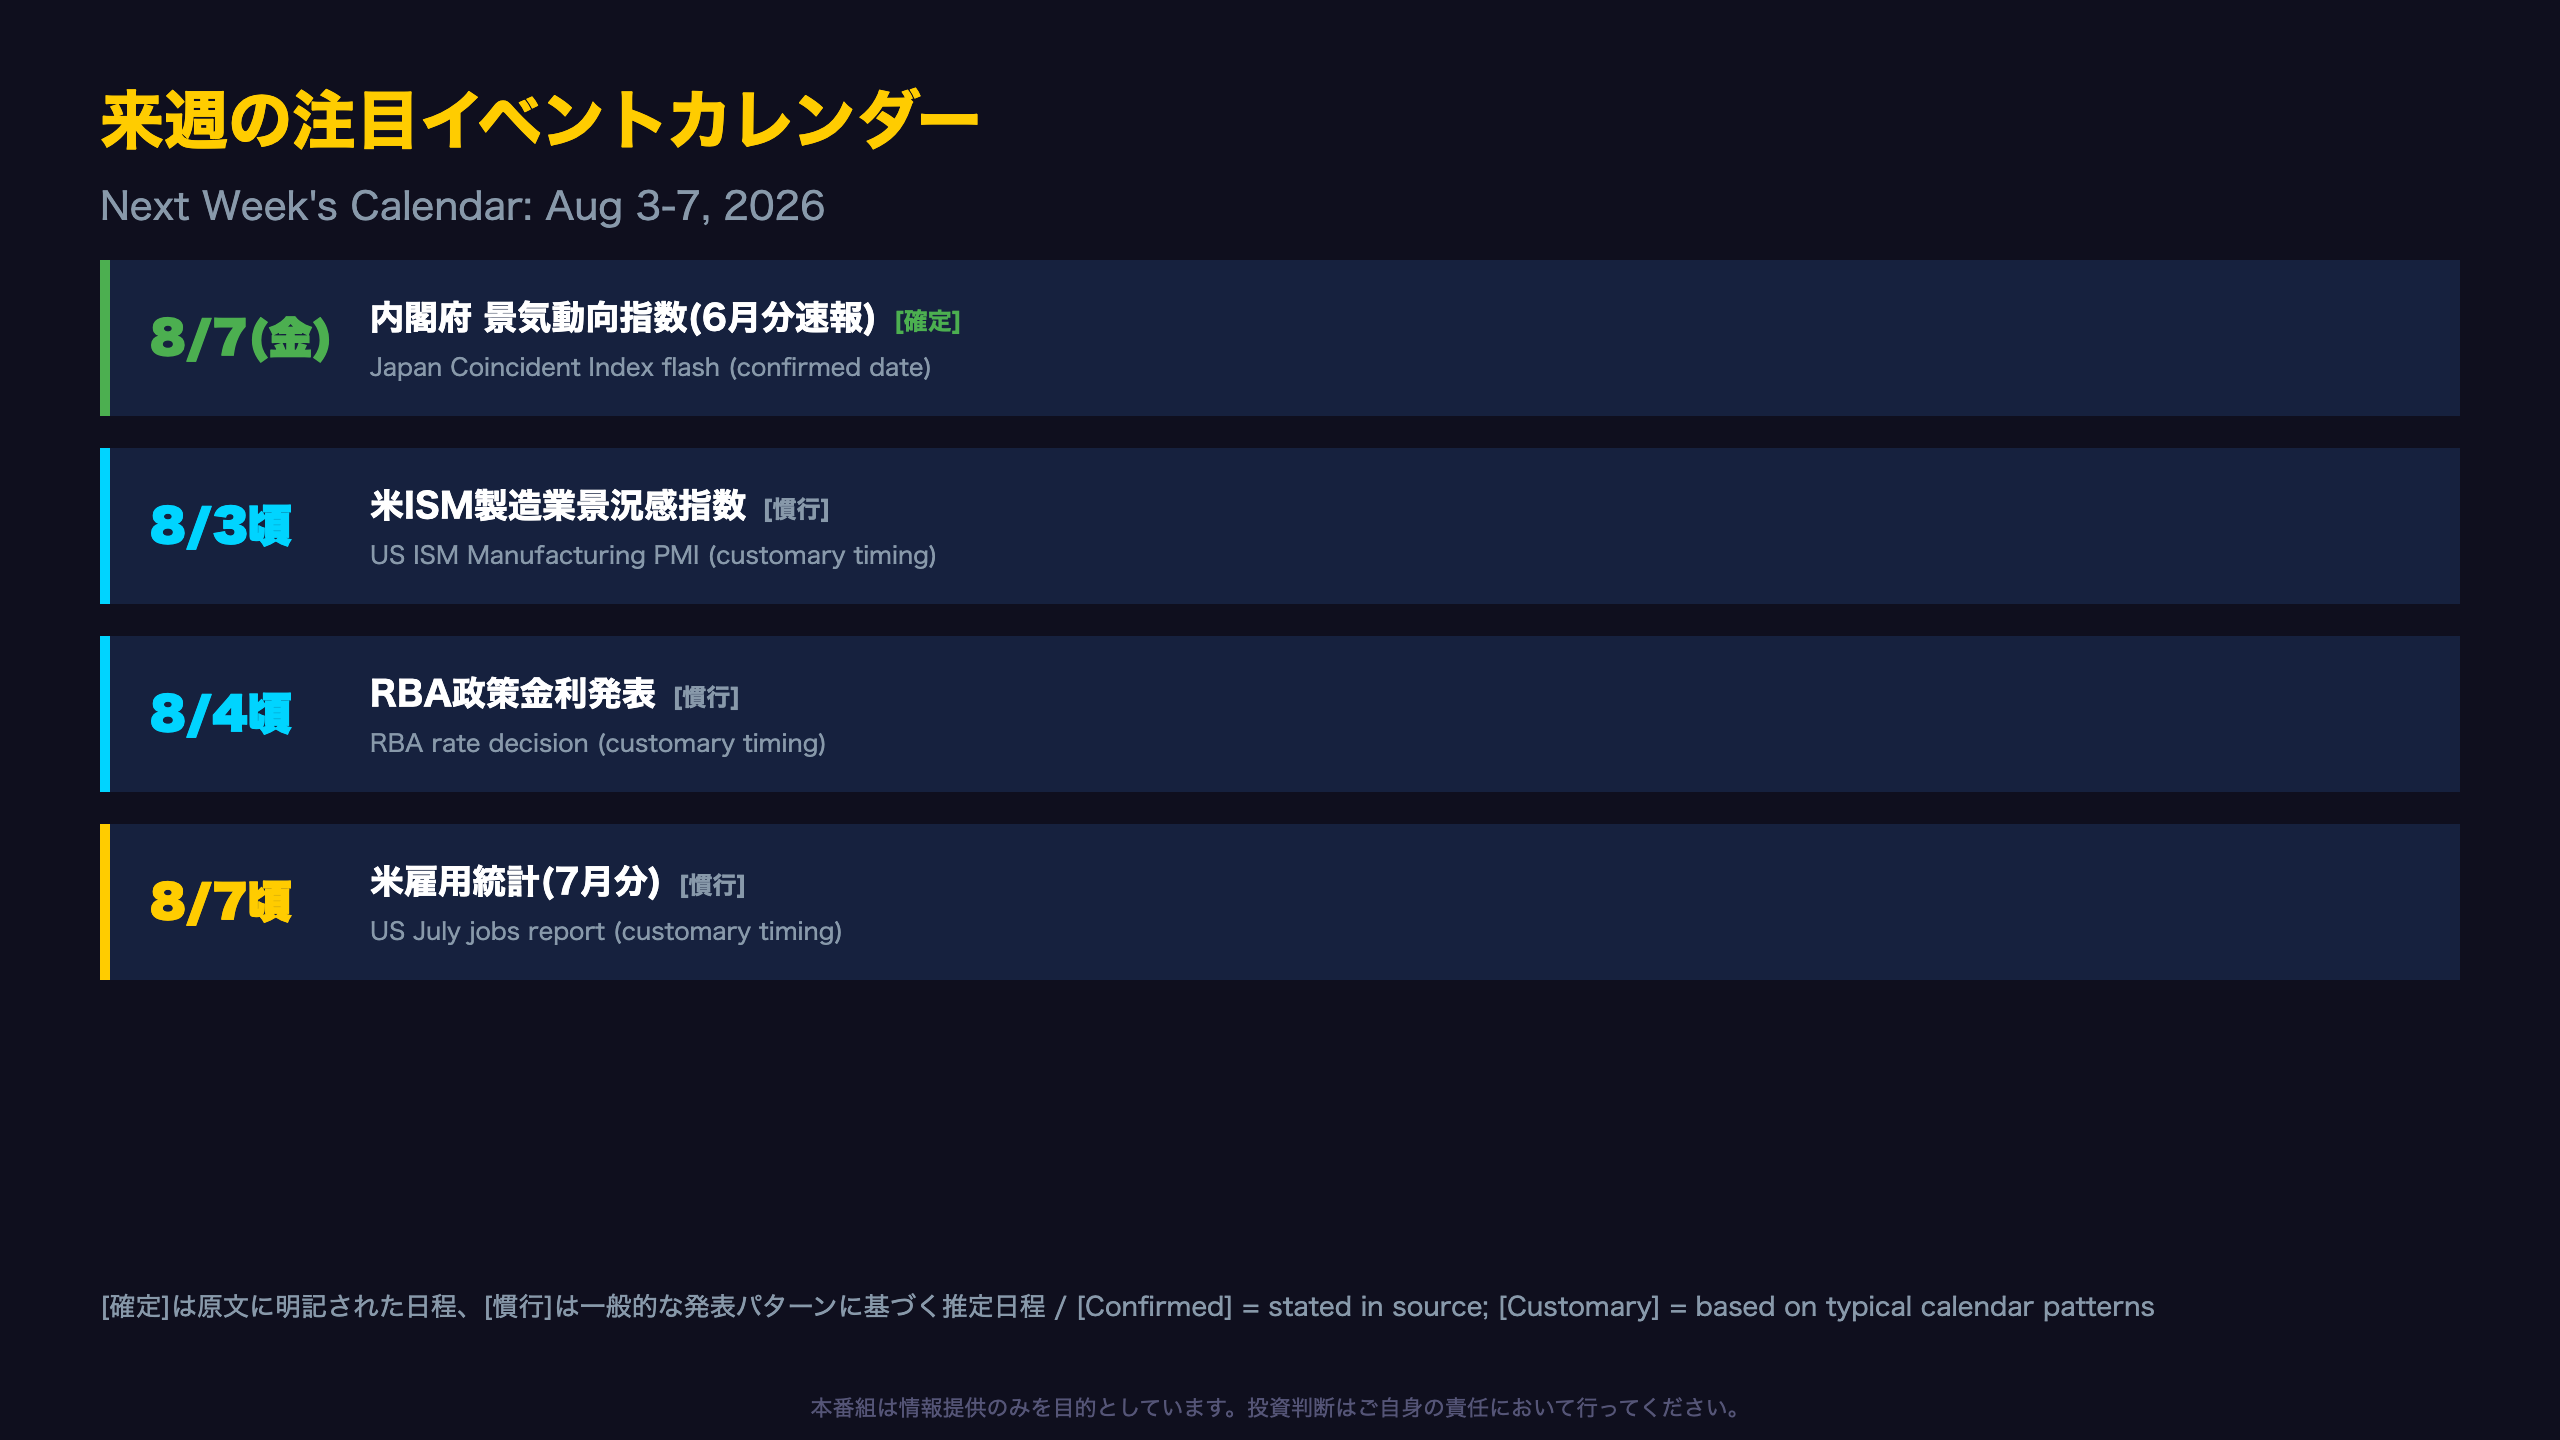
The only next-week event explicitly confirmed in this week’s source data is:
“The June 2026 flash estimate is scheduled for release on August 7, 2026” — Japan Cabinet Office Coincident Index report
This follows a notable across-the-board downward revision in the May confirmed data (production, shipments, inventory, and inventory ratio all revised lower), making the June flash reading an important test of whether that weakness persists.
Generally Expected Events
The following are typical month-start release patterns based on standard publication calendars; exact dates should be confirmed against each institution’s official schedule.
- US ISM Manufacturing PMI (customarily released on the first business day of the month)
- US ISM Services PMI
- US Jobs Report for July (customarily released the first Friday of the month)
- Reserve Bank of Australia (RBA) policy rate decision (customarily the first Tuesday of the month)
Connecting to This Week’s Data
On the jobs report: this week’s weekly macro review noted that the 4-week moving average of initial jobless claims, at 202,750, sits near the low end of its past-year range. Chain of reasoning: low and stable jobless claims generally signal labor market resilience → if next week’s jobs report confirms this trend numerically → it could reinforce the Fed’s case for continuing to hold rates, though a single data point cannot confirm this on its own.
On Australia: given this week’s data showed trimmed-mean inflation (the RBA’s preferred core measure, similar to the Fed’s core PCE) stuck at an elevated 3.6%, there is little data-driven basis for the RBA to lean toward a rate cut at its upcoming meeting.
Disclaimer: This article is for informational purposes only. All investment decisions are made solely at your own risk.