This article was automatically generated by the NFC Market Live AI analysis system. (Updated: 2026-07-31 22:11 JST)
📄 Primary Source
Statistics Canada
https://www150.statcan.gc.ca/n1/daily-quotidien/260731/dq260731a-eng.htm
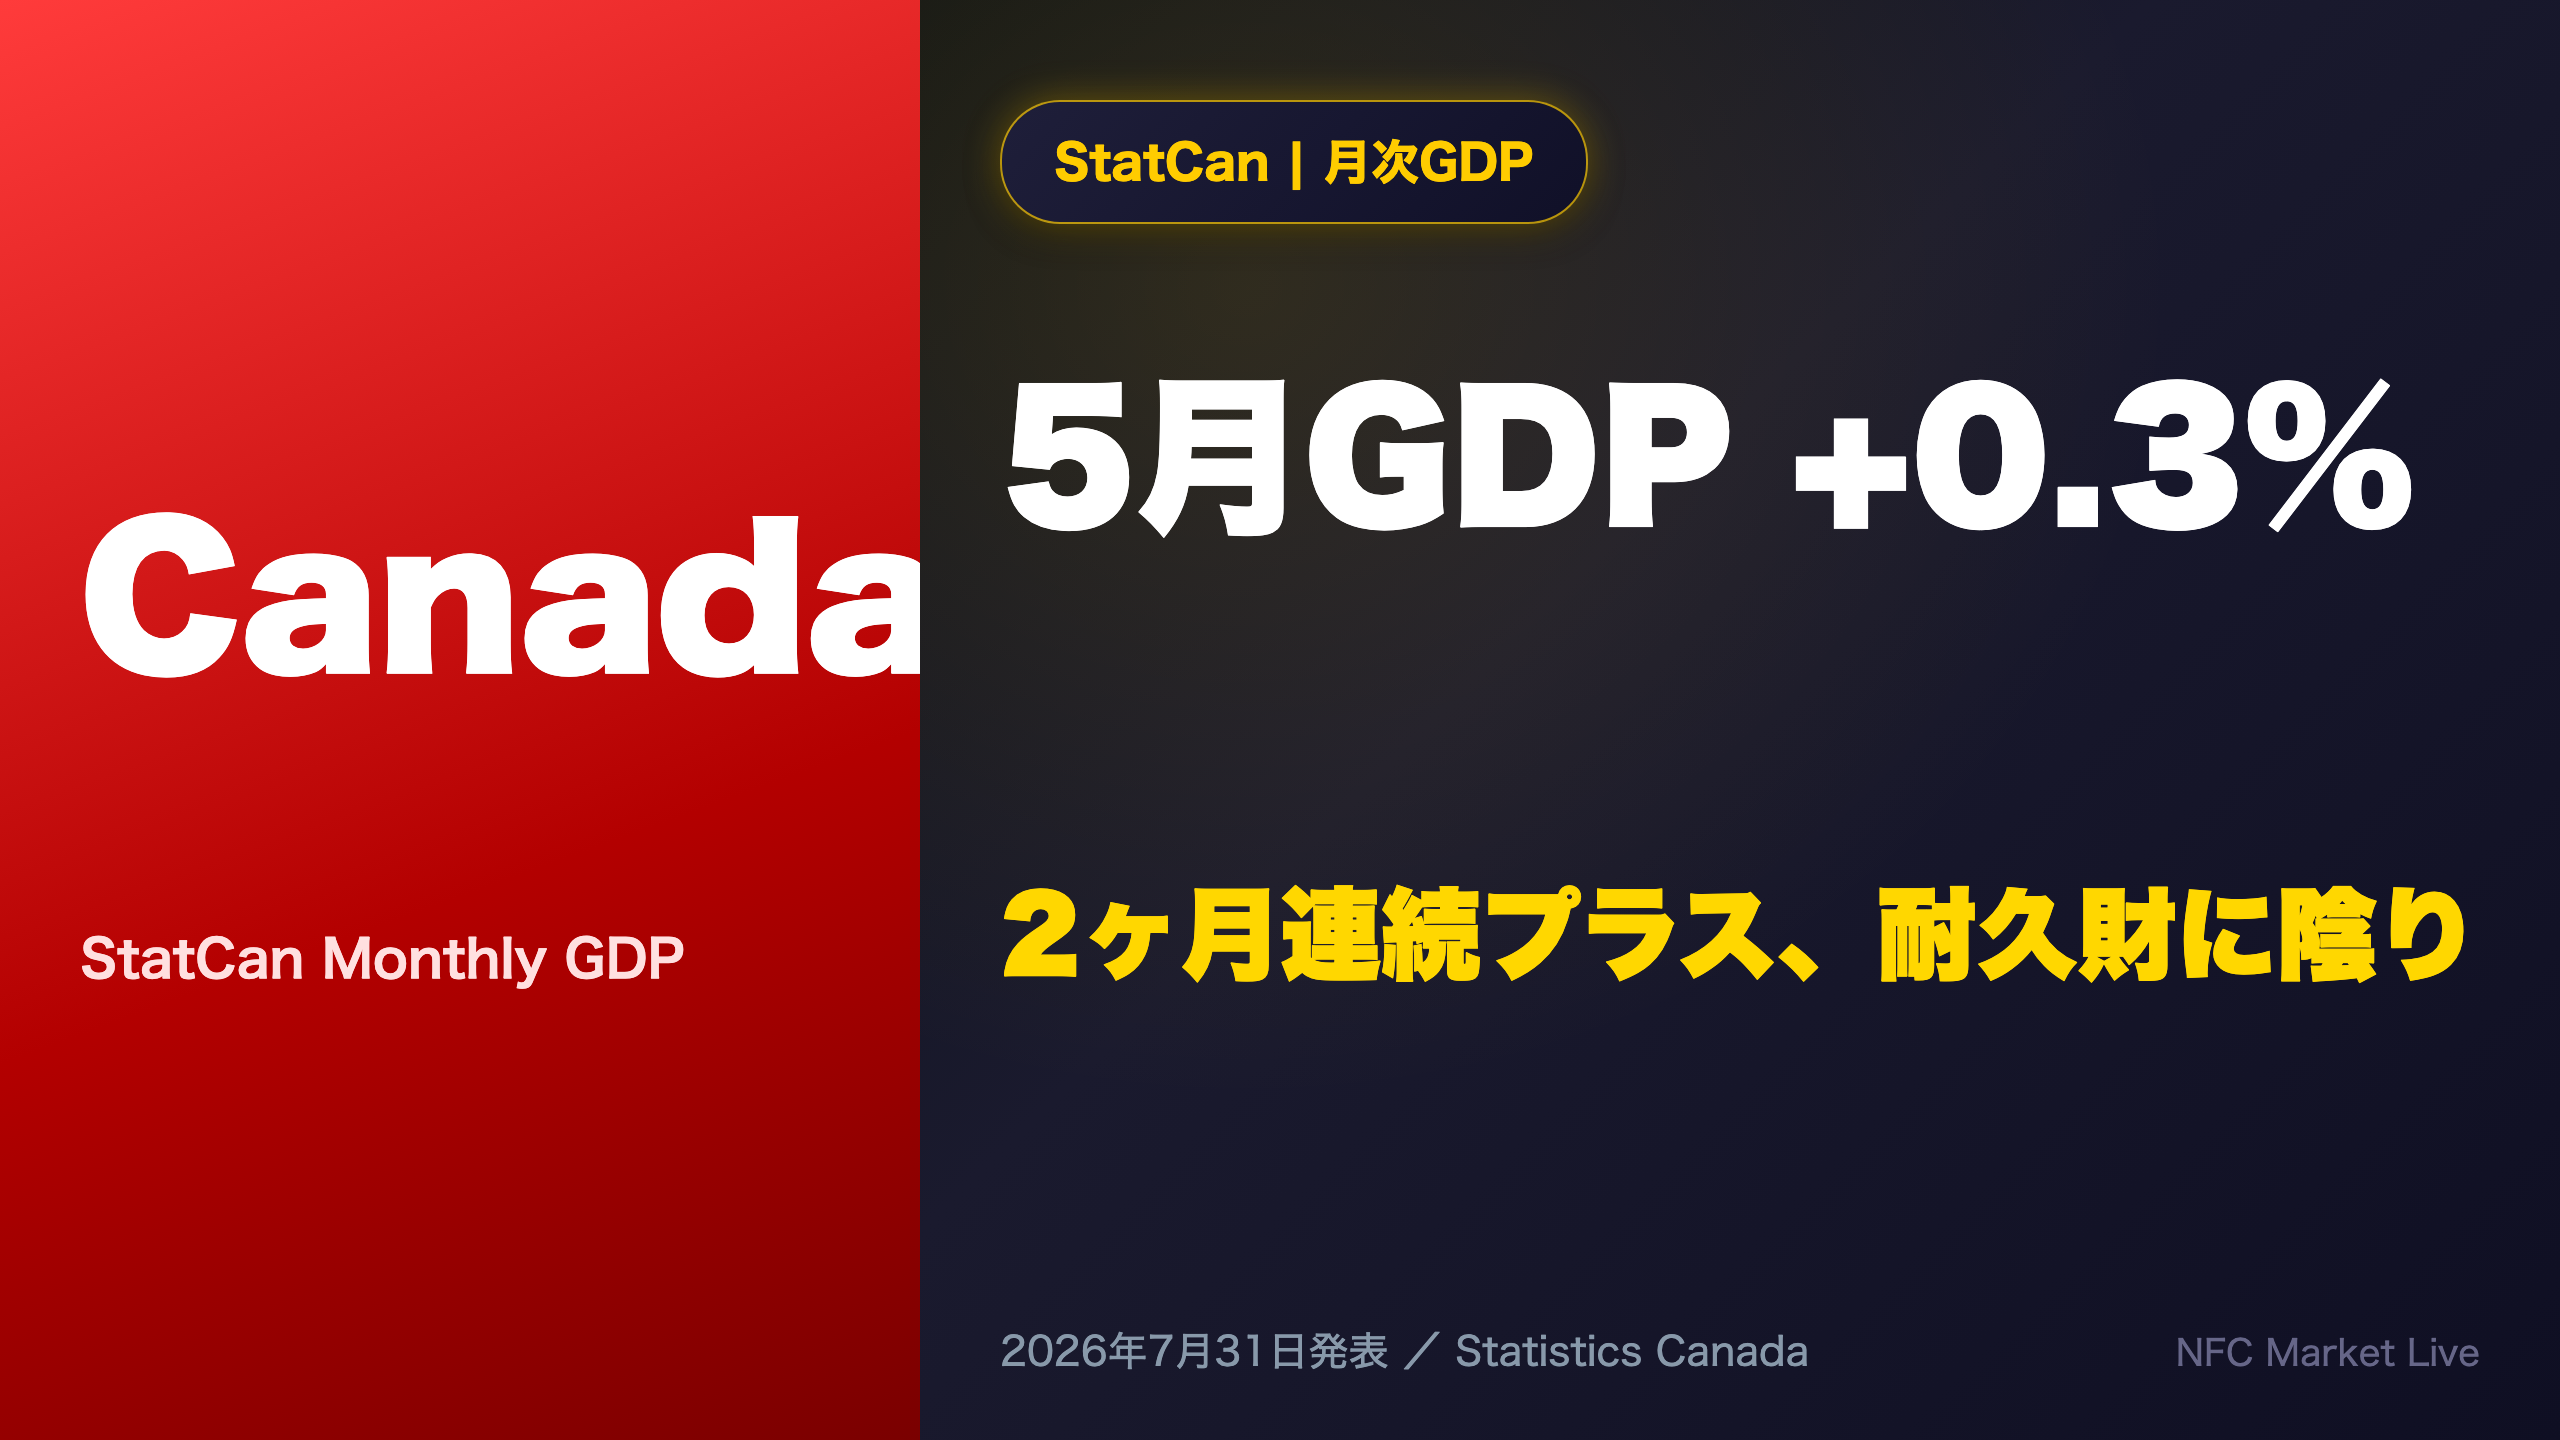
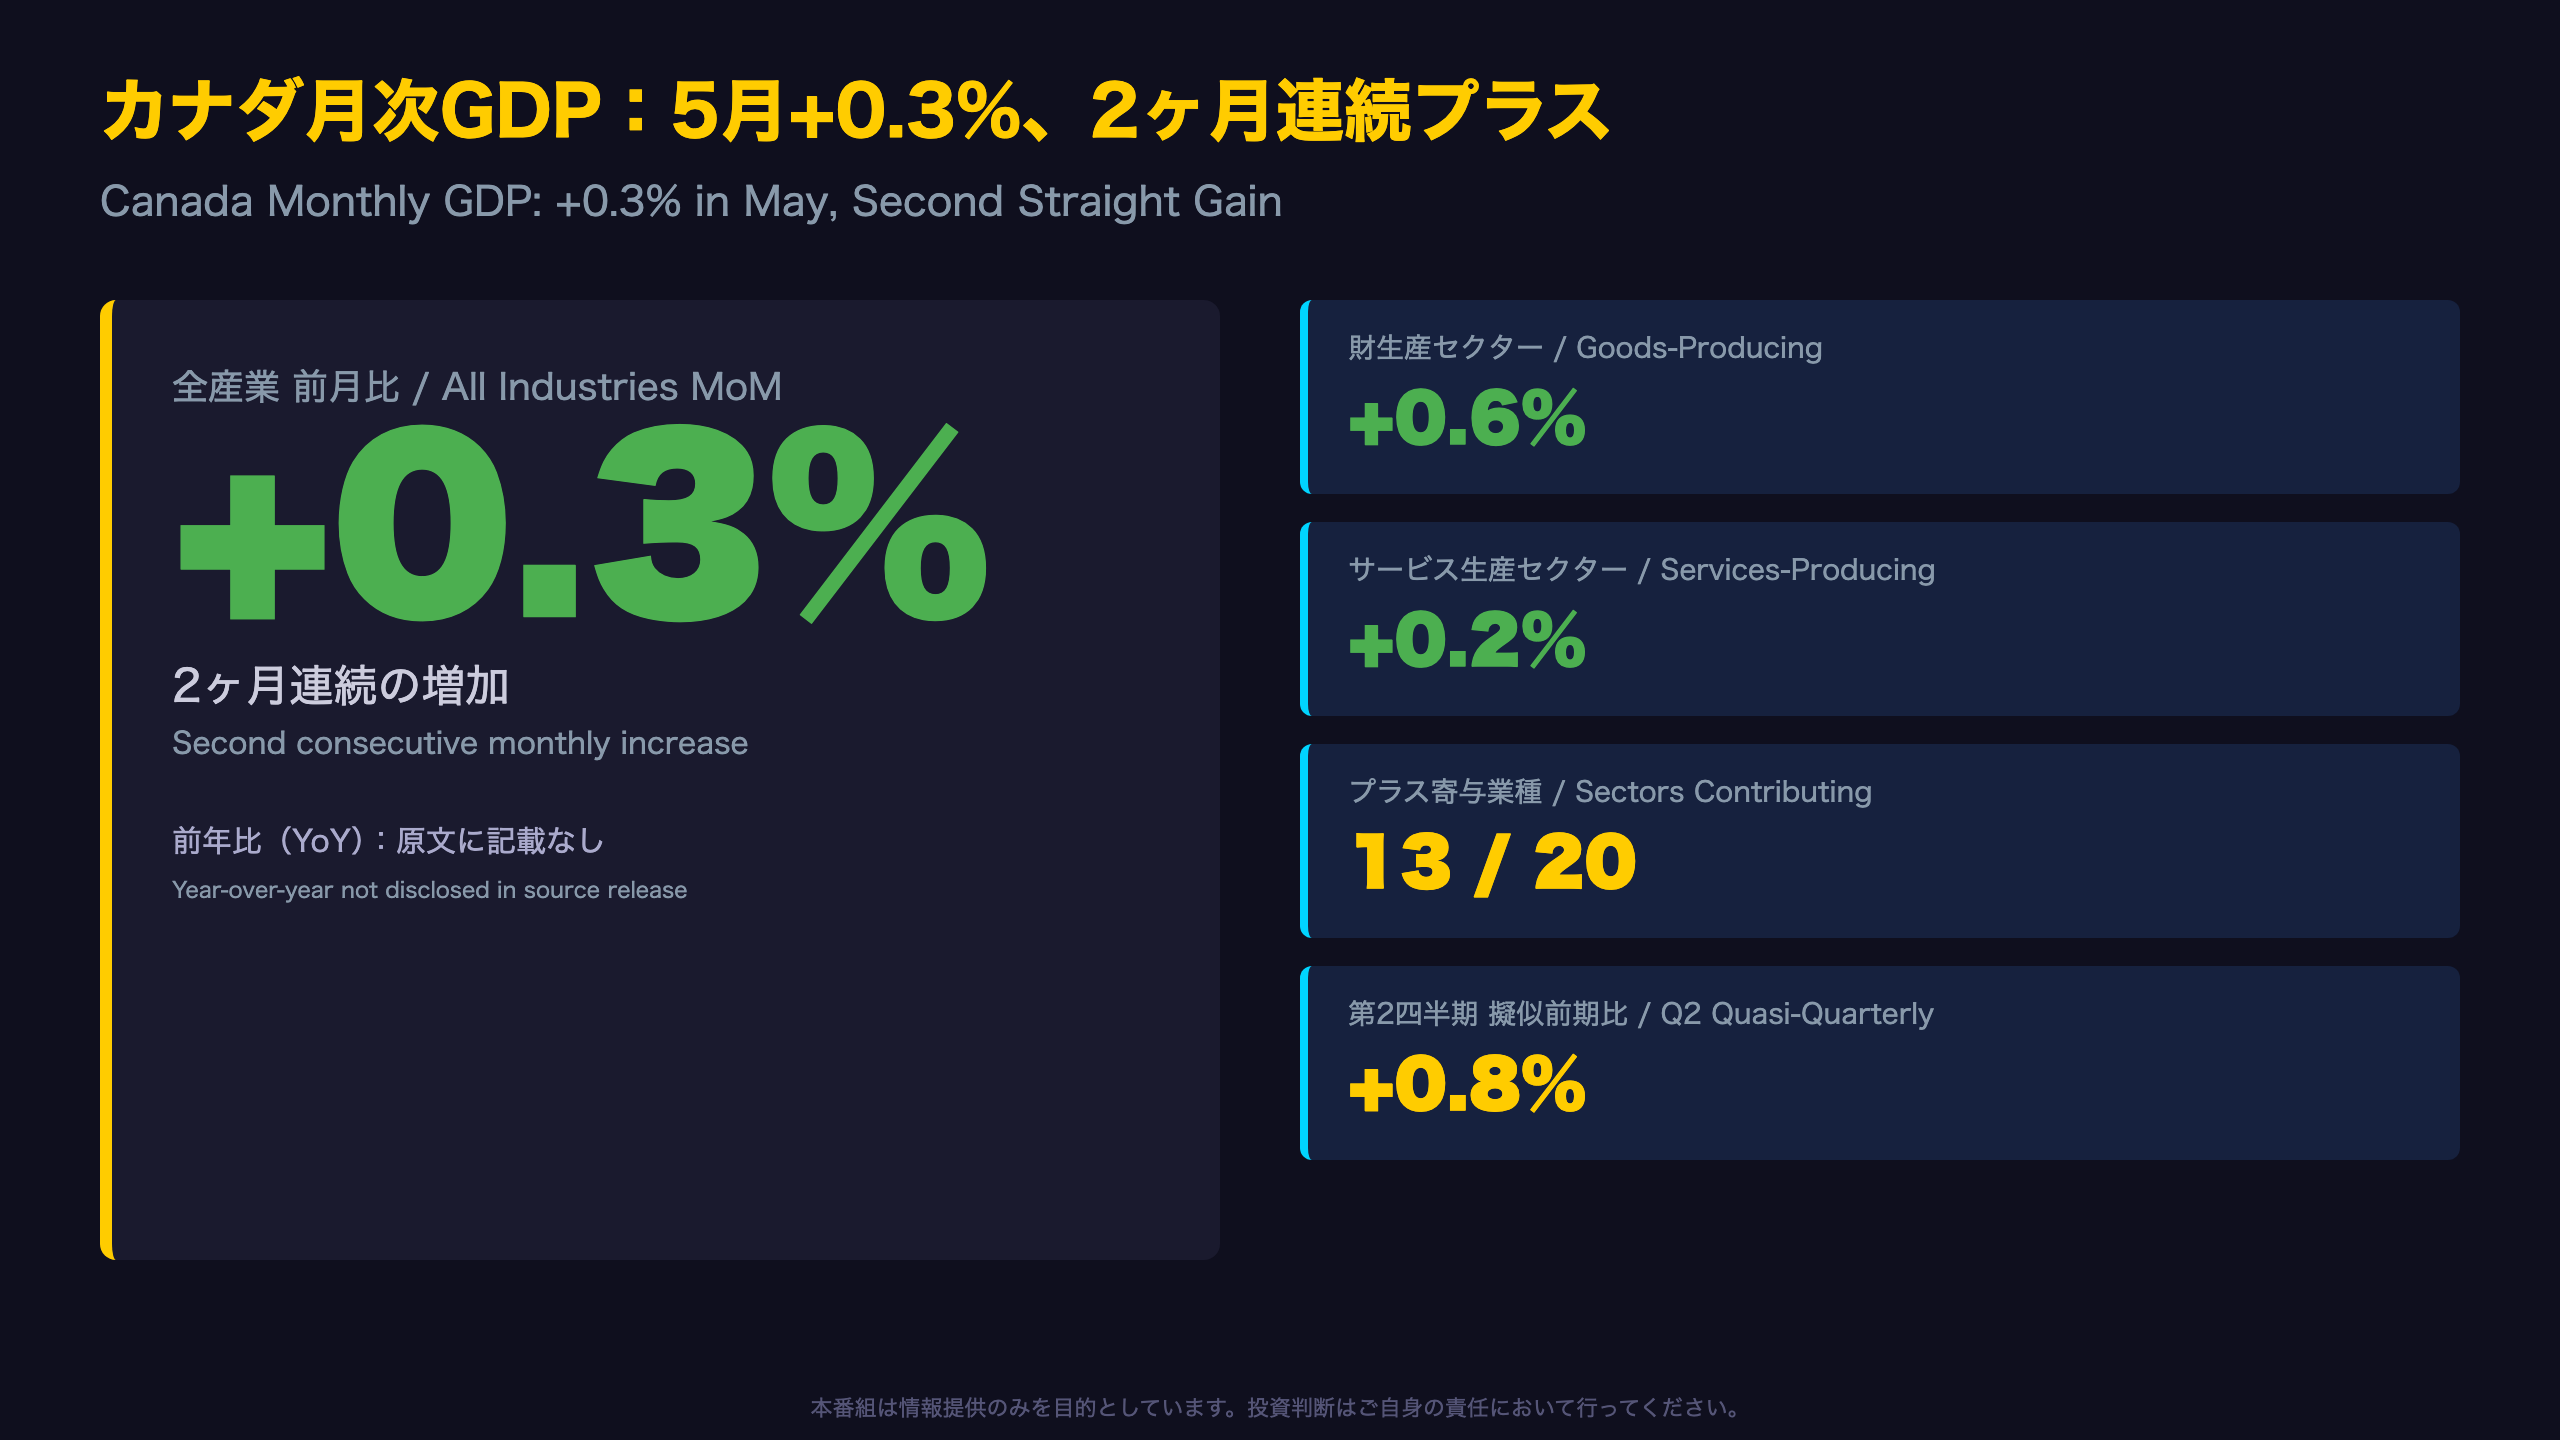
📊 Canada’s real GDP rose 0.3% MoM in May 2026, a second straight monthly gain.
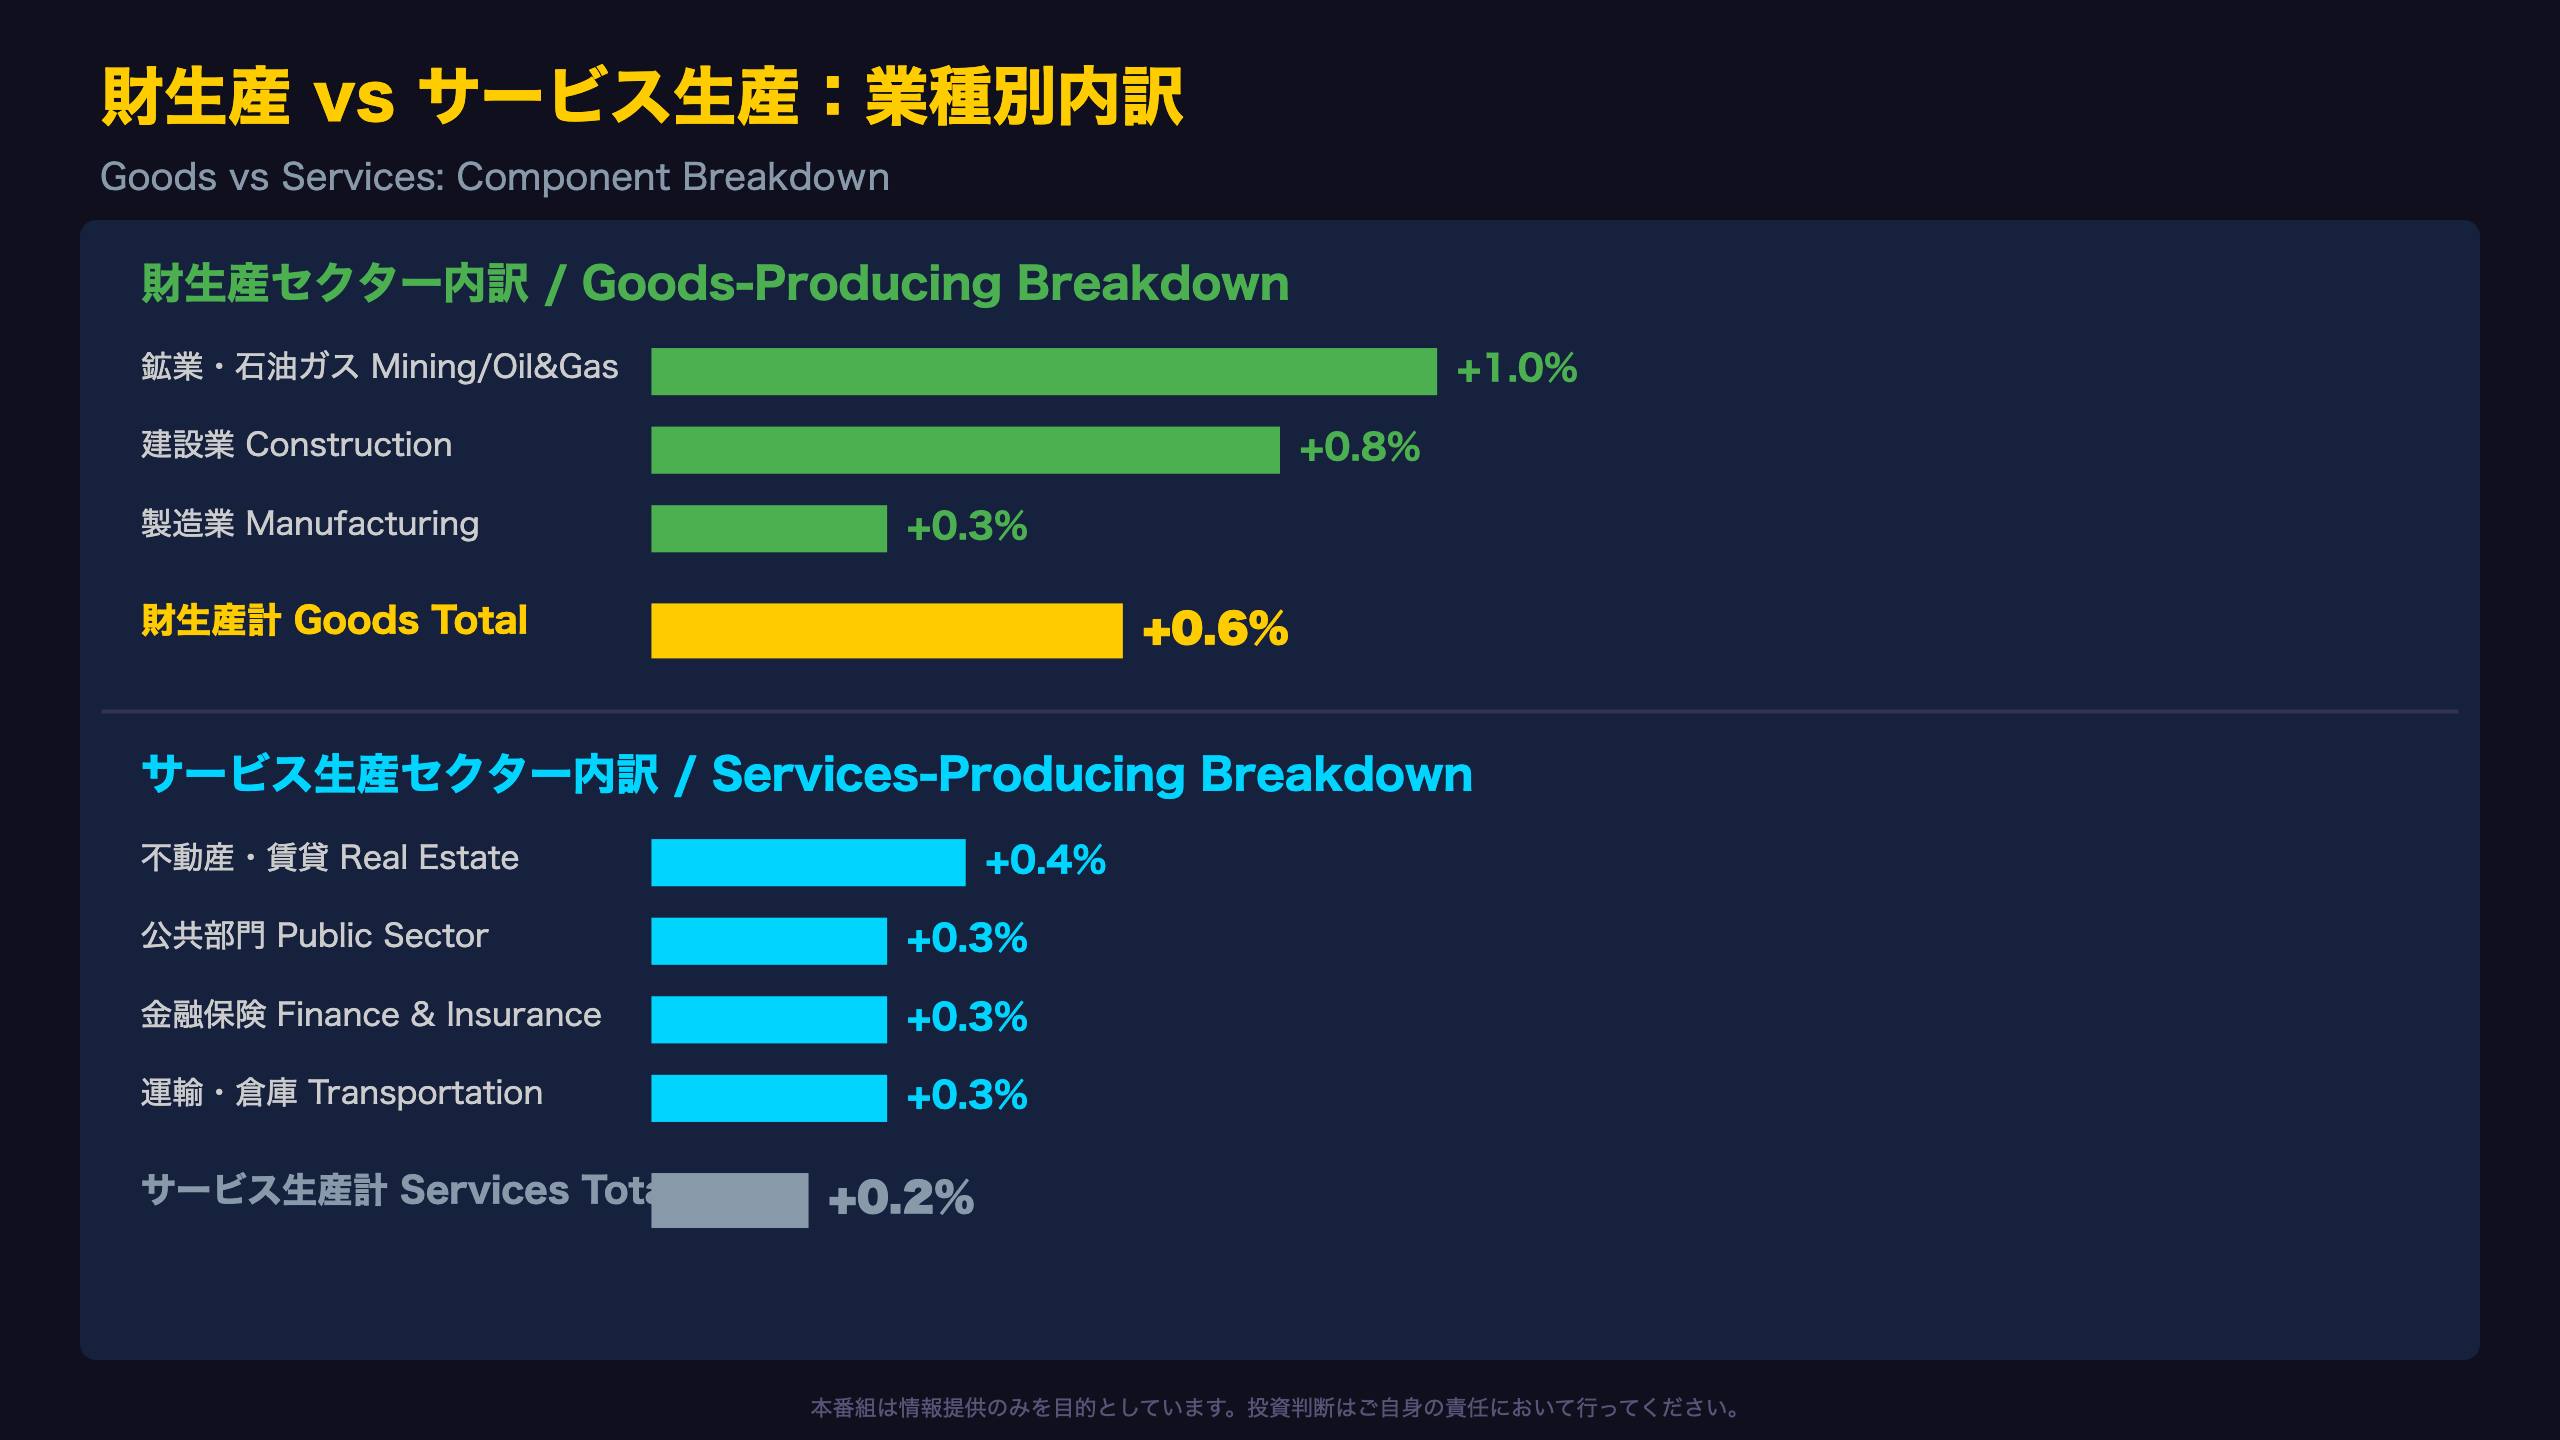
Goods-producing industries (+0.6%) outpaced services (+0.2%), led by resources and construction.
📈 13 of 20 sectors contributed positively — broad-based growth, with mining support activities up for a 7th straight month.
⚠️ But durable goods manufacturing fell 0.2% and non-oil mining dropped 0.7%. Part of the oil sands gain reflects one-off maintenance timing.
💡 June’s advance estimate is +0.2%, with Q2 tracking at +0.8%. We break down what this means for the BOC and CAD.
カナダ月次GDP:5月+0.3%、2ヶ月連続プラス
Understanding StatCan’s Monthly GDP by Industry
Unlike the U.S. Bureau of Economic Analysis, which reports quarterly GDP primarily on an expenditure basis, Statistics Canada publishes a monthly GDP by industry series measured at basic prices in chained (2017) dollars. This gives investors an earlier read on Canadian momentum than the quarterly expenditure-based release, though StatCan cautions that “due to conceptual and statistical differences, GDP by industry and GDP by expenditure percent change estimates can diverge slightly.”
Revisions Matter
This release revised data back to January 2025 — a reminder that monthly industry GDP prints face meaningful revision as new data arrive.
Quarterly Read-Through
With June’s advance estimate of +0.2% factored in, the quasi-quarterly pace for Q2 2026 stands at +0.8%. This can be cross-checked against FRED’s NAEXKP01CAQ657S series, though the official expenditure-based Q2 GDP figure won’t arrive until August 28, 2026.
Bulls vs. Bears
Bulls note the breadth of growth (13 of 20 sectors) as evidence of a broadening recovery. Bears caution that the release contains no year-over-year comparison, limiting assessment of the level versus a year ago — a gap this analysis flags rather than fills with estimates.
財生産セクターが牽引:+0.6% vs サービス+0.2%
Goods vs. Services: A Structural Snapshot
Canada’s services-producing industries typically account for the bulk of GDP, yet in May goods-producing industries grew three times faster (+0.6%) than services (+0.2%). While this is a single month’s data and shouldn’t be read as a structural shift, it highlights the outsized swing potential of Canada’s resource and construction sectors.
Per StatCan: “Goods-producing industries expanded 0.6%, as most sectors comprising the aggregate rose in May.”
Inside Services
Within services, real estate and rental and leasing (+0.4%, fourth consecutive monthly gain) and the public sector aggregate (+0.3%) led the way. Real estate agents and brokers surged 5.1% — the largest monthly gain since October 2024 — tied to a rebound in home resale activity in Ontario and British Columbia.
A Note of Caution
Some of the goods-side strength may reflect temporary factors within mining and energy (detailed in the next section), so whether goods-producing momentum persists likely hinges on the next release, due August 28.
製造業の明暗:非耐久財+1.0% vs 耐久財-0.2%
A Closer Look at Manufacturing Sub-Sectors
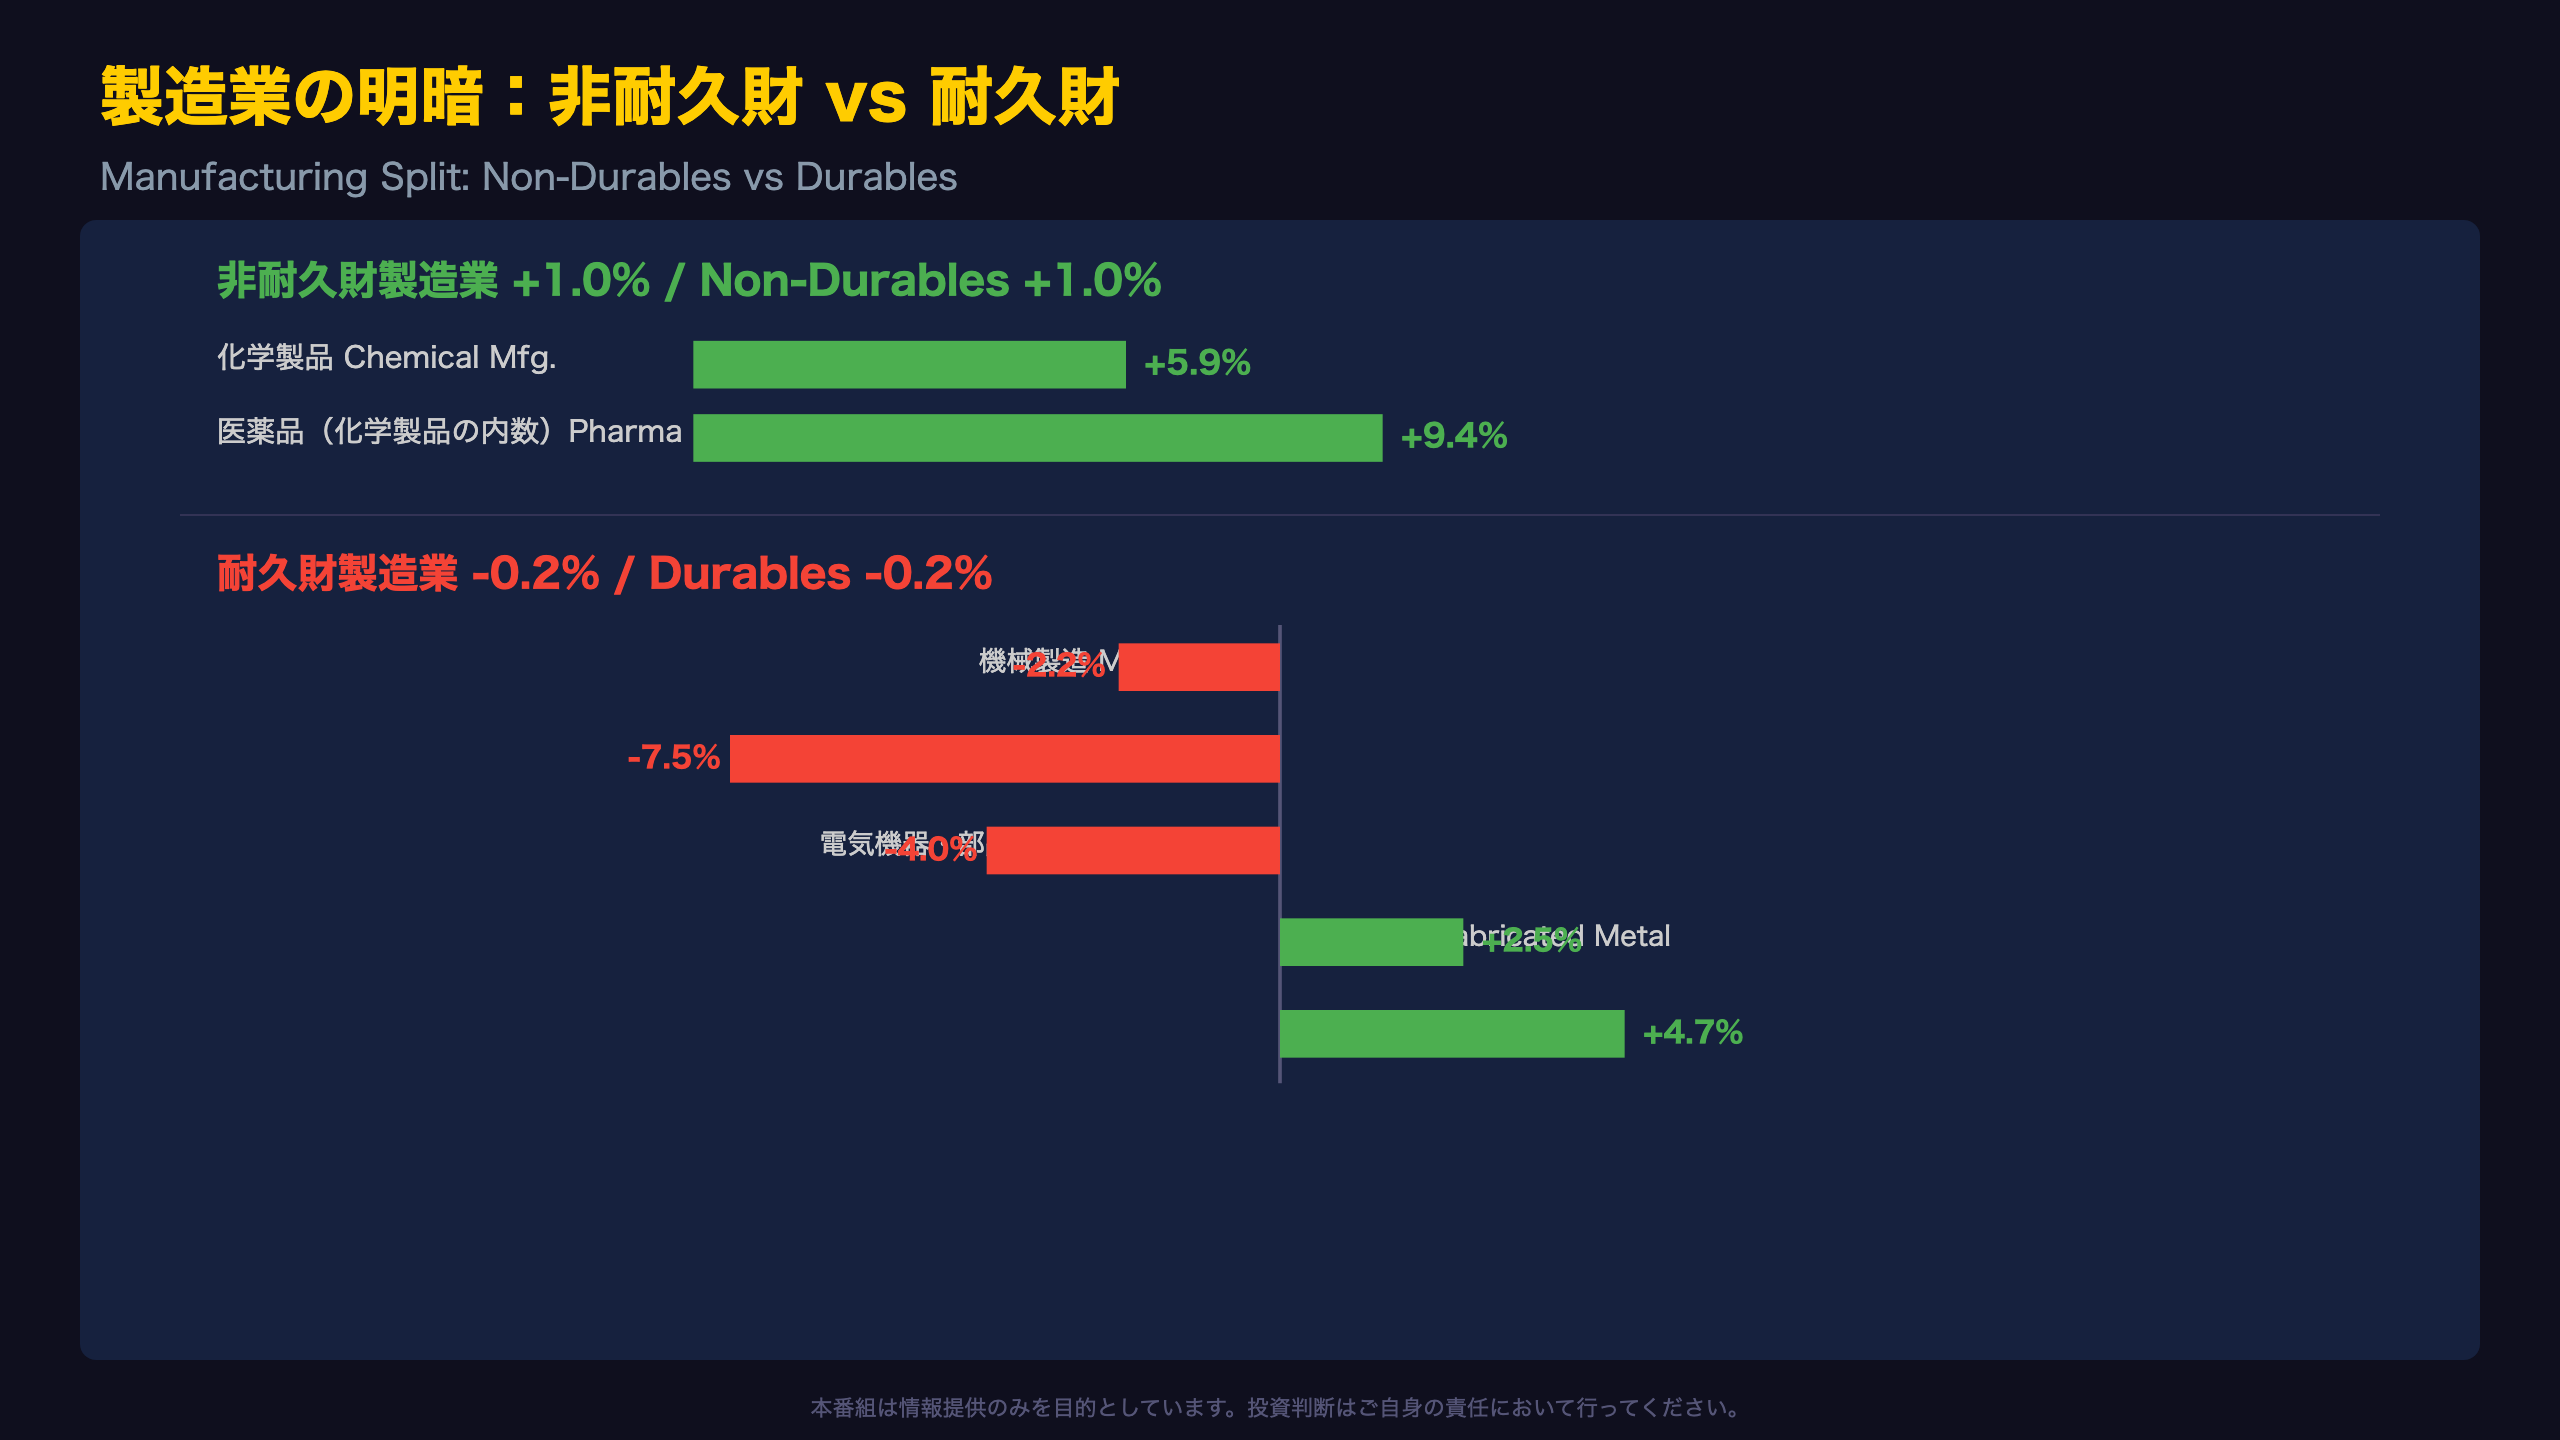
The rebound in chemical manufacturing (+5.9%) — which had declined for three straight months — is the standout within non-durables. Whether this marks a genuine trend reversal or a one-month bounce will only become clear with subsequent releases. Pharmaceutical and medicine manufacturing, up 9.4%, was tied to higher exports, making it sensitive to currency movements and external demand.
Durable Goods Weakness
Durable goods manufacturing fell 0.2%, weighed down by broad declines in machinery manufacturing (-2.2%), miscellaneous manufacturing (-7.5%), and electrical equipment manufacturing (-4.0%). These sub-sectors are commonly watched as leading indicators of capital equipment demand. A single month of weakness does not confirm a turn in the capex cycle, but it is a data point worth tracking.
Per StatCan: “Durable goods manufacturing industries contracted 0.2% in May, driven in large part by declines in machinery manufacturing (-2.2%), miscellaneous manufacturing (-7.5%) and electrical equipment, appliance and component manufacturing (-4.0%).”
Offsetting Strength
Motor vehicle manufacturing (+4.7%) may hint at a recovery in North American auto production, though this inference should not be over-extended from a single month’s data.
鉱業・エネルギーが7ヶ月連続で成長を牽引
Inside the Energy Sector’s Growth
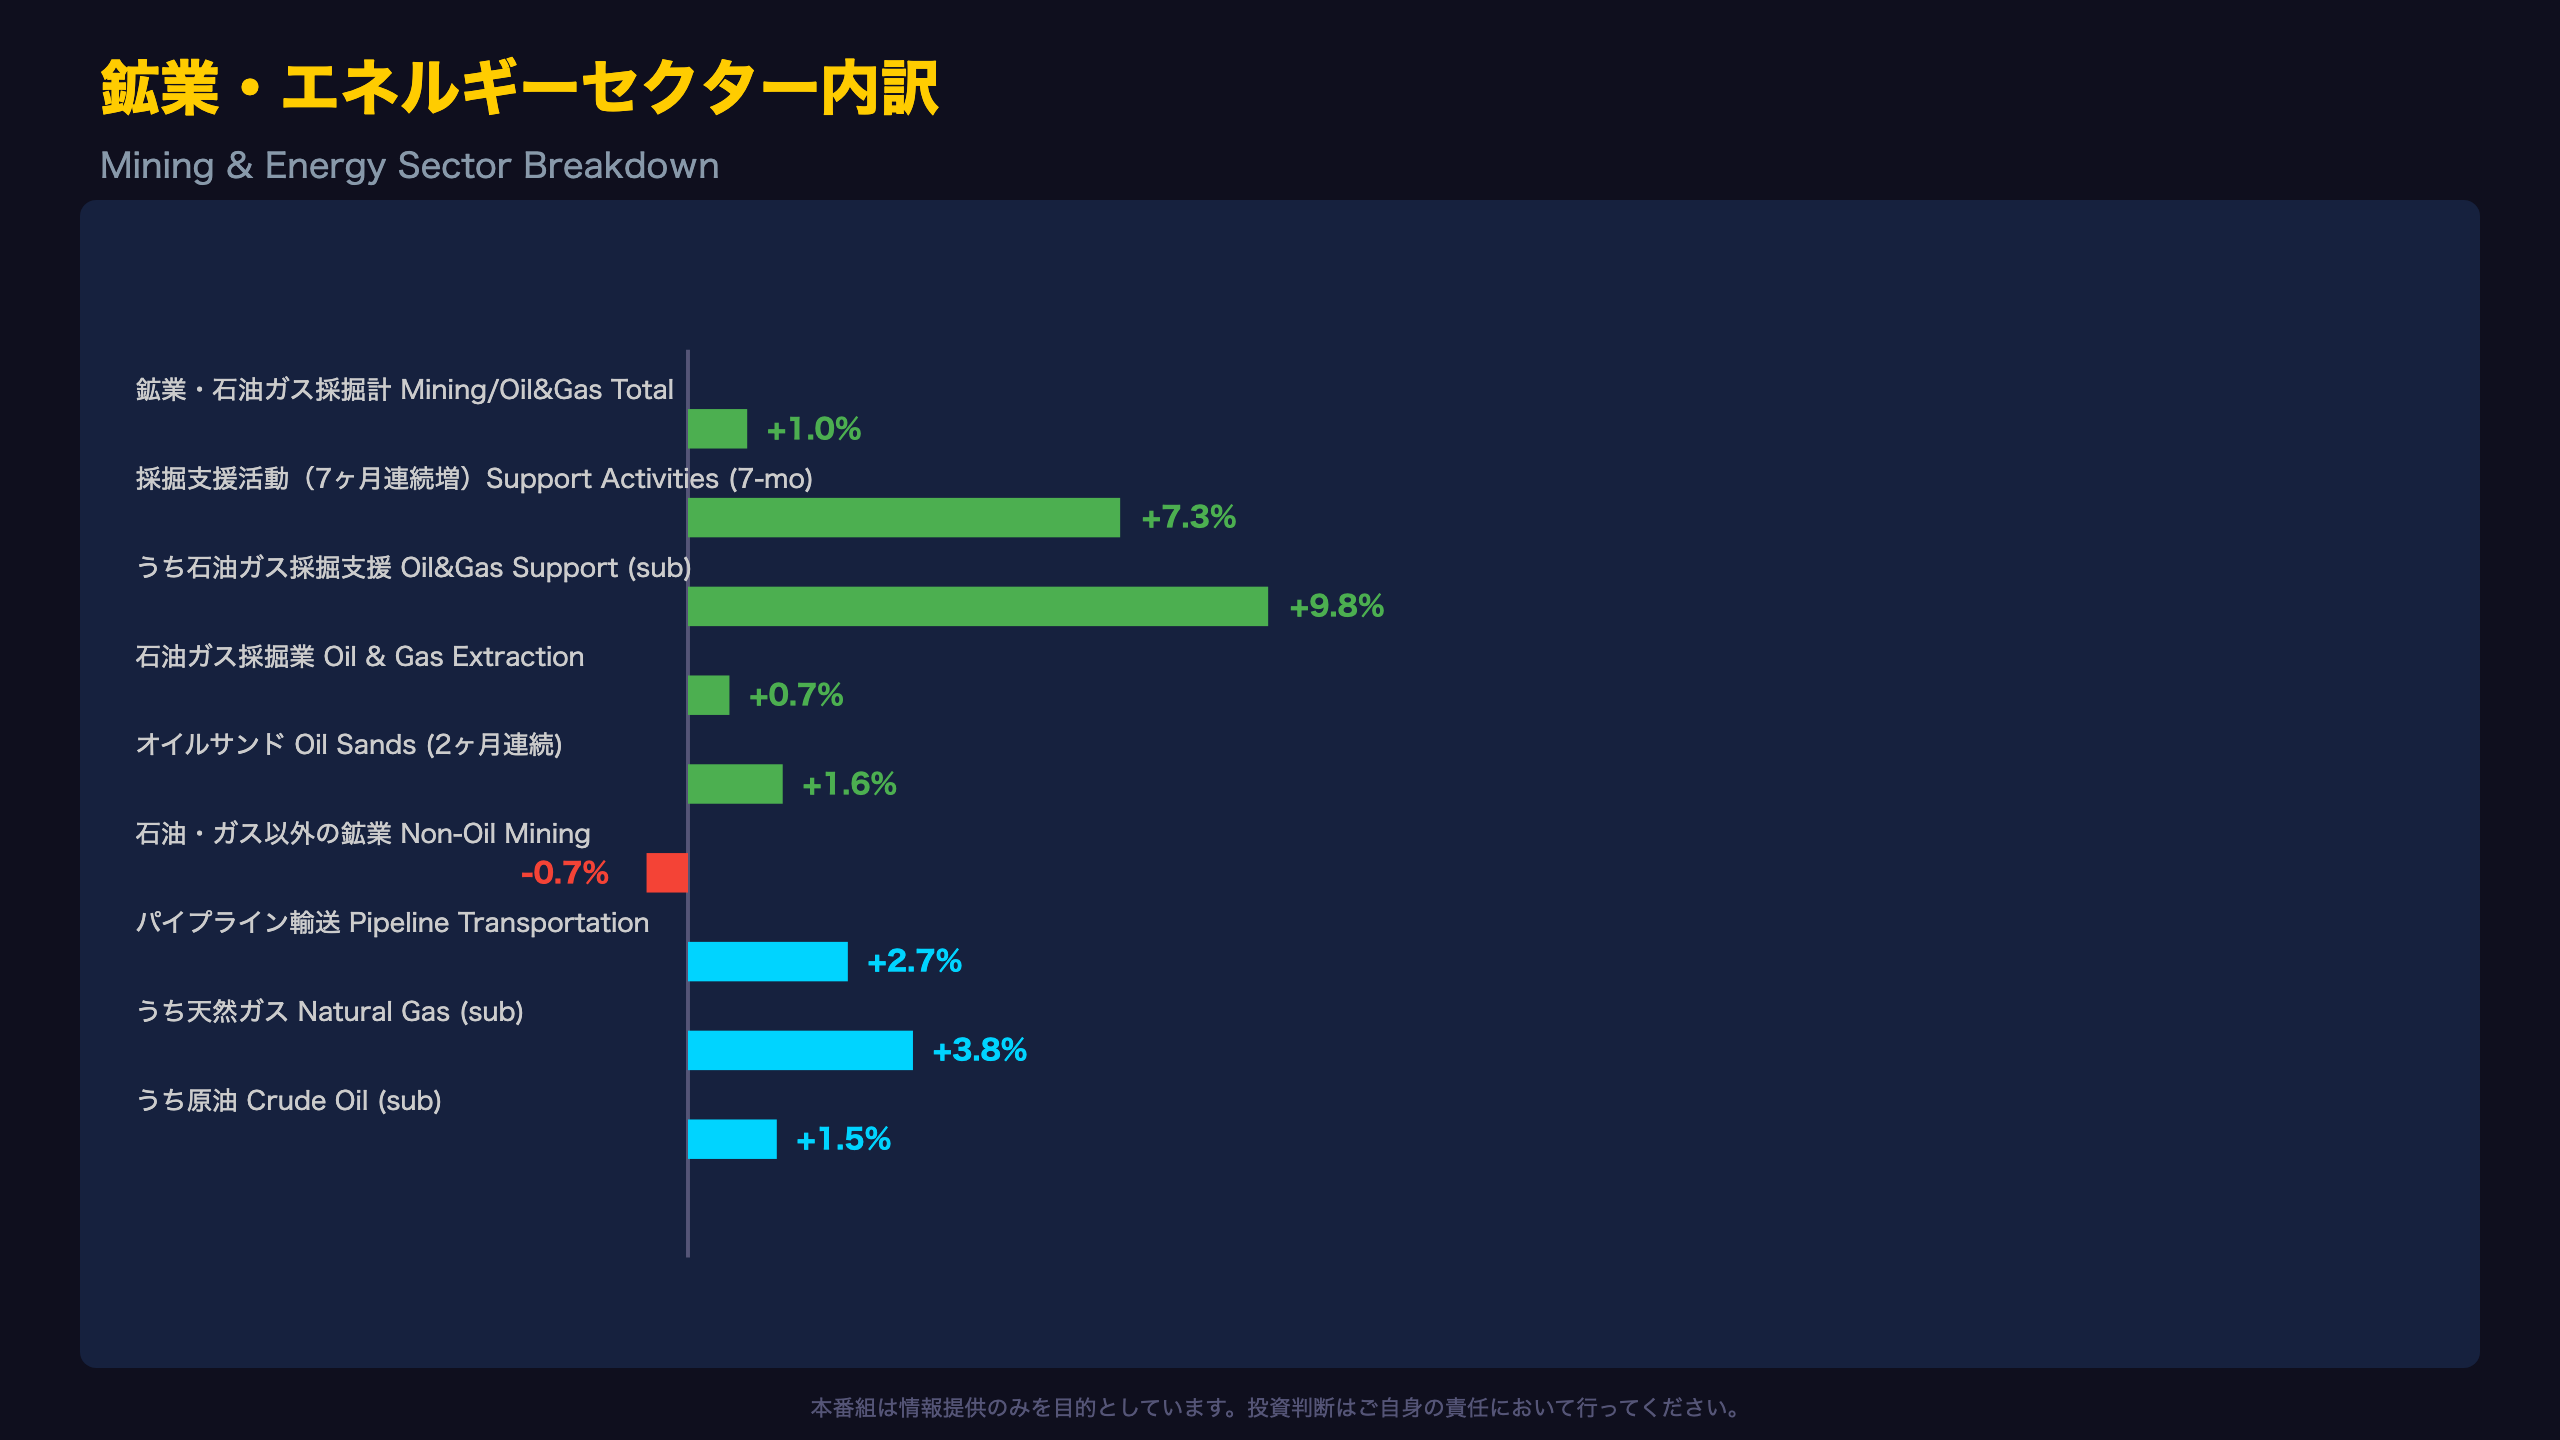
Within mining, quarrying, and oil and gas extraction, two of three subsectors drove the gain. Support activities for mining and oil and gas extraction have now risen for seven consecutive months — a streak long enough to suggest something more durable than a one-off bounce in upstream investment activity.
A Timing Caveat
However, StatCan flags a specific caveat around oil sands extraction:
“The extraction activity was relatively elevated for the month of May, given that some of the maintenance work that typically happens in the spring was either completed earlier in the year or deferred.”
This suggests part of May’s strength in oil sands may reflect maintenance timing rather than a purely organic output increase — worth watching for a potential give-back.
Non-Energy Mining Diverges
Mining and quarrying excluding oil and gas contracted 0.7%, as declines in coal and non-metallic mineral mining outweighed gains in metal ore mining — a reminder that resource strength in Canada is not monolithic.
Pipeline Transportation Confirms the Trend
Within transportation and warehousing (+0.3%), pipeline transportation rose 2.7% (natural gas +3.8%, crude oil +1.5%), corroborating the broader export-driven energy narrative.
6月速報値+0.2%、第2四半期は+0.8%ペース
What an “Advance Estimate” Means
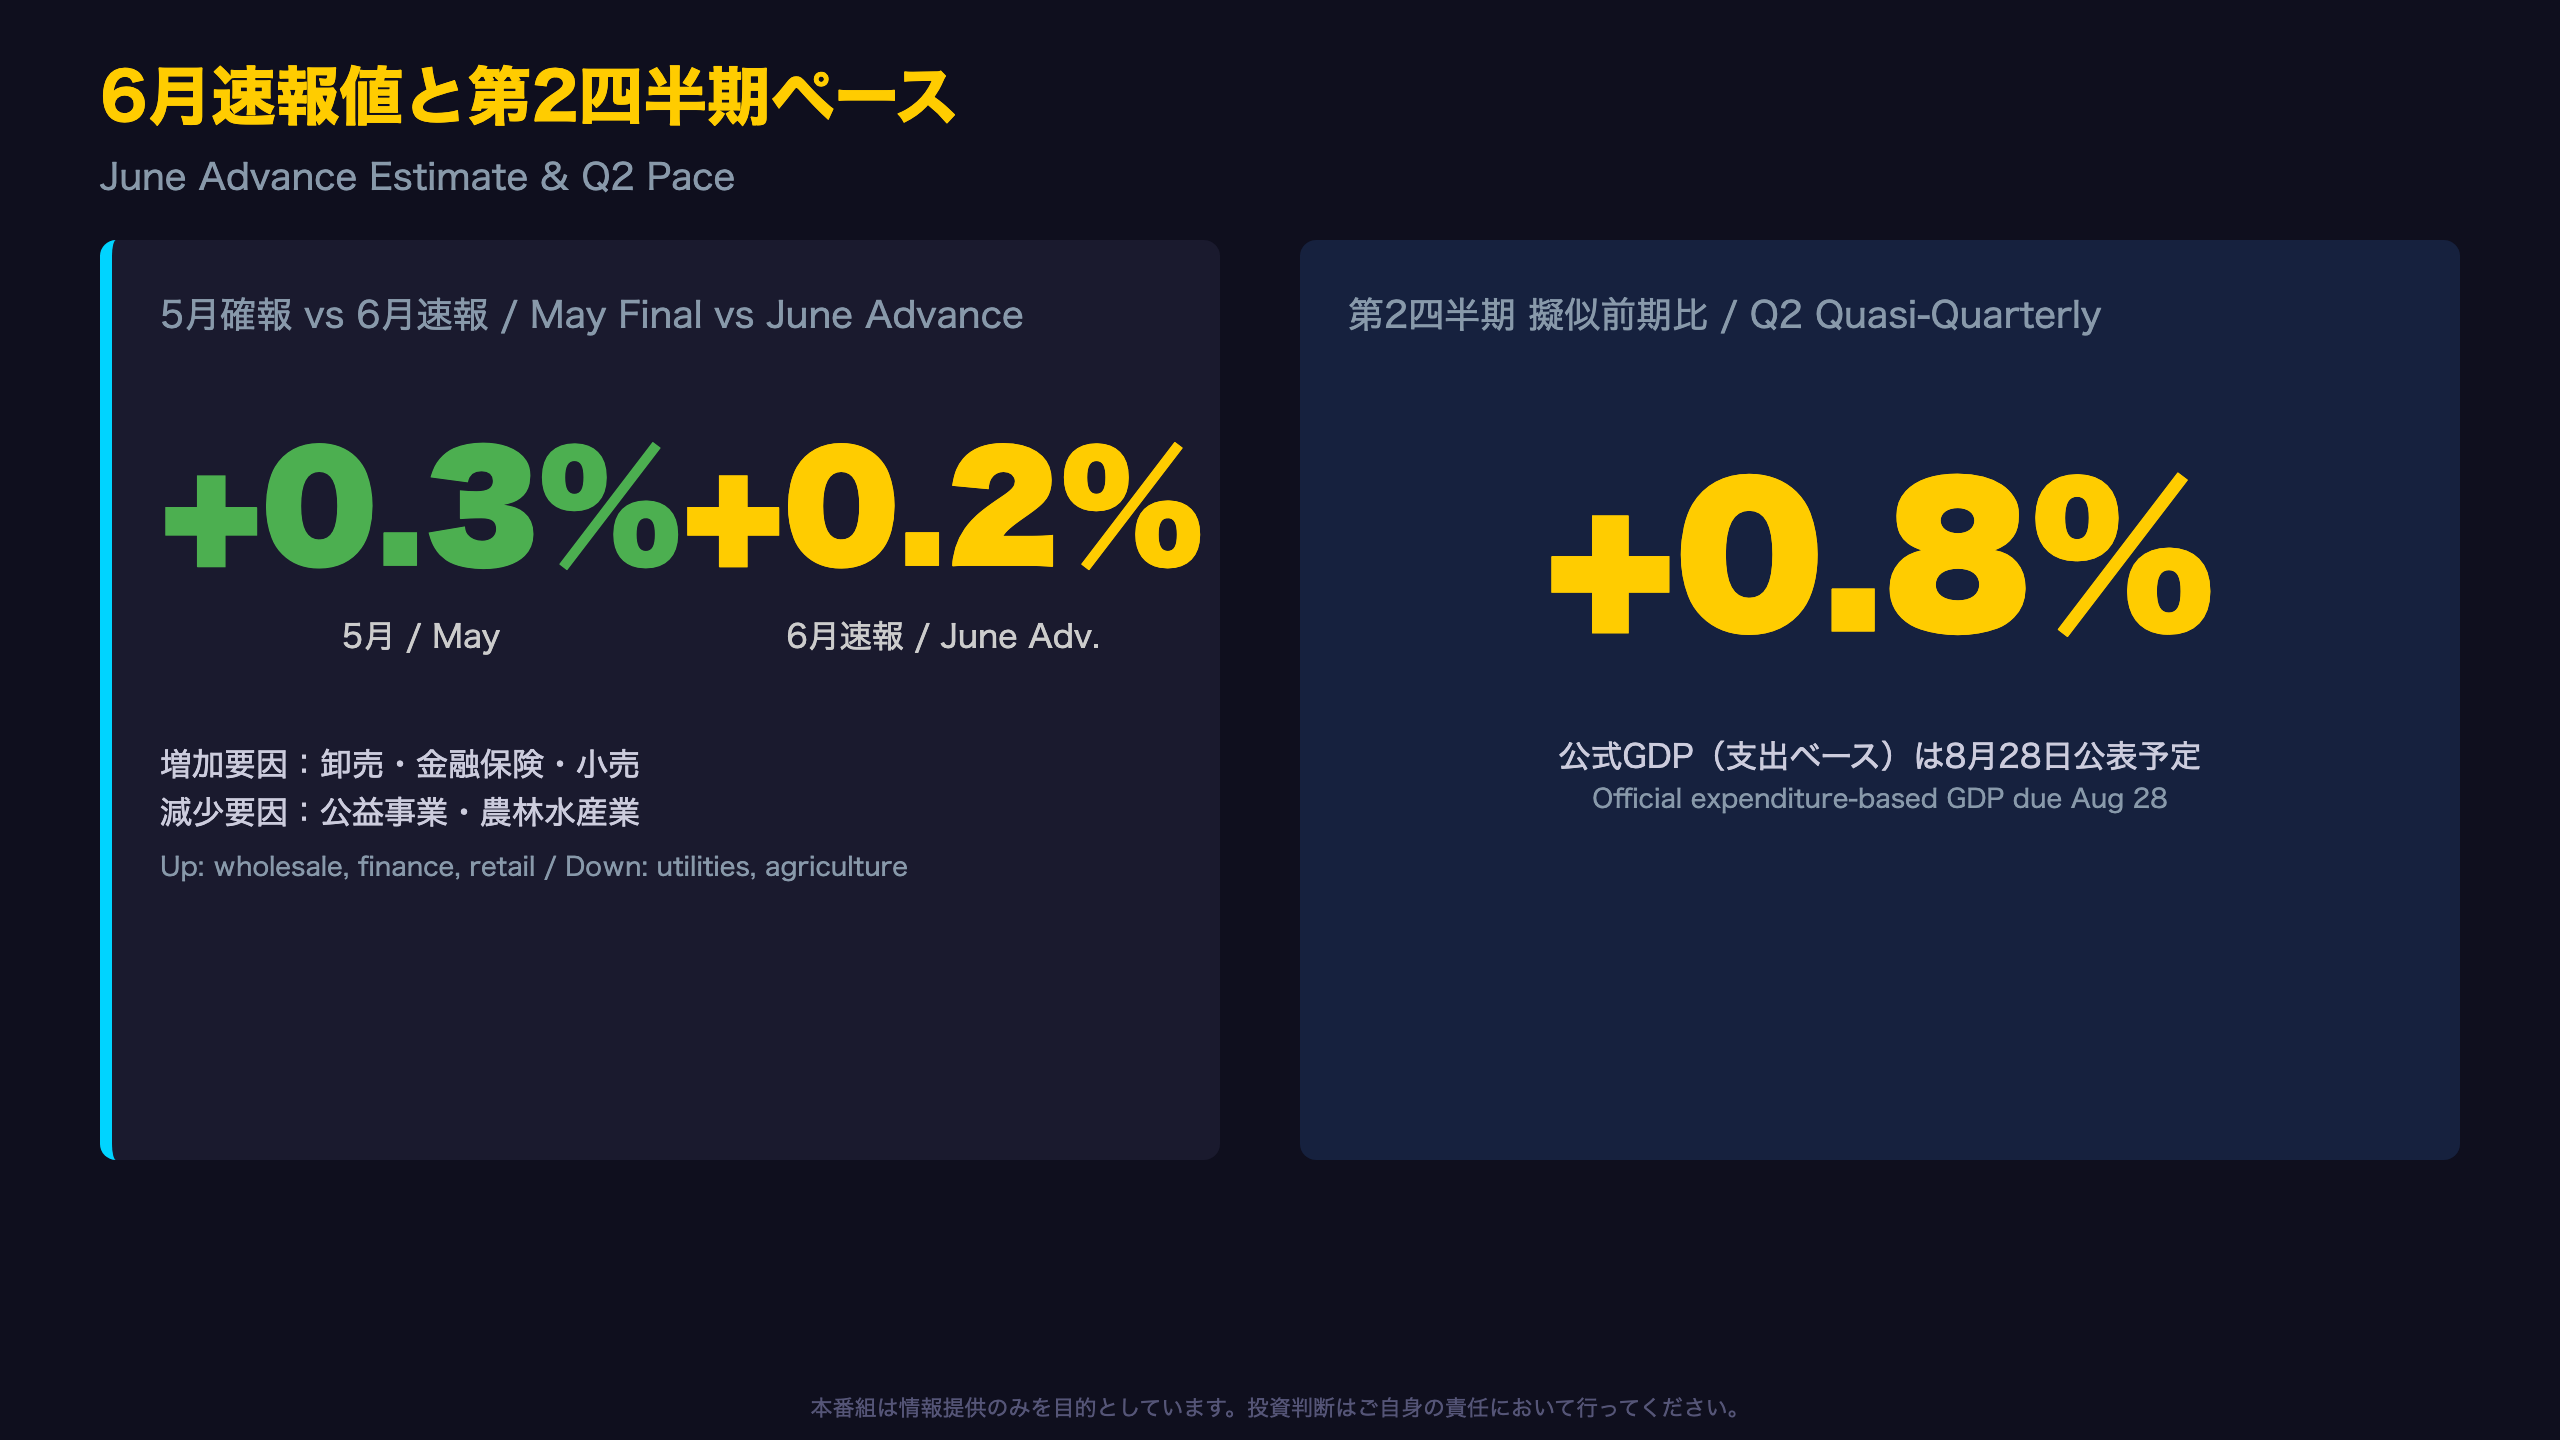
StatCan’s June figure is a preliminary estimate based on partial industrial production data, subject to revision when incorporated into the official release on August 28. Historically, advance estimates and final figures can diverge, so June’s +0.2% should be treated as directional.
What’s Driving June
The advance estimate points to gains in wholesale trade, finance and insurance, and retail trade, partially offset by declines in utilities and agriculture, forestry, fishing and hunting. Notably, mining and energy — May’s standout performers — are not cited as June drivers, hinting at a possible rotation in growth sources.
Reading the Quarterly Pace
The 0.8% quasi-quarterly figure for Q2 2026 reflects cumulative growth across April through June — it is not an annualized rate. As StatCan states: “With this advance estimate for June, information on real GDP by industry suggests that the economy expanded 0.8% in the second quarter of 2026.” This industry-based figure can be benchmarked against FRED’s NAEXKP01CAQ657S series, though the official expenditure-based Q2 GDP print — due August 28 — remains the authoritative comparison.
Revisions Are Ongoing
This release revised historical data back to January 2025, a reminder that monthly industry GDP remains a moving target.
BOC政策への示唆:底堅い成長とCADの行方
Aligning with the BOC’s Hidden Markov Model
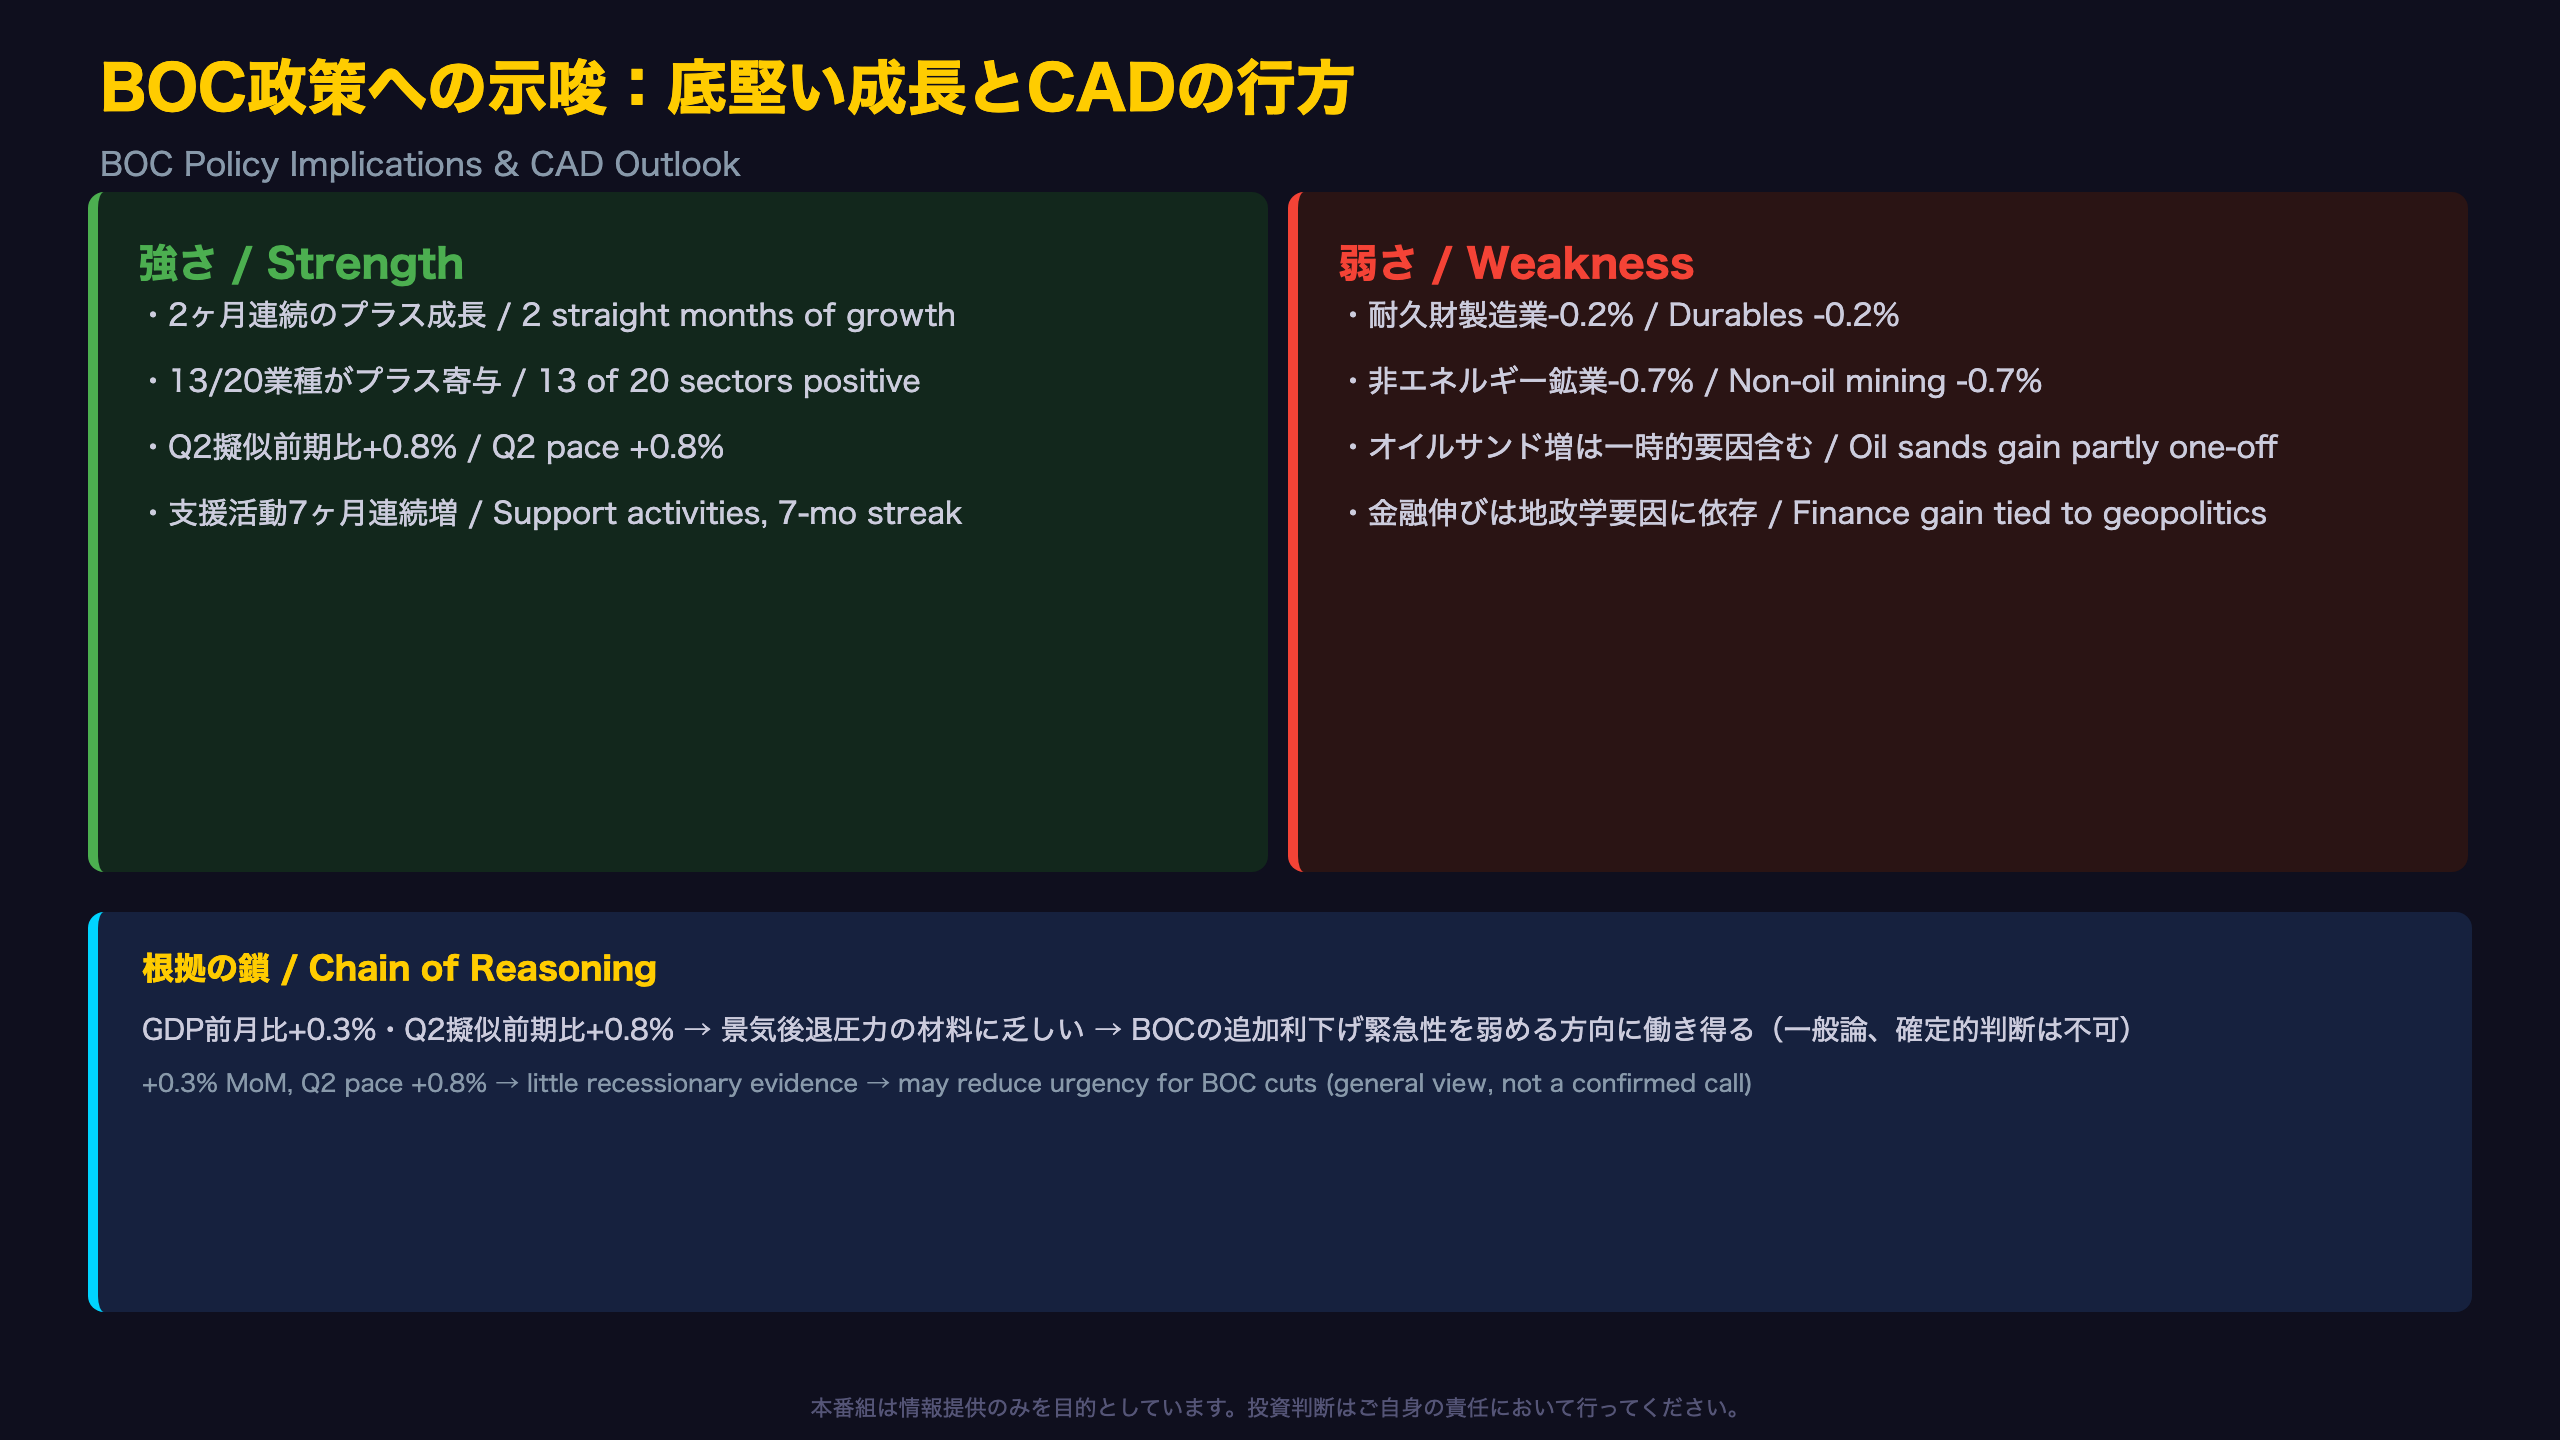
The Bank of Canada’s hidden Markov model treats GDP growth as a key observed variable in identifying the prevailing policy regime — Hawkish, Neutral, or Dovish. This release offers several data points that could nudge the model toward Neutral-to-Hawkish territory:
- Two consecutive months of growth (April and May)
- Breadth across 13 of 20 industrial sectors
- A Q2 quasi-quarterly pace of +0.8%
Counterbalancing Softness
- Durable goods manufacturing down 0.2% (machinery, electrical equipment weak)
- Non-oil mining and quarrying down 0.7%
- Part of the oil sands gain reflects one-off maintenance-timing effects
- Finance and insurance growth was partly attributed to “heightened activities in the equity and bond markets amid the uncertainty associated with the conflict in the Persian Gulf” — a geopolitically-driven boost of uncertain persistence
What This Means for CAD (General Framework)
It is generally understood in FX markets that resilient growth data reduces expectations for central bank easing and tends to support the domestic currency. However, this single release cannot on its own predict the BOC’s next policy decision.
Watch Next
The August 28 release — combining the official expenditure-based Q2 GDP with June’s industry-level data — will be the next major data point. Key questions: does the industry-vs-expenditure gap narrow? Does durable-goods manufacturing rebound? Does oil sands output give back May’s timing-driven gain?
Disclaimer: This article is for informational purposes only. All investment decisions are made solely at your own risk.