📺 Watch the Full Video Analysis
This article was automatically generated by the NFC Market Live AI analysis system. (Updated: 2026-07-31 18:37 JST)
📊 Eurostat’s July 31 flash estimate shows euro area annual inflation accelerating to 2.9%, up from 2.8% in June.
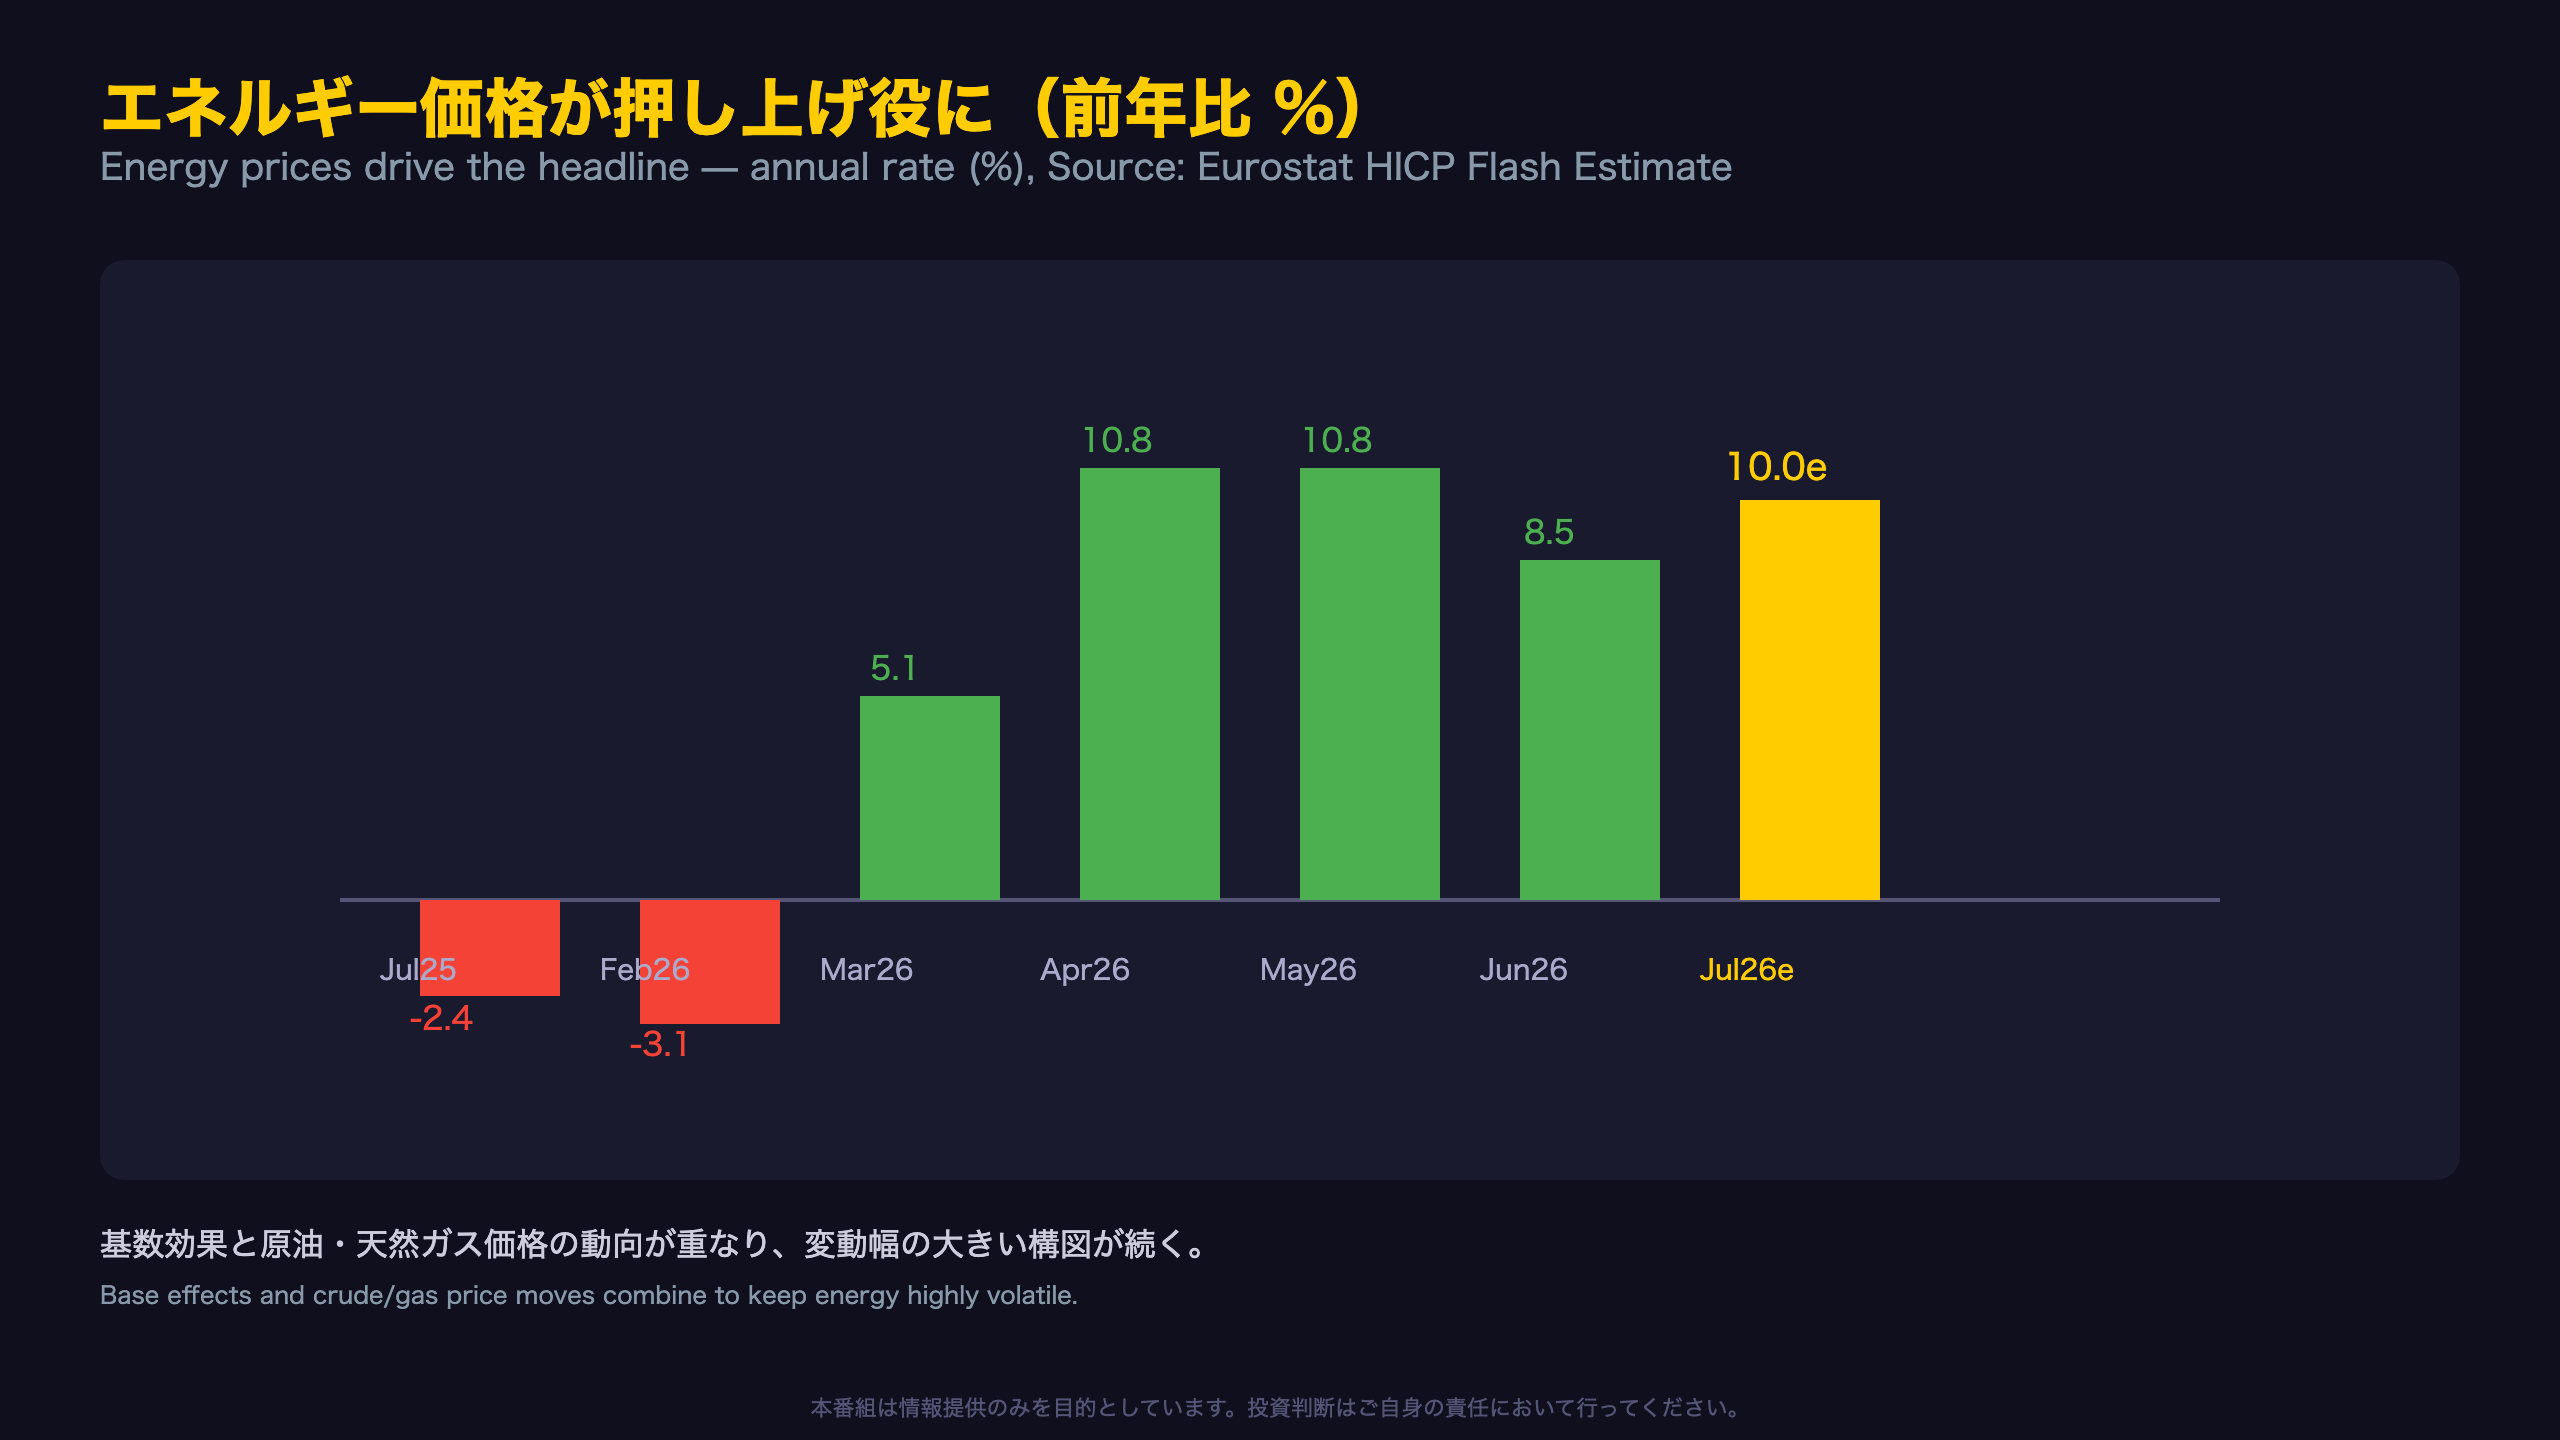
🔥 The main driver: energy prices, whose annual rate jumped from 8.5% to 10.0%.
💡 Meanwhile, core inflation (ex-energy, food, alcohol & tobacco) held steady at 2.2%, suggesting underlying pressures haven’t intensified.
⚠️ Services inflation ticked up from 3.2% to 3.3%, a sign wage-driven stickiness hasn’t fully faded.
🌍 Country divergence remains wide — Germany accelerated to 2.8% while Greece fell sharply to 2.7%.
We break down what this means for the ECB’s next move and the euro, with balanced analysis.
総合HICP、2.9%へ再加速 ― エネルギー主導、コアは安定
The headline picture
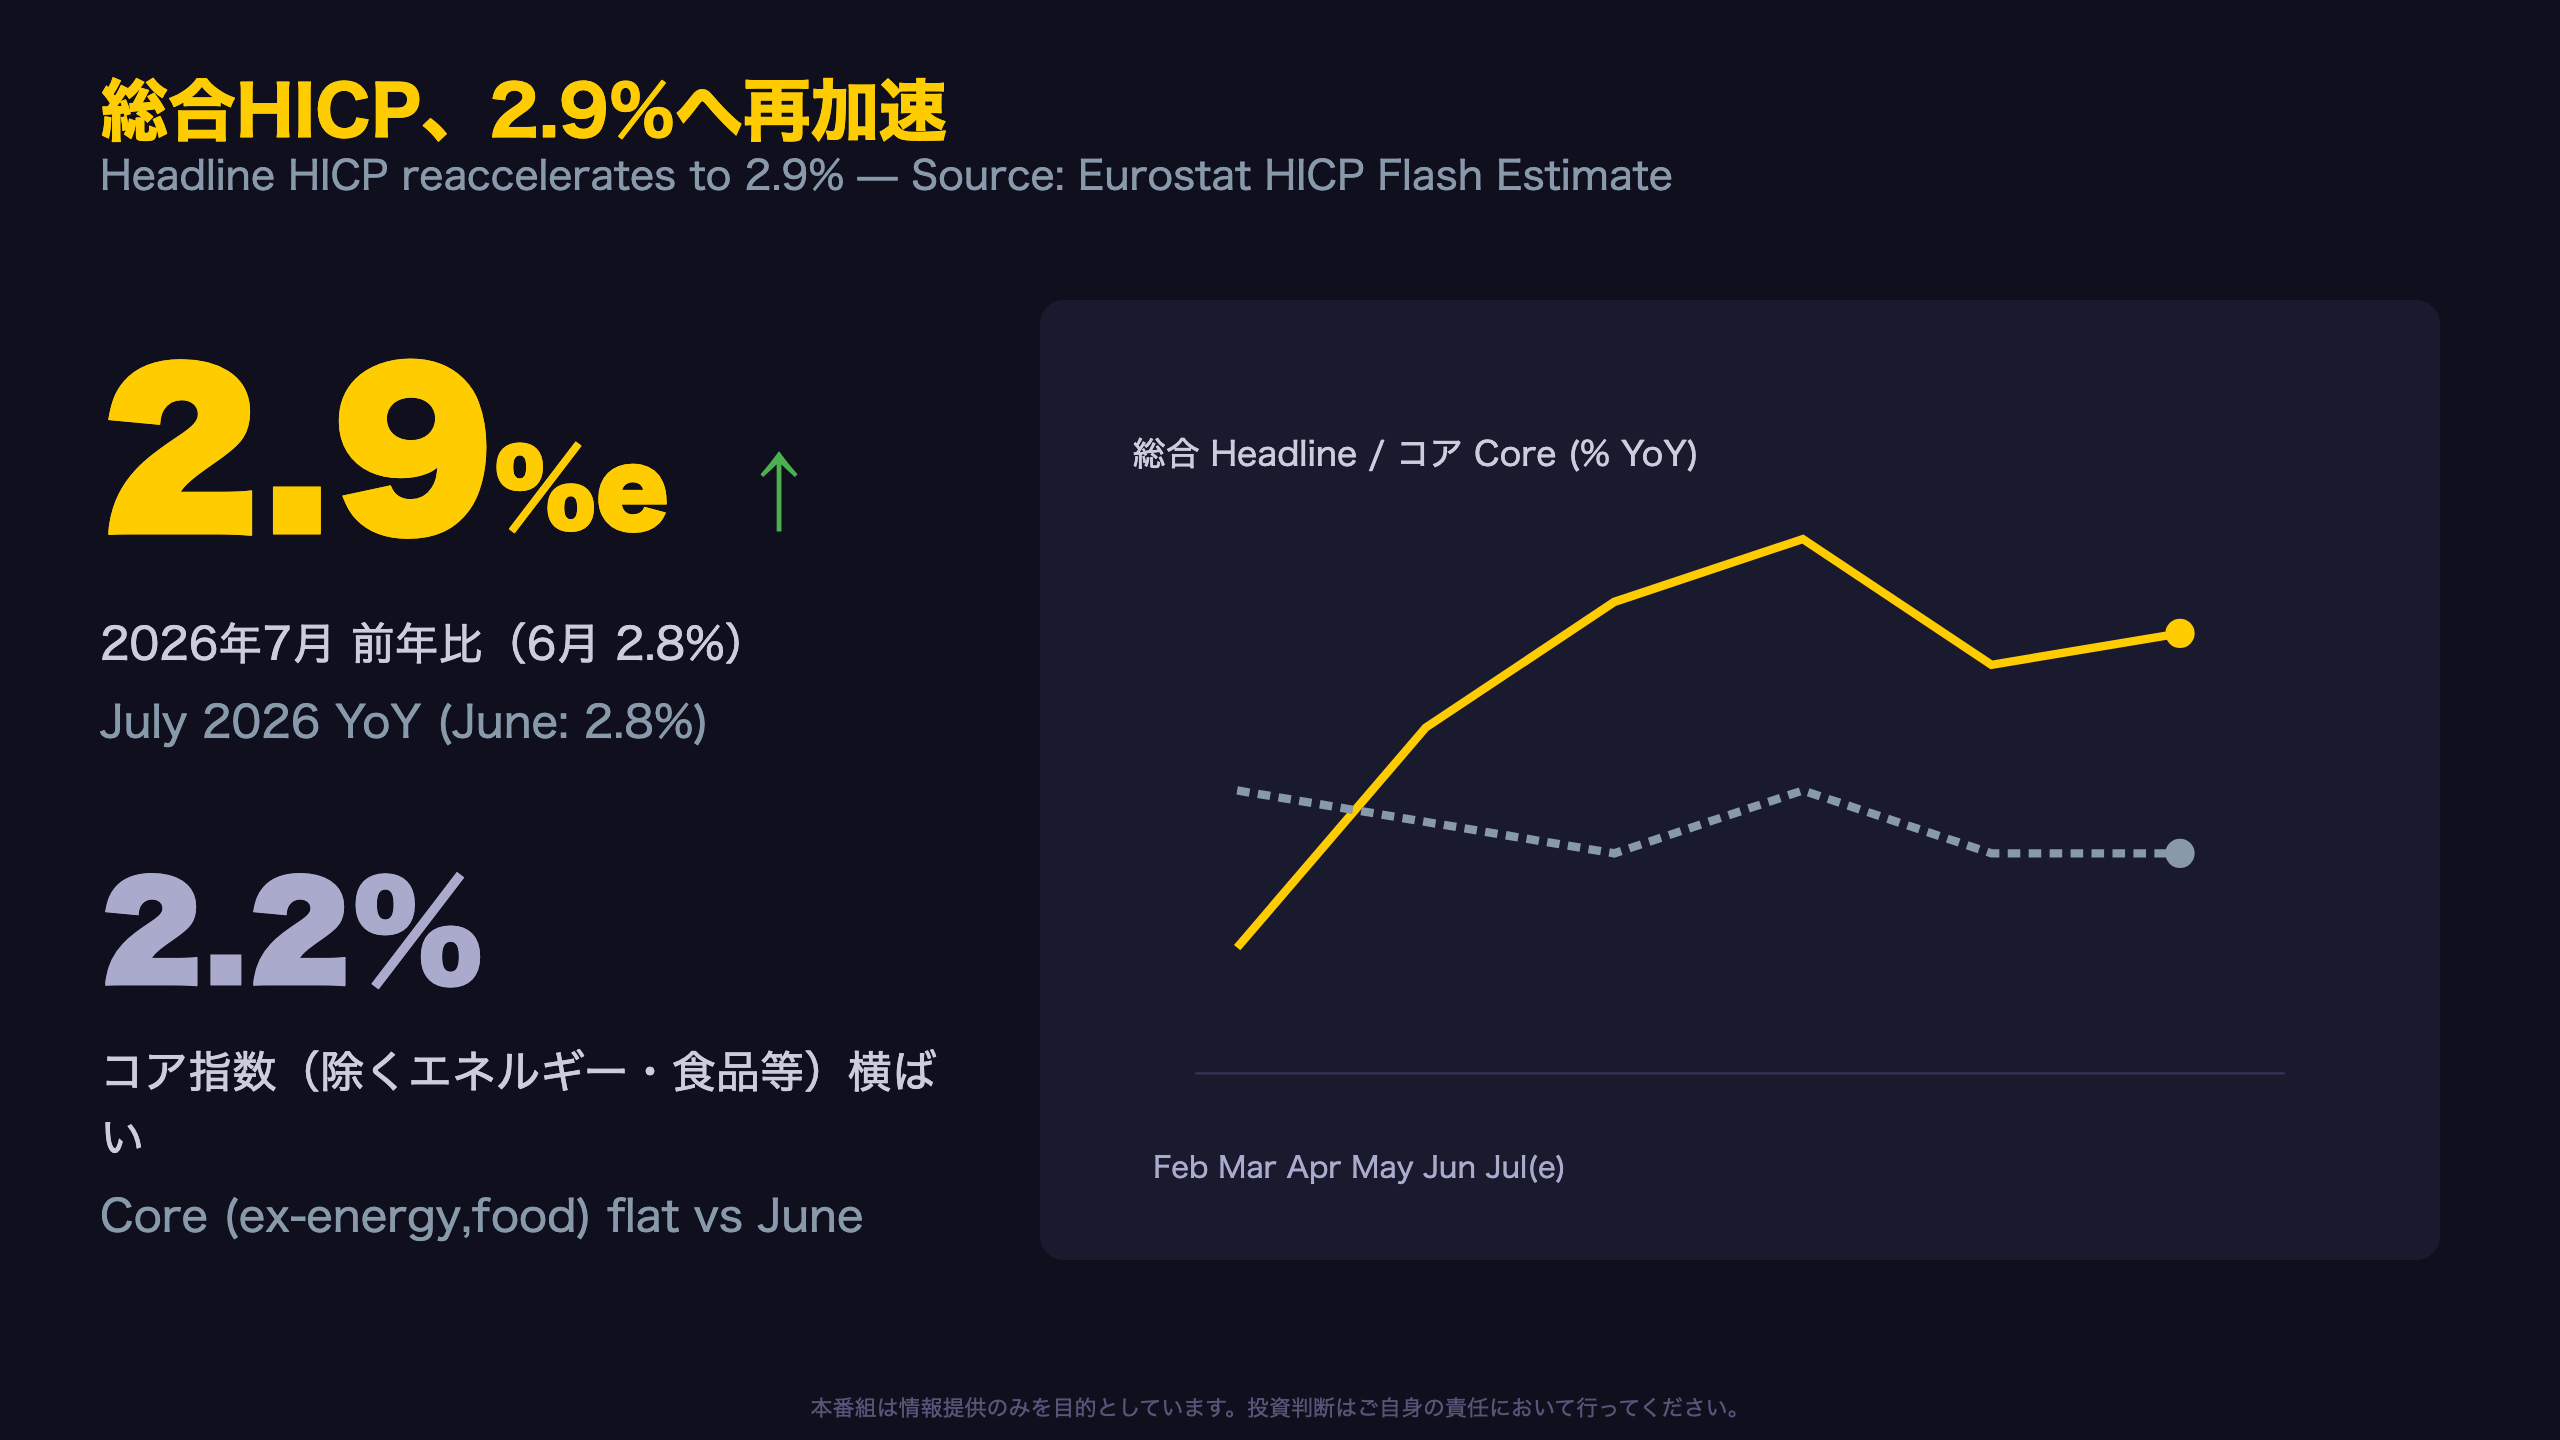
Eurostat’s July 31, 2026 flash estimate shows euro area annual inflation at 2.9%, up from 2.8% in June. As the release states: “annual inflation is expected to be 2.9% in July 2026, up from 2.8% in June.”
Context for readers unfamiliar with Eurostat
Eurostat is the EU’s statistical office, and the HICP (Harmonised Index of Consumer Prices) is the euro area’s equivalent of the US CPI — it is the specific inflation gauge the European Central Bank (ECB) targets at 2%. Unlike the US CPI, HICP excludes owner-occupied housing costs, which can make cross-Atlantic inflation comparisons tricky.
Six-month trajectory
The path from February (1.9%) through March (2.6%), April (3.0%), May (3.2%), June (2.8%) to July (2.9%) shows a peak in May followed by a partial retreat and a modest re-acceleration — not a straight-line trend.
Why the core/headline gap matters
Core inflation (ex-energy, food, alcohol, tobacco) held flat at 2.2%. A rising headline alongside a flat core suggests the July uptick is concentrated in a single volatile category (energy) rather than broad-based (a level-B inference). For FX and rates markets, this distinction matters more than the headline print alone, since the ECB’s reaction function leans heavily on core and services trends.
The next full dataset arrives August 19, 2026 — watch for revisions to this estimated figure.
エネルギー価格が押し上げ役に ― 前年比10.0%まで急伸
Energy’s rollercoaster year
The reported annual energy inflation figures (%) are: Jul-25: -2.4
コア指数は2.2%で横ばい ― 食品は減速、非エネ工業品は加速
Breaking down the core basket
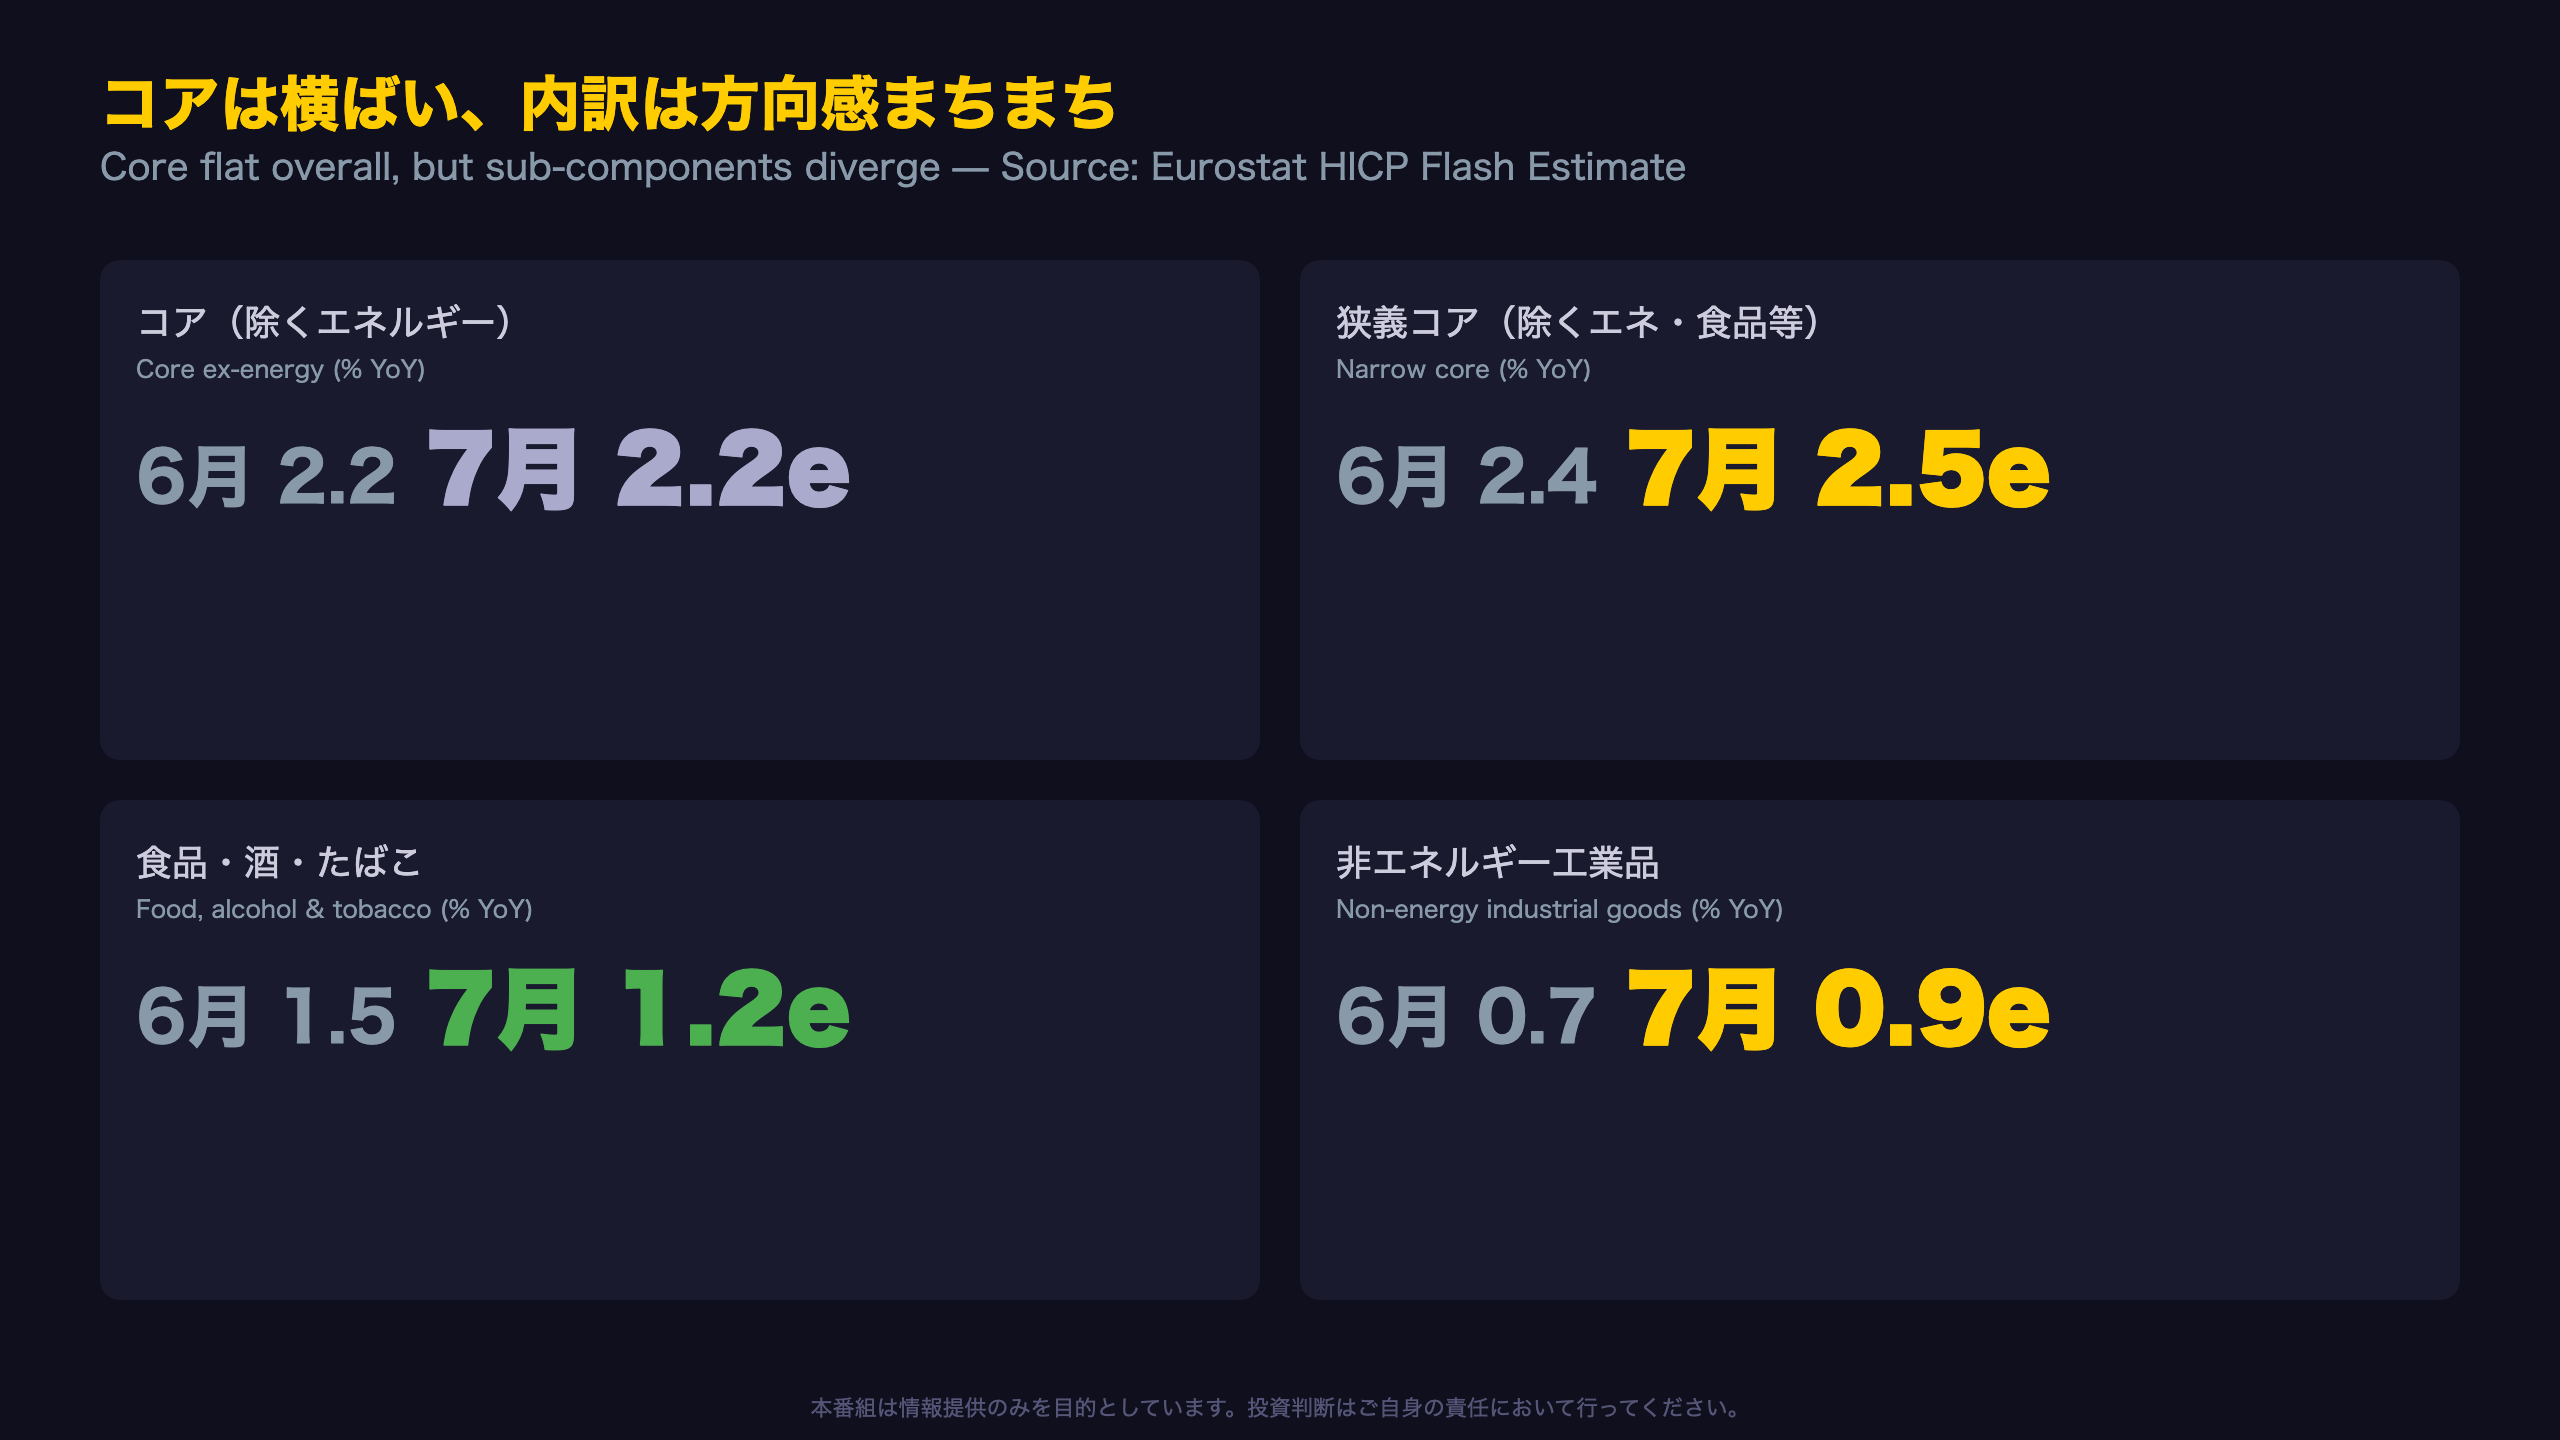
The headline core measure (“all-items excluding energy”) was flat at 2.2%. But a narrower measure that also strips out food, alcohol and tobacco rose from 2.4% to 2.5% — a 0.1 point uptick. The gap between these two core gauges is informative: the narrower one isolates services and non-energy industrial goods, the components most tied to domestic demand and wages.
Food disinflation continues
Food, alcohol & tobacco inflation slowed from 1.5% to 1.2%, and unprocessed food decelerated sharply from 3.1% to 2.5%. Processed food also eased slightly (0.9% to 0.8%). This is a clear, broad-based cooling in food prices (a level-A fact directly from the release).
But goods prices are heating up
Non-energy industrial goods accelerated from 0.7% to 0.9%, even though the July month-on-month rate was an estimated -2.2% — likely reflecting seasonal summer sales patterns rather than a change in trend (a level-C inference).
The takeaway for investors
Unlike the US Fed, which watches PCE core inflation, the ECB parses HICP sub-components closely because food and energy behave very differently across the currency union. This month’s mixed signals — food cooling, goods firming — mean no single sub-index can be used to call the underlying trend definitively.
サービス価格3.3%へ小幅上昇 ― ECBが最も注視する粘着指標
The ECB’s most-watched sub-index
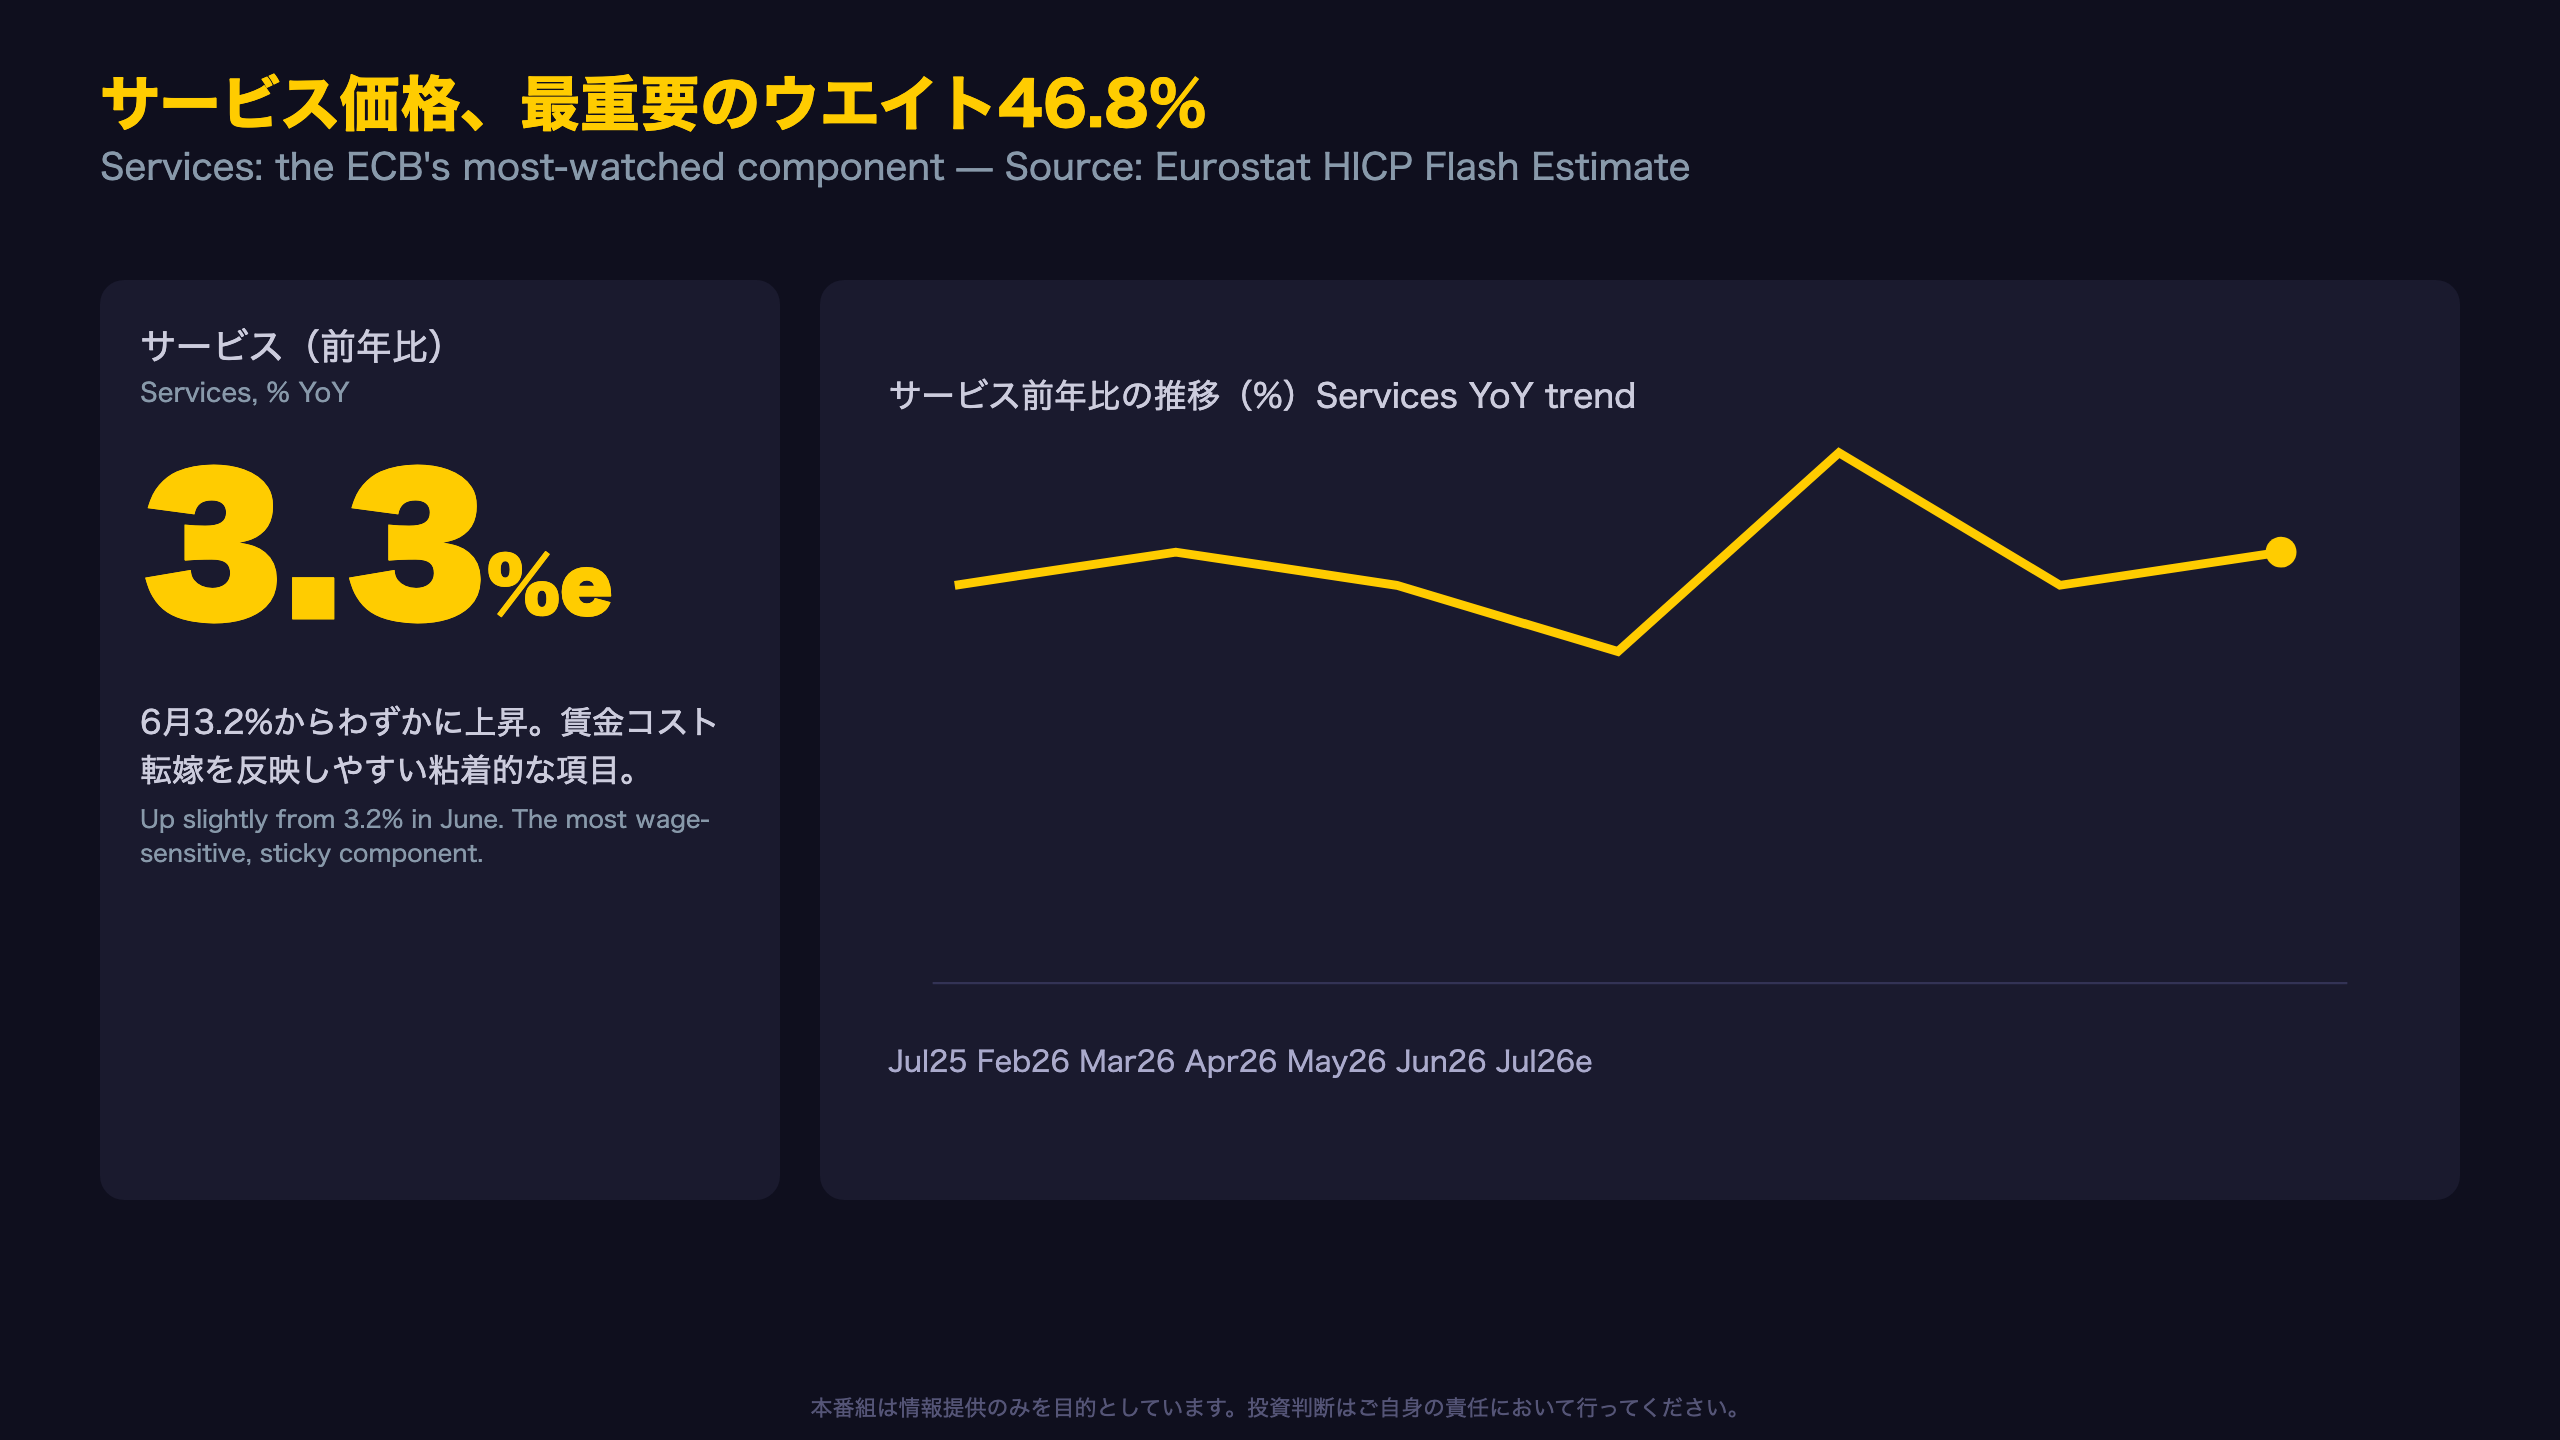
Services carry the largest weight in the HICP basket — 46.8% (468.2 per mille). The release states plainly: “services (3.3%, compared with 3.2% in June).” This matters because services are labor-intensive, so wage growth passes through to services prices more directly than to goods or energy prices — making this the ECB’s preferred proxy for domestically-generated, “sticky” inflation.
Twelve-month range-bound behavior
Over the past year, services inflation has moved within a fairly narrow 3.0%-3.5% band: 3.2% (Jul-25), 3.3% (Feb-26), 3.2% (Mar-26), 3.0% (Apr-26), 3.5% (May-26), 3.2% (Jun-26), and now 3.3% (Jul-26, est.). There is no clear directional break — it looks more like oscillation around a plateau than a fresh acceleration.
A seasonal caveat
The estimated +1.1% month-on-month rise in July could partly reflect summer travel and hospitality demand, a level-C inference given this is a single data point without seasonal adjustment disclosed in the flash release.
Comparison for US-based readers
For context, US investors familiar with the Fed’s “supercore” services-ex-housing measure will recognize the logic: both central banks use a services-based proxy to separate wage-driven inflation from volatile goods and energy swings. A services print holding near 3.3% — well above the 2% target pace — is the kind of number that keeps policymakers cautious about declaring victory on inflation, even as headline momentum fluctuates.
国別インフレ格差、なお大きく ― リトアニア5.6% vs エストニア2.0%
Mapping the divergence
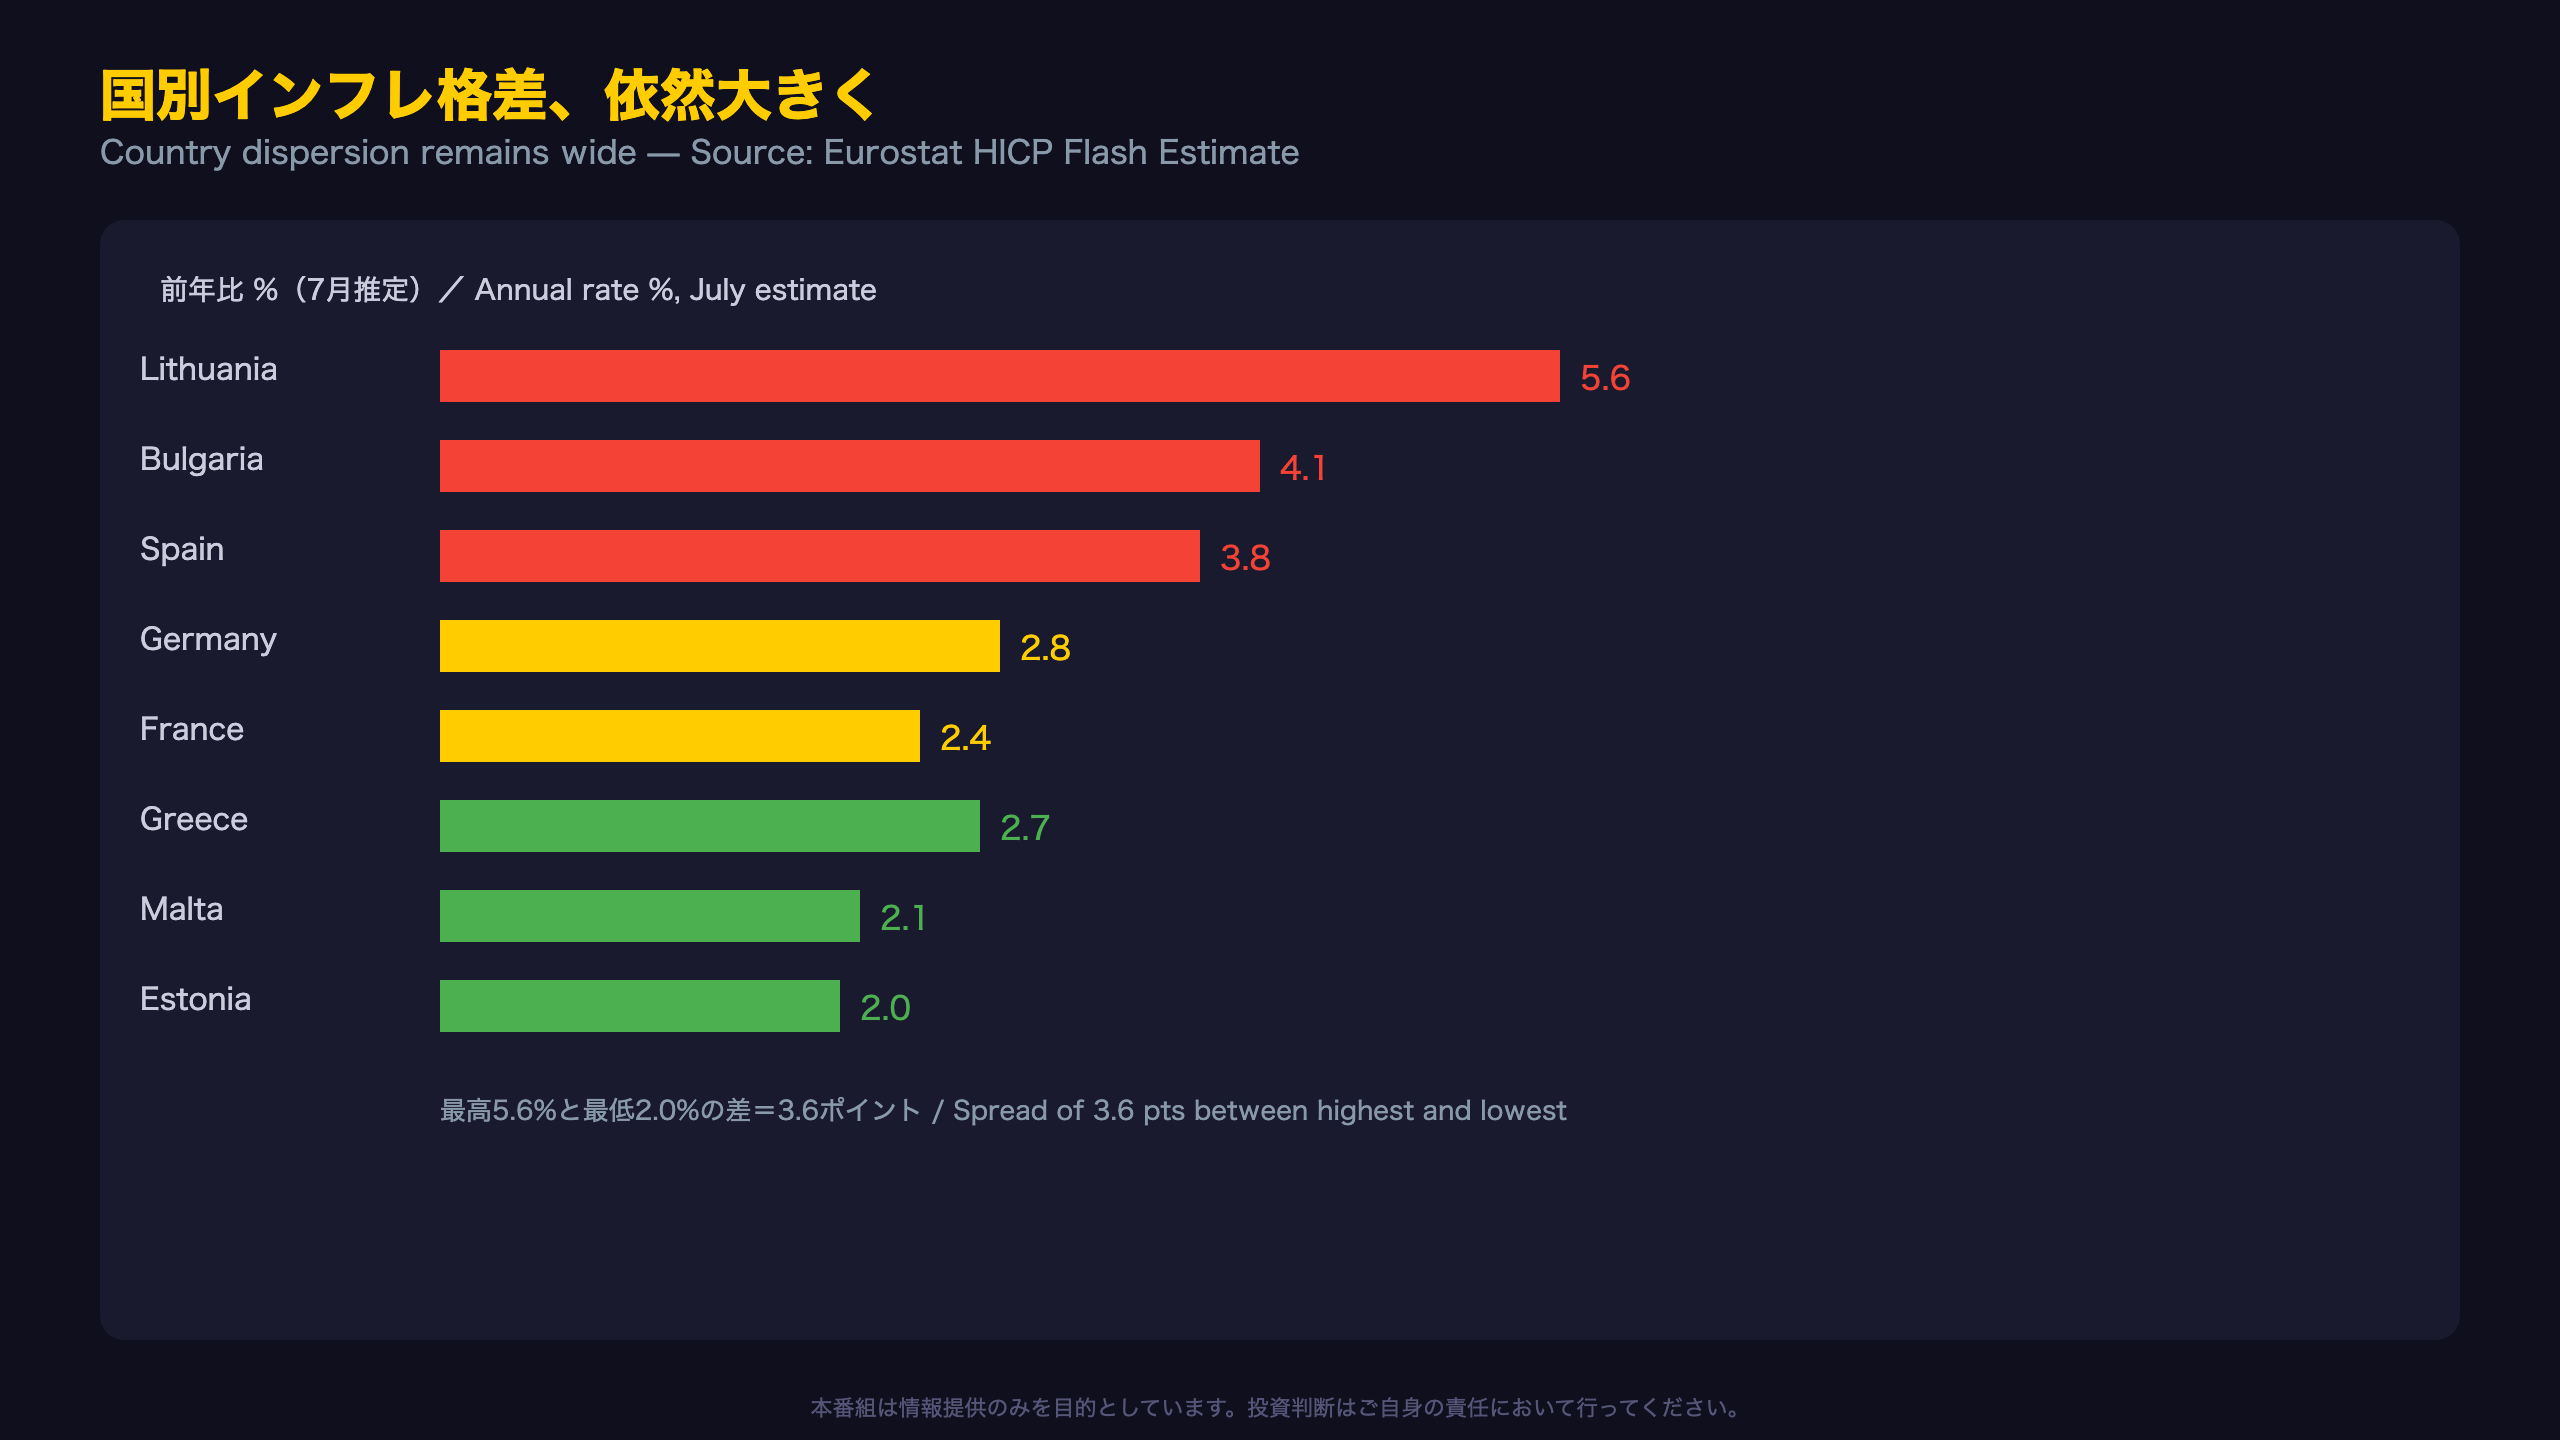
Selected country-level annual rates from the release (June to July, % YoY):
| Country | June | July (est.) | Change |
|---|---|---|---|
| Lithuania | 5.4 | 5.6 | +0.2 |
| Bulgaria | 5.2 | 4.1 | -1.1 |
| Spain | 3.6 | 3.8 | +0.2 |
| Germany | 2.4 | 2.8 | +0.4 |
| France | 2.0 | 2.4 | +0.4 |
| Italy | 3.0 | 2.9 | -0.1 |
| Greece | 3.9 | 2.7 | -1.4 |
| Estonia | 2.0 | 2.0 | 0.0 |
Greece’s outsized swing
Greece’s 1.4-point drop is the largest single move in this month’s country table — a scale of change that warrants some caution about month-to-month noise in a single flash reading (a level-C caveat).
The core-country signal
More notably, both Germany and France — the euro area’s two largest economies — accelerated by 0.4 points each. This is a meaningful signal because these two countries carry the heaviest weight in the aggregate euro area figure.
The ECB’s structural dilemma
The gap between the highest reading (Lithuania, 5.6%) and the lowest (Estonia, 2.0%) is 3.6 percentage points. This is the perennial challenge of a currency union: the ECB sets one policy rate for 20 economies with meaningfully different inflation cycles — similar in spirit to the debate around regional Fed policy in the US, but structurally more acute since euro area members are sovereign nations, not Fed districts within one country.
ECB政策とEUR相場への含意
Tracing the chain of evidence
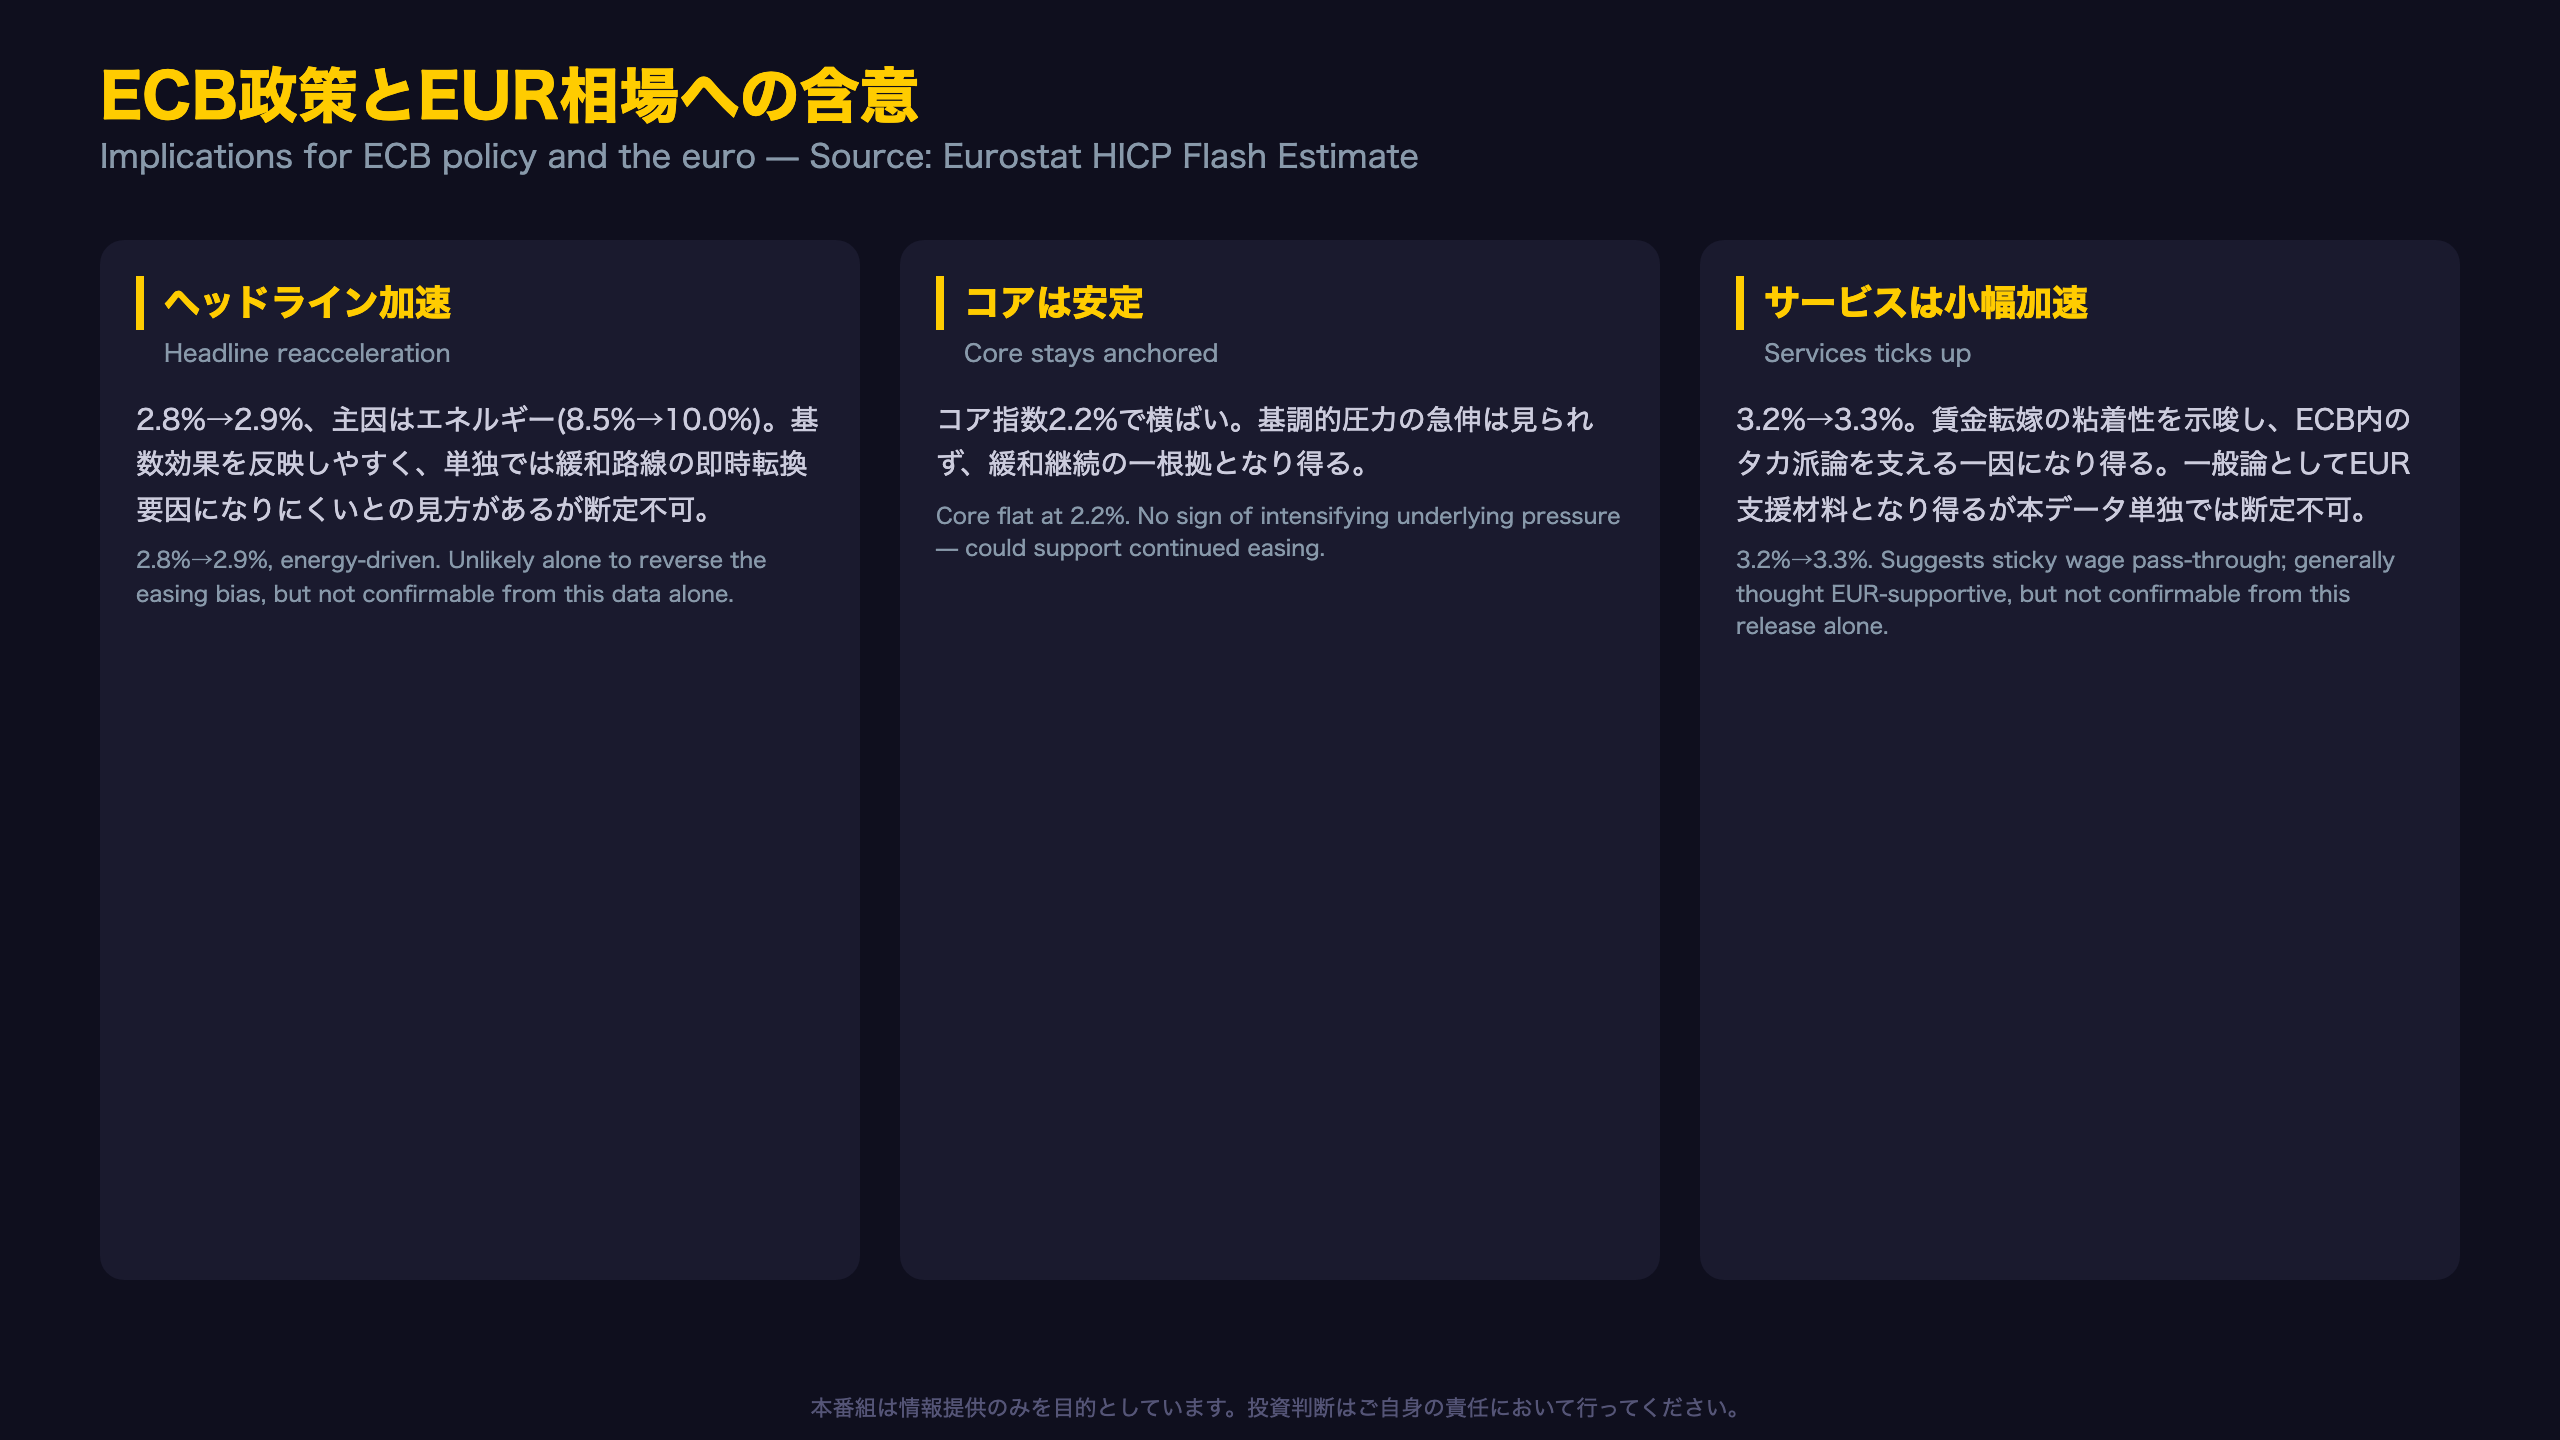
Chain 1: Headline HICP rose from 2.8% to 2.9%, driven mainly by energy (8.5% → 10.0%) → Energy price swings often reflect base effects and commodity market moves that central banks tend to look through when setting policy → This suggests the headline surprise alone may not be enough to meaningfully dent rate-cut expectations, though this cannot be confirmed from this release alone.
Chain 2: Core inflation held flat at 2.2% → This suggests underlying price pressure has not intensified sharply → It could support the case for the ECB continuing its easing bias, though this is a general inference, not something this single data point can confirm on its own.
Chain 3: Services inflation ticked up from 3.2% to 3.3% → This is the component most exposed to wage cost pass-through → It could reinforce hawkish caution within the ECB’s Governing Council, though a single month’s modest move warrants care before drawing firm conclusions.
What to watch next
The full, confirmed dataset for July arrives on August 19, 2026. Key questions: will the energy and services figures be revised up or down, and can core inflation hold near 2.2% in the August flash estimate (due late August)?
For FX and rates market participants
Generally, an inflation upside surprise paired with a more hawkish policy repricing is thought to be euro-supportive, and a stable-to-softer core reading is thought to keep the door open for ECB easing — but this release, taken alone, cannot confirm either direction for EUR/USD or EUR/JPY. Position sizing and directional calls should wait for confirmation from subsequent data, including the August 19 final release and any ECB commentary.
Disclaimer: This article is for informational purposes only. All investment decisions are made solely at your own risk.