📺 Watch the Full Video Analysis
This article was automatically generated by the NFC Market Live AI analysis system. (Updated: 2026-07-31 08:51 JST)
📄 Primary Source
総務省統計局
https://www.stat.go.jp/data/roudou/sokuhou/tsuki/pdf/gaiyou.pdf
Japan’s Statistics Bureau released the June 2026 Labor Force Survey.
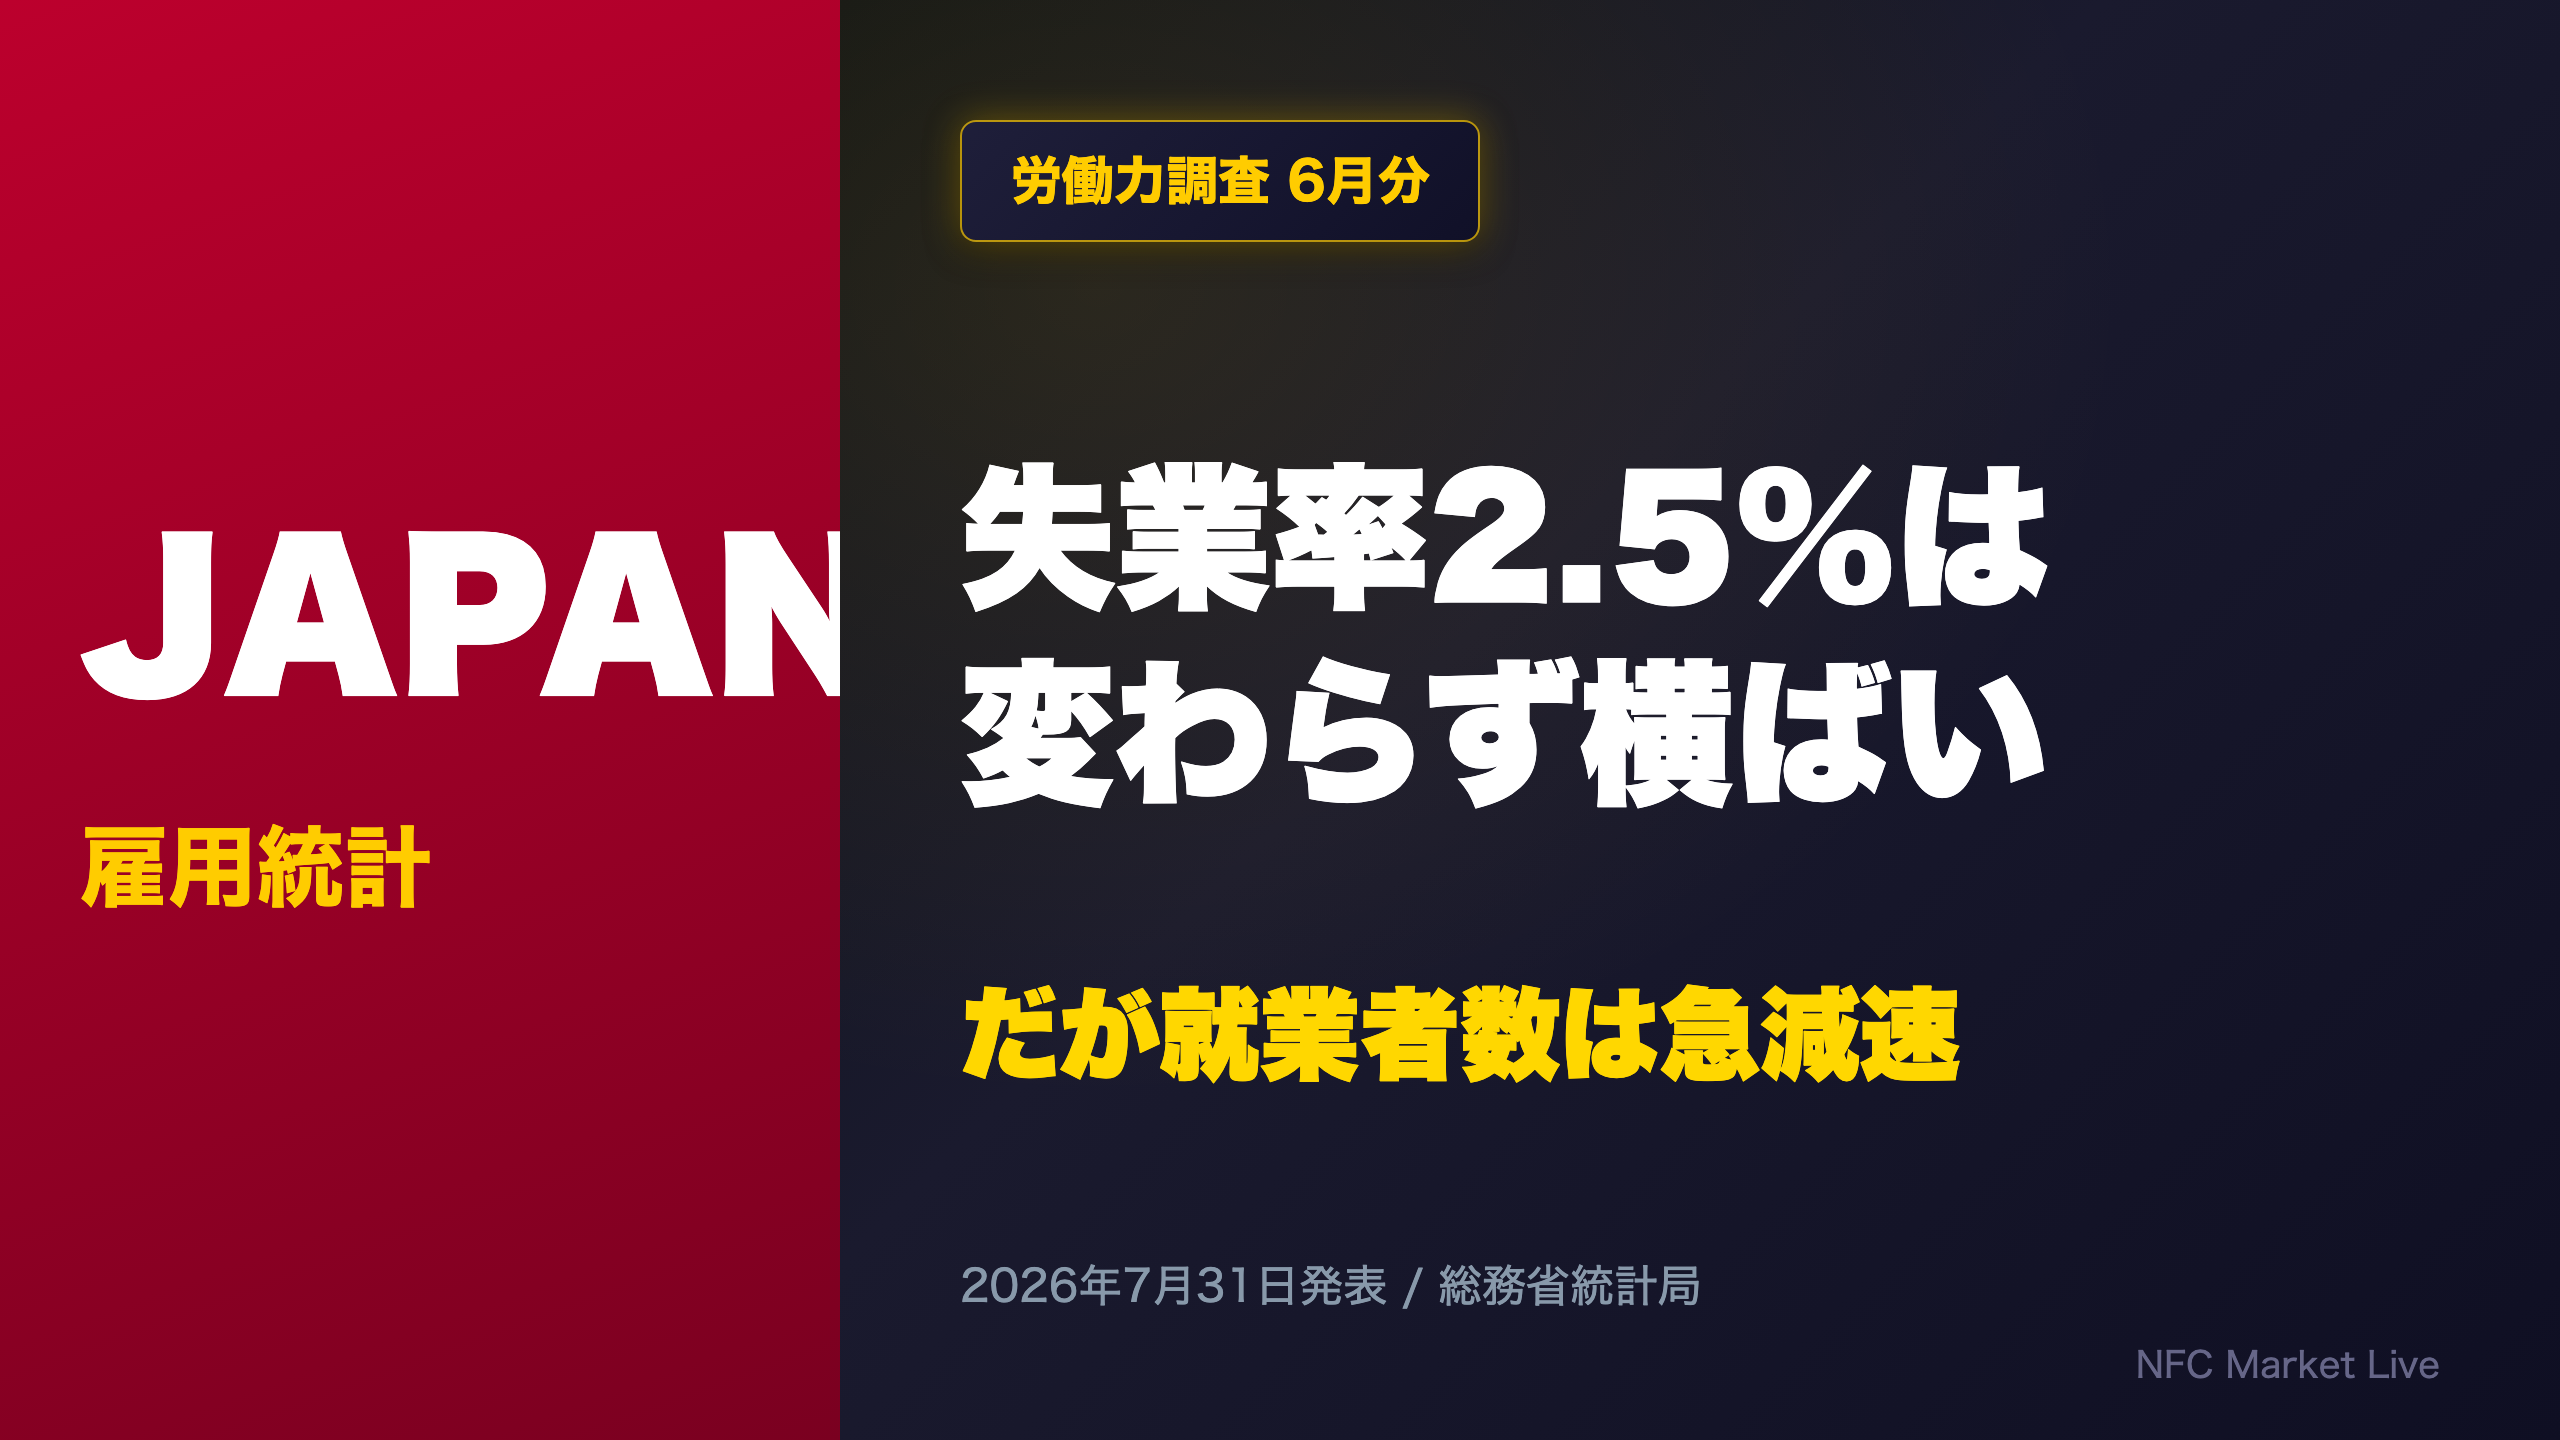
📊 The seasonally adjusted unemployment rate held at 2.5% for a 7th straight month, reflecting historically tight labor conditions.
But cracks are emerging.
📉 Seasonally adjusted employment fell -360K month-on-month, and the hospitality sector — long a symbol of labor shortage — reversed into decline.
💡 Regular employment extended its 32-month growth streak, while the non-labor-force population surged +430K.
⚠️ We break down what this means for the BOJ’s rate path and Japan markets.
The Ultimate Summary:高原の失業率と急減速する内実
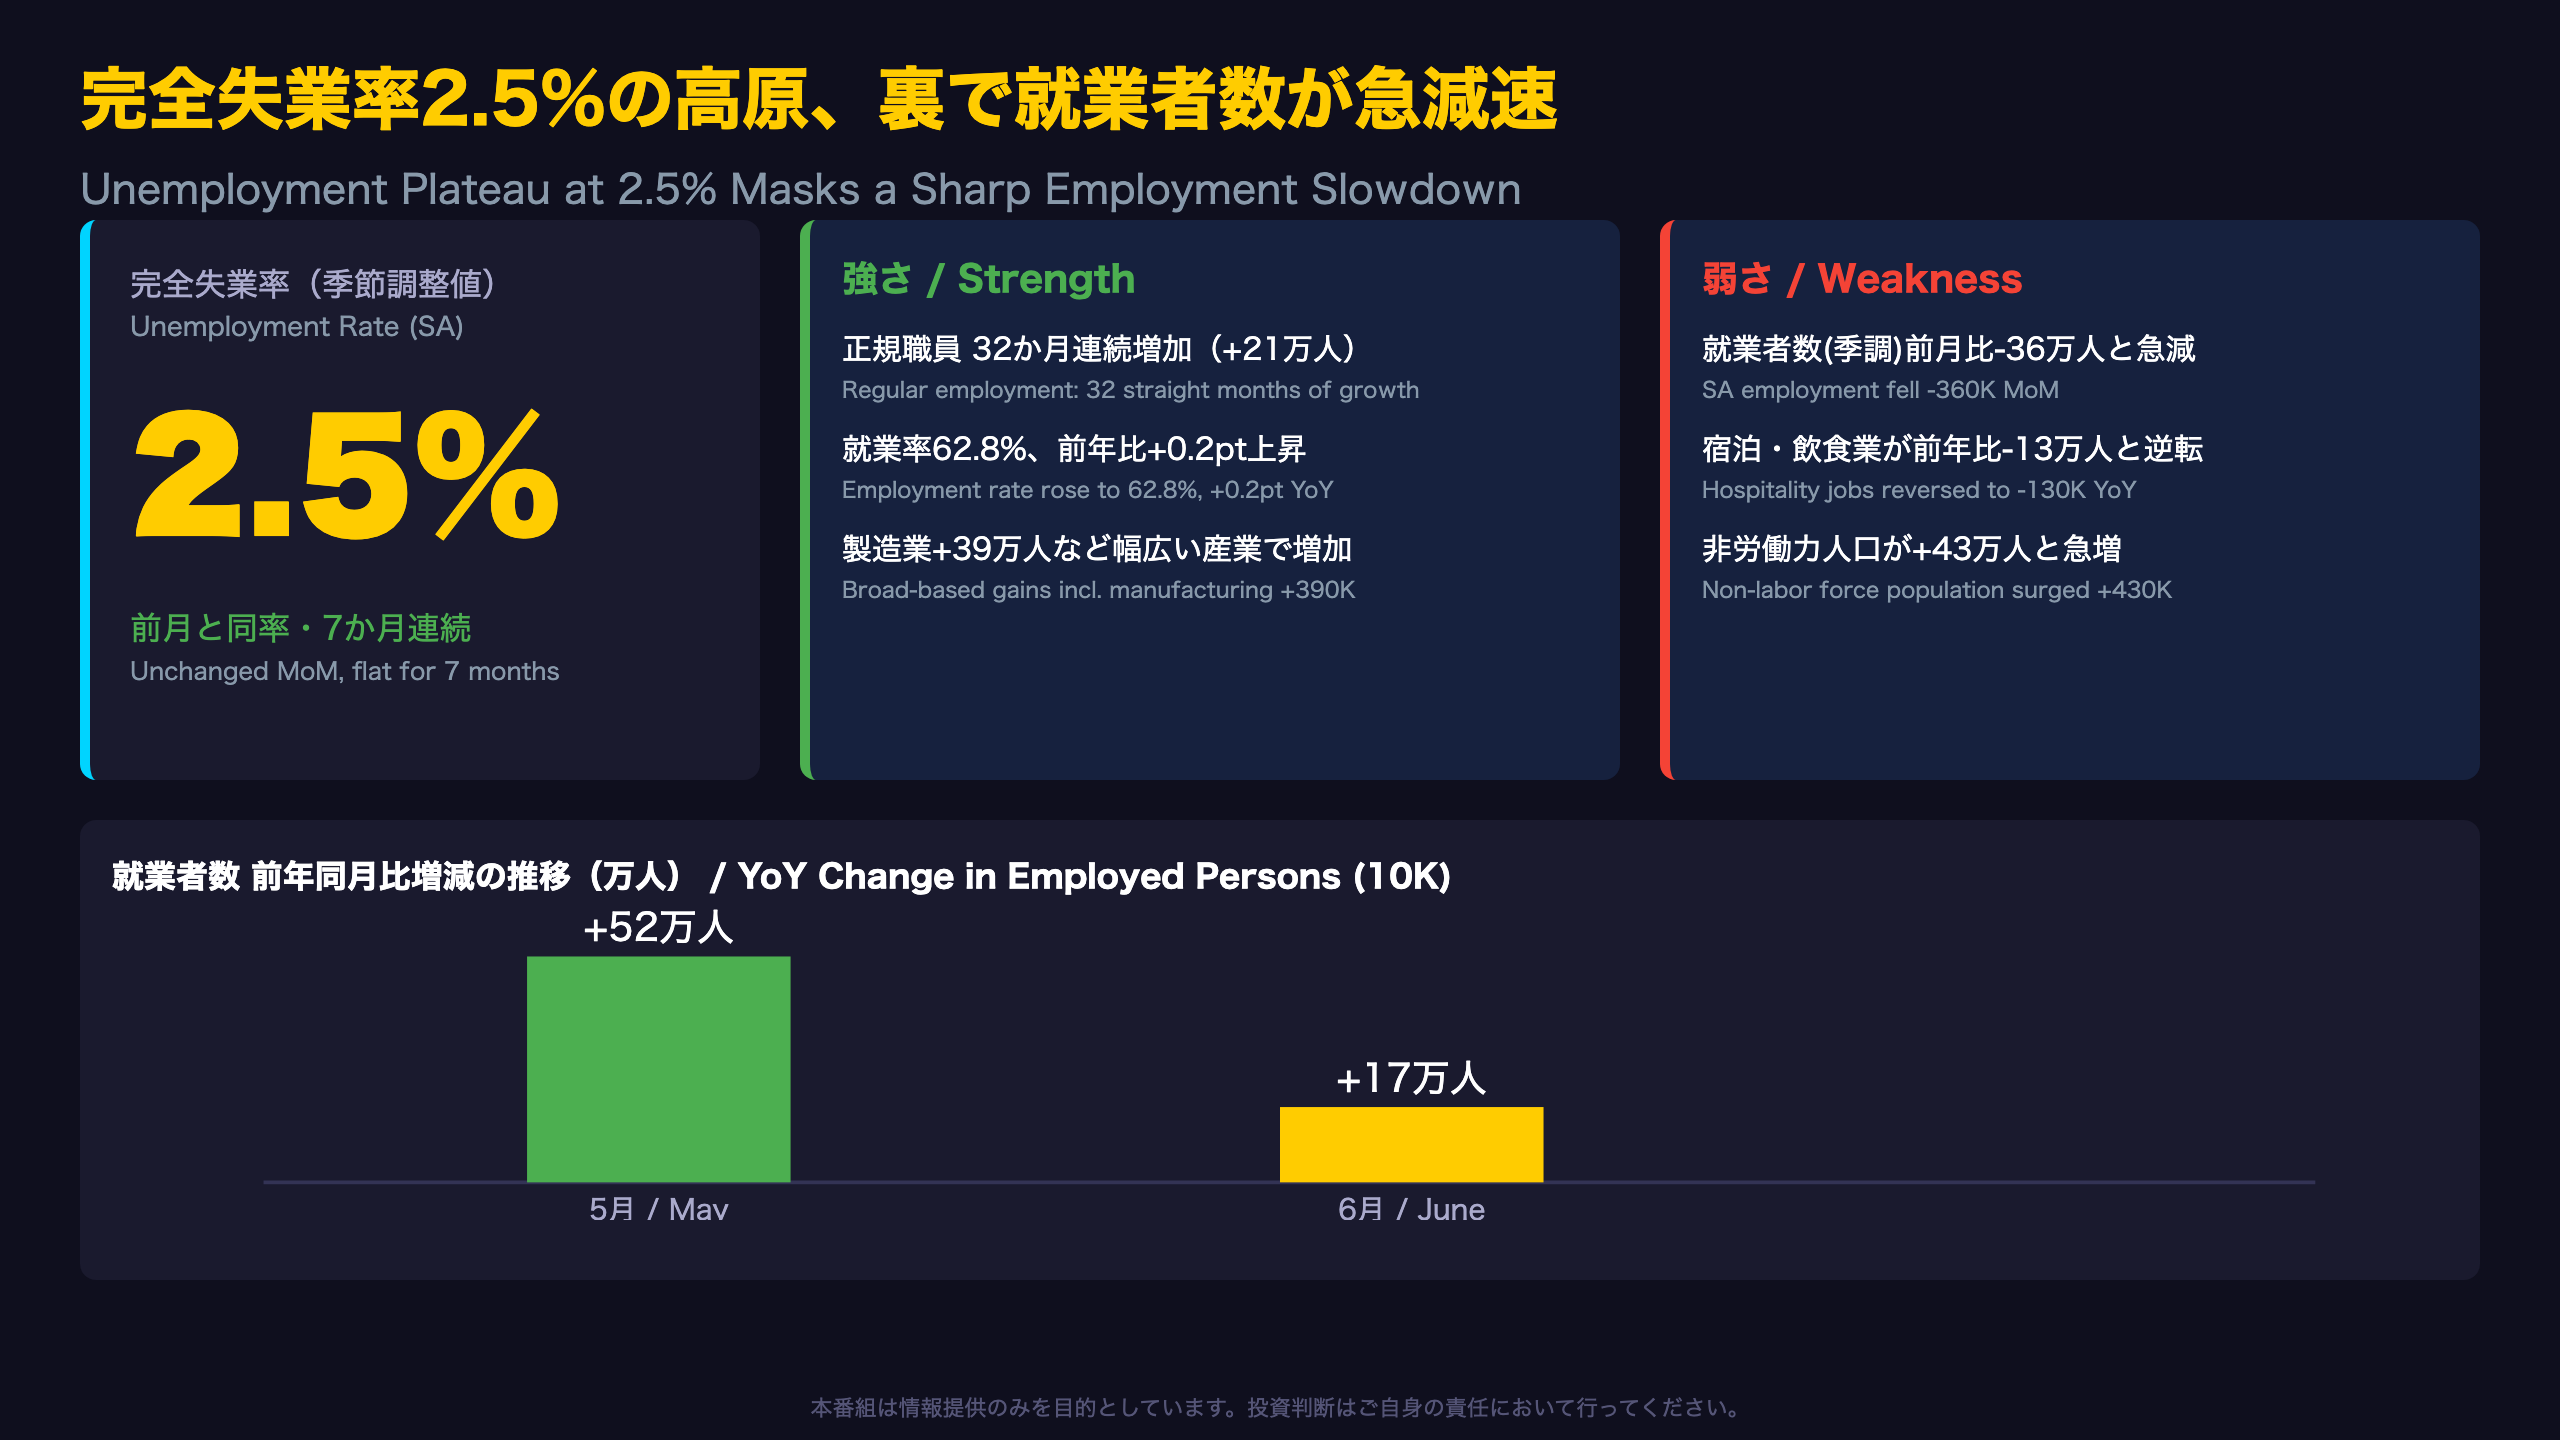
Japan’s Labor Market: A Plateau With Cracks Beneath the Surface
Japan’s seasonally adjusted unemployment rate has held in a narrow 2.4%-2.7% band since December 2025, effectively plateauing around 2.5% for seven consecutive months. However, the June 2026 Labor Force Survey, published by Japan’s Ministry of Internal Affairs and Communications (Statistics Bureau), reveals a notable deceleration beneath this headline stability.
The report states: employed persons (seasonally adjusted) fell to 68.46 million, down 360,000 month-on-month (-0.5%), while employees fell 160,000 (-0.3%). This is a sharp reversal from May, when employed persons rose 60,000.
A structural signal or noise?
Accommodation and food services — long considered ground zero for Japan’s labor shortage — saw employment fall 130,000 year-on-year (-4.7%), reversing May’s +200,000 gain. If sustained, this could signal easing wage pressure in a sector central to Japan’s services inflation story.
Meanwhile, those citing ‘employer circumstances’ for job loss rose 30,000 year-on-year to 220,000, a shift from prior flat readings, hinting at early-stage labor demand softening (a Level C inference only).
Market implications
BOJ policymakers have repeatedly cited labor market tightness as a precondition for the ‘virtuous cycle’ needed to justify further rate hikes, much as the Fed watches non-farm payrolls. A deceleration here, even if unconfirmed, could inject caution into near-term hawkish BOJ bets, with markets likely awaiting the July release (due August 28) before repricing yen rate expectations.
強さ:正規雇用32か月連続増と広範な産業需要
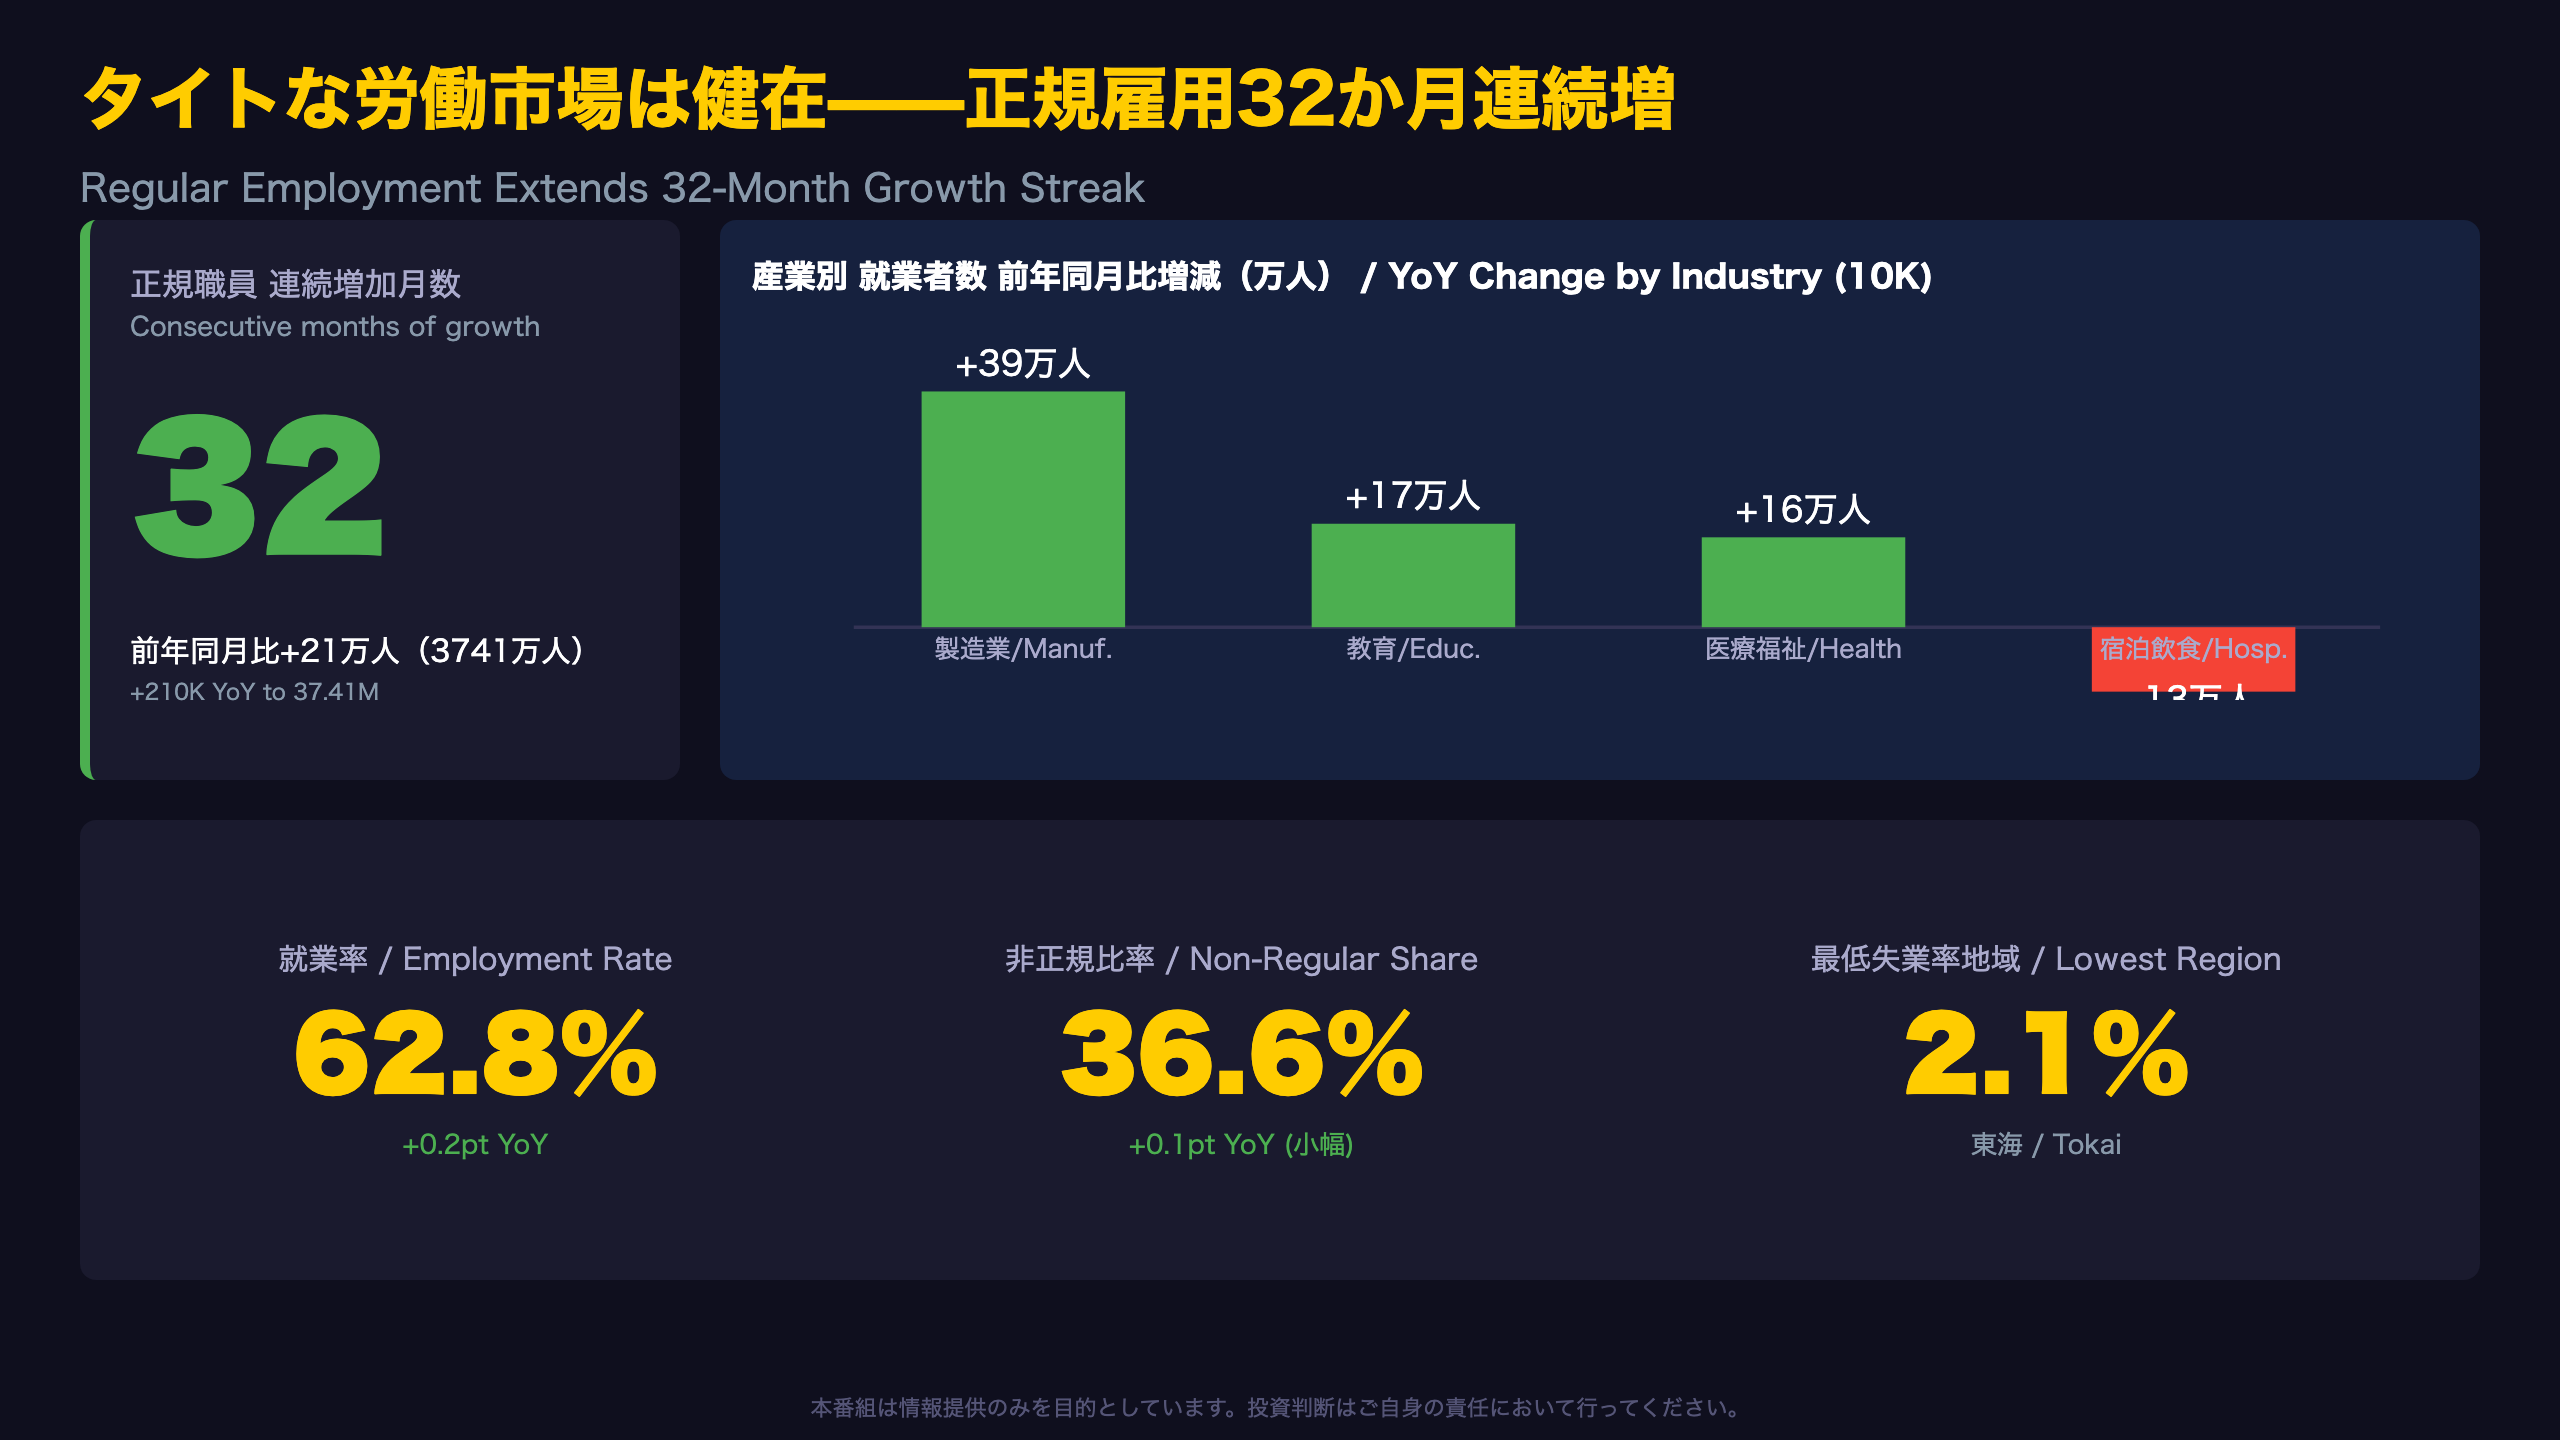
Why ’32 Straight Months’ of Regular Employment Growth Matters
The fact that Japan’s regular employees (seishain) have risen year-on-year for 32 consecutive months reflects a structural shift where firms have been converting part-time and temporary workers into permanent staff — a trend showing no sign of reversing.
The release states: ‘the share of non-regular employees among employees excluding executives was 36.6%, up just 0.1 percentage point year-on-year’ — a remarkably small increase versus the pre-2023 trend of rising non-regular share.
Broad-based sectoral demand
Manufacturing posted the largest employment gain among major industries (+390,000 YoY, +3.8%), a data point relevant for investors tracking Japan’s manufacturing PMI and export orders (Level C inference on production strength). Education (+170,000) and healthcare/welfare (+160,000) also grew steadily, indicating broad-based labor demand.
Regional dispersion
Quarterly regional data (April-June average) shows Tokai at just 2.1% unemployment — the tightest in Japan — versus Okinawa at 3.4%, the loosest. Even core economic regions like Southern Kanto (2.7%) remain near historic tightness.
Forward look
Whether this regular-employment growth streak survives the broader June deceleration will be a key focus of the July release (due August 28), a useful benchmark comparable to how U.S. investors watch the JOLTS quits rate for labor market confidence.
弱さ:季節調整値ベースの急ブレーキ
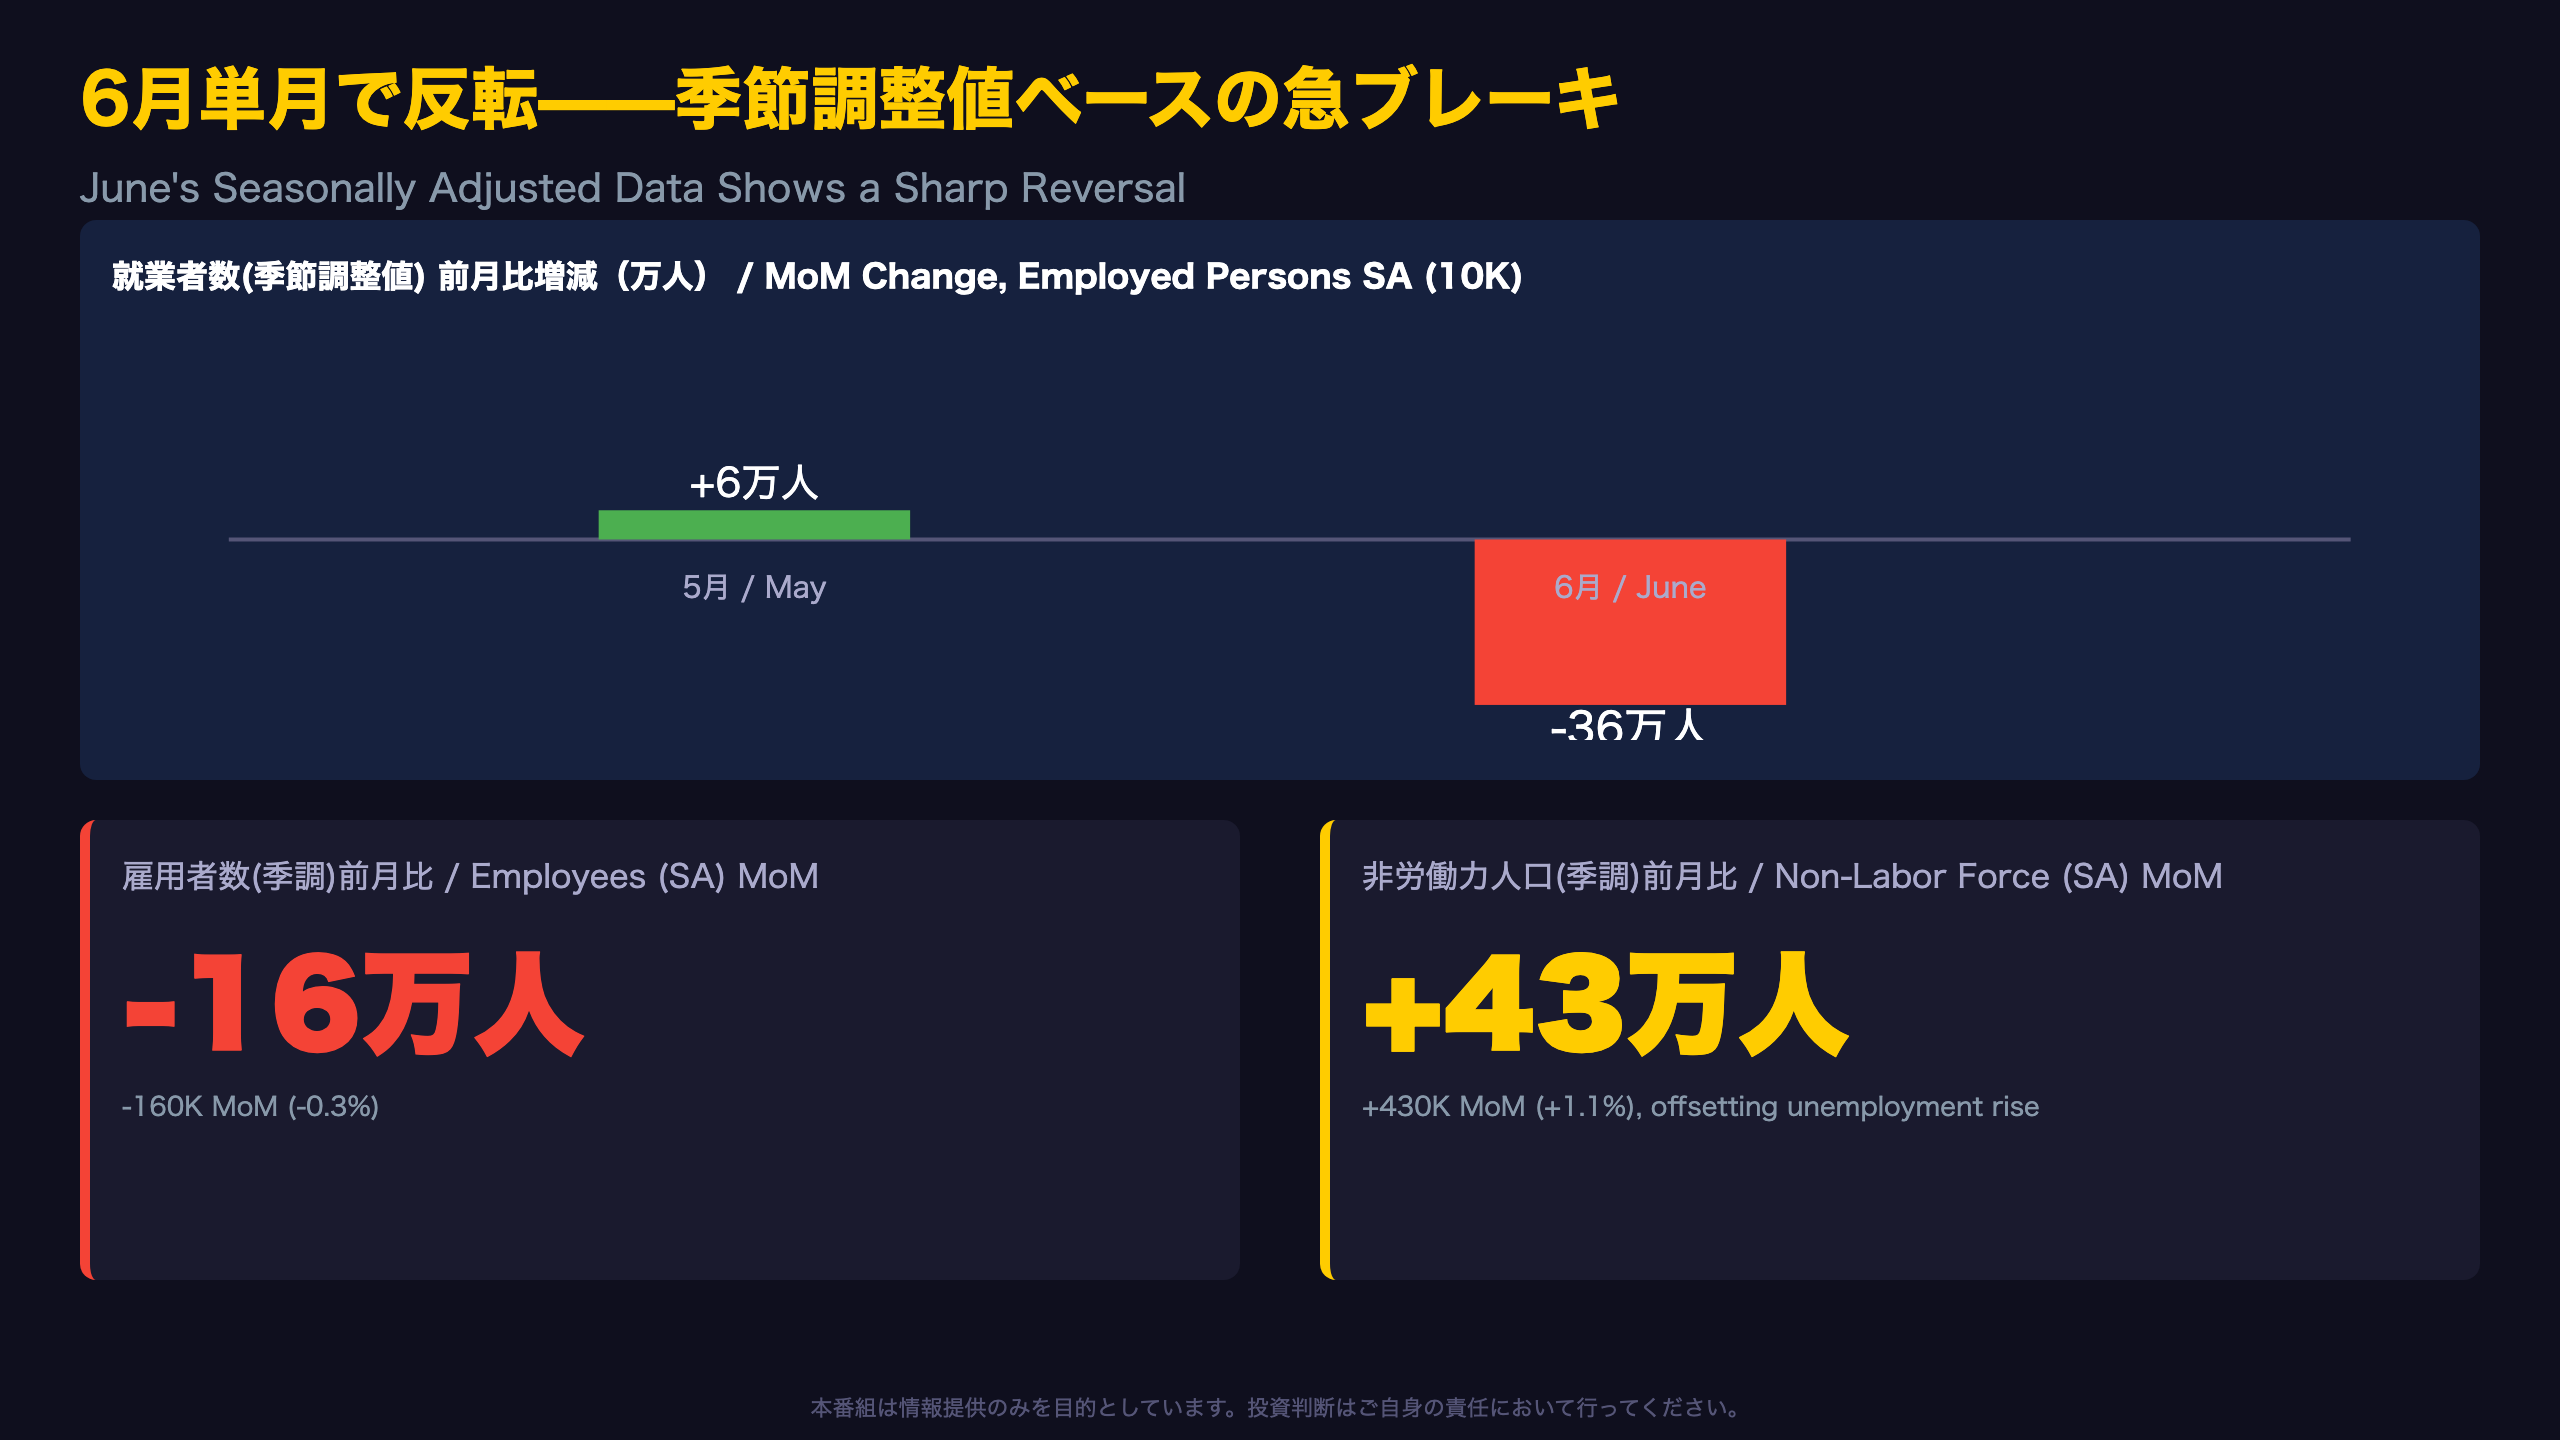
Behind the ‘Quiet’ Unemployment Rate: A Sharp Deceleration
Looking at the headline unemployment rate alone, Japan’s labor market appears unchanged. But the seasonally adjusted employment components tell a very different story.
The release states: ‘employed persons stood at 68.46 million, down 360,000 (-0.5%) from the previous month’ and ‘employees stood at 62.22 million, down 160,000 (-0.3%).’ This is a striking reversal from May, when employed persons rose 60,000 month-on-month.
Why the unemployment rate didn’t move
Despite falling employment, the unemployment rate held steady because the non-labor-force population — those neither working nor actively seeking work — jumped 430,000 (+1.1%) to 39.39 million. This likely offset what would otherwise have been a more visible rise in unemployment (a Level B inference, as two indicators point the same direction), comparable to how declining U.S. labor force participation can mask headline unemployment moves.
How unusual is this move?
Japan’s seasonally adjusted employment series is historically volatile month-to-month, so a single month’s -360K reading does not necessarily confirm a trend reversal. However, a decline of this magnitude has not been seen in the trailing twelve months based on the data presented.
What to watch next
The July release (due August 28) will be critical: a rebound would support the ‘noise’ interpretation, while a second consecutive decline would strengthen the case that Japan’s labor market tightness is beginning to loosen.
産業別診断:宿泊・飲食業の逆転と非正規雇用の減速
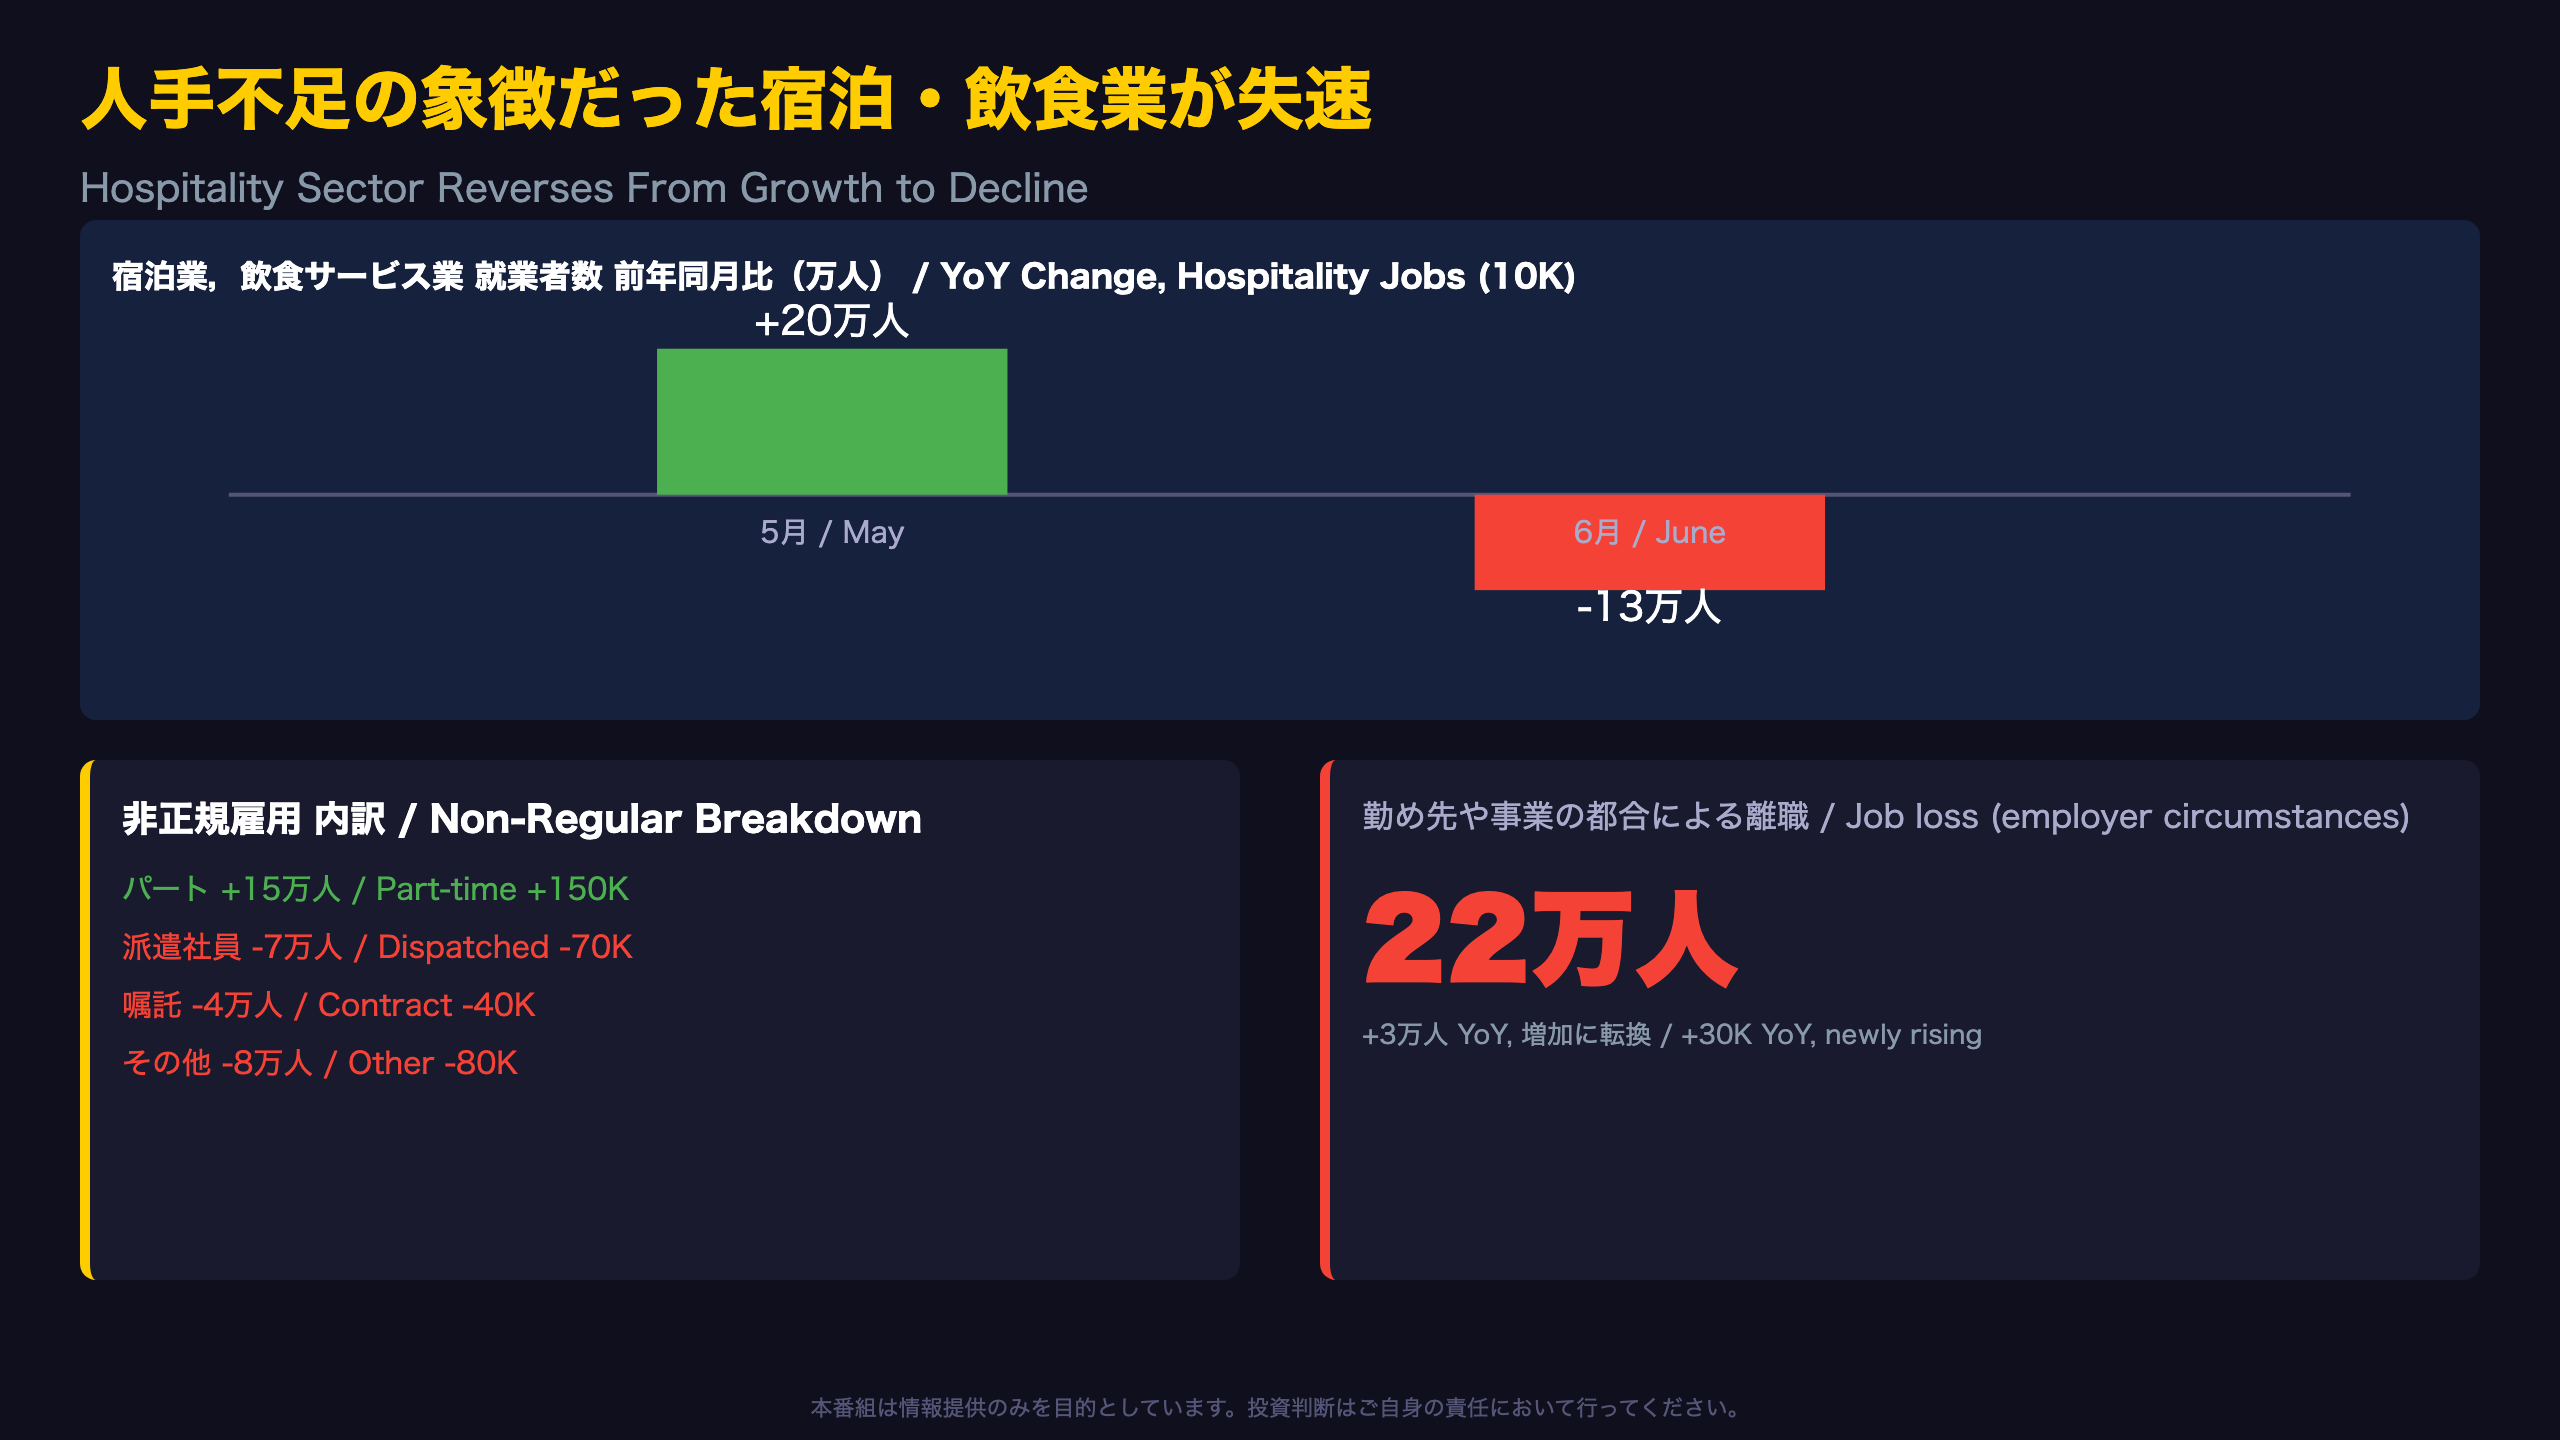
Is the Hotel & Restaurant Sector Reversal Temporary or Structural?
The report explicitly attributes June’s gains to ‘manufacturing,’ ‘education,’ and ‘healthcare and welfare’ — while accommodation and food services posted a sharp -130,000 YoY decline (-4.7%). This is a striking reversal given the same sector added +200,000 jobs in May, one of the key drivers of that month’s overall employment growth.
Several single-month factors could explain this — inbound tourism seasonality, post-peak hiring adjustments, or data noise (Level C inference, no specific cause stated in the report). However, this sector has been a bellwether for Japan’s services-sector labor shortage and a key transmission channel for services price inflation, comparable to how U.S. leisure & hospitality payrolls are watched for wage signals.
Employment type composition
Non-regular employees rose to 21.57 million (+200,000 YoY, +0.9%), extending a three-month growth streak. However, the composition is mixed: ‘part-time’ workers rose +150,000, while ‘dispatched temporary staff’ fell -70,000, ‘contract-based (shokutaku)’ fell -40,000, and ‘other’ categories fell -80,000 — indicating uneven dynamics, not uniform expansion.
Reasons for leaving jobs
Those unemployed due to ‘employer circumstances’ rose to 220,000, up 30,000 YoY — a small but notable shift from prior flat readings. Meanwhile, voluntary resignations fell to 750,000, down 40,000 YoY, suggesting some cooling in job-switching activity.
What to watch
Whether the hospitality sector’s decline persists or reverses in the July data will be an important signal for the broader services labor shortage narrative.
労働供給の別視点:非労働力人口急増と年齢階級別の特異点
What the Surge in Non-Labor-Force Population Really Means
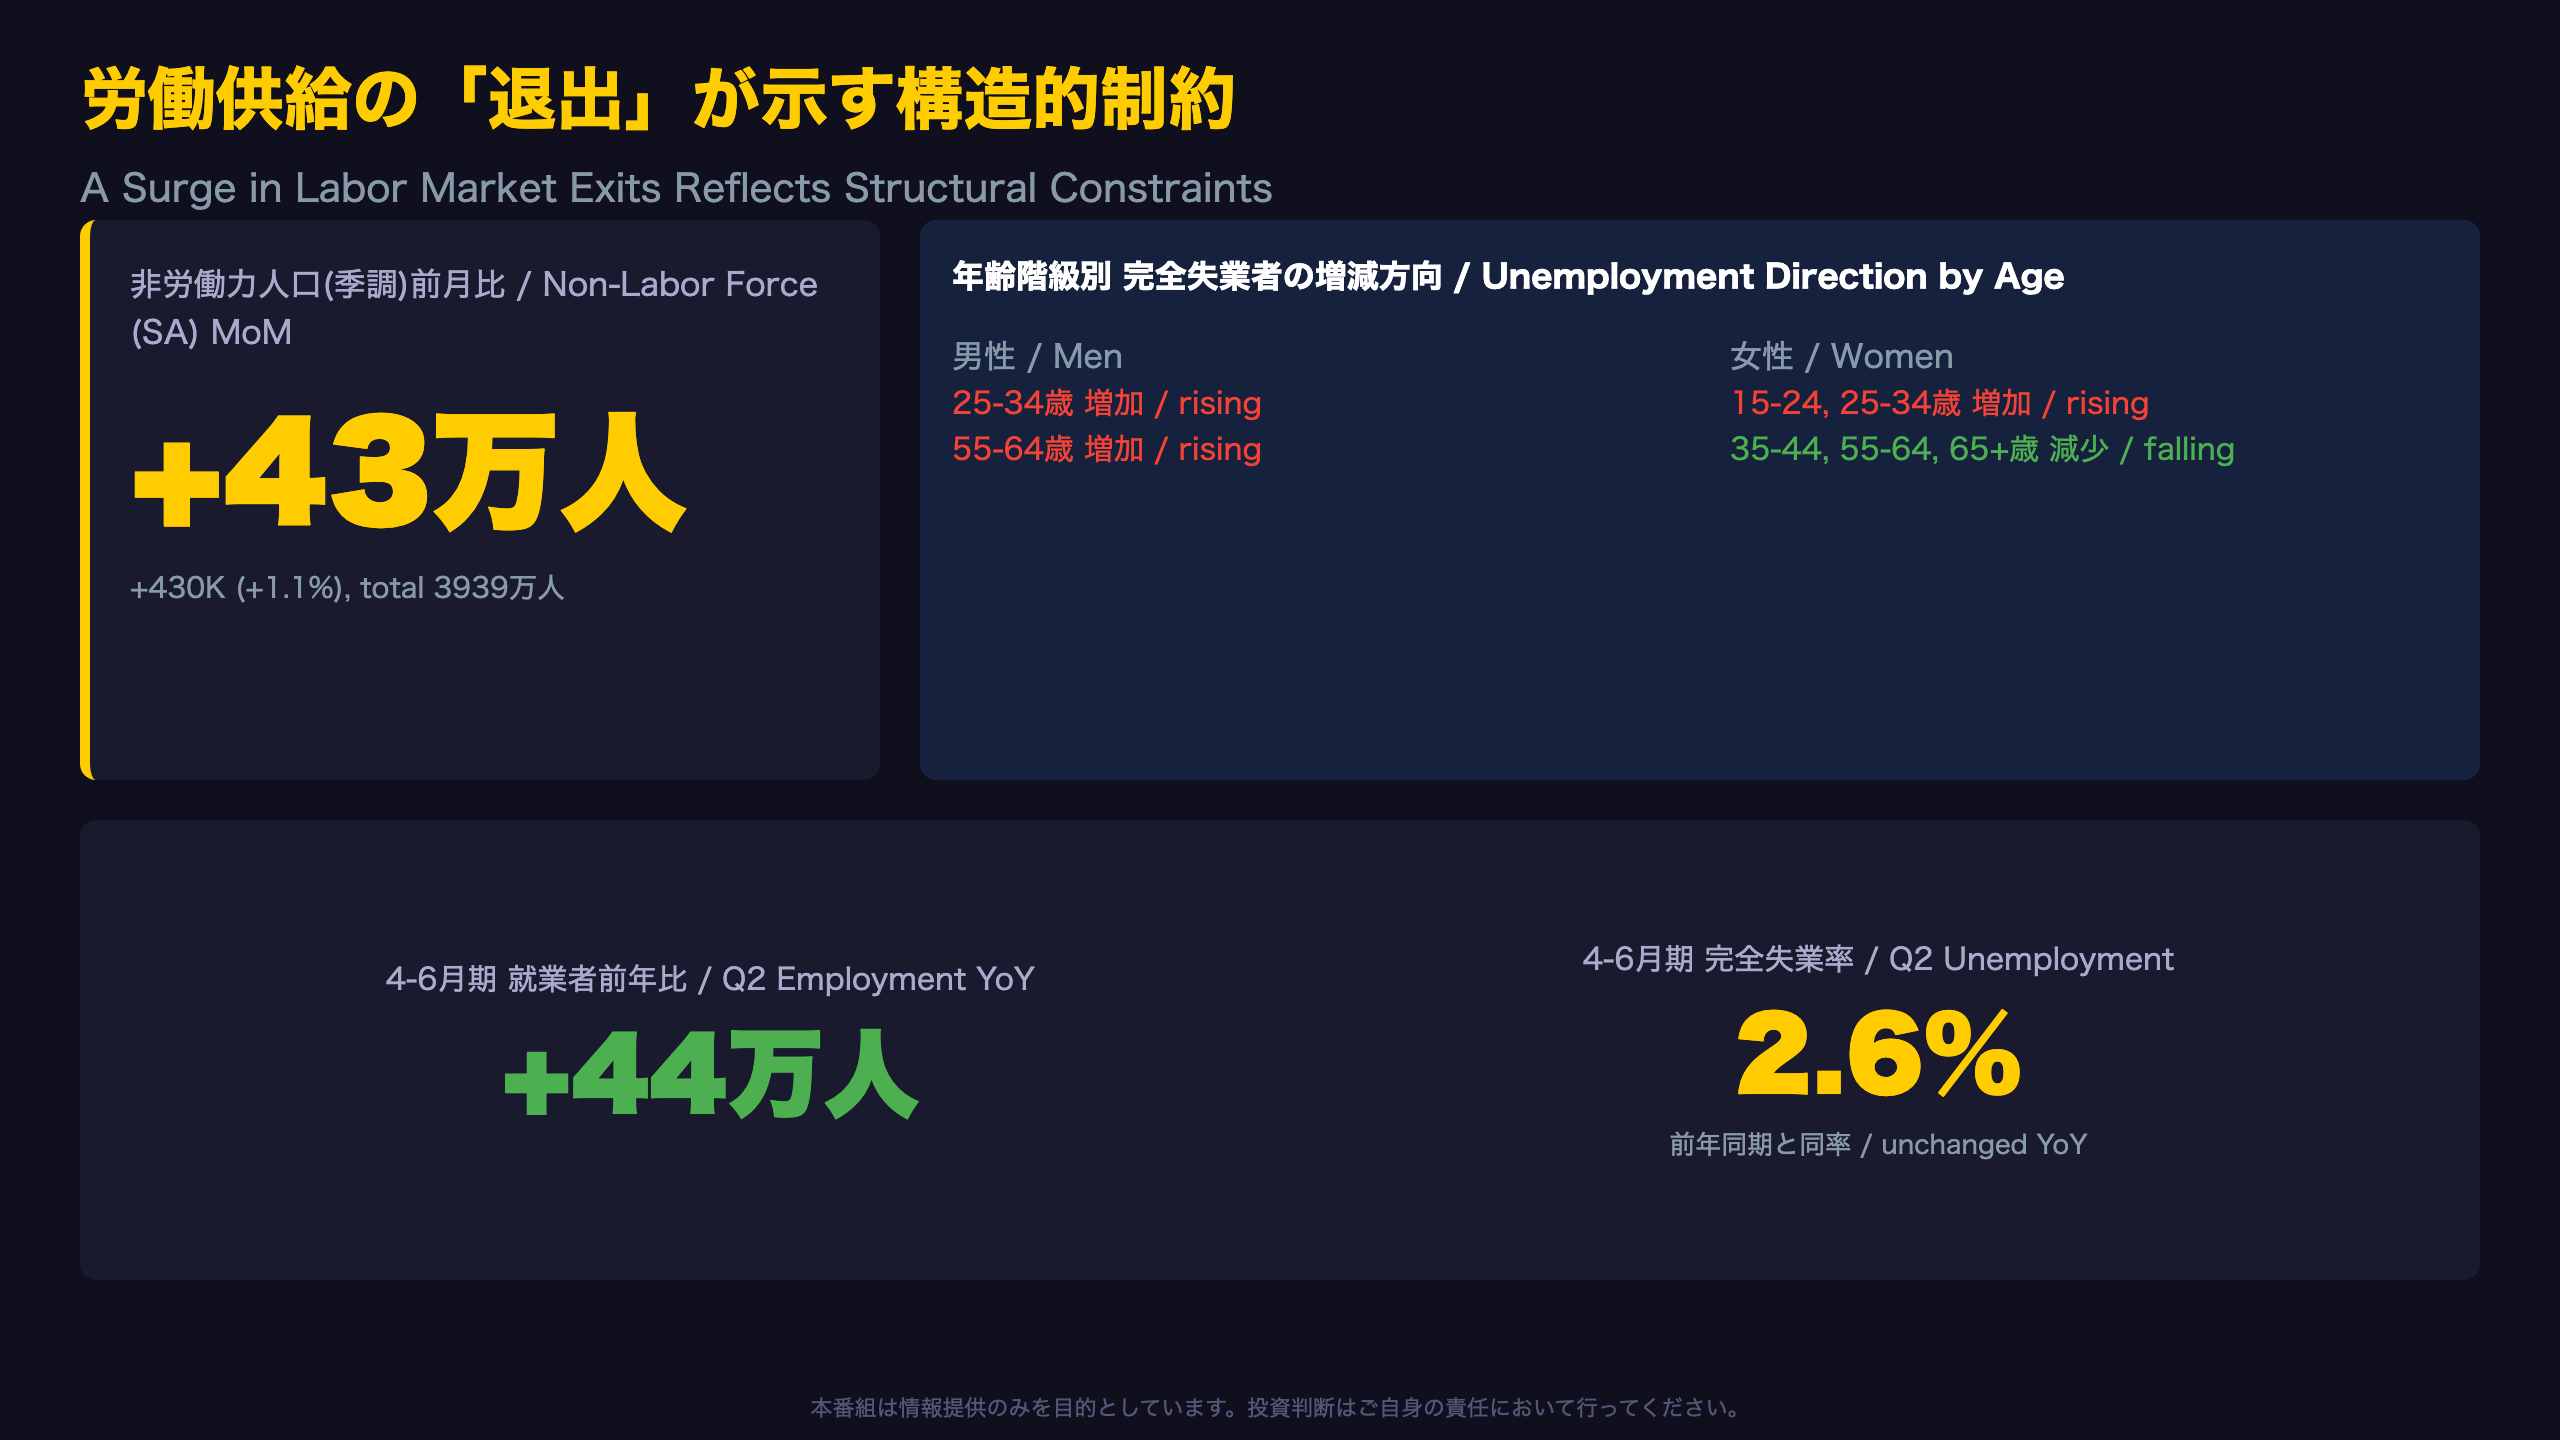
The report states: ‘the non-labor force population stood at 39.39 million, up 430,000 (1.1%) from the previous month’ — one of the most pronounced single-month shifts in this release, directly linked to the declines in employed and unemployed persons discussed elsewhere.
Japan’s ‘non-labor force population’ (hi-rodoryoku jinko) refers to those aged 15+ who are neither employed nor actively job-seeking — a category including students, homemakers, retirees, and discouraged workers. A sharp rise suggests more people have exited the labor market altogether, a distinction similar to the U.S. debate around labor force participation versus headline unemployment.
Divergence by age and gender
Per the age breakdown, male unemployment rose in the 25-34 and 55-64 age brackets, while female unemployment rose among 15-24 and 25-34 year-olds but declined among 35-44, 55-64, and 65+ groups. The decline in unemployment among older women is noteworthy, potentially reflecting continued gains in senior female labor force participation (Level B inference from converging data points).
The quarterly perspective smooths the noise
Averaging over the April-June quarter provides a steadier read: ‘employed persons totaled 68.8 million, up 440,000 year-on-year’ and ‘the unemployment rate (unadjusted) was 2.6%, unchanged year-on-year.’ This suggests Japan’s labor market continues a gradual expansion, and June’s sharp single-month deceleration may prove a temporary deviation.
The structural backdrop
The rise in non-labor-force population also intersects with Japan’s longer-term decline in the working-age population — a structural constraint distinct from short-term cyclical noise.
インプリケーション:日銀は「様子見継続」を正当化
Chain-of-Reasoning: What This Means for the BOJ and Markets
Let’s walk through the data using a fact → mechanism → market implication framework.
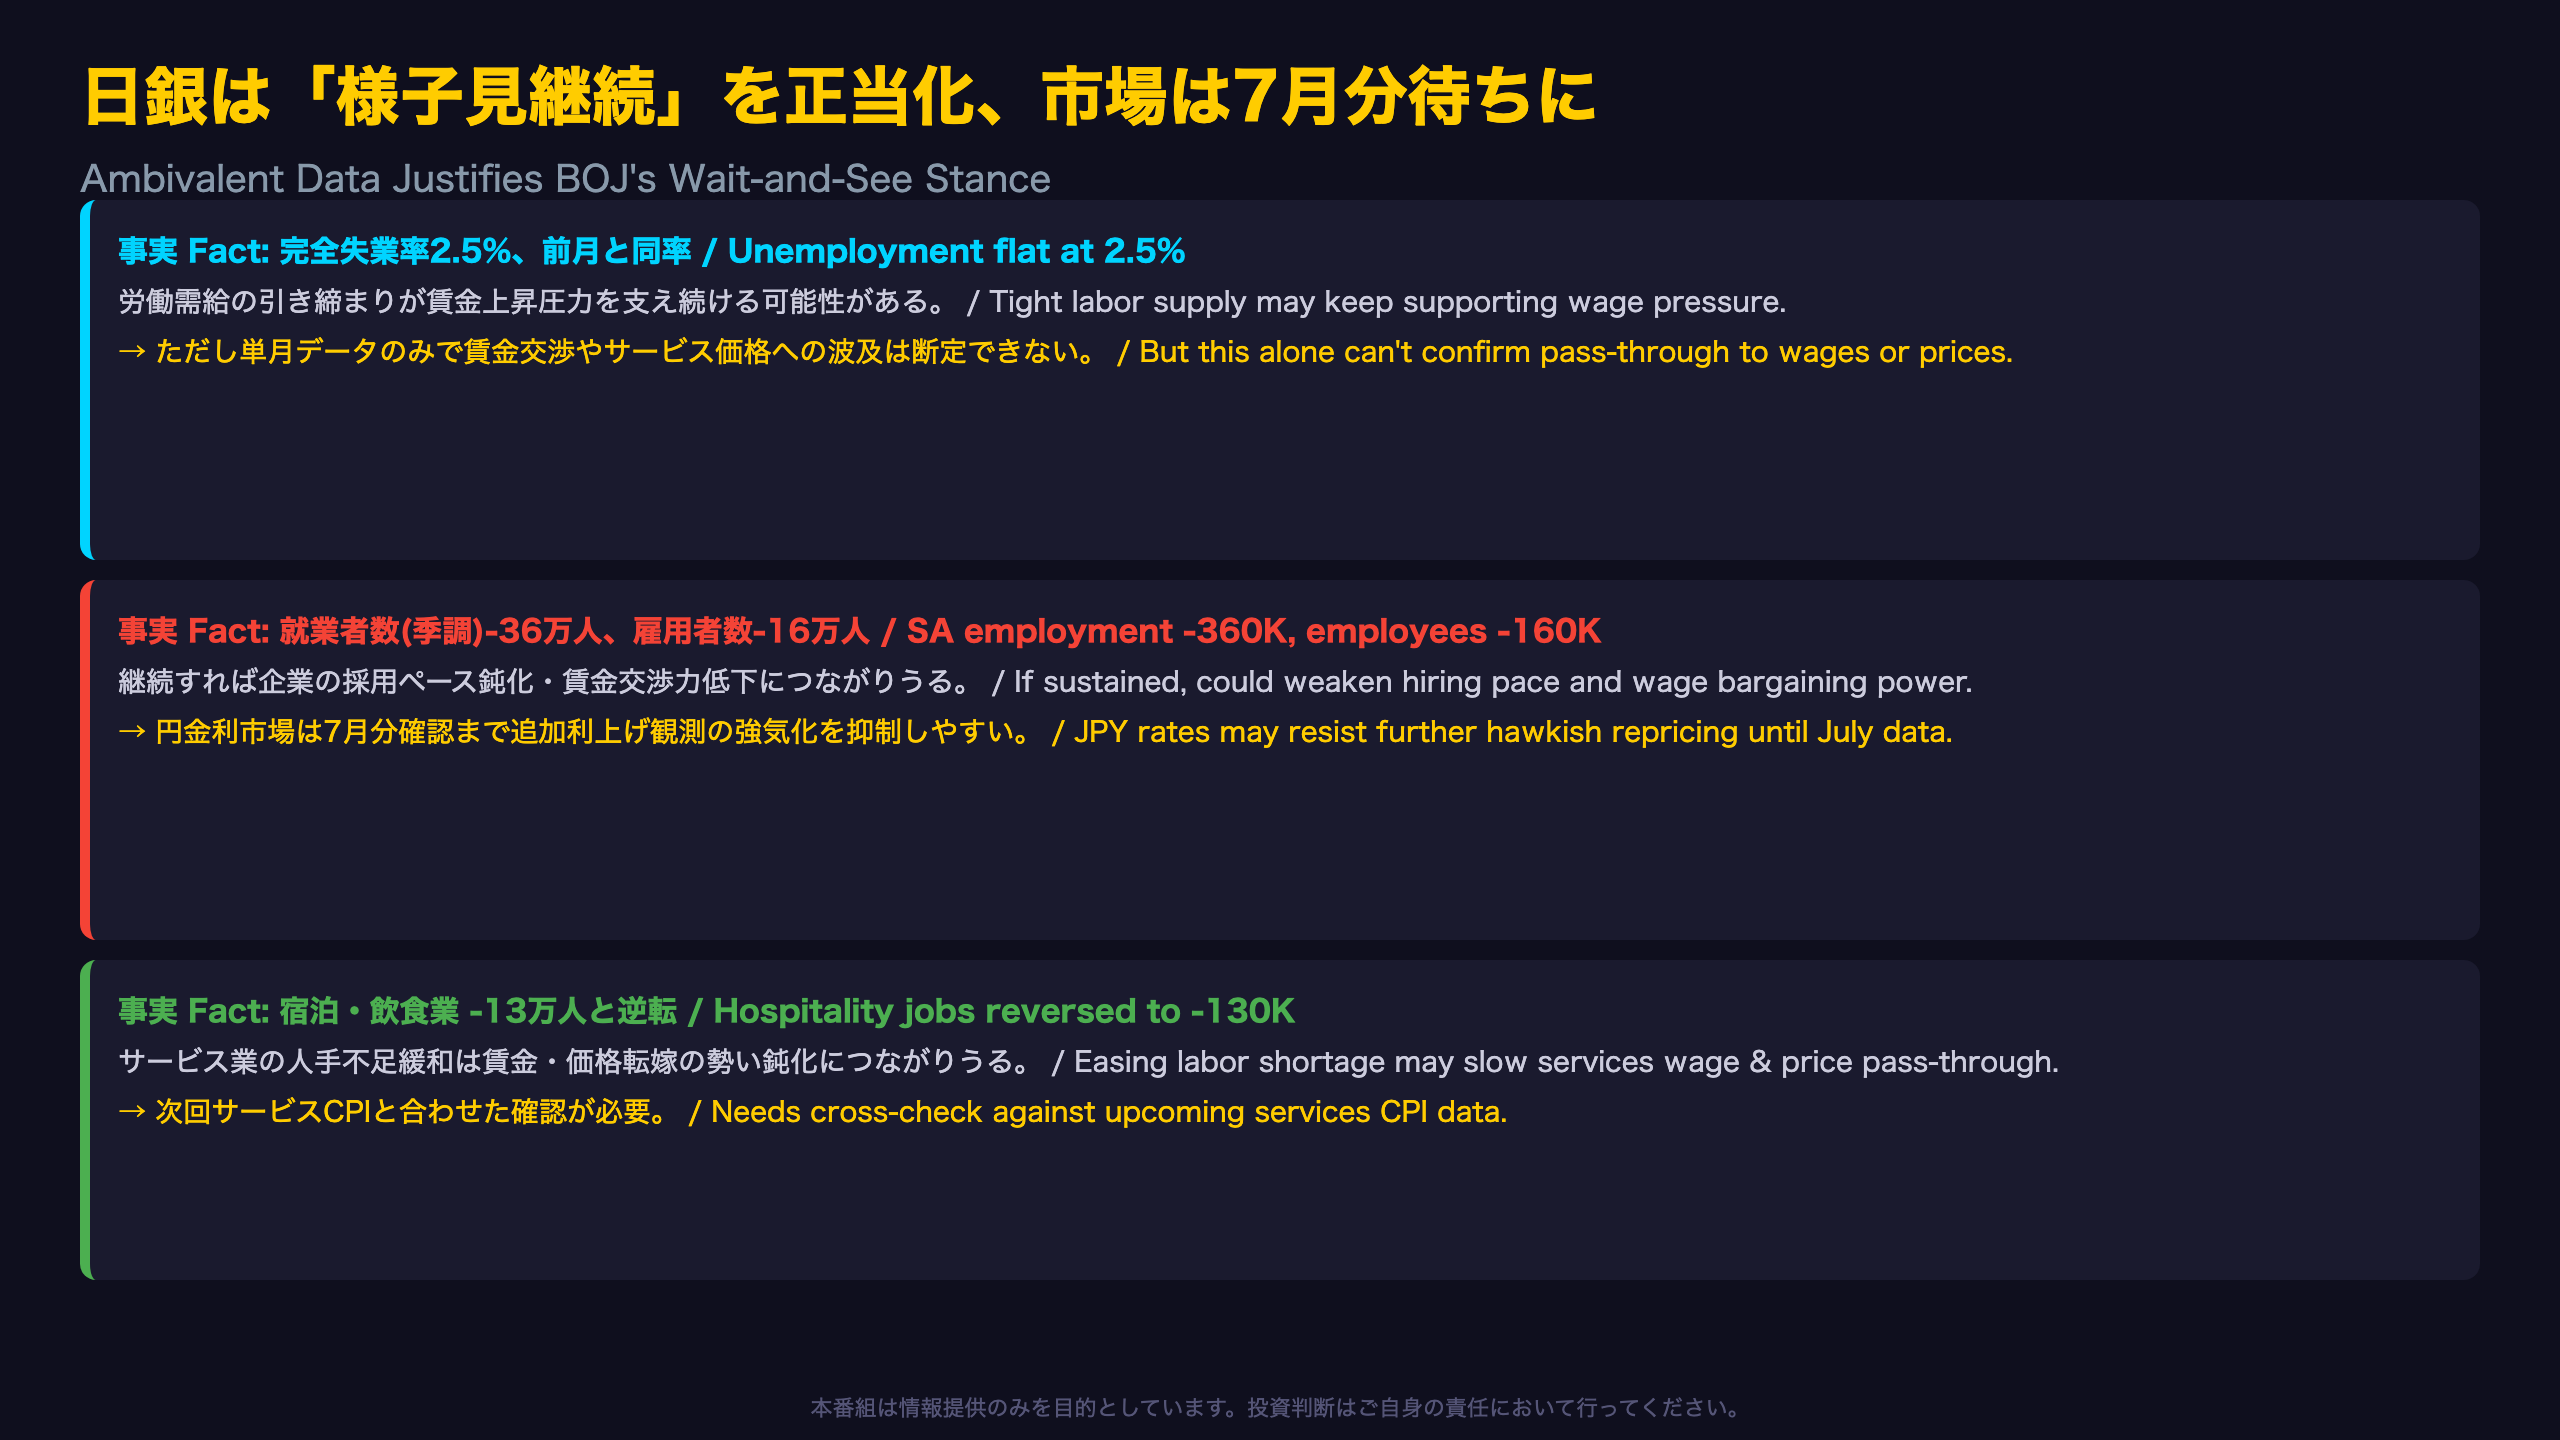
Fact 1: The seasonally adjusted unemployment rate held at 2.5%, unchanged for a seventh straight month.
Mechanism: Persistent labor market tightness typically increases pressure on firms to raise wages to retain and attract workers.
Market implication: While tight labor markets are generally believed to support wage-driven inflation (the BOJ’s core ‘virtuous cycle’ thesis), this single data point alone cannot confirm how it will translate into the next Shunto wage negotiations or CPI trends in H2 2026.
Fact 2: Seasonally adjusted employed persons fell -360,000 month-on-month, and employees fell -160,000.
Mechanism: If this proves to be more than a one-month anomaly, it could indicate slowing hiring appetite among firms, potentially weakening workers’ wage bargaining power.
Market implication: In JGB and yen rate markets, this raises the bar for further BOJ hawkish repricing until July’s release confirms whether the slowdown persists. A single weak print is not sufficient grounds to revise a monetary policy outlook, given the historical volatility of this SA series.
Fact 3: Employment in accommodation and food services fell -130,000 year-on-year, reversing one of the strongest labor-shortage sectors.
Mechanism: A generally accepted view is that easing labor shortages in services sectors reduce wage pressure there, which can subsequently slow services price pass-through — a dynamic BOJ officials watch closely, analogous to how the Fed tracks leisure & hospitality wages.
Market implication: Whether this reversal persists should be cross-checked against upcoming services CPI data before drawing conclusions about Japan’s underlying services inflation trajectory.
Bottom line
No single data point in this release is decisive enough to shift the BOJ’s policy stance. Investors should await the July release (due August 28) alongside other indicators before repricing Japan rate or yen expectations meaningfully.
Disclaimer: This article is for informational purposes only. All investment decisions are made solely at your own risk.