📺 Watch the Full Video Analysis
This article was automatically generated by the NFC Market Live AI analysis system. (Updated: 2026-07-31 05:40 JST)
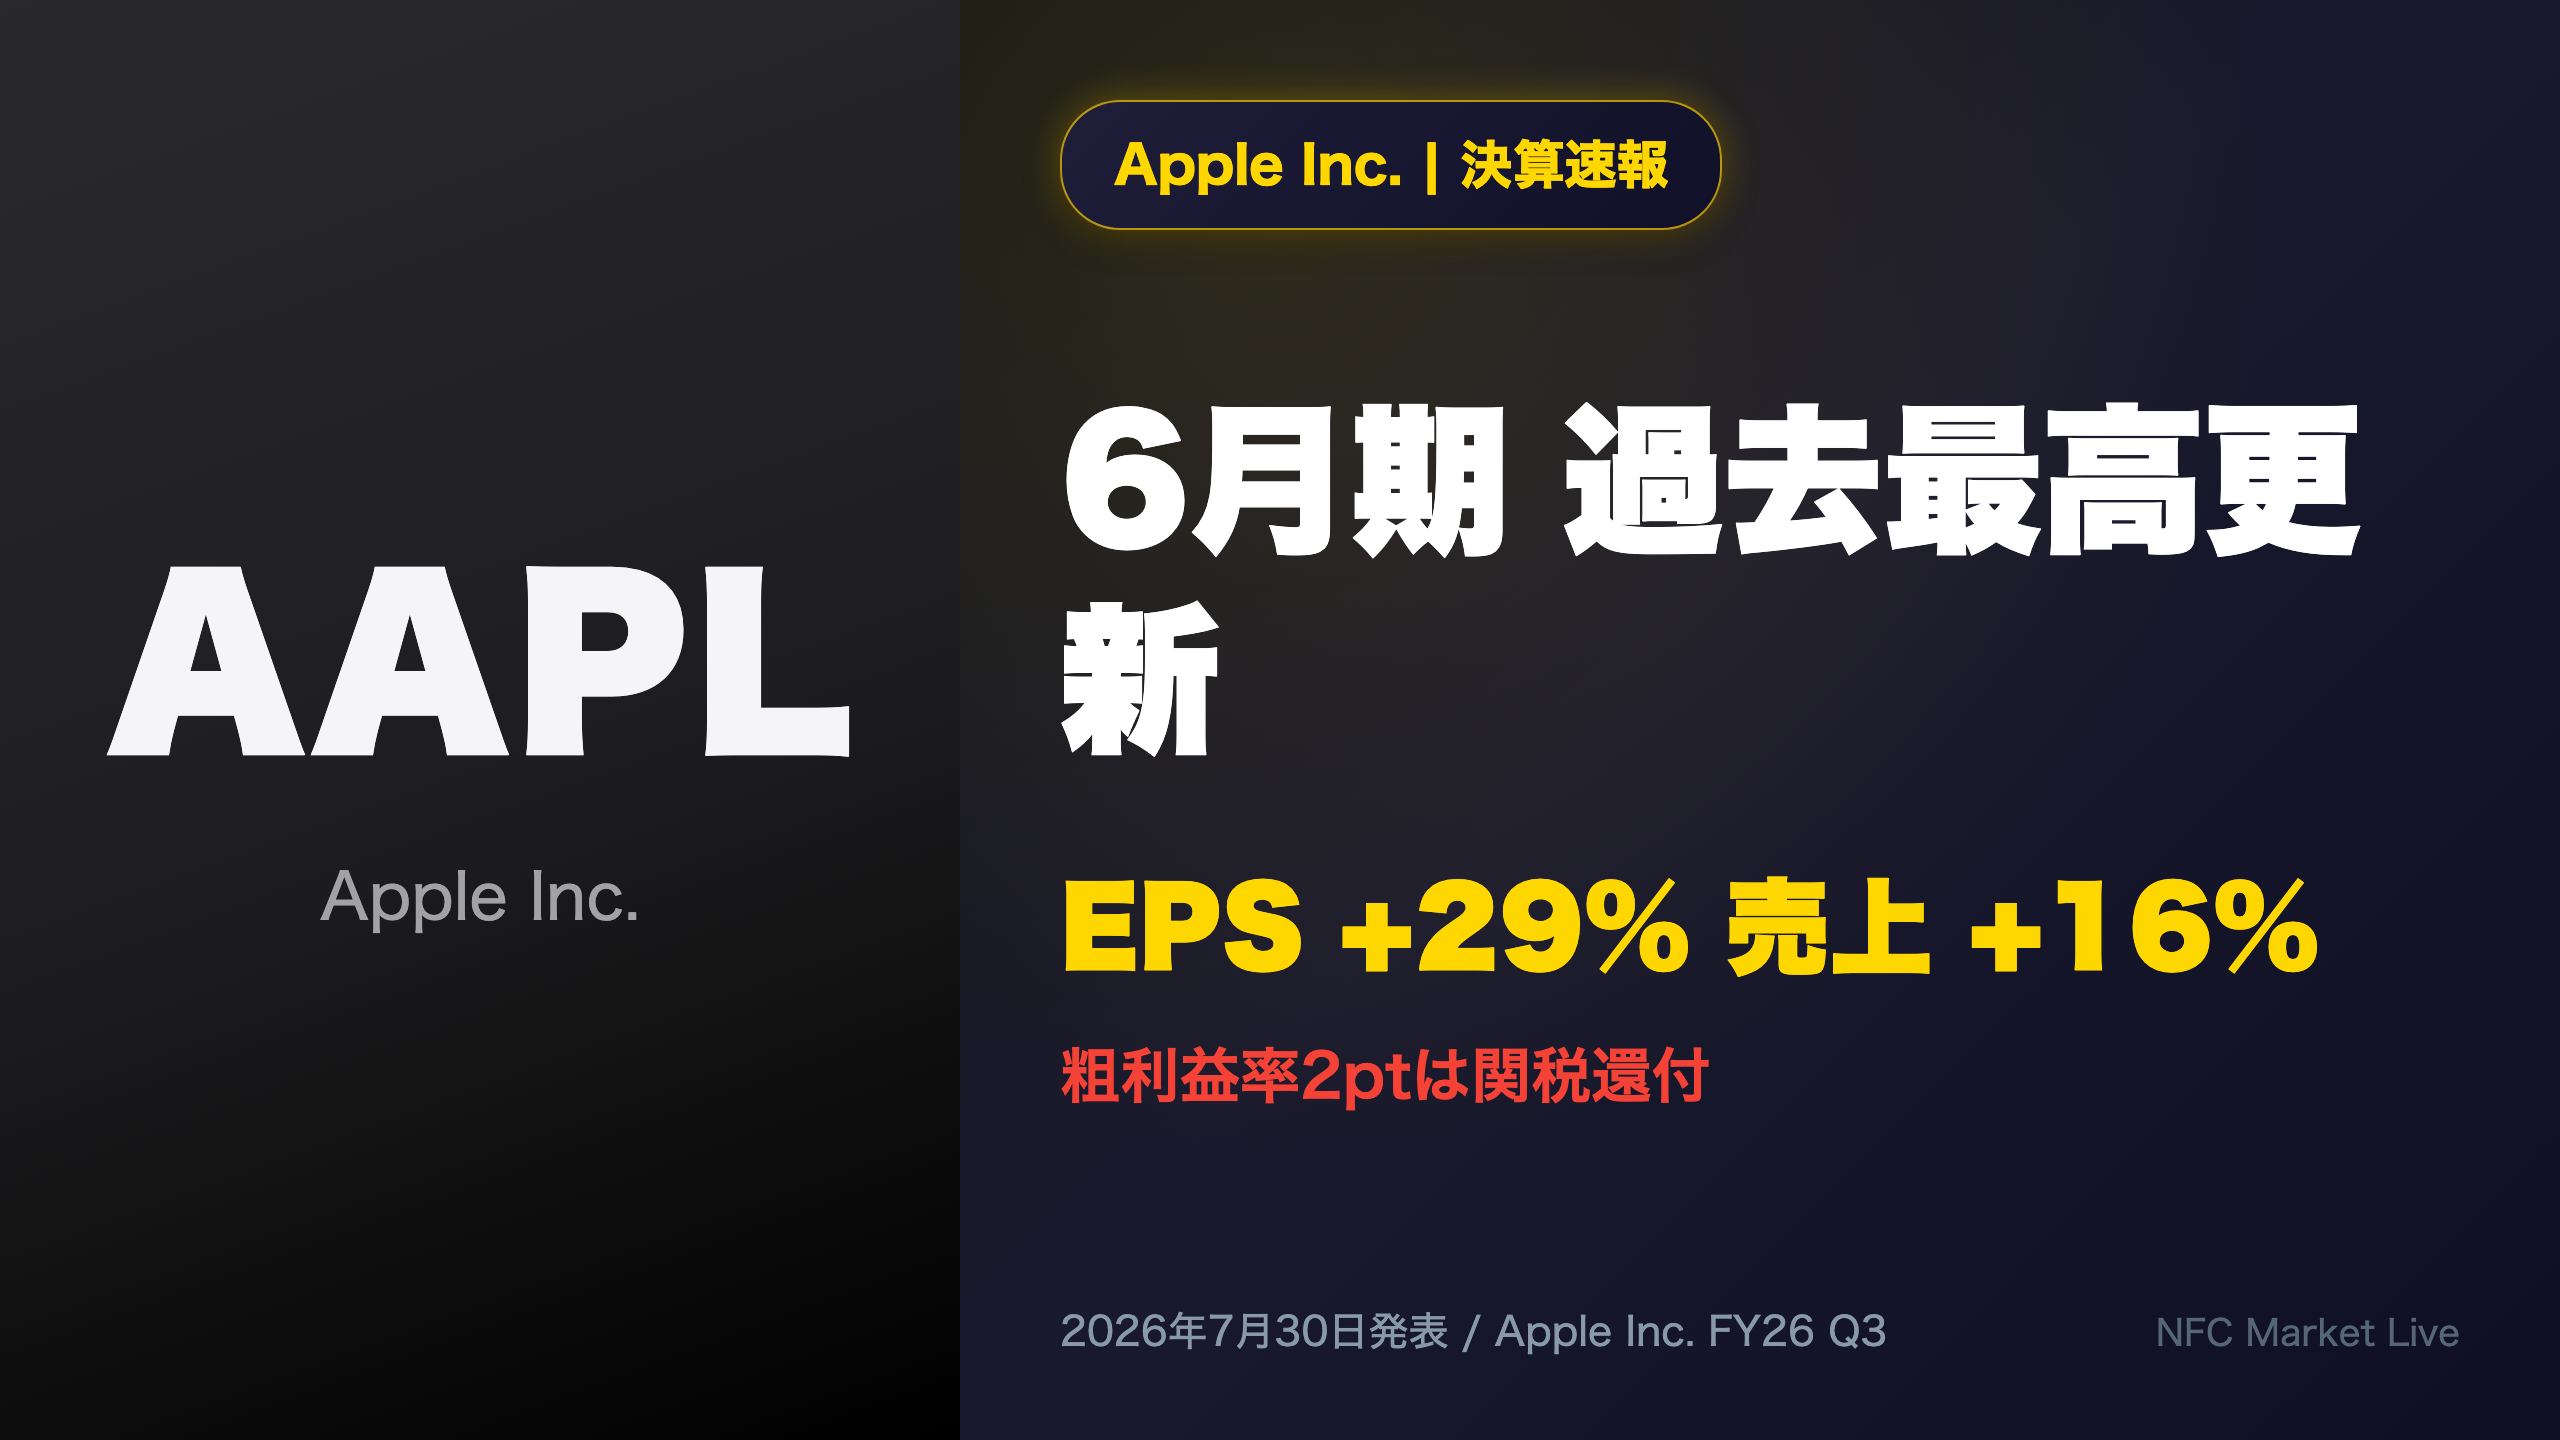
Apple reported fiscal Q3 2026 results with record June-quarter revenue and EPS.
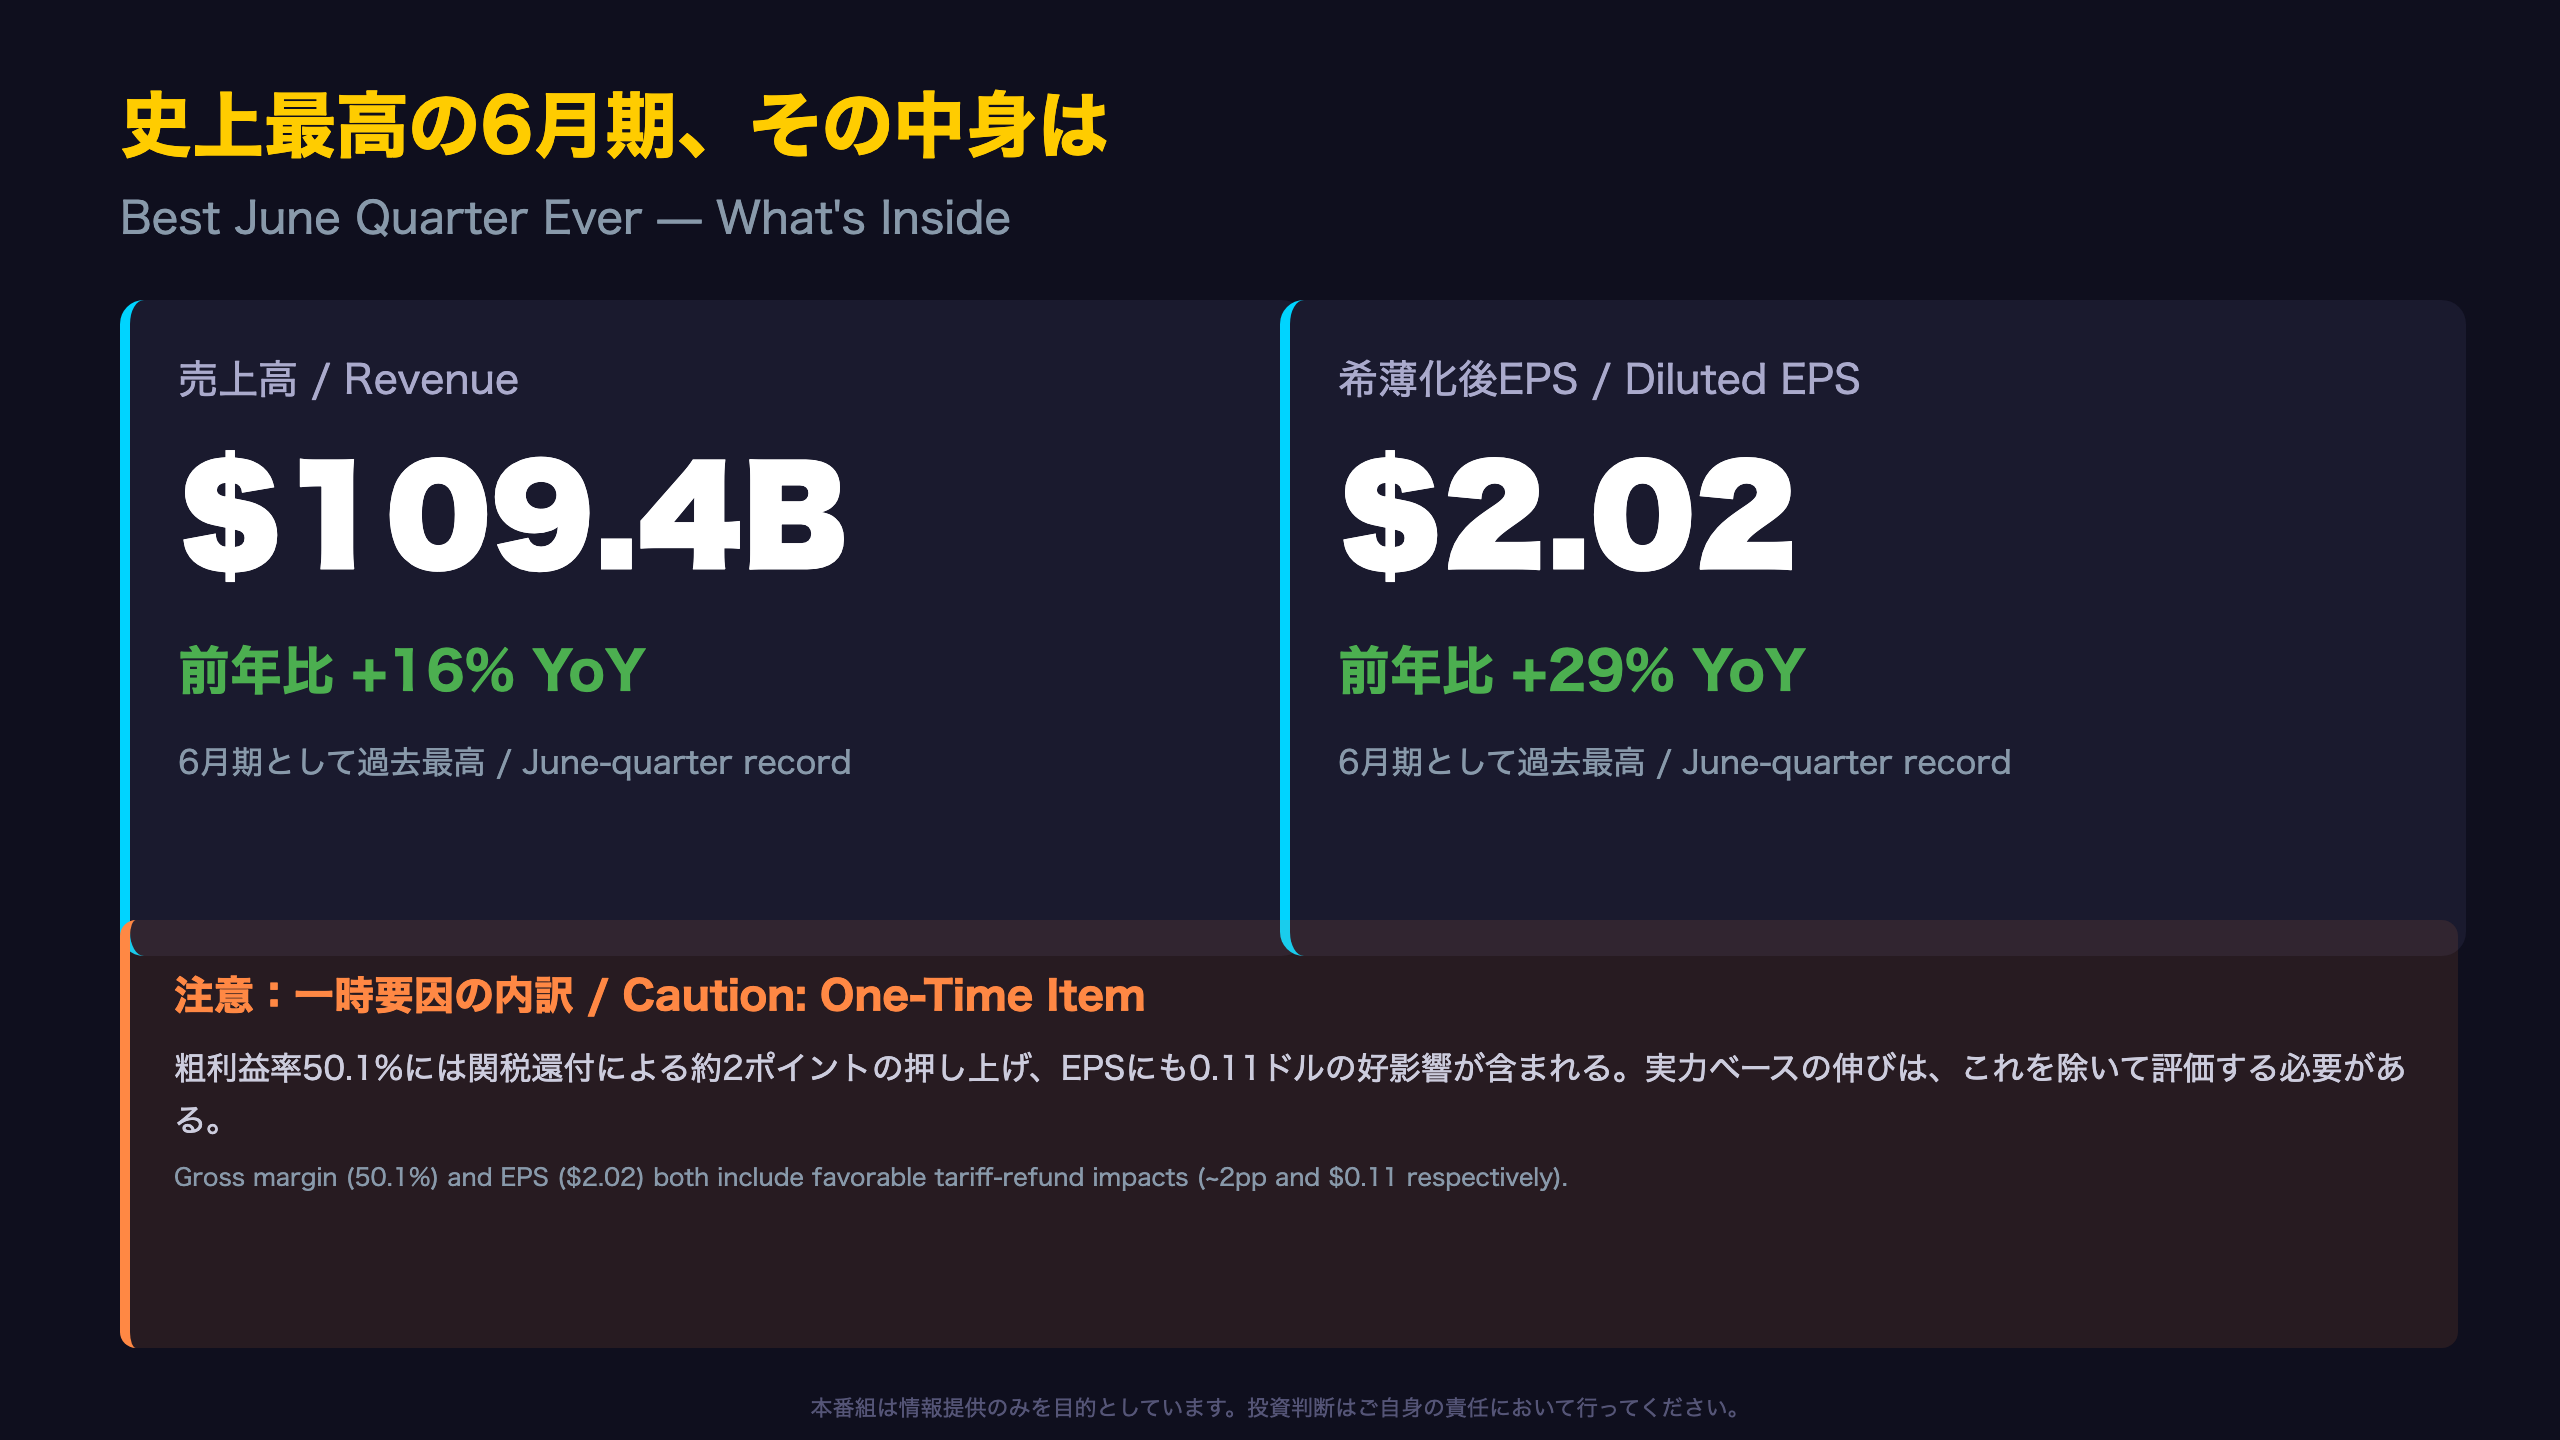
📊 Revenue hit $109.4B (+16% YoY), diluted EPS $2.02 (+29% YoY) — both June-quarter records.
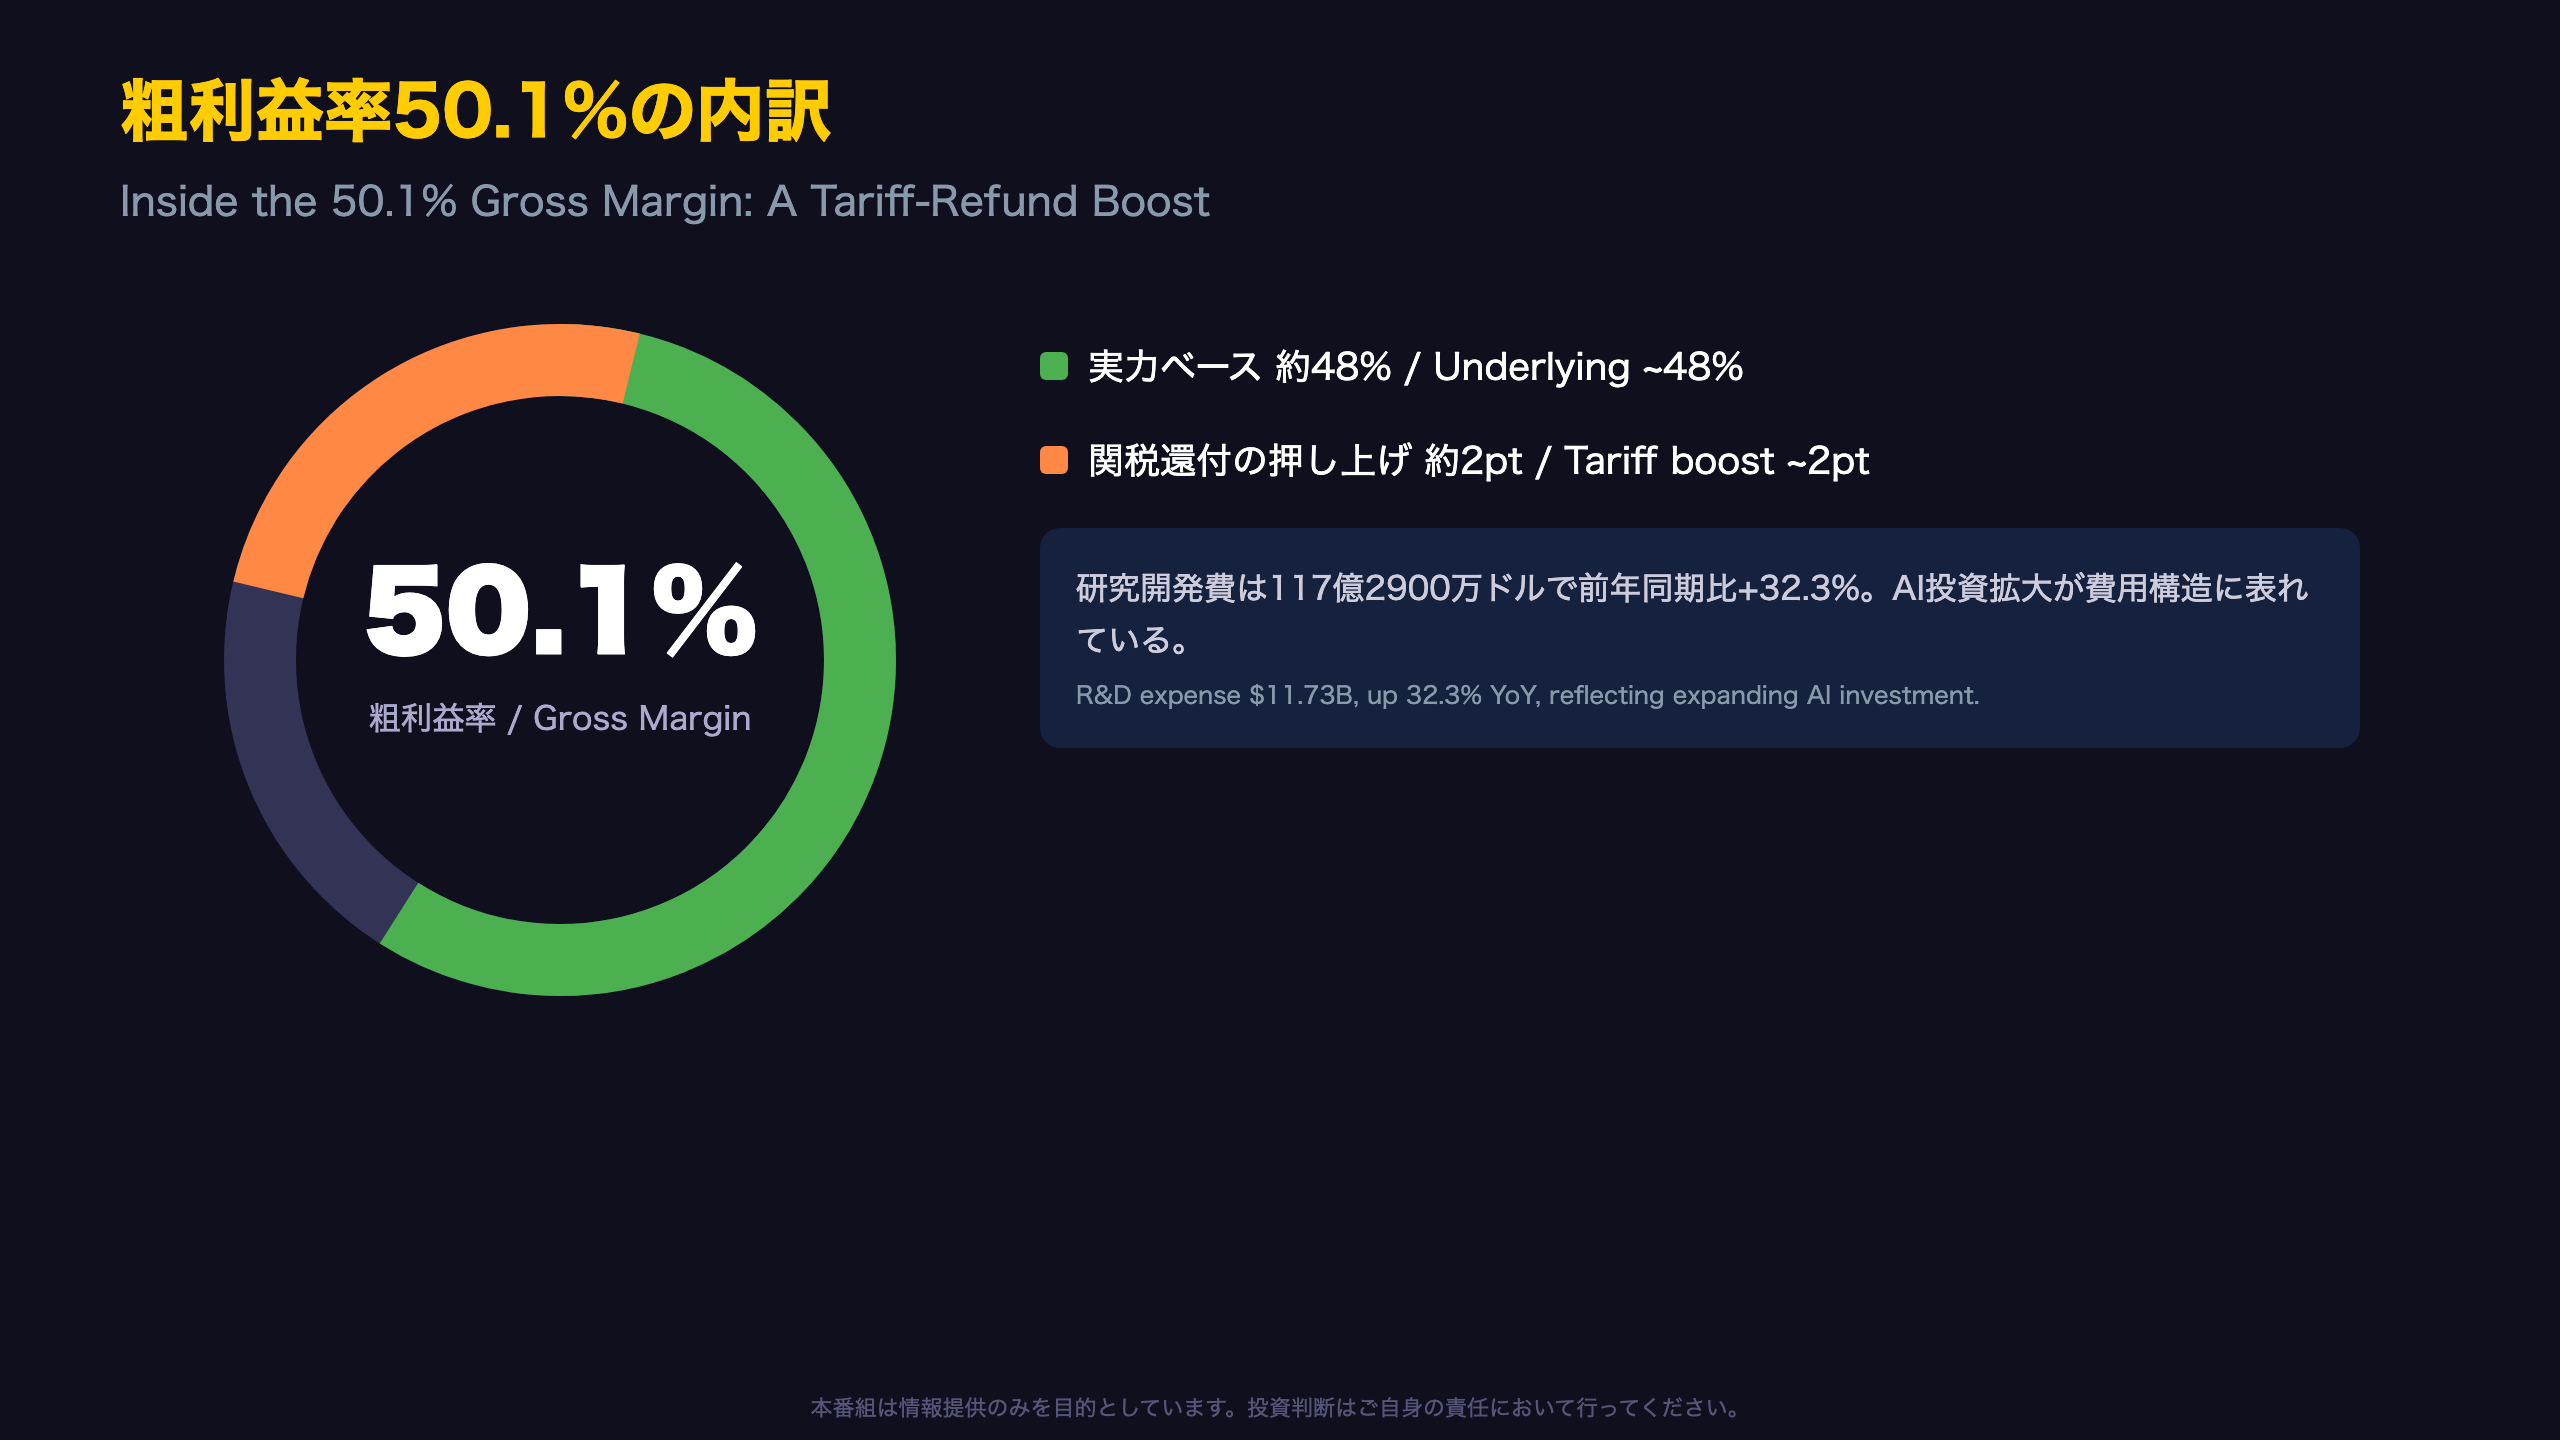
💡 But gross margin of 50.1% included a ~2pp tariff refund benefit, and EPS included $0.11 from the same one-time item.
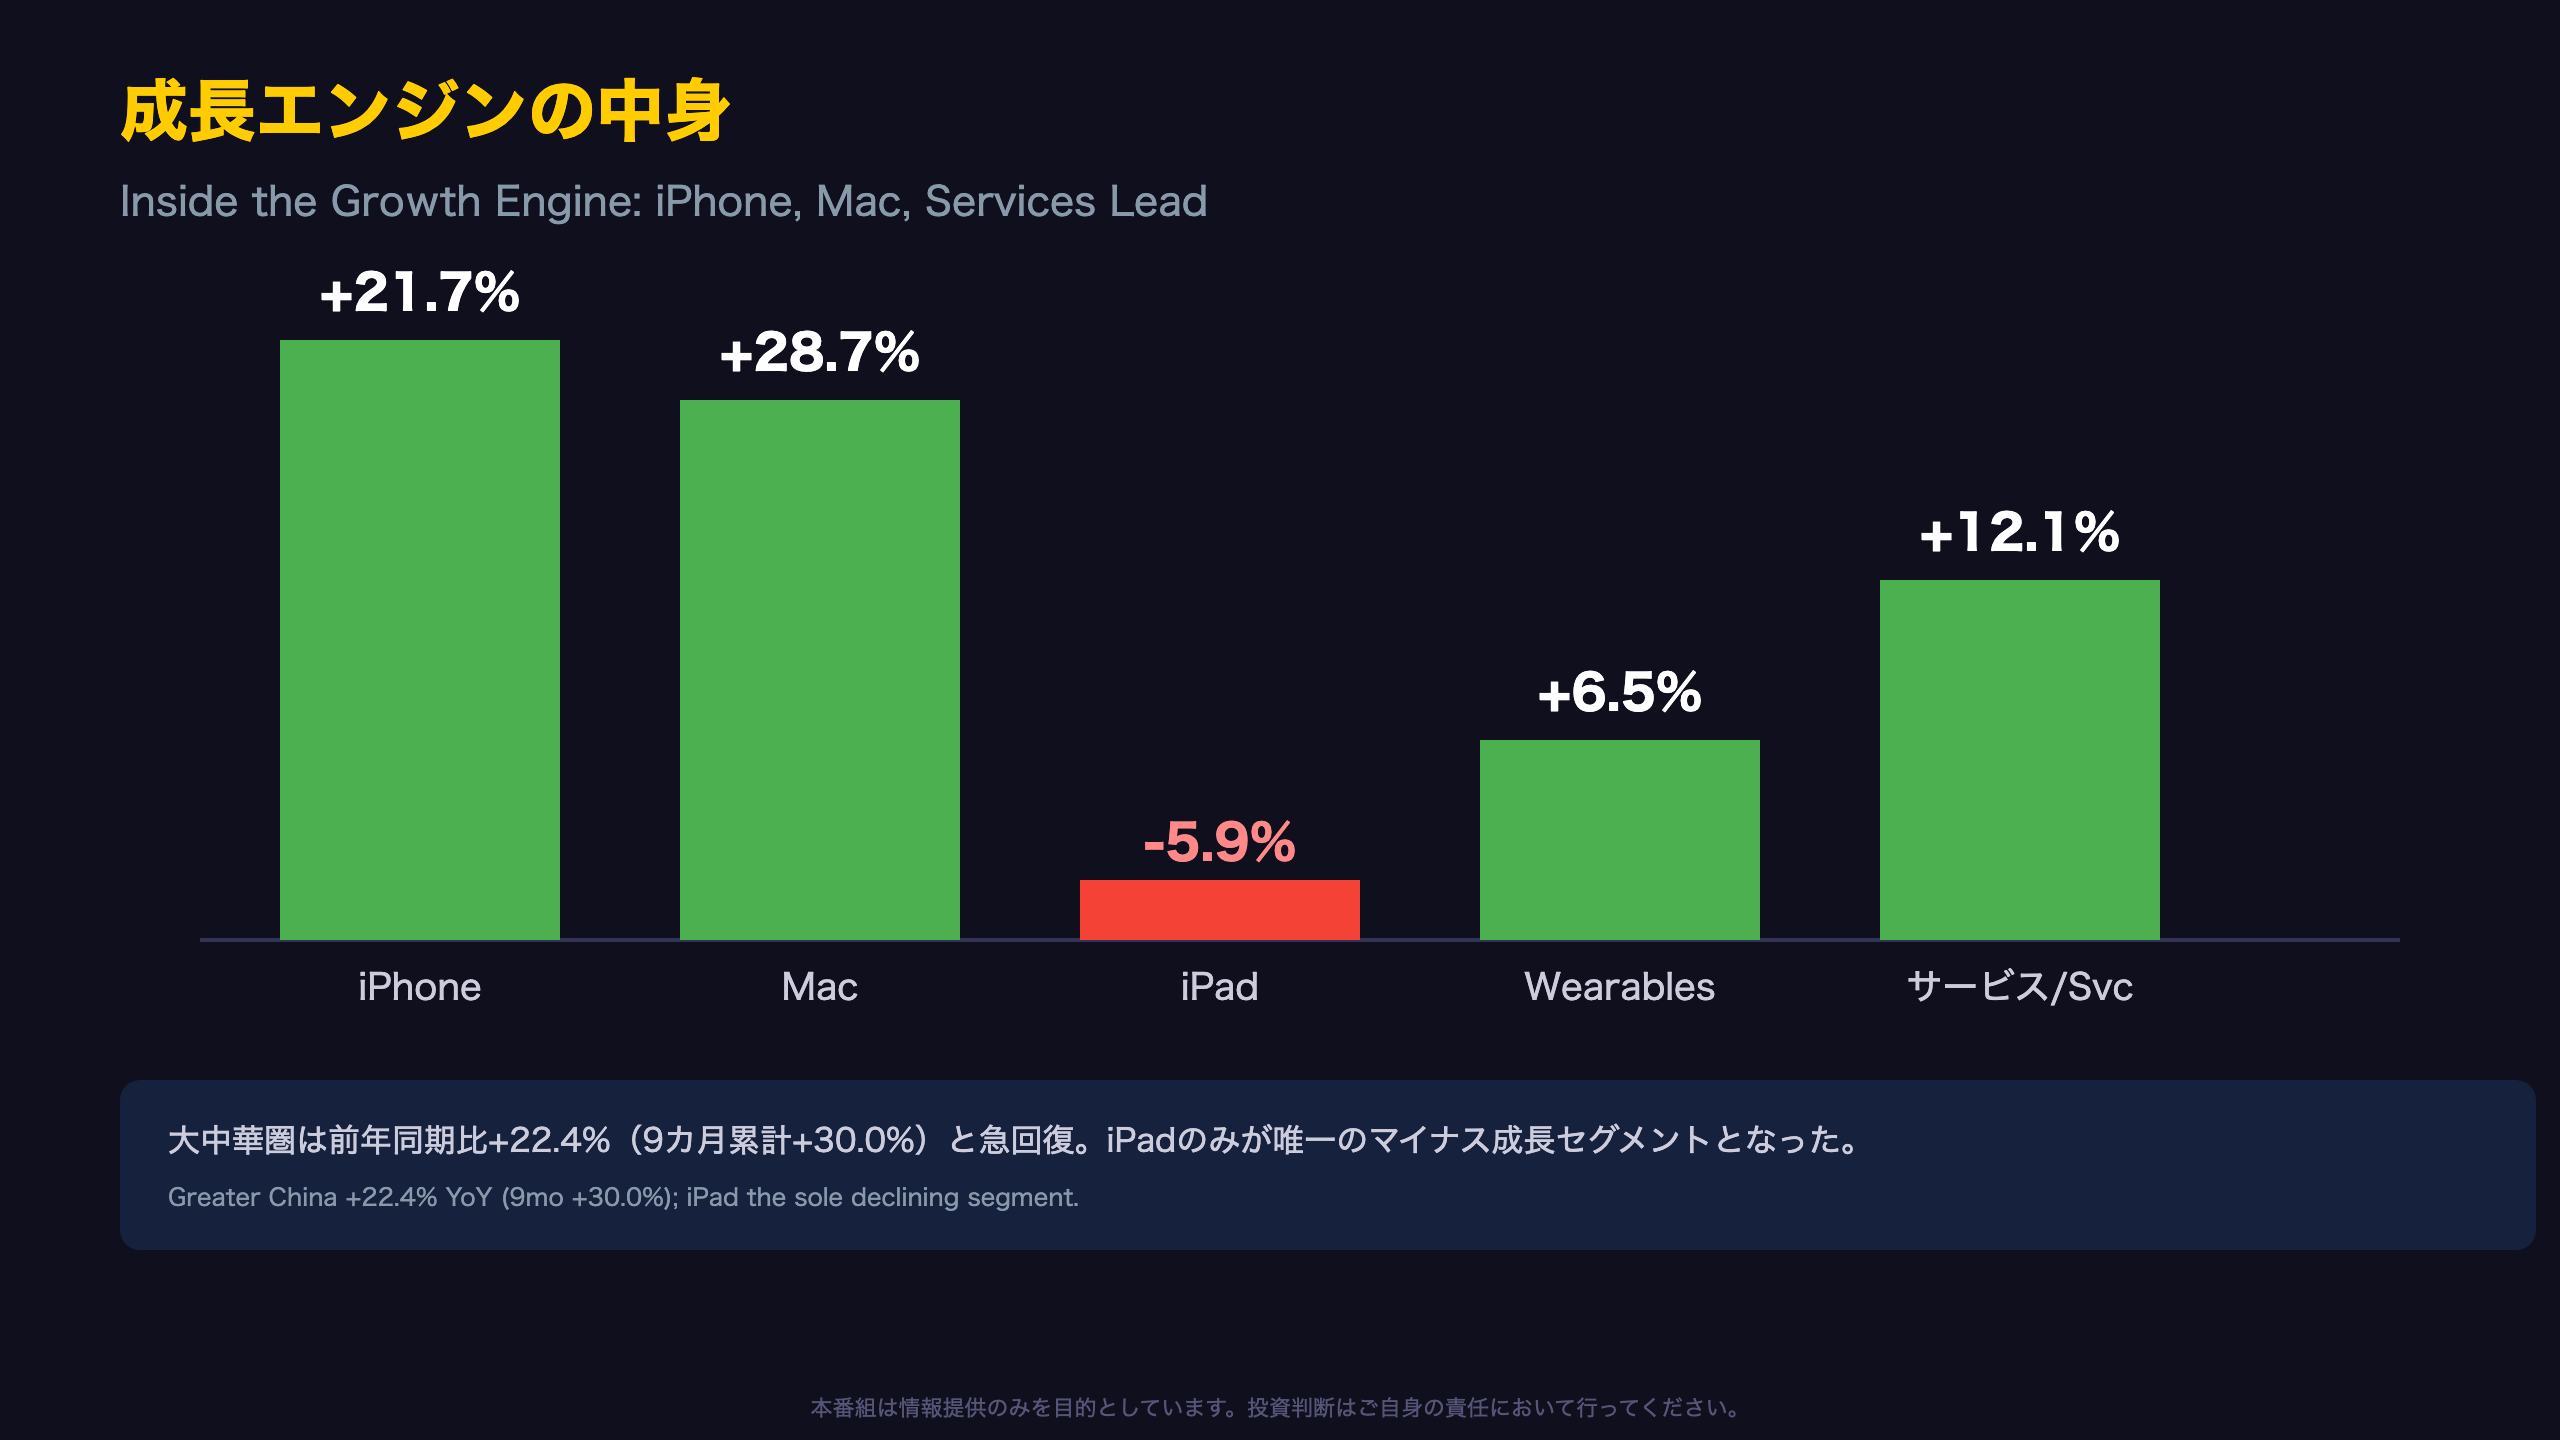
📈 iPhone, Mac, and Services all posted double-digit growth records, while iPad revenue fell 5.9% YoY.
⚠️ R&D spend jumped 32.3% YoY, and buybacks fell 12% over nine months — signaling a shift in capital allocation.
We break down what’s structural strength and what’s a one-time boost.
史上最高の6月期、その中身は
Real Growth Meets a One-Time Boost
Apple’s fiscal Q3 2026 (June quarter) results posted revenue of $109.4 billion (+16.4% YoY) and diluted EPS of $2.02 (+28.7% YoY), both June-quarter records.
The press release explicitly states: “Company gross margin was 50.1 percent, including a favorable impact of approximately 2 percentage points from tariff refunds. Diluted earnings per share was $2.02… and included a favorable impact of $0.11 from tariff refunds.”
Note on Consensus Comparison
Unlike typical earnings-beat commentary, this filing does not disclose analyst consensus figures. For U.S. investors familiar with Wall Street’s EPS “beat/miss” framework, it’s worth noting this analysis is anchored strictly to year-over-year comparisons disclosed in the 8-K, not third-party consensus data.
Back-of-the-envelope math
Stripping out the ~2pp tariff benefit implies an underlying gross margin near 48%, and EPS near $1.91 — a simple recalculation based on disclosed figures, not an official company metric.
Why this matters for U.S. investors
Even excluding the one-time item, Apple still delivered genuine double-digit revenue and profit growth. This isn’t a case of an accounting artifact manufacturing an illusory beat — but it does mean the market may discount some of the reported 29% EPS growth when modeling forward quarters.
成長エンジンの中身:iPhone・Mac・サービスが牽引
Segment-Level Divergence
Beneath the headline “double-digit growth everywhere” narrative lies real divergence across product categories.
| Segment | This Quarter | Prior Year | YoY |
|---|---|---|---|
| iPhone | $54.25B | $44.58B | +21.7% |
| Mac | $10.35B | $8.05B | +28.7% |
| iPad | $6.19B | $6.58B | -5.9% |
| Wearables/Home/Acc. | $7.88B | $7.40B | +6.5% |
| Services | $30.74B | $27.42B | +12.1% |
iPad was the only declining category this quarter. Even on a nine-month basis, iPad revenue rose only marginally, from $21.07B to $21.70B — suggesting the category may be in a mid-cycle lull rather than outright weakness, though a single quarter’s data cannot confirm a structural trend.
Greater China’s Comeback
Greater China revenue hit $18.82B, up 22.4% YoY, and $64.84B over nine months versus $49.88B a year earlier (+30.0%). For U.S. investors who have watched China revenue as a bellwether of geopolitical and competitive risk (vs. Huawei and domestic Android OEMs), this rebound is a notable data point — though whether it reflects durable share gains or a temporary product-cycle tailwind will depend on subsequent quarters.
粗利益率50.1%の内訳 — 関税還付というノイズ
Accounting Context: What Are Tariff Refunds?
Tariff refunds typically represent reimbursement of previously paid import duties following a change in trade policy — a cash/earnings item that doesn’t reflect core operating performance. Apple’s explicit disclosure of this “favorable impact” in the press release is a transparency positive, distinguishing it from companies that bury one-time items in footnotes.
“Diluted earnings per share was $2.02, up 29 percent year over year, and included a favorable impact of $0.11 from tariff refunds.”
The R&D Surge in Context
R&D expense hit $11.73 billion, up 32.3% YoY. Over nine months, R&D reached $34.04 billion versus $25.68 billion a year earlier (+32.5%) — indicating this is a multi-quarter investment trend, not an isolated spike.
CEO Tim Cook referenced the new Siri AI unveiled at WWDC26, suggesting a link to rising R&D, though the filing does not break out what portion of R&D relates specifically to AI.
Bull vs. Bear Read
For US tech investors accustomed to comparing Apple’s R&D intensity (about 10.7% of revenue this quarter) against peers like Microsoft or Alphabet’s AI capex, this signals Apple is finally accelerating its AI investment cycle. The bear case: operating margin (32.6%, up from 30.0% a year ago) could compress if R&D growth continues outpacing revenue growth in future quarters without commensurate monetization.
キャッシュフローは急拡大、自社株買いは減速
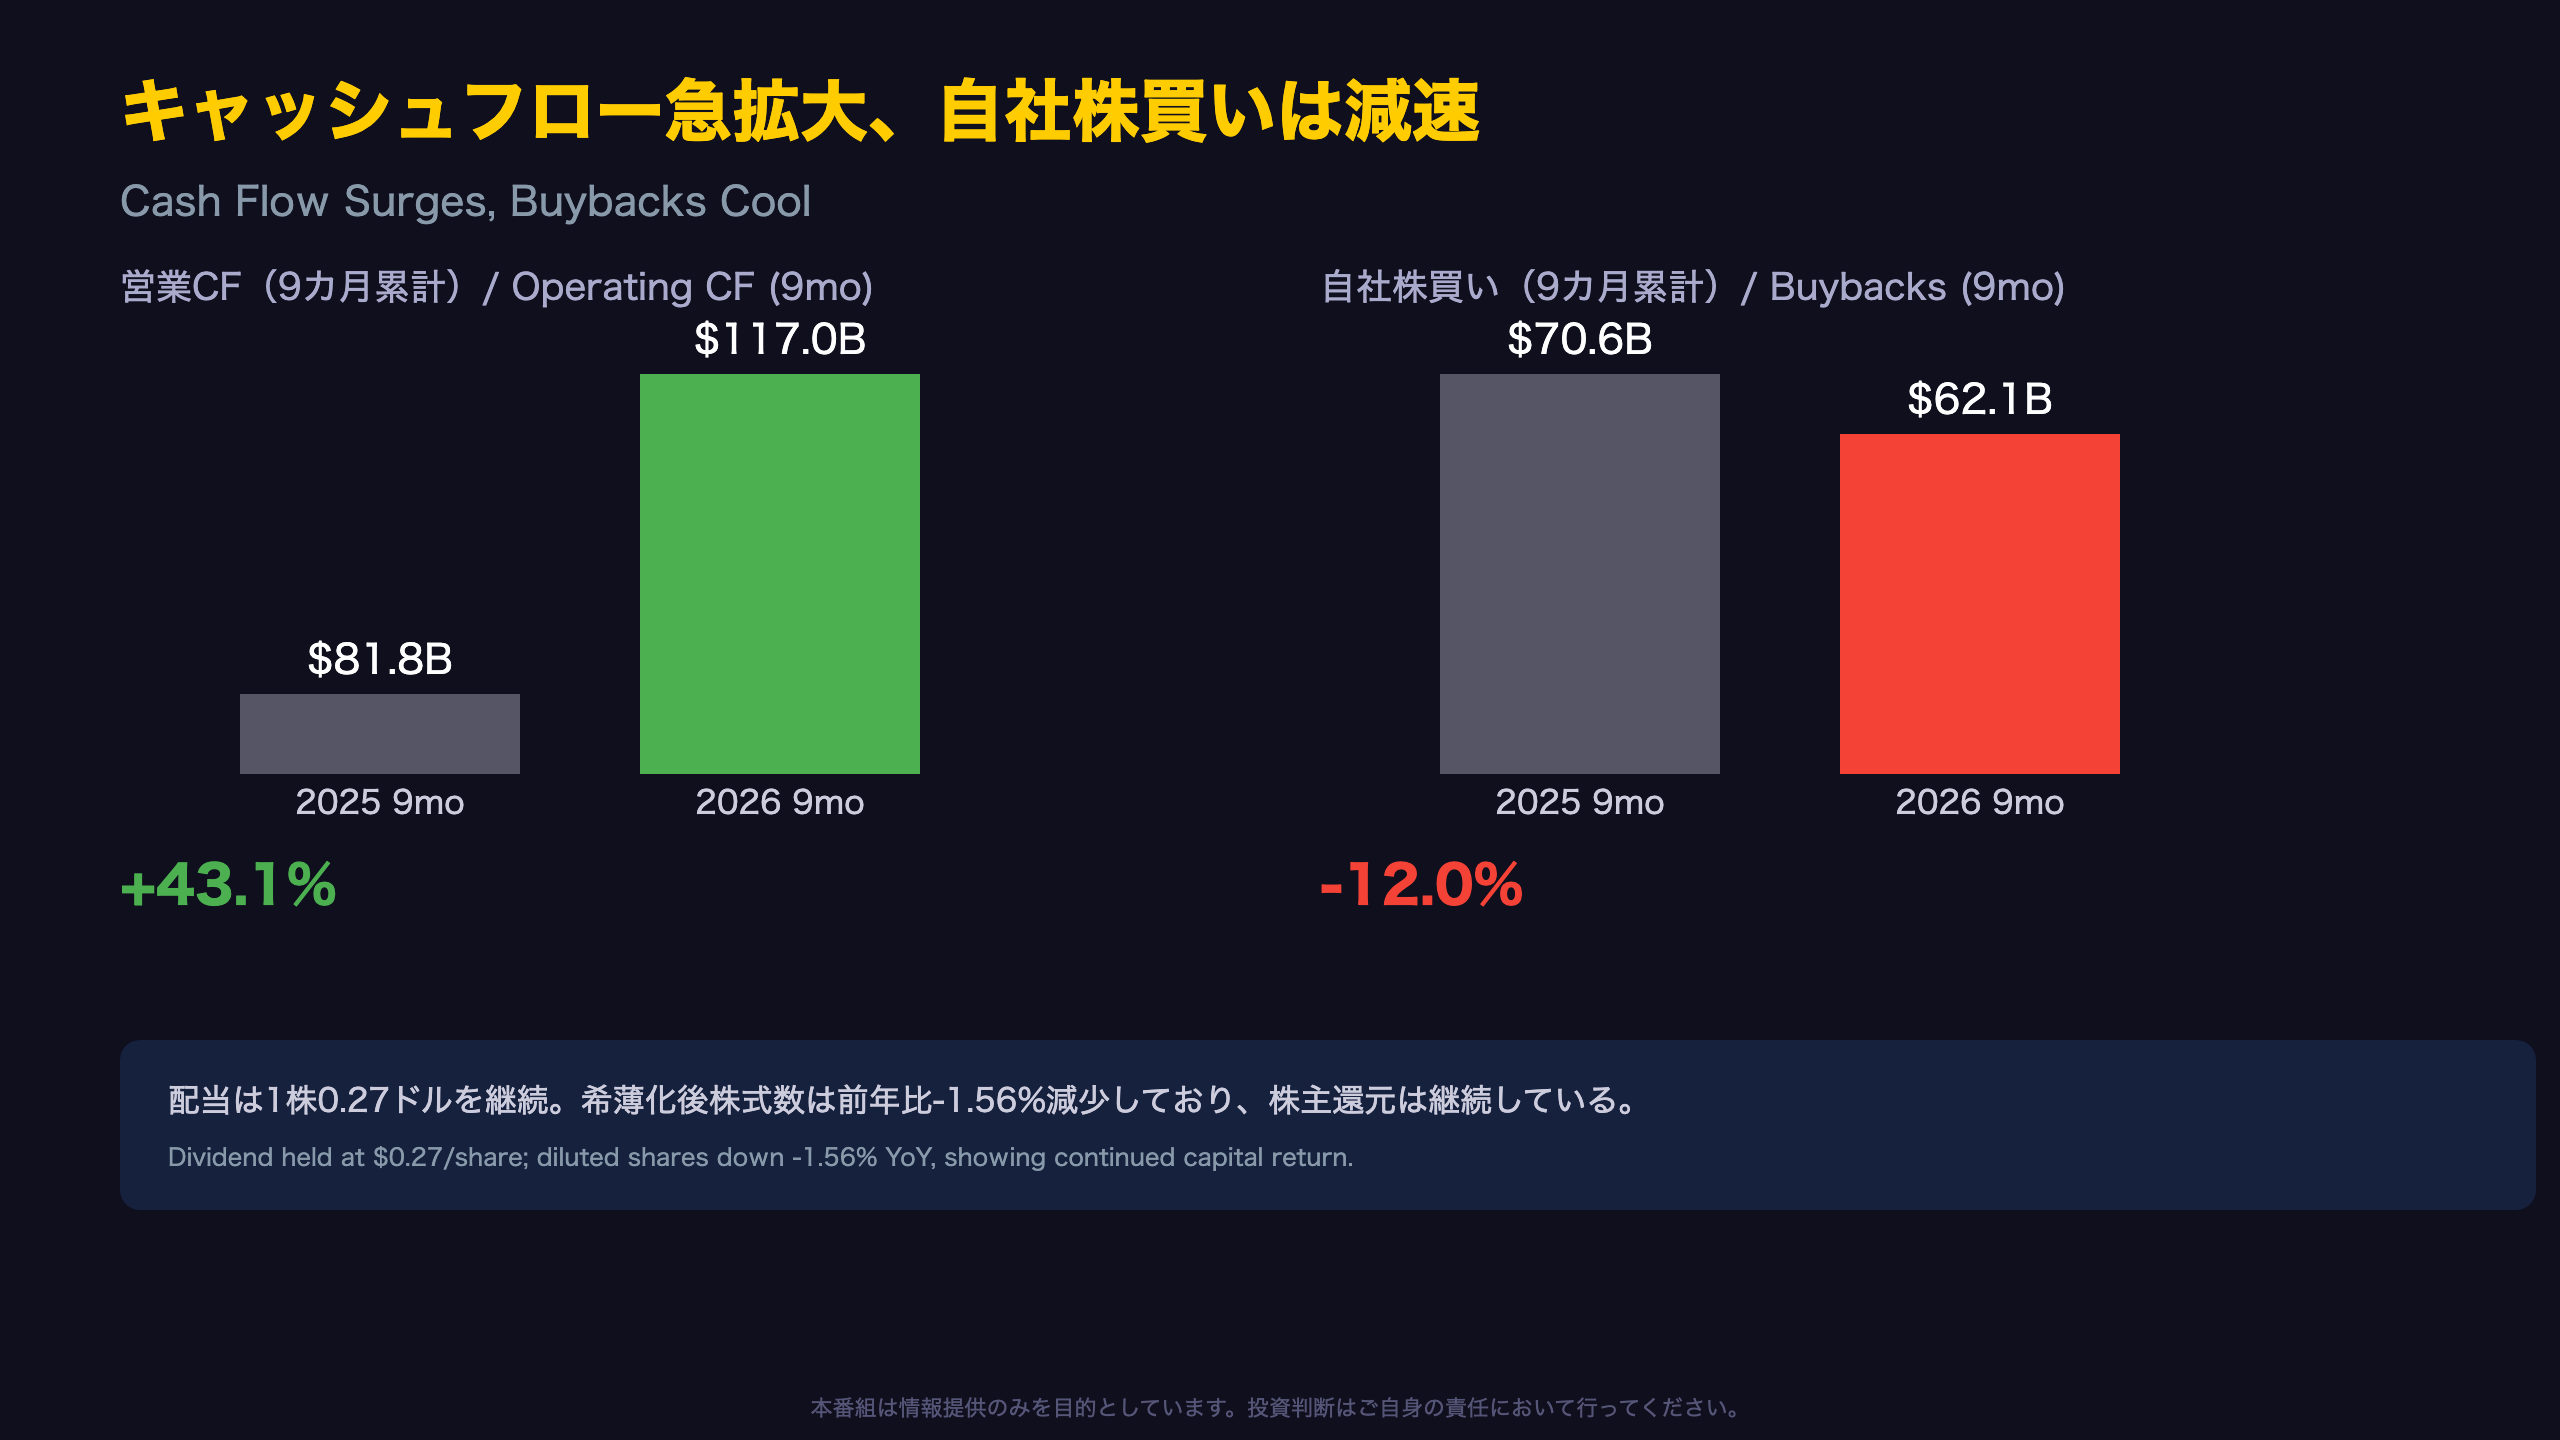
Cash Flow Statement Detail
Nine-month operating cash flow reached $117.0 billion, up 43.1% YoY. Beyond the $16.92 billion increase in net income (from $84.54B to $101.46B), working capital shifts also contributed.
Key nine-month cash flow drivers per the filing:
– Inventories: $5.46B cash outflow (inventory build)
– Other current/non-current liabilities: $10.02B cash inflow
– Accounts payable: $5.20B cash outflow
For investors familiar with typical U.S. tech company cash conversion cycles, an inventory build ahead of a product cycle (new iPhone launches typically occur in September) is a common seasonal pattern, though a single quarter’s data can’t confirm whether this reflects demand optimism or excess buildup risk.
Buyback Pace Cools
Buybacks totaled $62.1 billion over nine months, down 12.0% from $70.6 billion a year earlier. Diluted shares outstanding continued to decline, from 14.95 billion to 14.71 billion (-1.56% YoY), meaning repurchases continue but at a more measured pace.
“The Company’s board of directors has declared a cash dividend of $0.27 per share… payable on August 13, 2026.”
The combination of a steady dividend and slower buybacks could suggest capital is being partly redirected toward R&D (+32.3% YoY) — though this is an inference from combining multiple disclosed metrics, not an explicit management statement.
累積赤字から黒字へ — 変わる資本構成
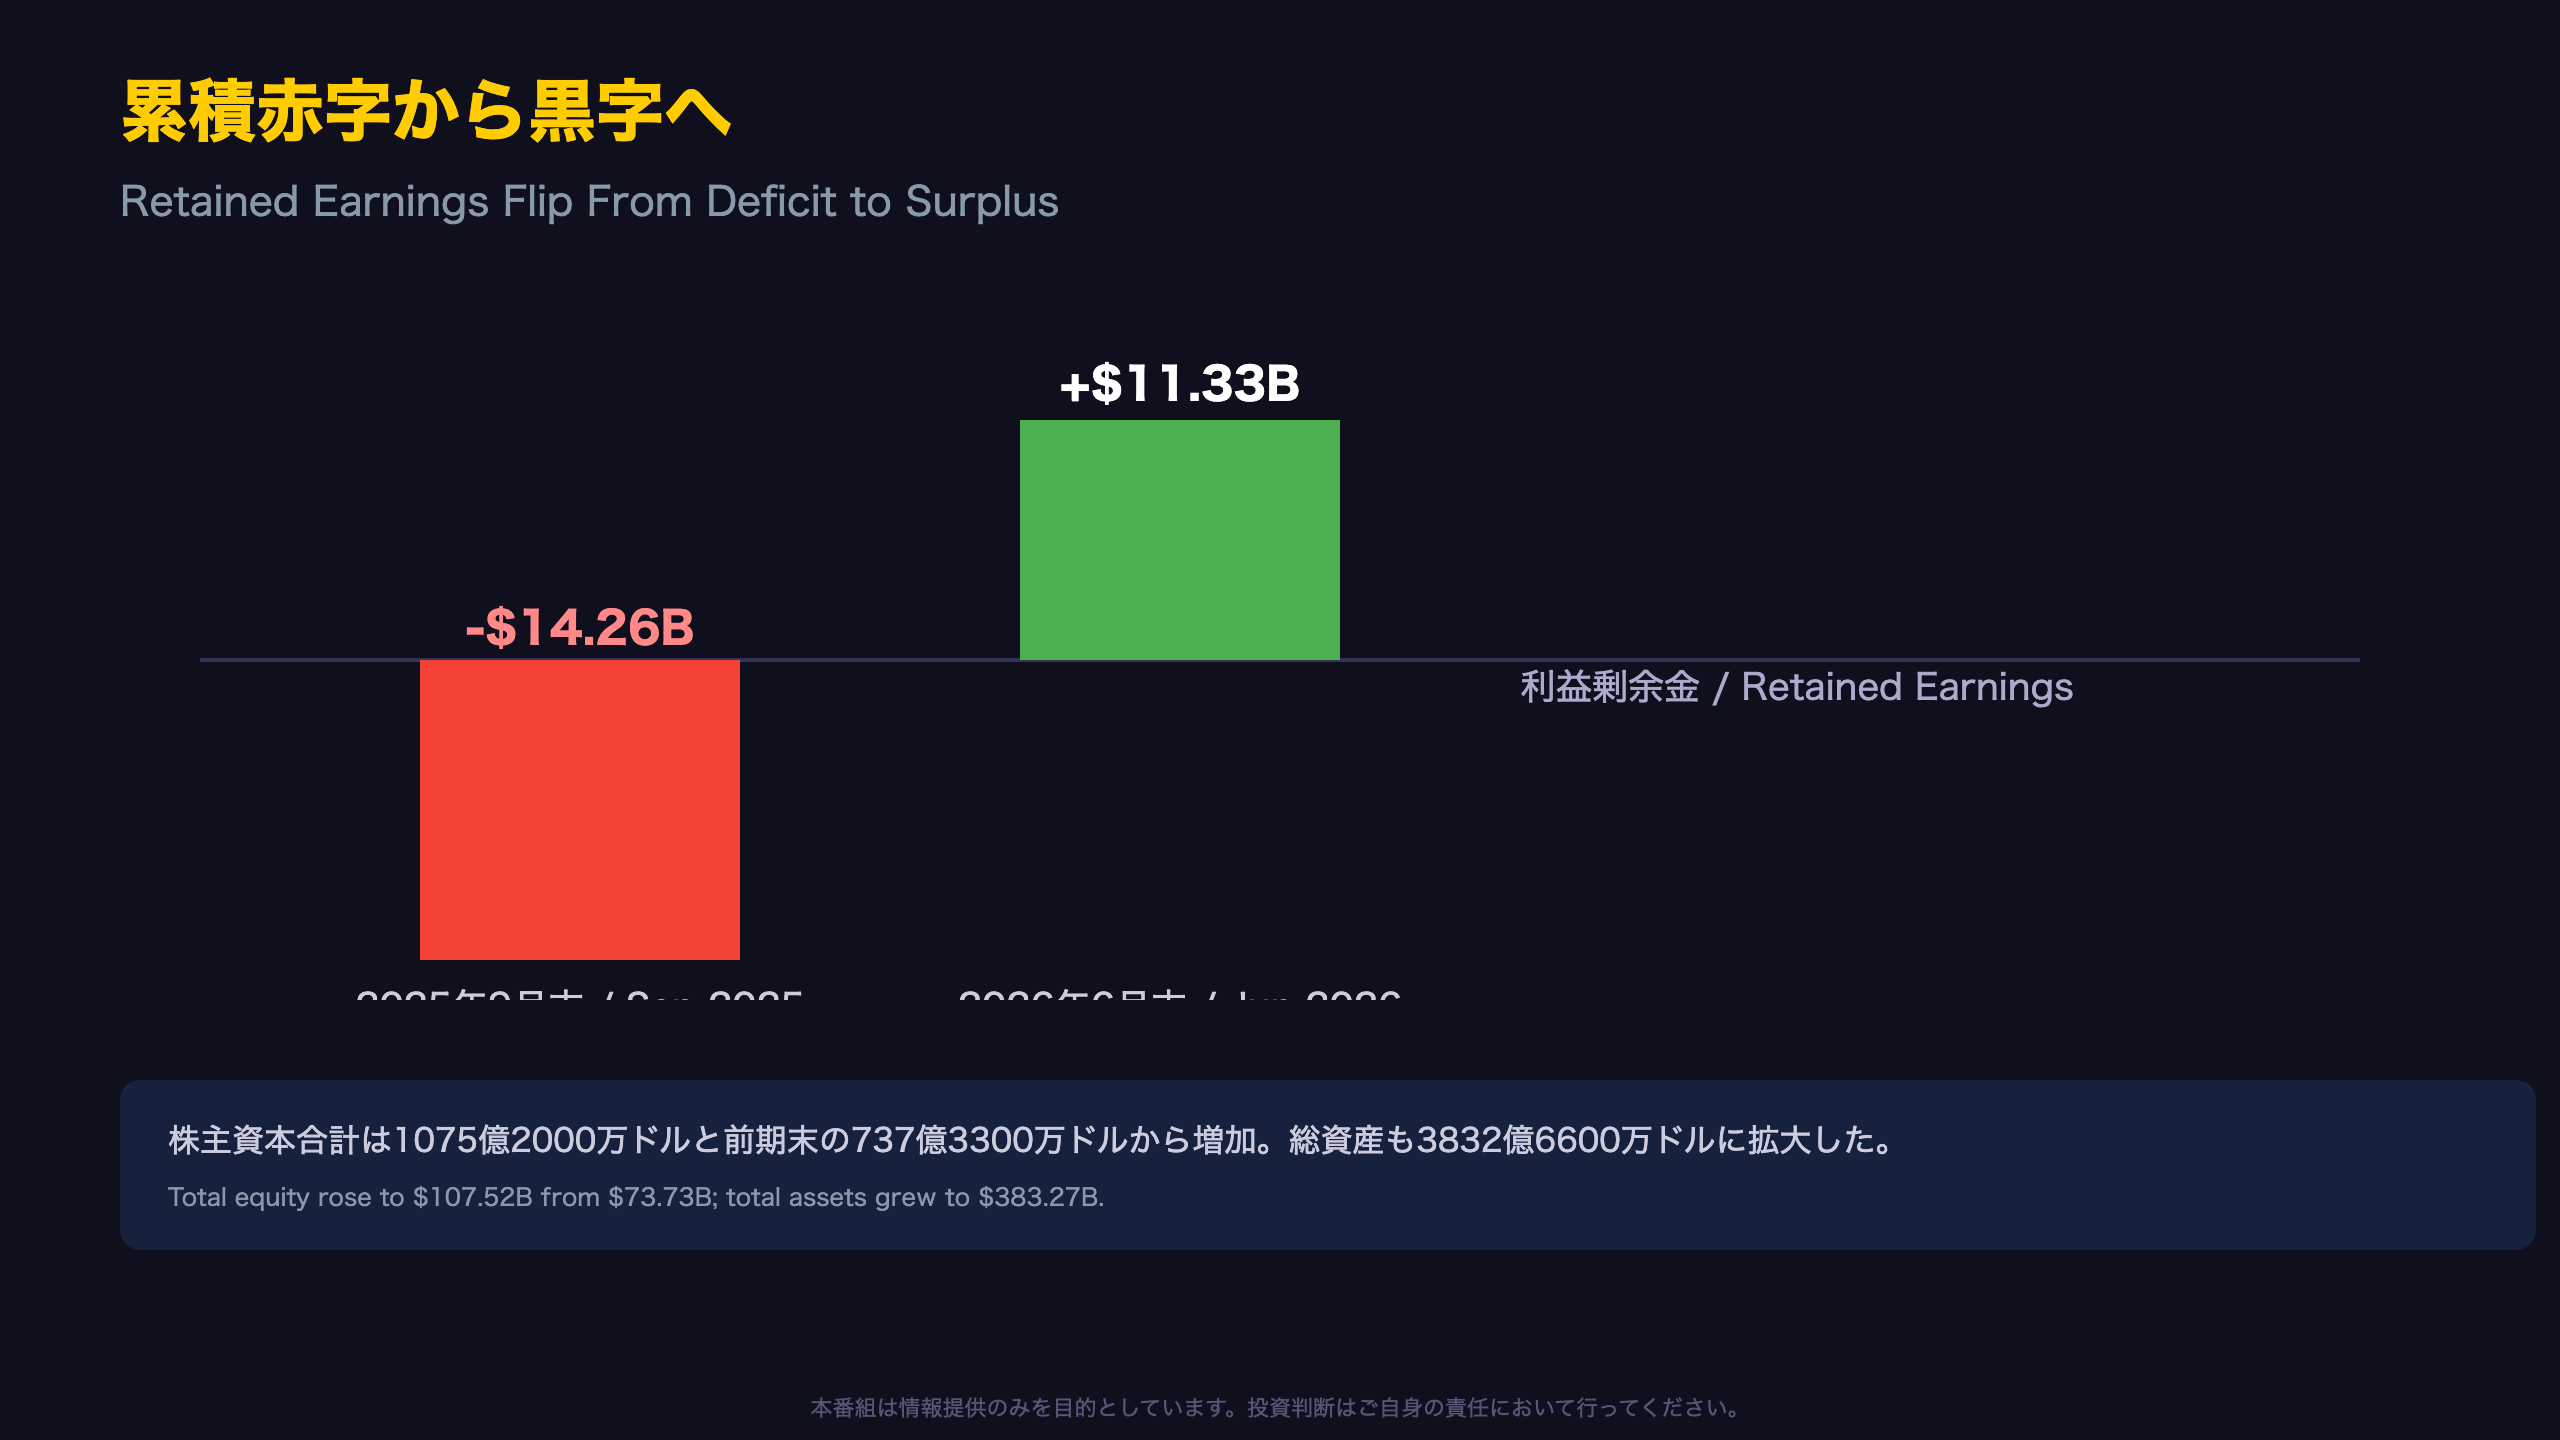
A Quiet but Meaningful Shift: Retained Earnings Turn Positive
Apple’s retained earnings swung to a positive $11.3 billion, reversing an accumulated deficit of $14.3 billion at the prior fiscal year-end (September 27, 2025).
For U.S. investors, it’s worth understanding why Apple had an accumulated deficit at all: unlike most companies, Apple has returned so much capital via buybacks over the past decade that cumulative distributions had exceeded cumulative net income, pushing retained earnings negative. This quarter’s flip to positive suggests earnings growth is now outpacing the rate of capital return via buybacks — a meaningful, if technical, balance sheet milestone.
Balance Sheet Snapshot
| Item | Jun 27, 2026 | Sep 27, 2025 |
|---|---|---|
| Total Assets | $383.27B | $359.24B |
| Total Liabilities | $275.75B | $285.51B |
| Shareholders’ Equity | $107.52B | $73.73B |
On the liability side, commercial paper fell sharply to $2.0 billion from $8.0 billion, reducing reliance on short-term funding — another balance-sheet-quality positive that U.S. credit investors would likely view favorably.
Caveat
This is a single point-in-time comparison. Should buybacks reaccelerate in future quarters, retained earnings could compress again. Confirming a genuine structural improvement in capital structure would require observing the trend over multiple quarters, not just one.
経営陣の声:記録づくしの四半期

Parsing Management Commentary
CEO Tim Cook’s exact words: “Today, Apple is proud to report our strongest June quarter ever, with double-digit revenue growth across iPhone, Mac and Services, and in every geographic segment.”
This statement’s two claims — double-digit growth in iPhone/Mac/Services, and growth across every region — are directly corroborated by the disclosed figures (iPhone +21.7%, Mac +28.7%, Services +12.1%, all five regions in double digits). This isn’t marketing spin; it’s a faithful summary of the disclosed data.
CFO Kevan Parekh added: “We are very pleased with our record business performance during the quarter, which set new June quarter records for both EPS and operating cash flow… Our installed base of active devices also reached a new all-time high across all major product categories and geographic segments.”
For U.S. investors used to seeing Apple disclose specific installed-base figures (historically cited as “over 2 billion active devices” in past calls), this release provides no updated unit count — so the claim can’t be independently verified from this filing alone. That said, the installed-base narrative is directionally consistent with Services revenue growth (+12.1% to $30.74B), since a larger device base supports more subscription and App Store revenue — a reasonably supported inference, even if not a hard proof.
What’s Next
The earnings call is set for July 30, 2026, at 2:00 PM Pacific. Investors should watch for management’s commentary on September-quarter demand and the upcoming new-product cycle, which typically drives Apple’s fiscal Q4.
市場への示唆:一時益の剥落は評価されるか
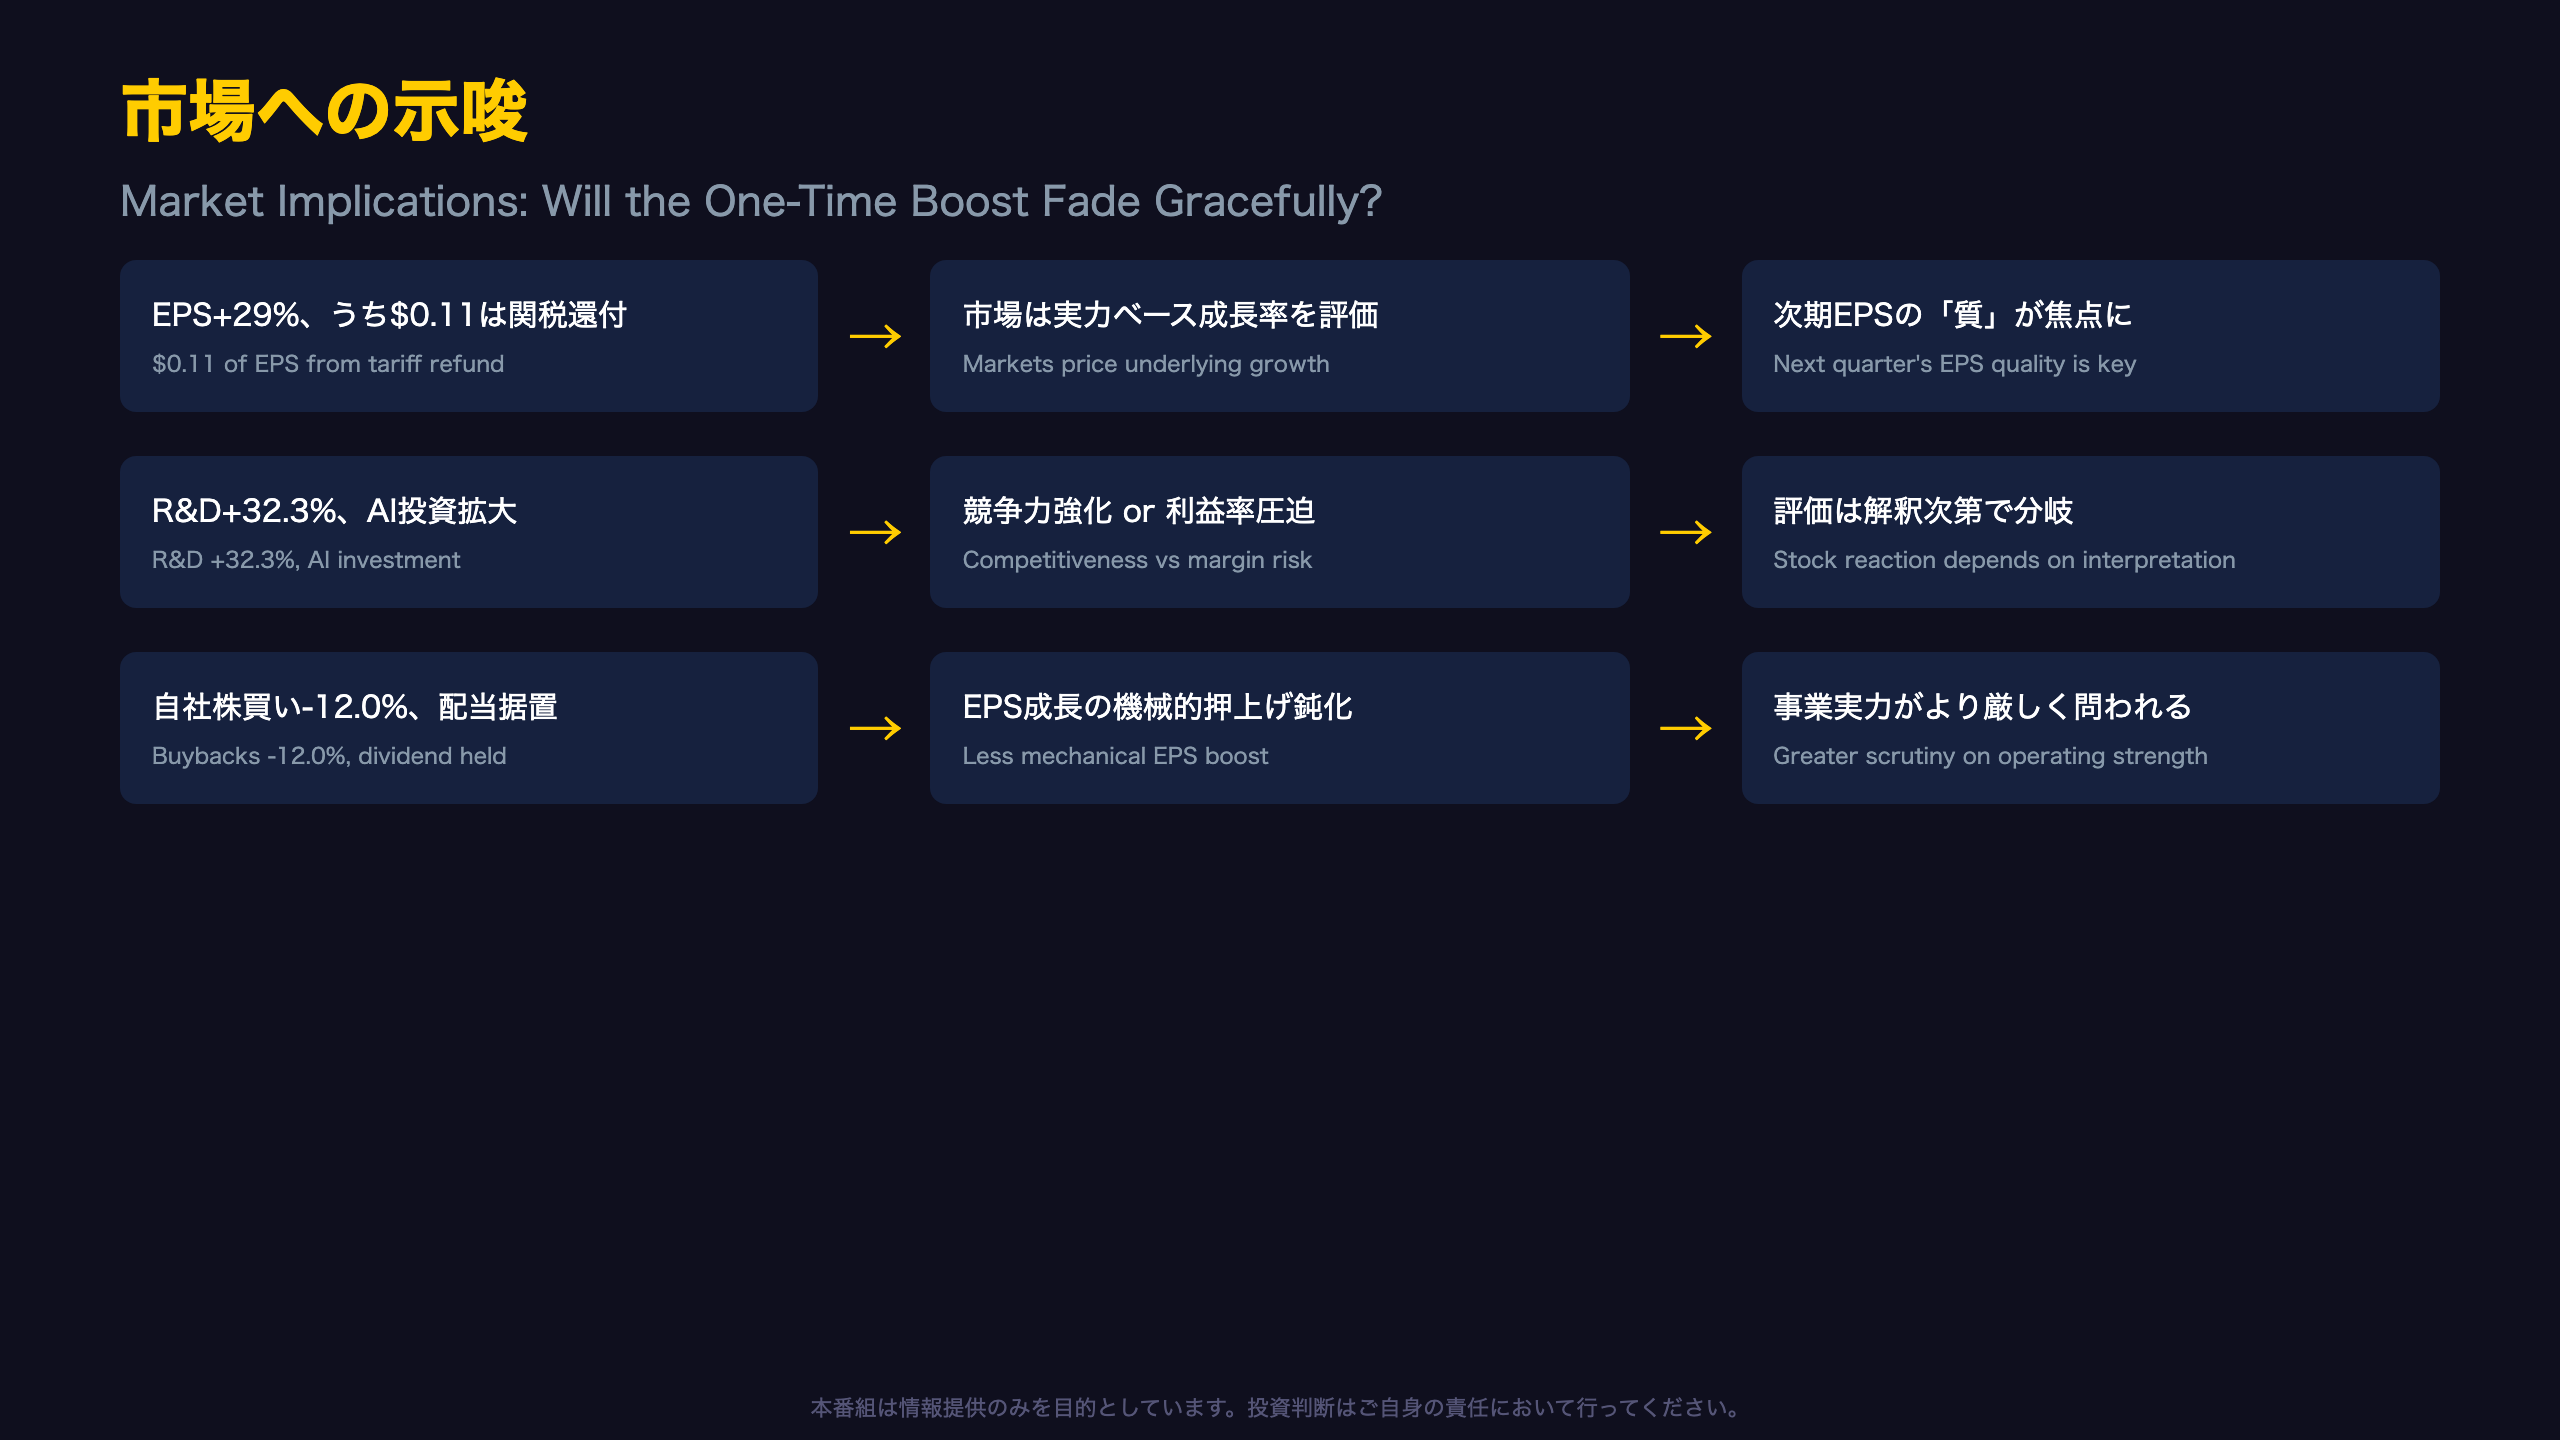
Market Implications: Reading the Chain of Logic
Chain 1: EPS Quality
[Fact] EPS of $2.02 (+29% YoY) includes $0.11 from a one-time tariff refund → [Mechanism] Markets generally price forward earnings based on underlying, recurring growth rates rather than one-time items → [Implication] Next quarter’s EPS growth rate, once this benefit fades, may become the more relevant benchmark for valuation. However, this filing alone cannot confirm how much the market has already priced in this one-time nature.
Chain 2: R&D Surge and Margin Risk
[Fact] R&D expense rose to $11.73B (+32.3% YoY), and +32.5% over nine months → [Mechanism] A sustained surge in R&D-to-revenue ratio is generally viewed as an investment phase with uncertain near-term payoff → [Implication] If investors interpret this as AI-driven competitive strengthening (following the new Siri AI unveiled at WWDC26), it could be a positive catalyst; if seen as margin dilution without near-term monetization, it could weigh on the stock.
Chain 3: Capital Allocation Shift
[Fact] Nine-month buybacks fell 12.0% while the $0.27 dividend was maintained → [Mechanism] Slower buybacks generally reduce the mechanical EPS boost from share-count reduction → [Implication] Future EPS growth will depend more heavily on actual operating performance rather than financial engineering, raising the bar for “quality” of future beats.
Bottom Line for US Investors
This is a report where genuine strength (iPhone/Mac/Services demand, +43.1% operating cash flow, retained earnings turning positive) coexists with caution flags (one-time tariff EPS boost, iPad decline, R&D surge, slower buybacks). It resists a simple bull/bear framing — a nuanced read is warranted ahead of the July 30 earnings call.
Disclaimer: This article is for informational purposes only. All investment decisions are made solely at your own risk.