📺 Watch the Full Video Analysis
This article was automatically generated by the NFC Market Live AI analysis system. (Updated: 2026-07-30 21:42 JST)
📄 Primary Source
U.S. Bureau of Economic Analysis
https://www.bea.gov/sites/default/files/2026-07/pi0626.pdf
📊 Deep dive into the BEA’s June 2026 Personal Income and Outlays report, released July 30.
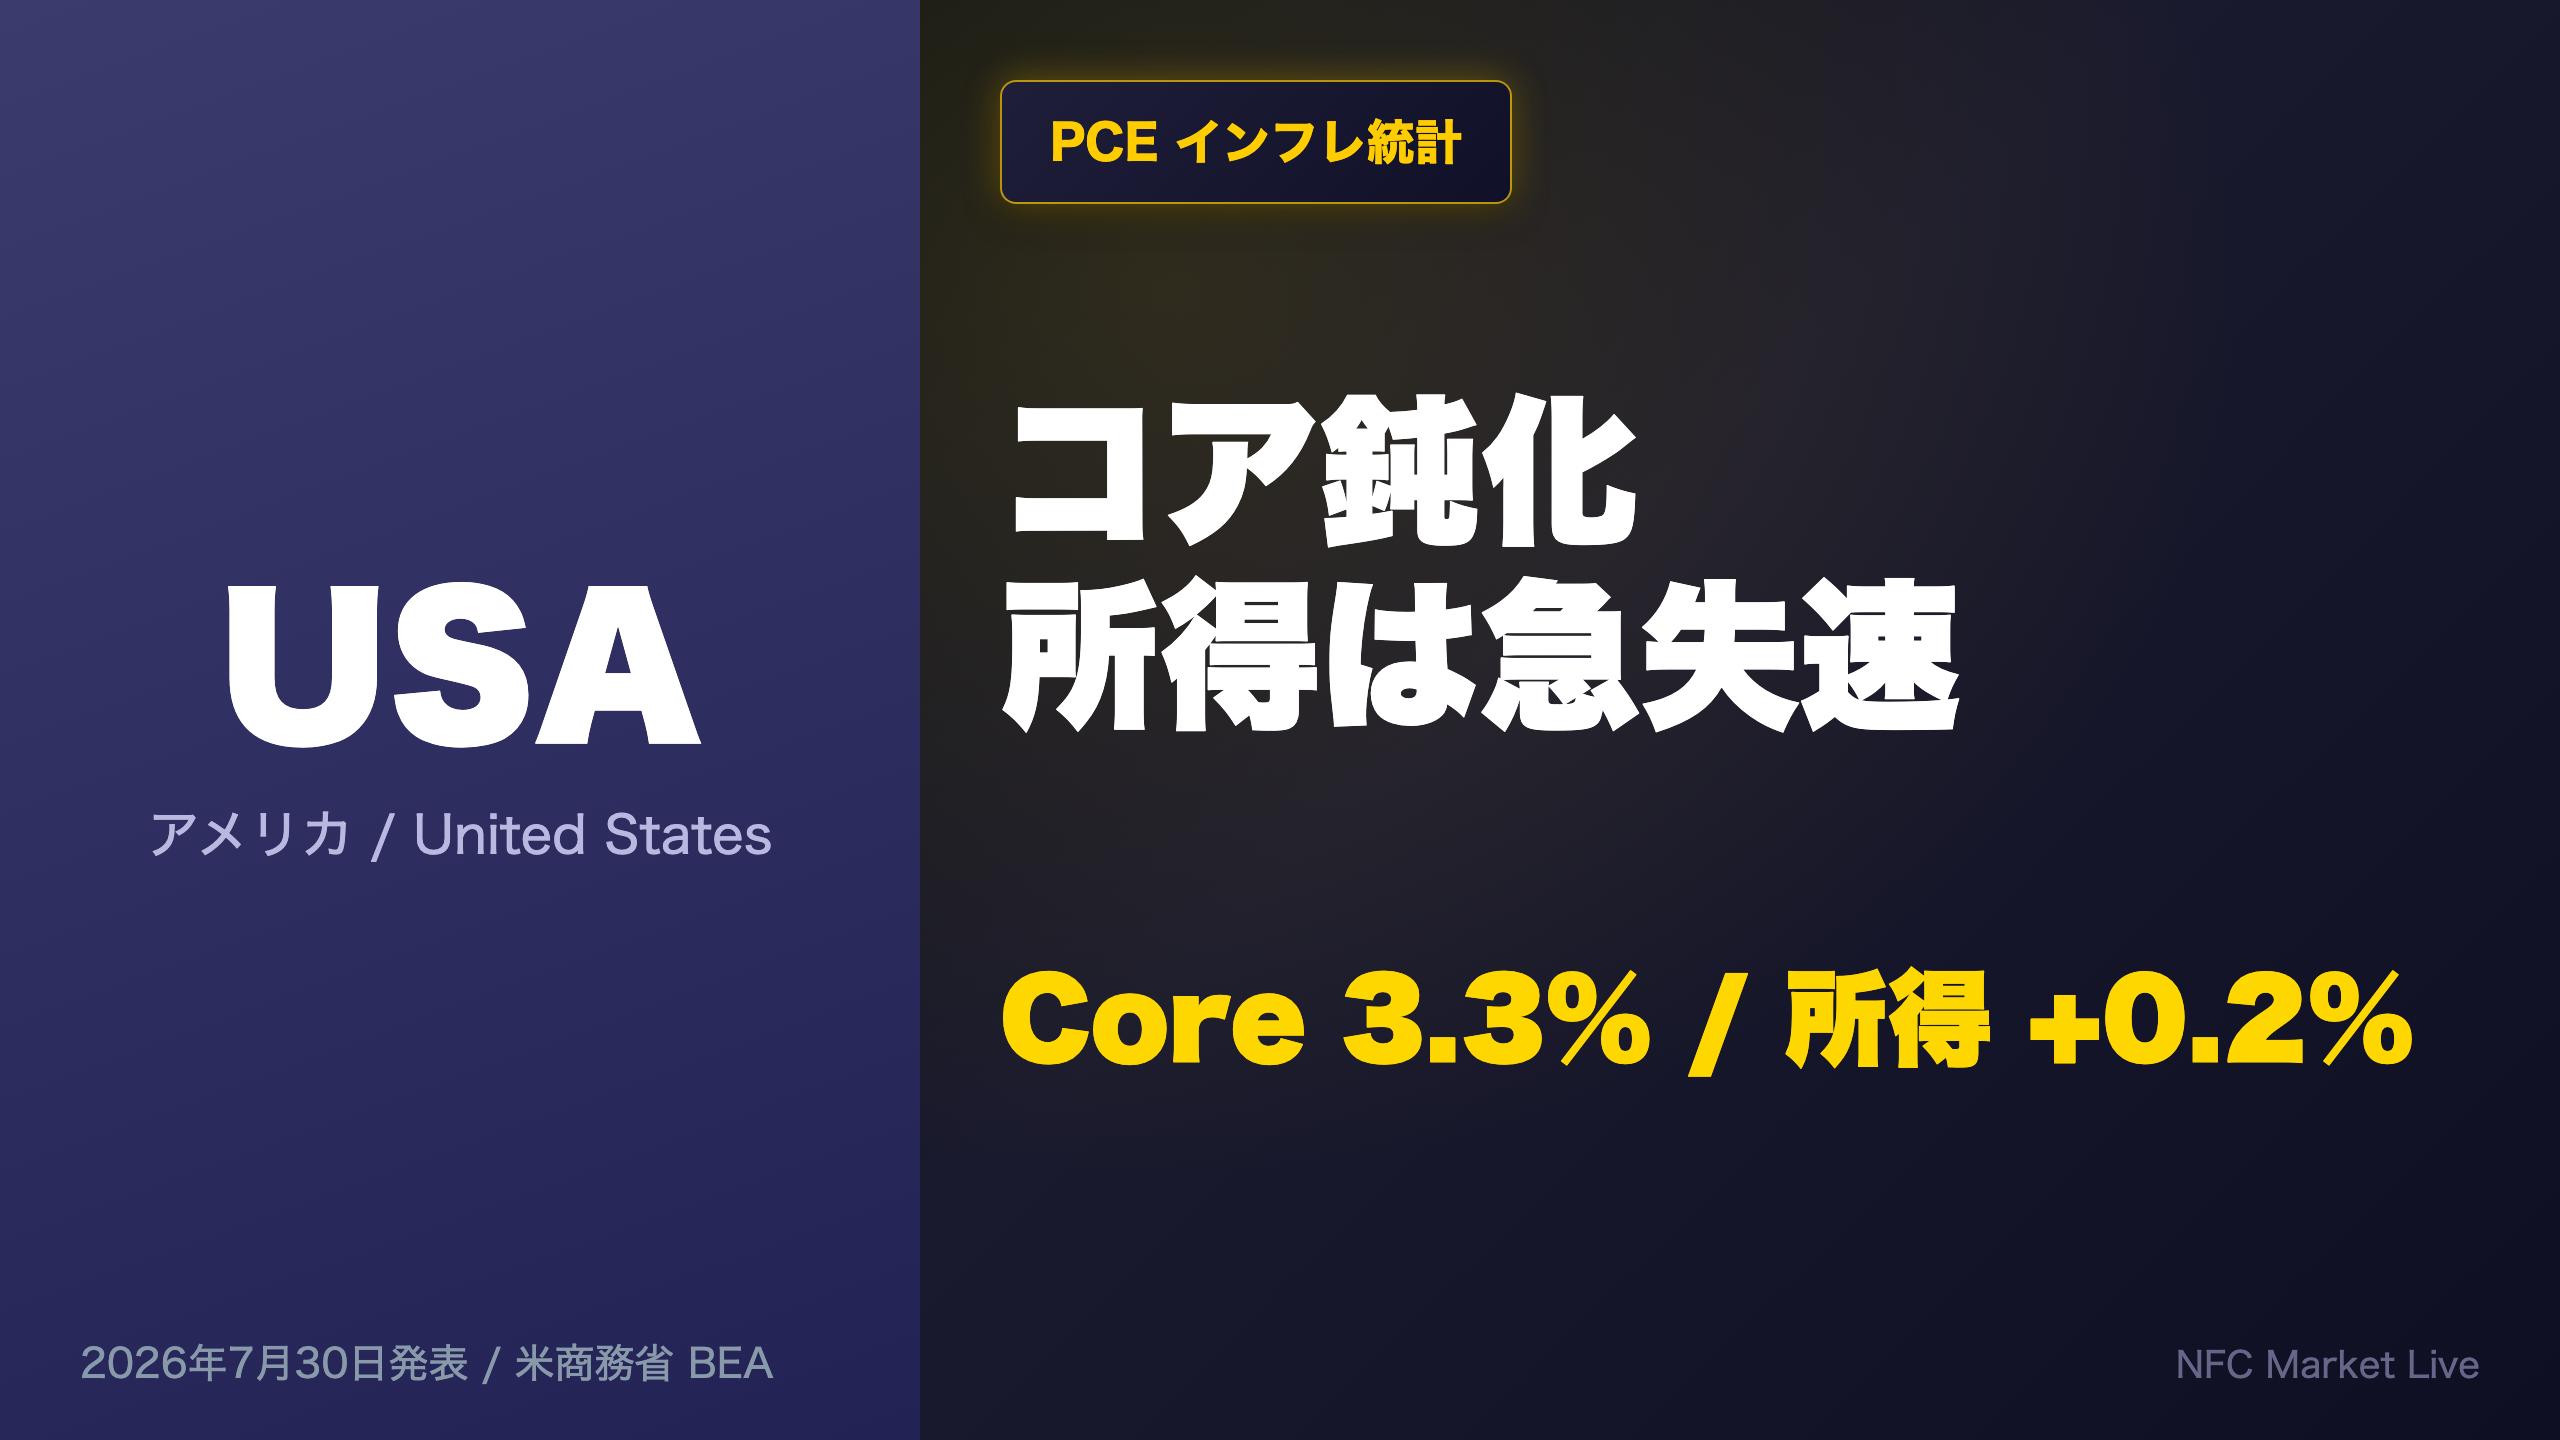
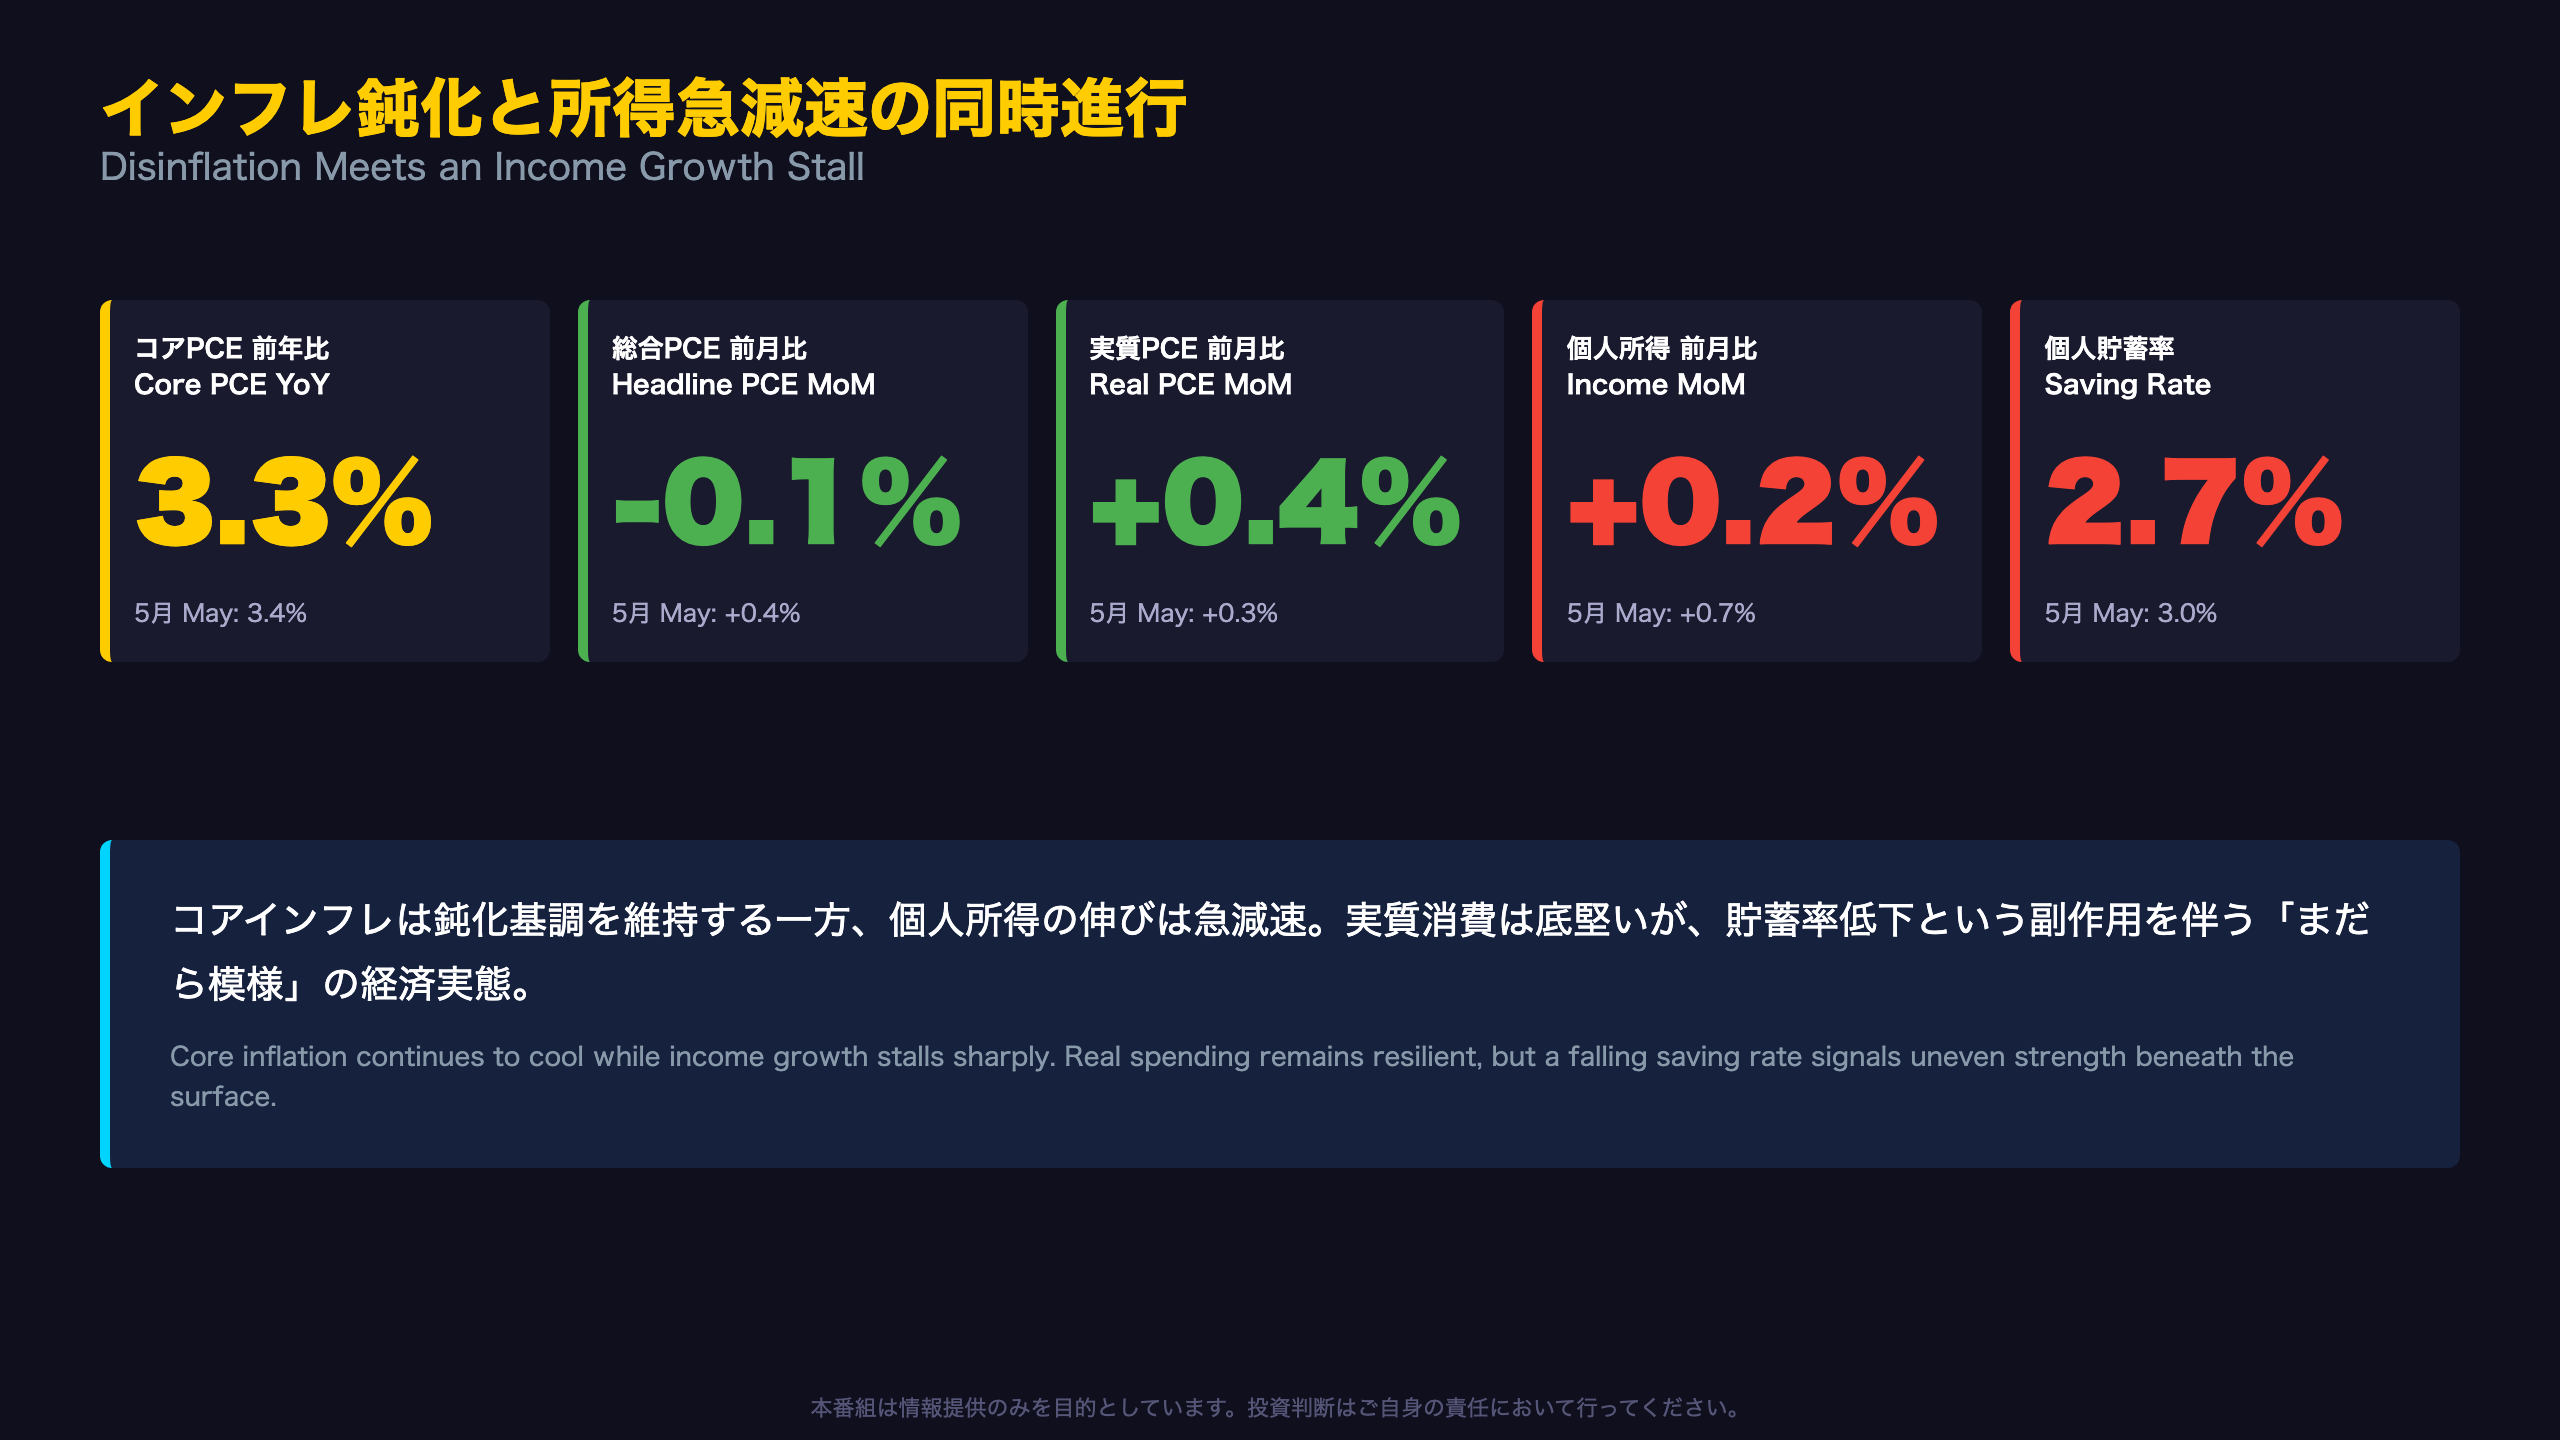
Core PCE inflation cooled to 3.3% YoY (from 3.4%), with the monthly pace decelerating sharply to just 0.1%.
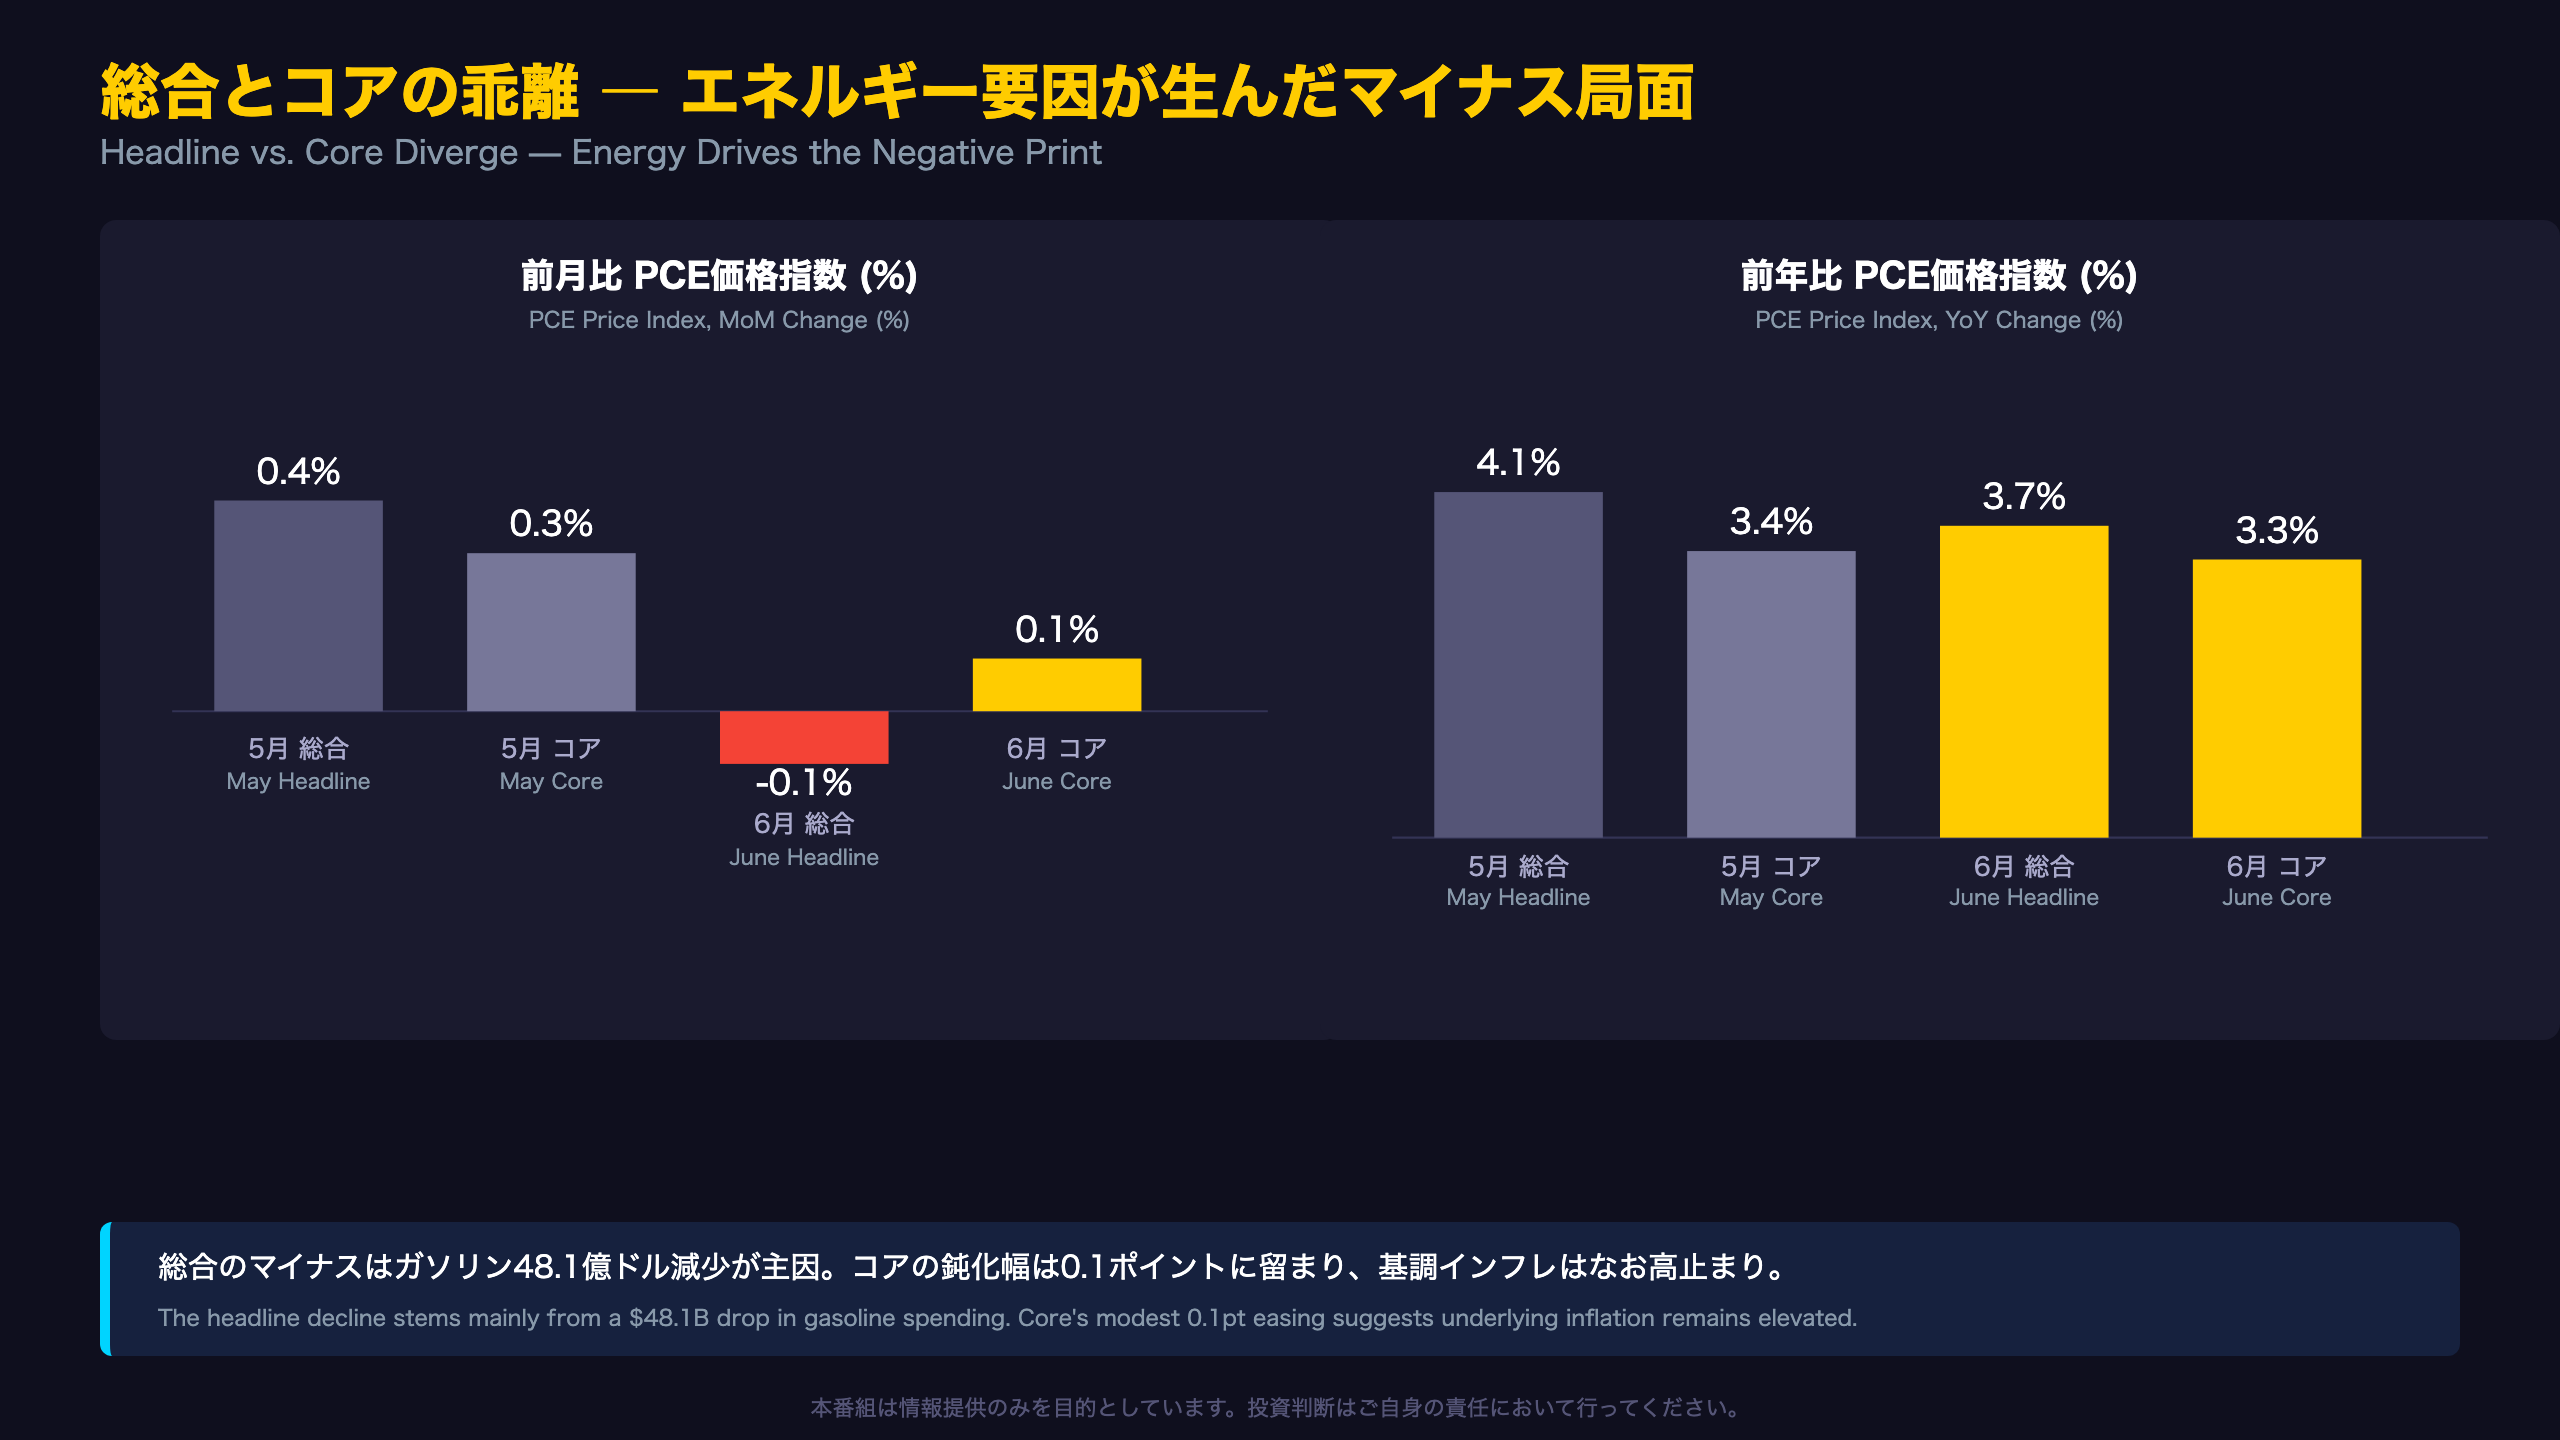
Headline PCE actually turned negative at -0.1% MoM, driven by a $48.1B drop in gasoline spending.
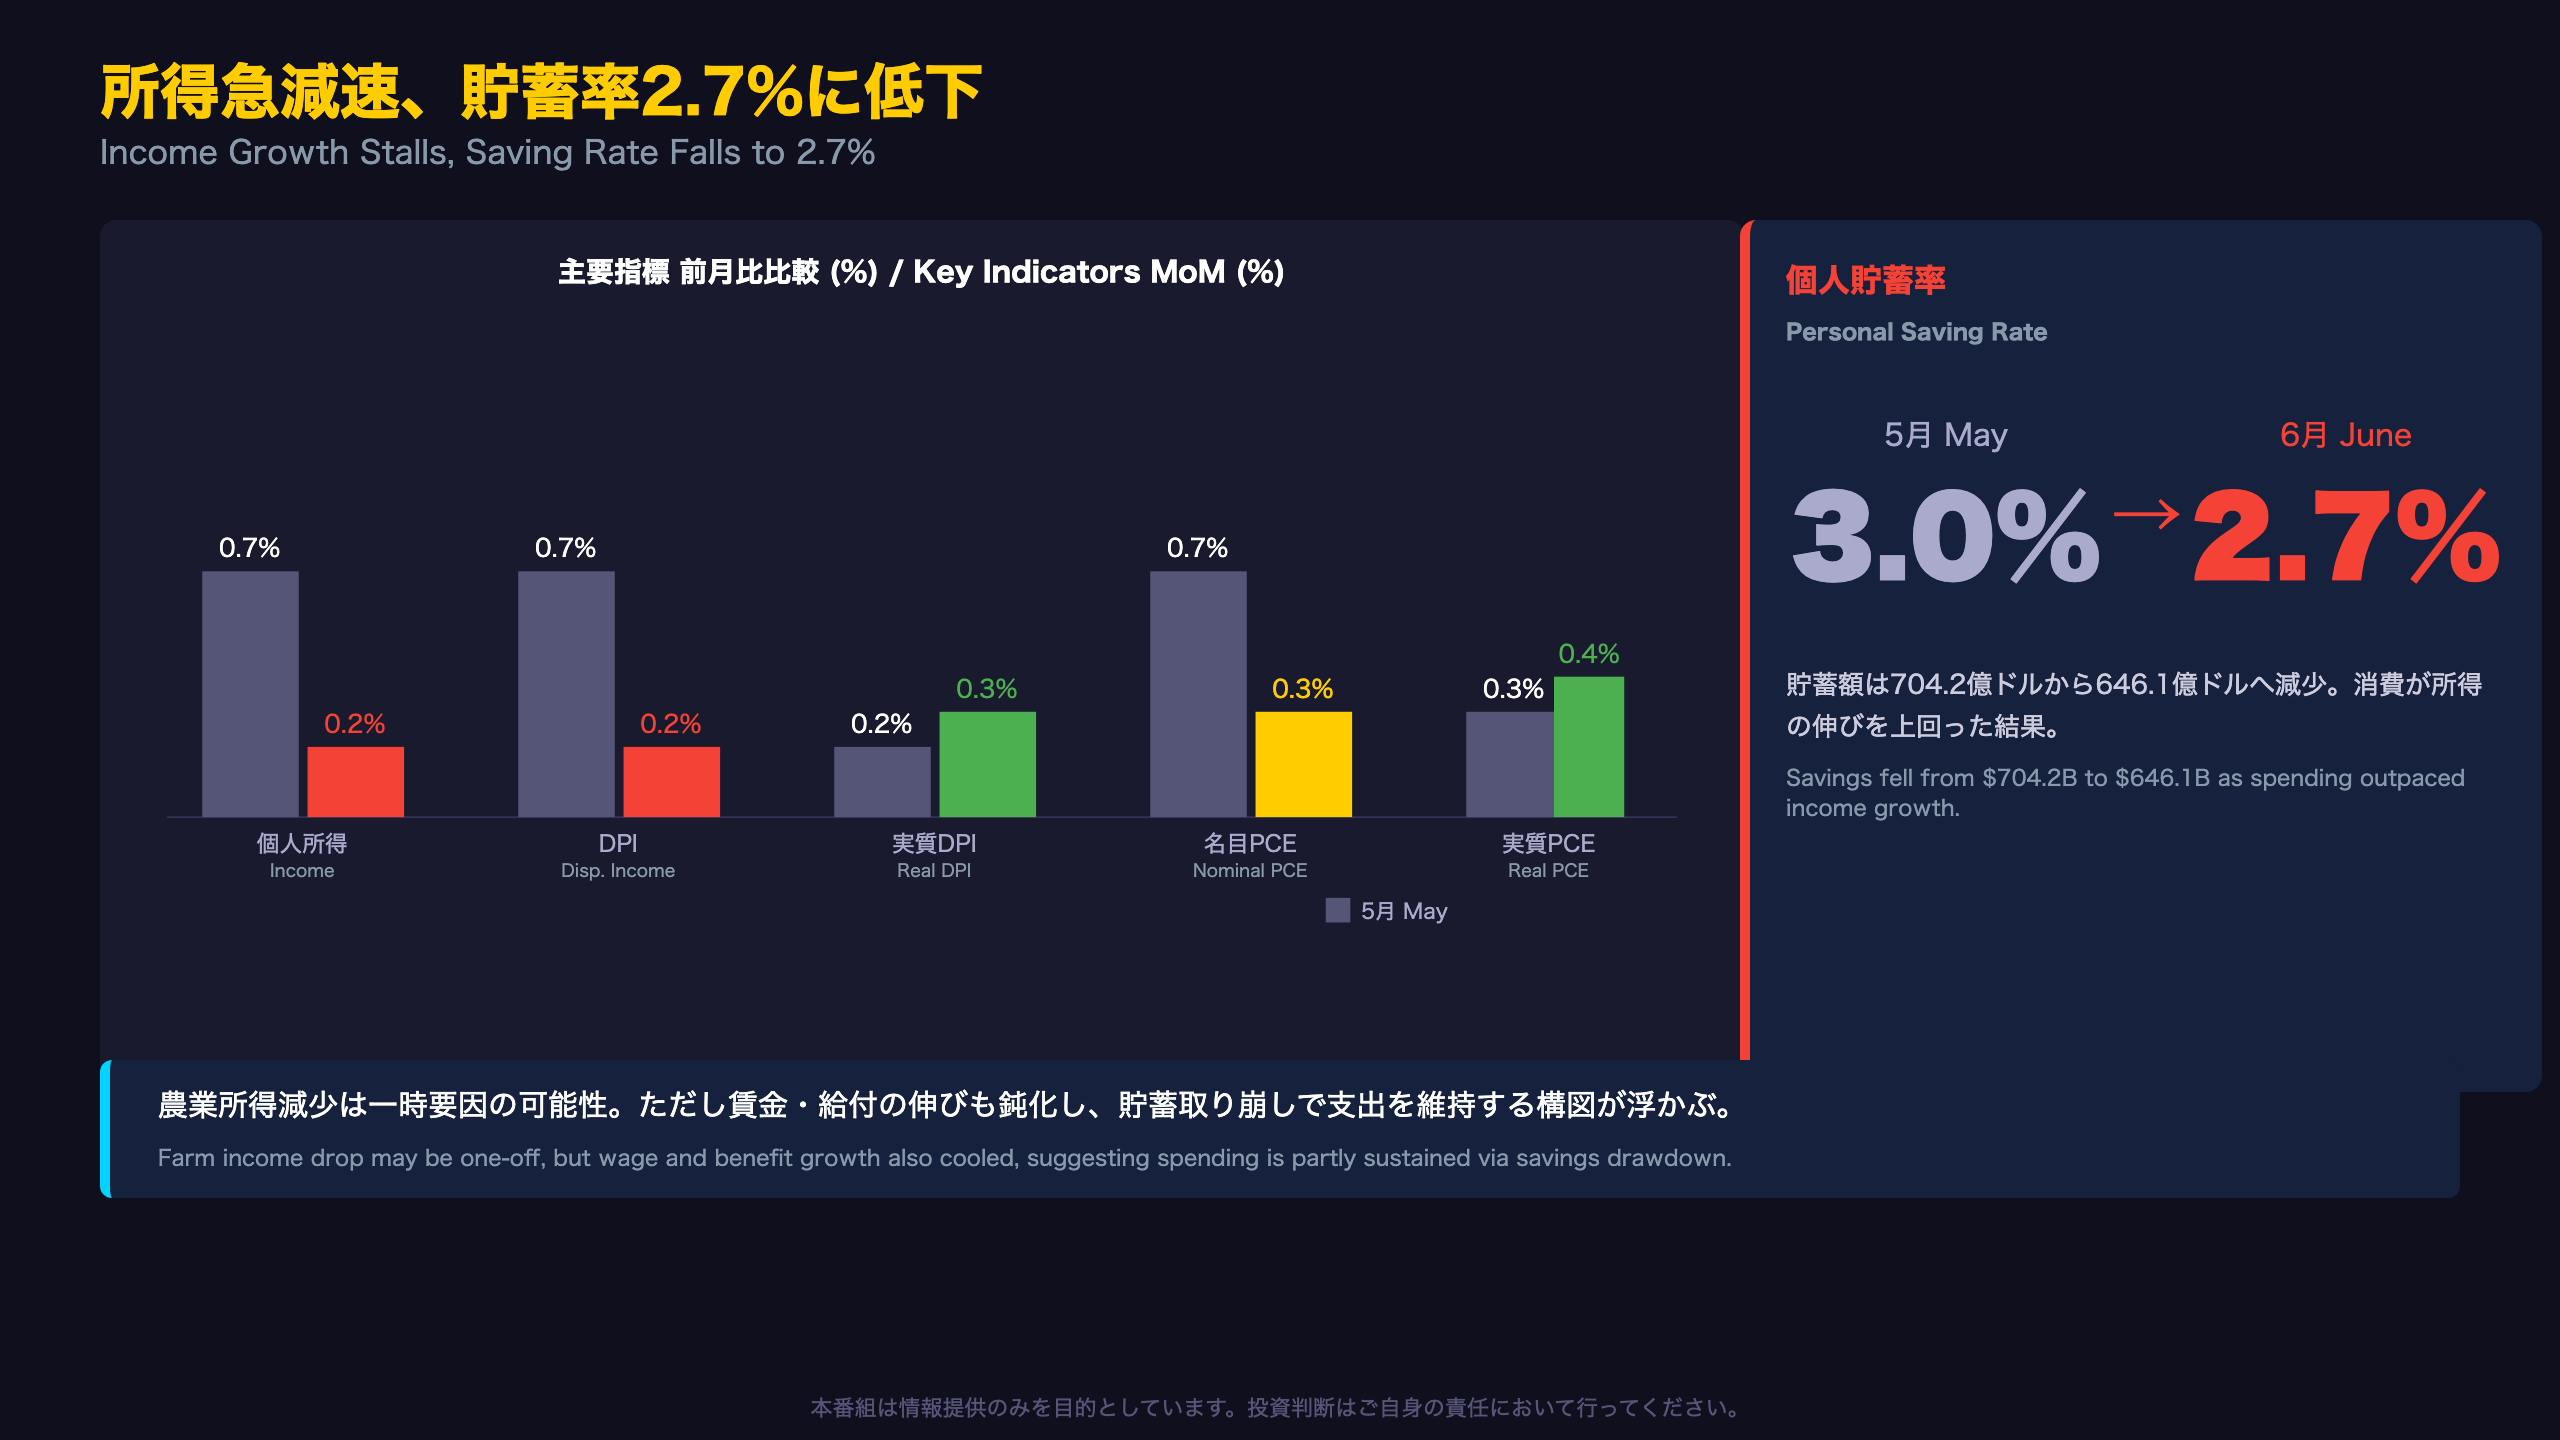
💡 But beneath the surface, personal income growth stalled from 0.7% to 0.2% MoM, and the saving rate fell from 3.0% to 2.7%.
Real PCE accelerated to 0.4%, showing resilient consumer demand.
⚠️ We unpack this two-sided report — welcome disinflation vs. a softening income base — and what it means for the Fed’s rate path.
インフレ鈍化と所得急減速の同時進行
Report Context
On July 30, 2026, the U.S. Bureau of Economic Analysis (BEA) released its Personal Income and Outlays report for June. The next release, covering July data, is scheduled for August 26, 2026.
Two Diverging Stories
This release is notable for how sharply inflation and income indicators diverged:
– Core PCE price index (YoY): 3.3% (down from 3.4% in May)
– Personal income (MoM): +0.2% (down sharply from +0.7% in May)
“The June increase of $54.9 billion in personal income primarily reflected increases in compensation, personal income receipts on assets, and government social benefits that were partly offset by a decrease in farm proprietors’ income.”
Bull Case vs. Bear Case
Bulls argue that core inflation cooling toward the Fed’s 2% target, combined with real PCE accelerating from 0.3% to 0.4%, signals resilient consumer demand alongside genuine disinflation progress. Bears counter that the sharp income slowdown and falling saving rate (3.0% to 2.7%) suggest spending is increasingly funded by drawing down savings rather than wage growth.
For International Readers
Unlike the CPI often highlighted in headlines, the Fed’s preferred inflation gauge is the PCE price index used here — it captures broader substitution effects across the consumer basket, making today’s 3.3% core reading directly relevant to FOMC decisions.
What to Watch Next
The July data, due August 26, will show whether gasoline effects reverse and whether income growth rebounds.
総合とコアの乖離 ― エネルギー要因が生んだマイナス局面
The Energy Story Behind the Numbers
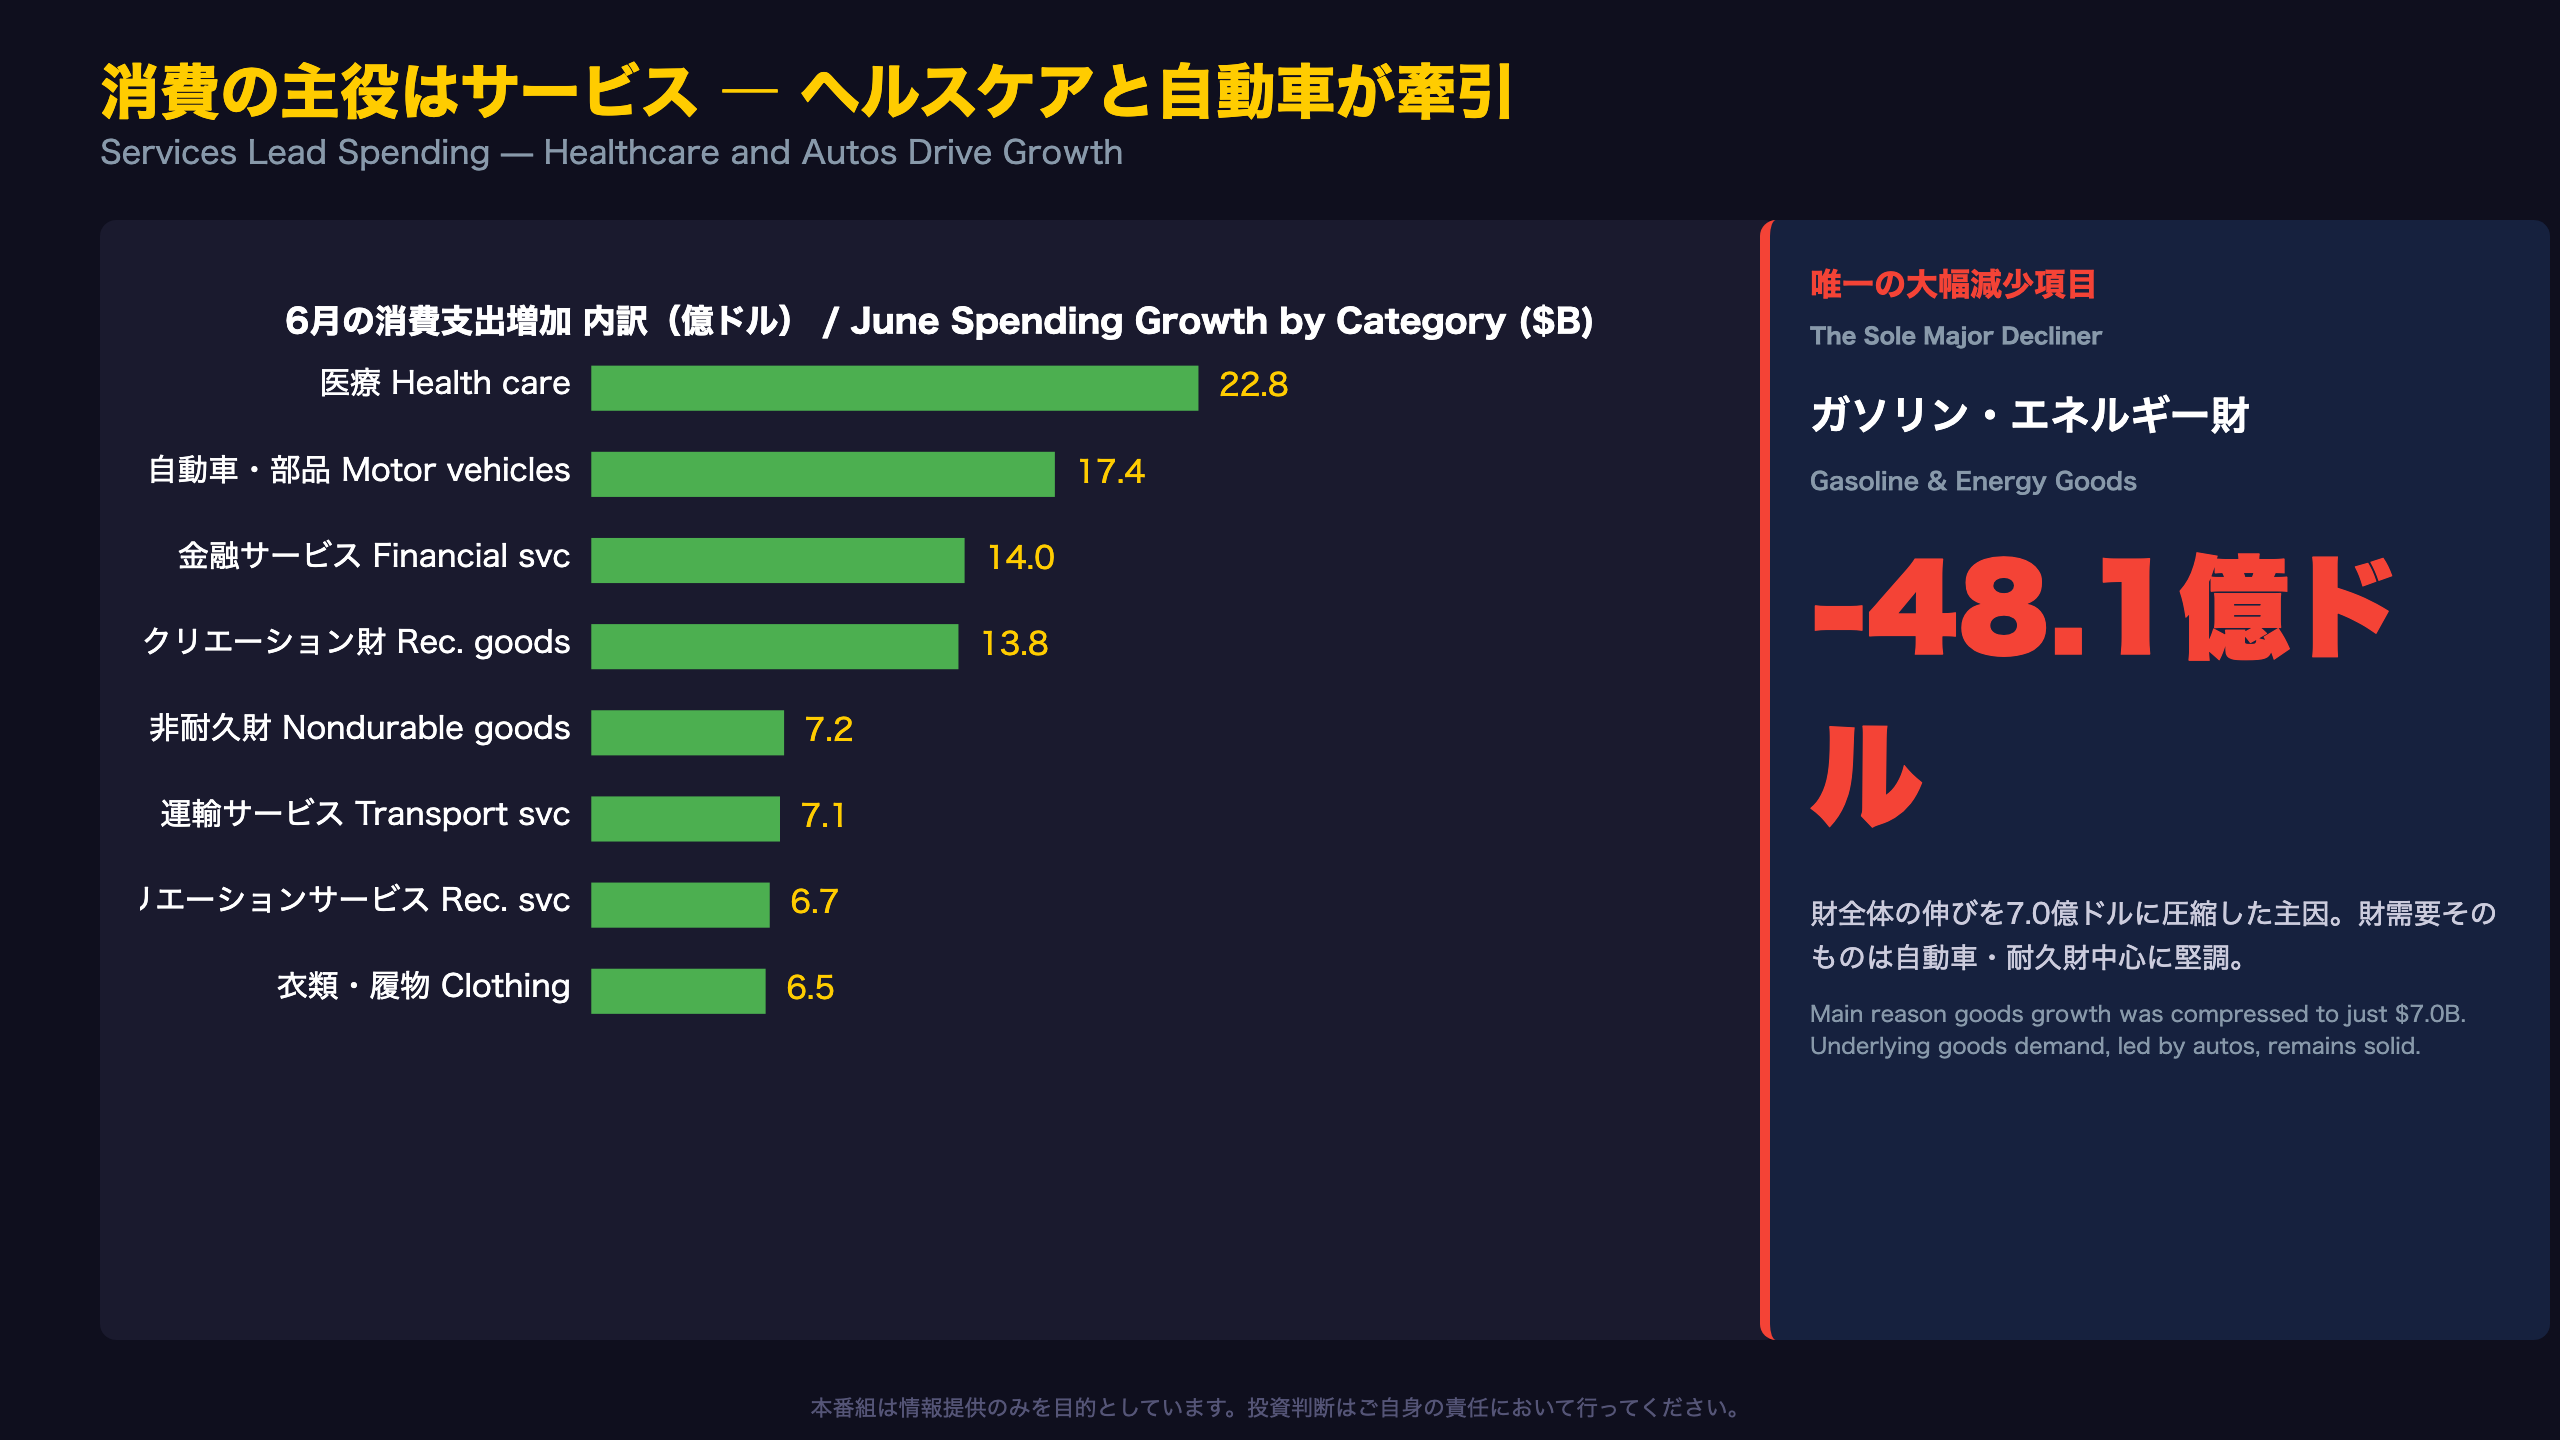
Goods spending rose just $7.0 billion in June, almost entirely because gasoline and energy goods spending fell $48.1 billion. Strip that out, and goods demand looks healthy: motor vehicles and parts rose $17.4 billion, recreational goods and vehicles rose $13.8 billion.
Headline vs. Core: A Rare Sign Flip
Month-over-month, headline PCE inflation turned negative (-0.1%) while core stayed positive (+0.1%) — an unusual divergence. Year-over-year, headline cooled from 4.1% to 3.7% (a 0.4pt drop) while core eased more modestly from 3.4% to 3.3% (a 0.1pt drop).
“Excluding food and energy, the PCE price index increased 0.1 percent.” (BEA, June 2026 release)
Technical Note: Legal Services Adjustments
BEA’s prior technical notes mention that “the PCE price index for legal services was adjusted for the months of January and March” — a reminder that even headline inflation gauges involve judgment calls on volatile subcomponents.
Bull vs. Bear Read
Bulls see the core deceleration as evidence of genuine, broadening disinflation. Bears note that a 0.1 percentage point move is within typical measurement noise.
Context for Global Investors
Unlike the Eurozone’s HICP or Japan’s core CPI, the U.S. PCE index is the Fed’s official inflation target metric — making today’s 3.3% core reading directly relevant to FOMC rate decisions.
消費の主役はサービス ― ヘルスケアと自動車が牽引
The Services-Driven Economy
Of June’s $65.2 billion spending increase, services accounted for $58.2 billion — nearly 90% of the total — while goods rose just $7.0 billion.
Top Contributing Categories
| Category | Increase ($B) |
|---|---|
| Health care | 22.8 |
| Motor vehicles & parts | 17.4 |
| Financial services & insurance | 14.0 |
| Recreational goods & vehicles | 13.8 |
| Other nondurable goods | 7.2 |
| Transportation services | 7.1 |
The Gasoline Outlier
Gasoline and energy goods was the only category posting a sizable decline, down $48.1 billion. The report doesn’t break out price versus volume effects, so the precise driver can’t be confirmed from this release alone.
May-to-June Comparison
In May, services rose $94.3 billion and goods rose $61.8 billion. Goods spending has since collapsed from $61.8B to just $7.0B month-over-month, almost entirely due to the energy swing.
Why This Matters for Sector Investors
The dominance of services — healthcare, financial services, transportation — suggests U.S. consumers continue prioritizing necessities and experiences over discretionary durable goods.
Looking Ahead
The July release (August 26) will show whether gasoline spending rebounds and whether June’s auto sales momentum persists.
所得急減速、貯蓄率2.7%に低下
Decomposing the Quality of Income Growth
BEA attributes June’s $54.9 billion personal income gain to three drivers: private wages and salaries, personal income receipts on assets (dividends and interest), and government social benefits (Medicare and Social Security). Farm proprietors’ income declined, which BEA explains “reflected the pattern of payments to farmers from the American Relief Act of 2025.”
One-Off or Structural?
If the farm income decline is purely a payment-timing artifact, income growth could rebound in July. However, the release doesn’t provide a granular breakdown of wage growth, limiting how far this conclusion can be extended.
The Real (Inflation-Adjusted) Picture
While nominal DPI growth slowed from 0.7% to 0.2%, real DPI actually improved slightly, from 0.2% to 0.3% — because the drop in the PCE price index more than offset the nominal income slowdown, preserving purchasing power.
Saving in Dollar Terms
Personal saving fell from $704.2 billion in May to $646.1 billion in June, pushing the saving rate down from 3.0% to 2.7%.
Context: U.S. Saving Rates
A saving rate near 2.7-3.0% is on the lower end of the post-pandemic range, though this release alone cannot confirm whether it’s a durable shift or a temporary drawdown.
Bull vs. Bear
Bulls point to improving real DPI as evidence consumers aren’t losing ground. Bears warn that nominal income deceleration combined with a falling saving rate typically precedes consumption slowdowns.
FRBへの示唆 ― 二つの根拠の鎖
Unpacking the Policy Implications
This report doesn’t point in a single direction. Core PCE cooling is dovish-leaning, but the income slowdown is genuinely two-sided.
Chain of Reasoning: Inflation Side
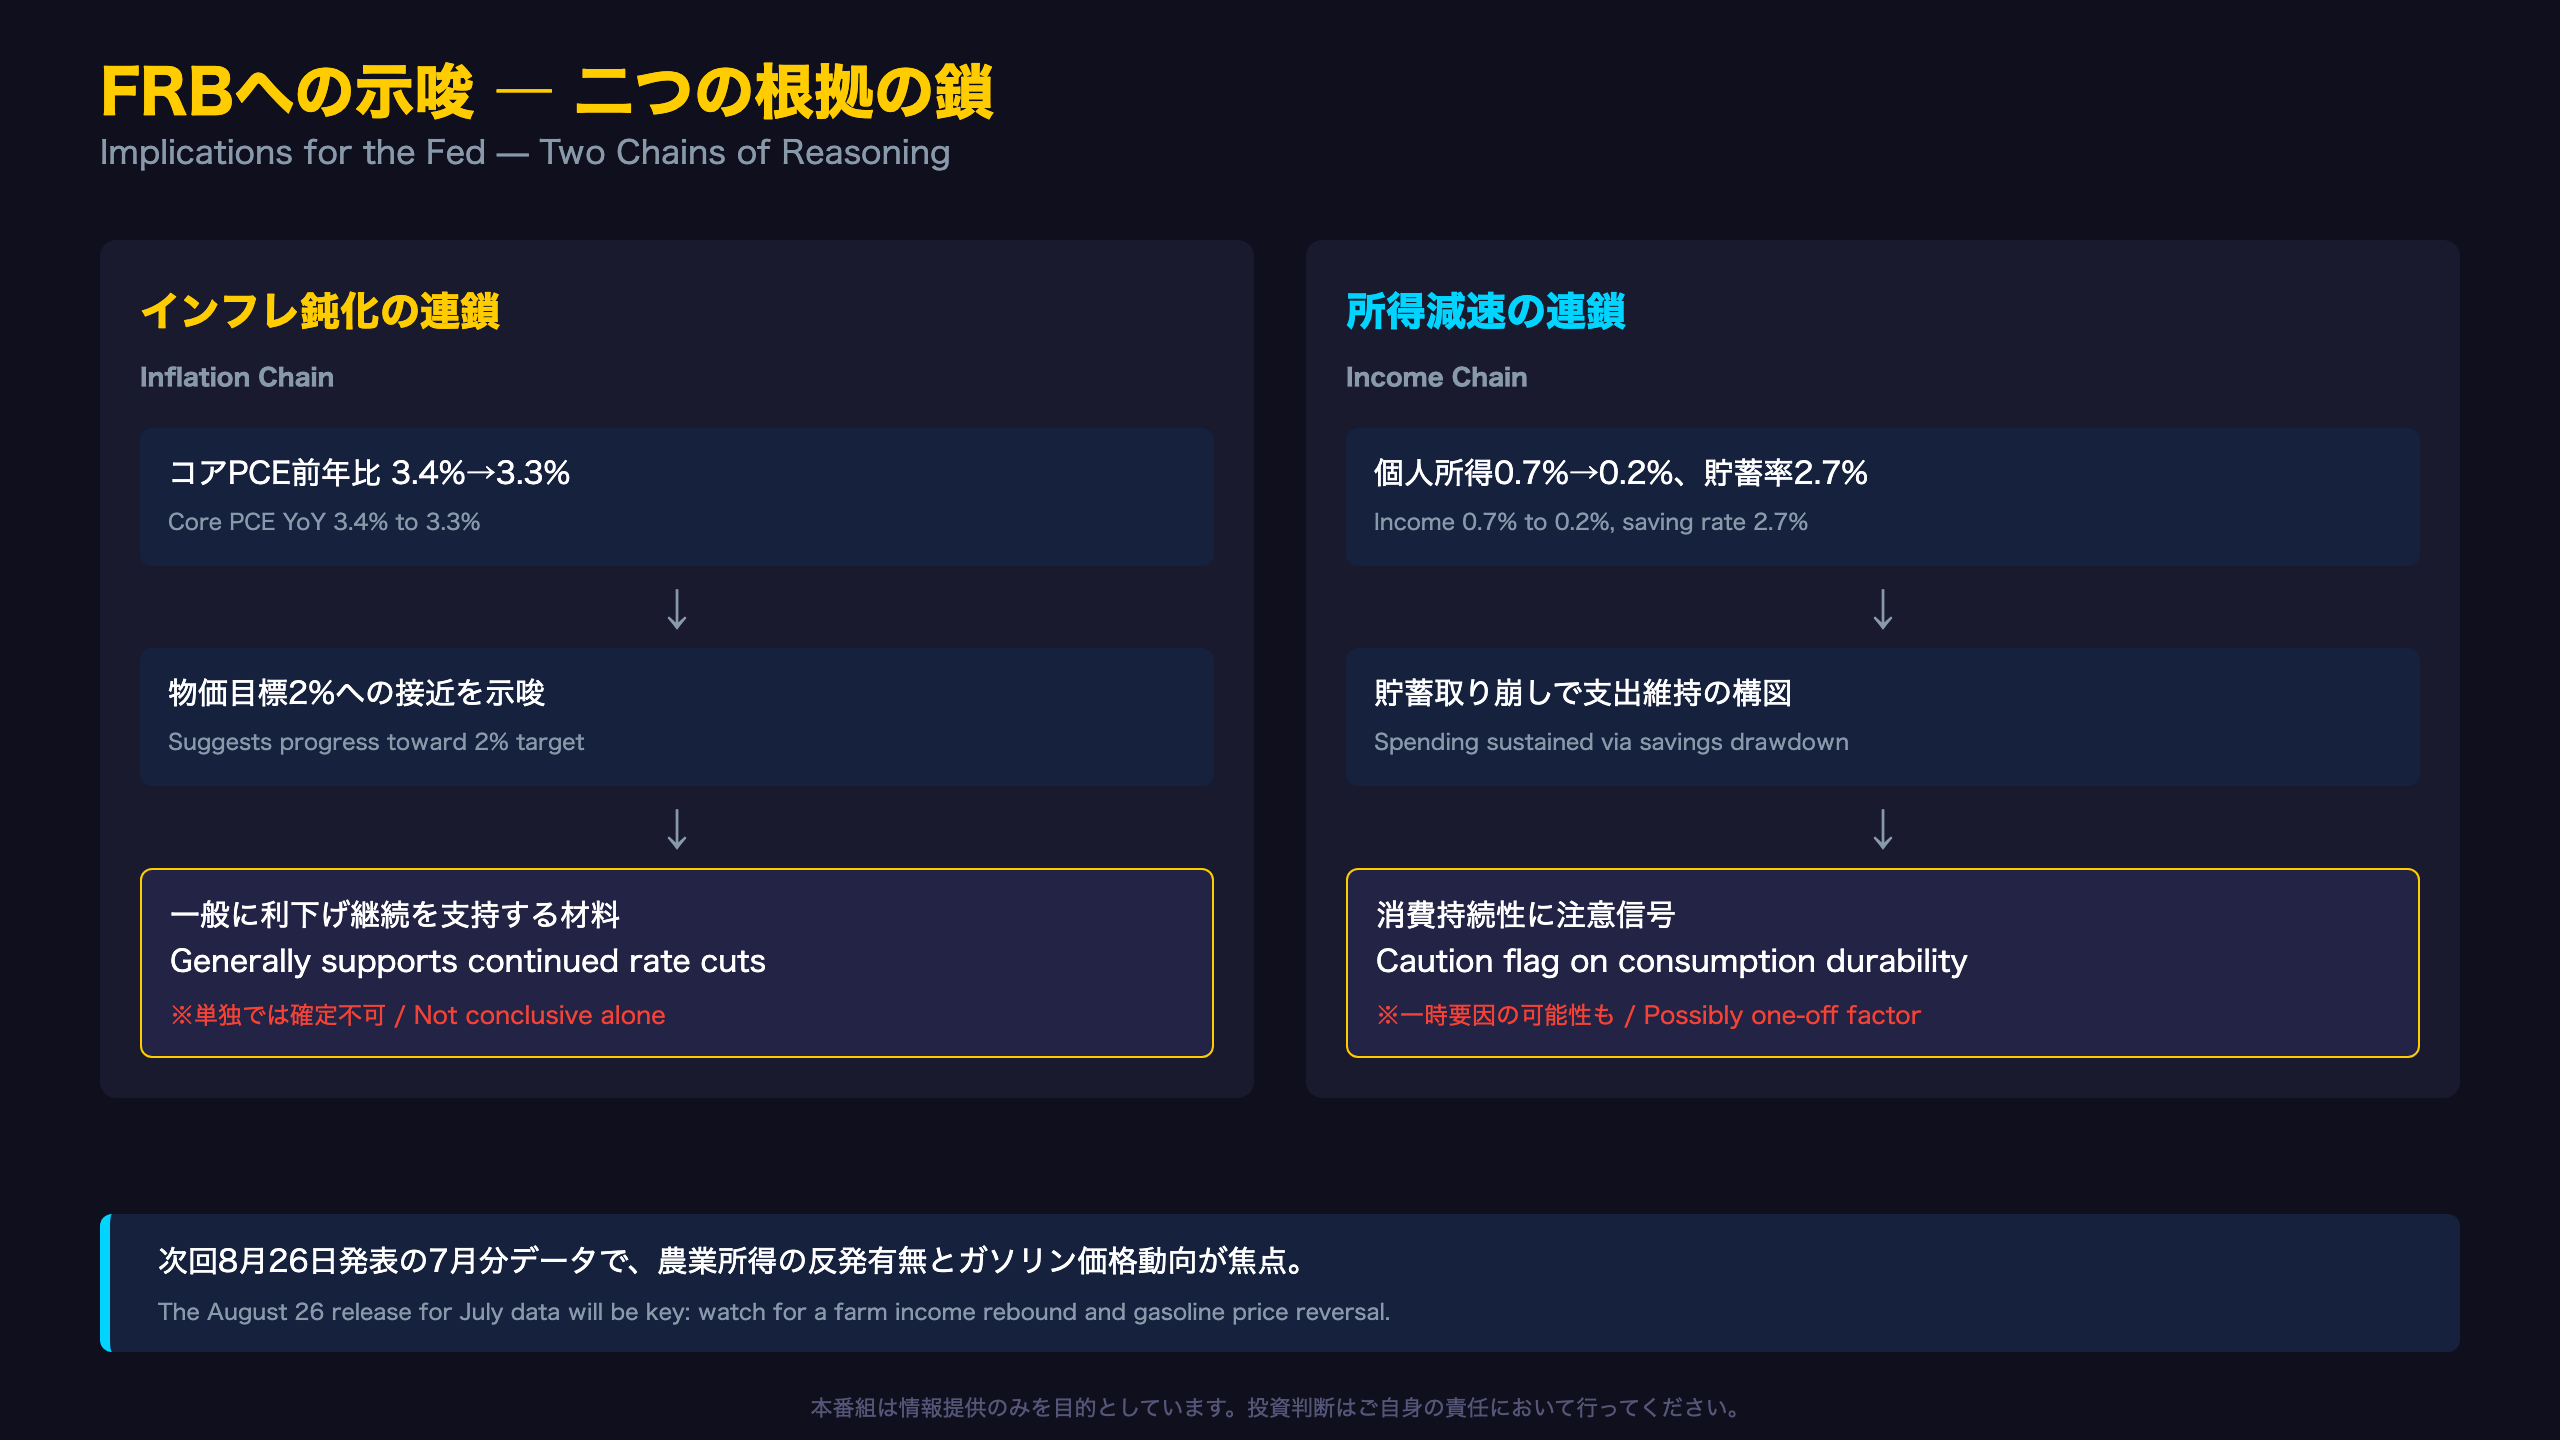
Core PCE YoY eased from 3.4% to 3.3% → this suggests gradual progress toward the Fed’s 2% target → it is generally believed that continued disinflation supports the case for further rate cuts, though this single data point cannot confirm the pace or timing of any FOMC action.
Chain of Reasoning: Income & Consumption Side
Personal income growth slowed from 0.7% to 0.2% MoM while the saving rate fell from 3.0% to 2.7% → this suggests consumers are sustaining spending partly by drawing down savings → it is generally understood that savings-drawdown-funded consumption has limits, though the farm income decline’s one-off nature means this cannot be confirmed as a structural shift from this release alone.
What to Watch Next
The July report (August 26) will be pivotal on three fronts: (1) whether farm income rebounds, (2) whether gasoline effects reverse, and (3) whether core services inflation reaccelerates.
Bottom Line for Investors
This report resists easy dovish-or-hawkish labeling. For FX and rates traders, the core inflation trajectory supports a continued Fed easing bias, while the income data injects genuine uncertainty about consumption durability — arguing for a data-dependent read on the Fed’s next moves.
Disclaimer: This article is for informational purposes only. All investment decisions are made solely at your own risk.