📺 Watch the Full Video Analysis
This article was automatically generated by the NFC Market Live AI analysis system. (Updated: 2026-07-30 09:54 JST)
Analysis of Japan’s Ministry of Finance weekly international securities flow data (Jul 19-25, 2026).
📊 Foreign investors flipped to net buying Japanese equities (+¥912.1bn), sustaining a resilient stock market trend.
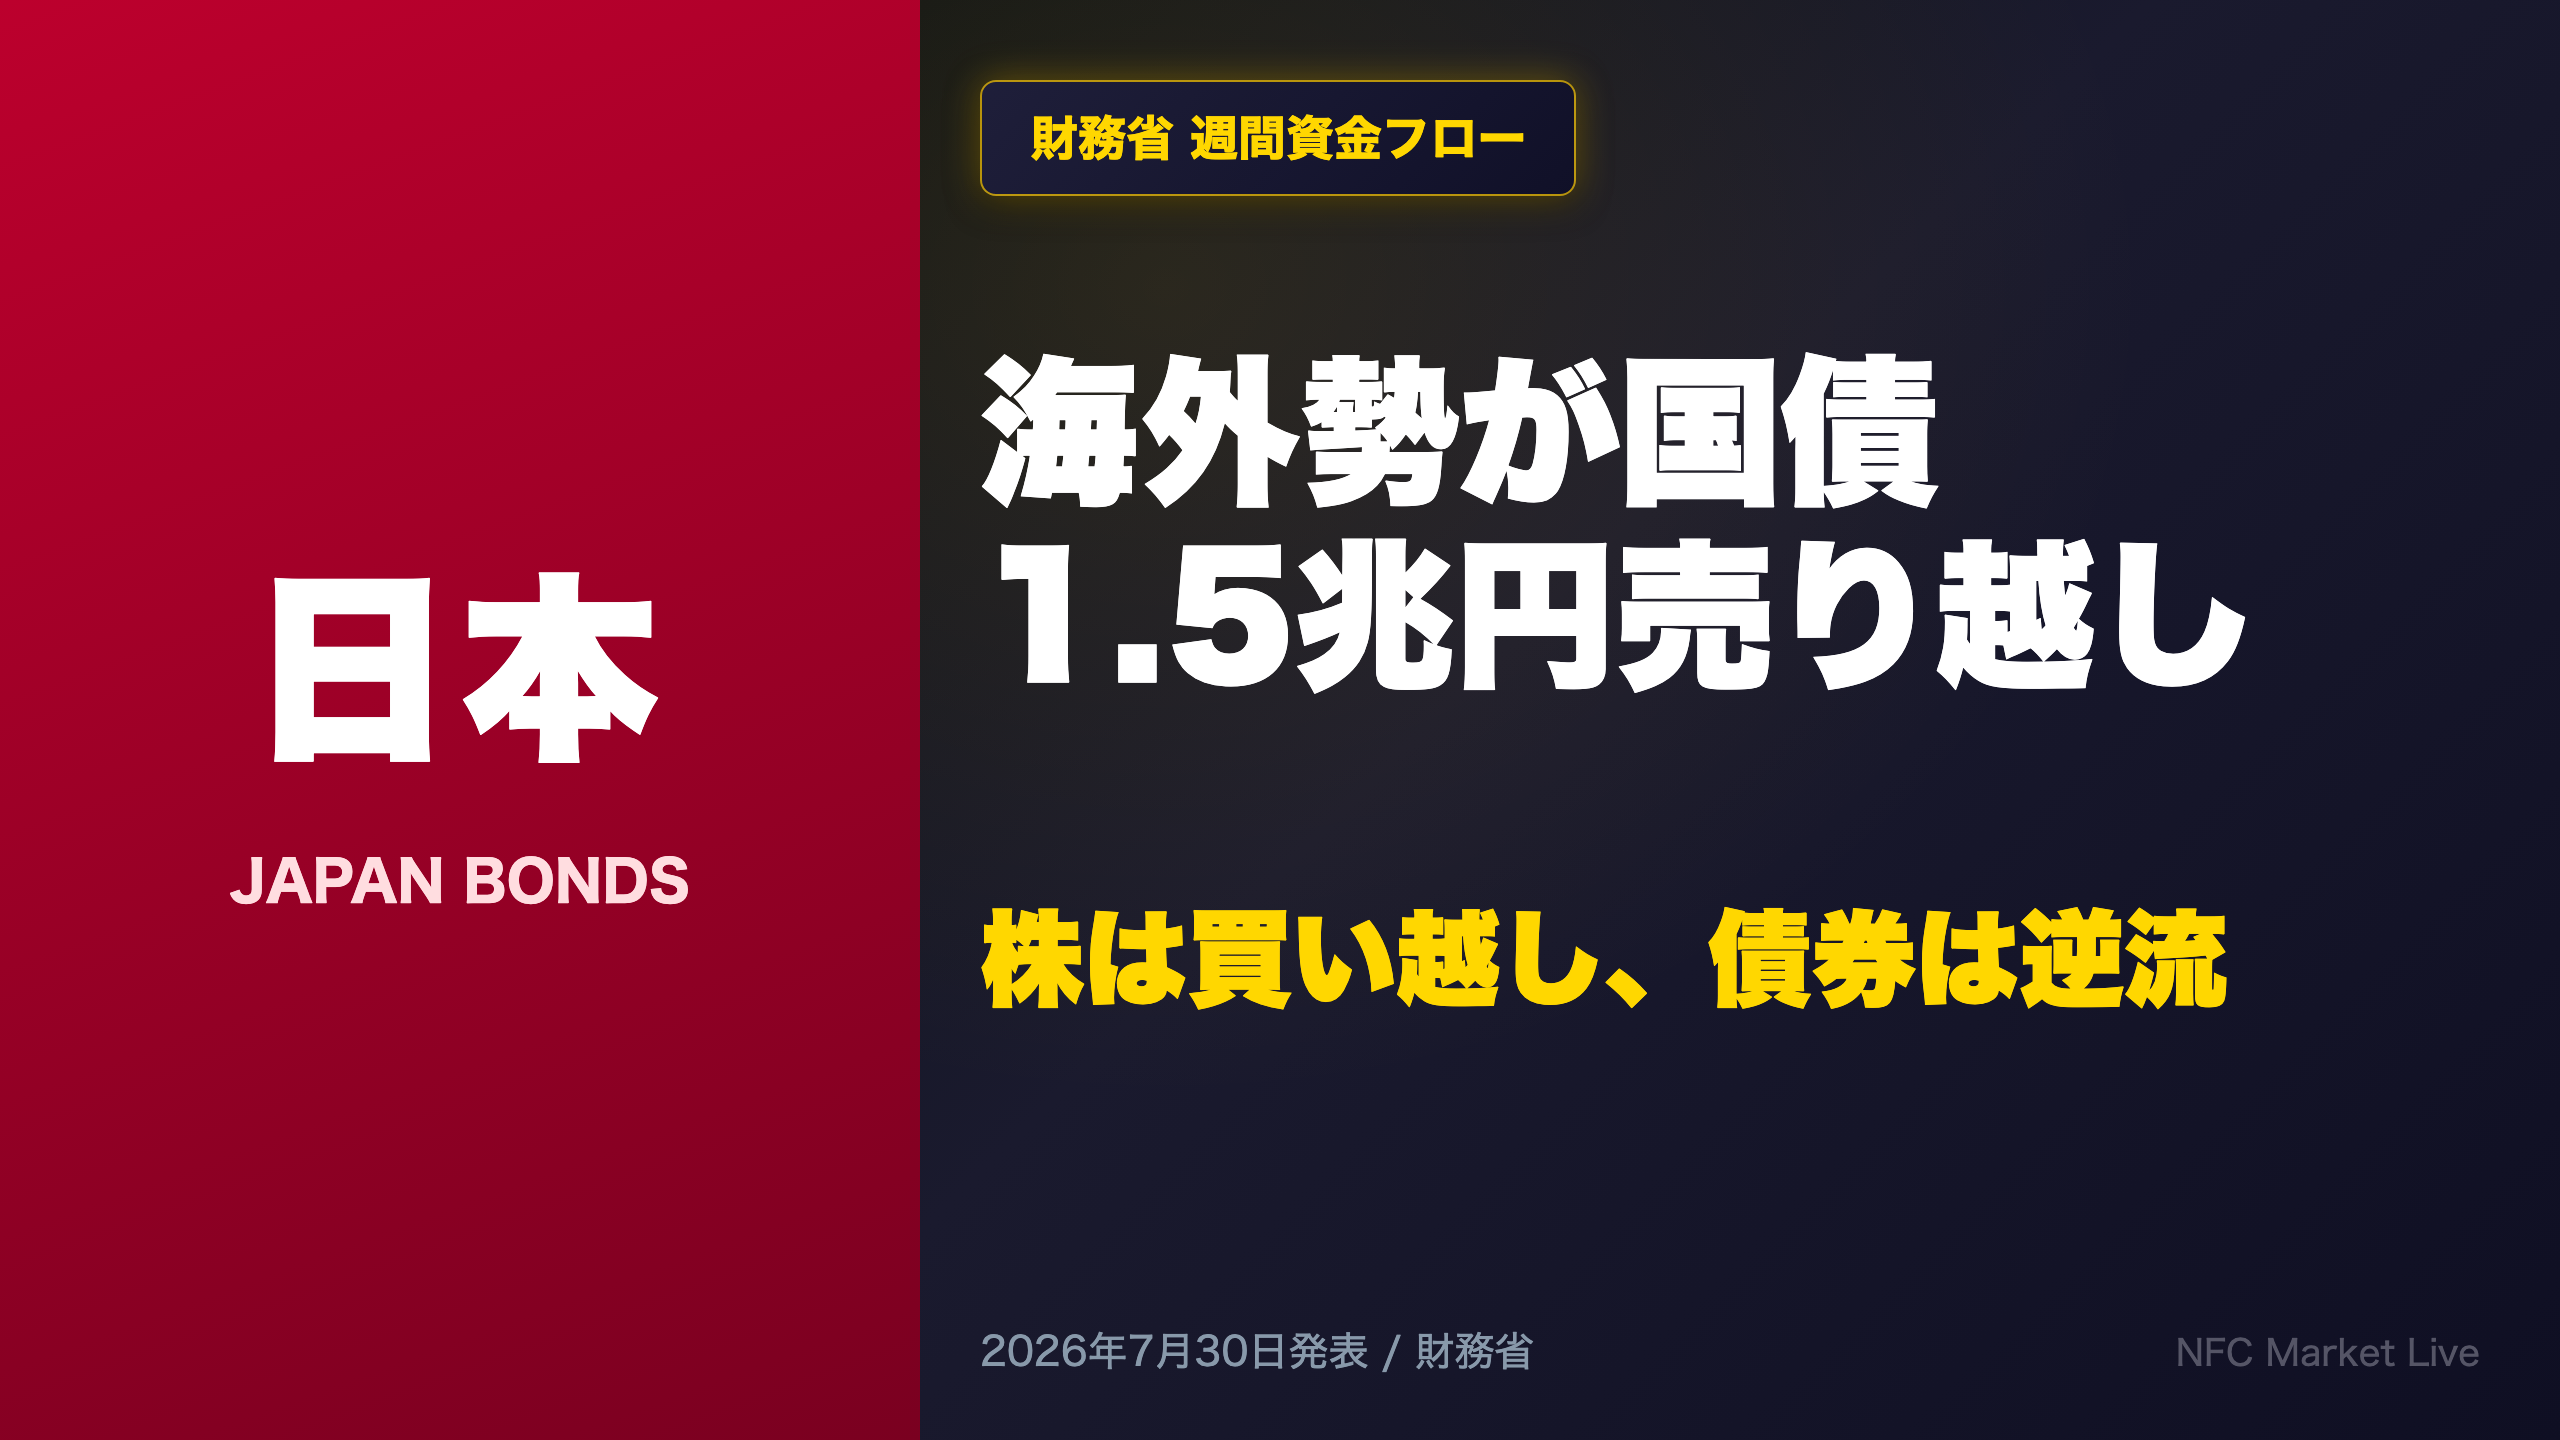
📉 But foreign selling of Japanese government bonds surged to -¥1,513.9bn, one of the largest weekly outflows this year.
💡 Japanese investors also turned net sellers of foreign bonds for a second straight week (-¥811.4bn), a shift from the year’s buying trend.
⚠️ USD/JPY weakened further to 163.71, even as bond flows suggested repatriation pressure—hinting rate differentials may dominate.
A balanced, data-driven look at the tug-of-war between equity resilience and bond market stress.
総括:株式は堅調、債券は内外双方向で資金流出
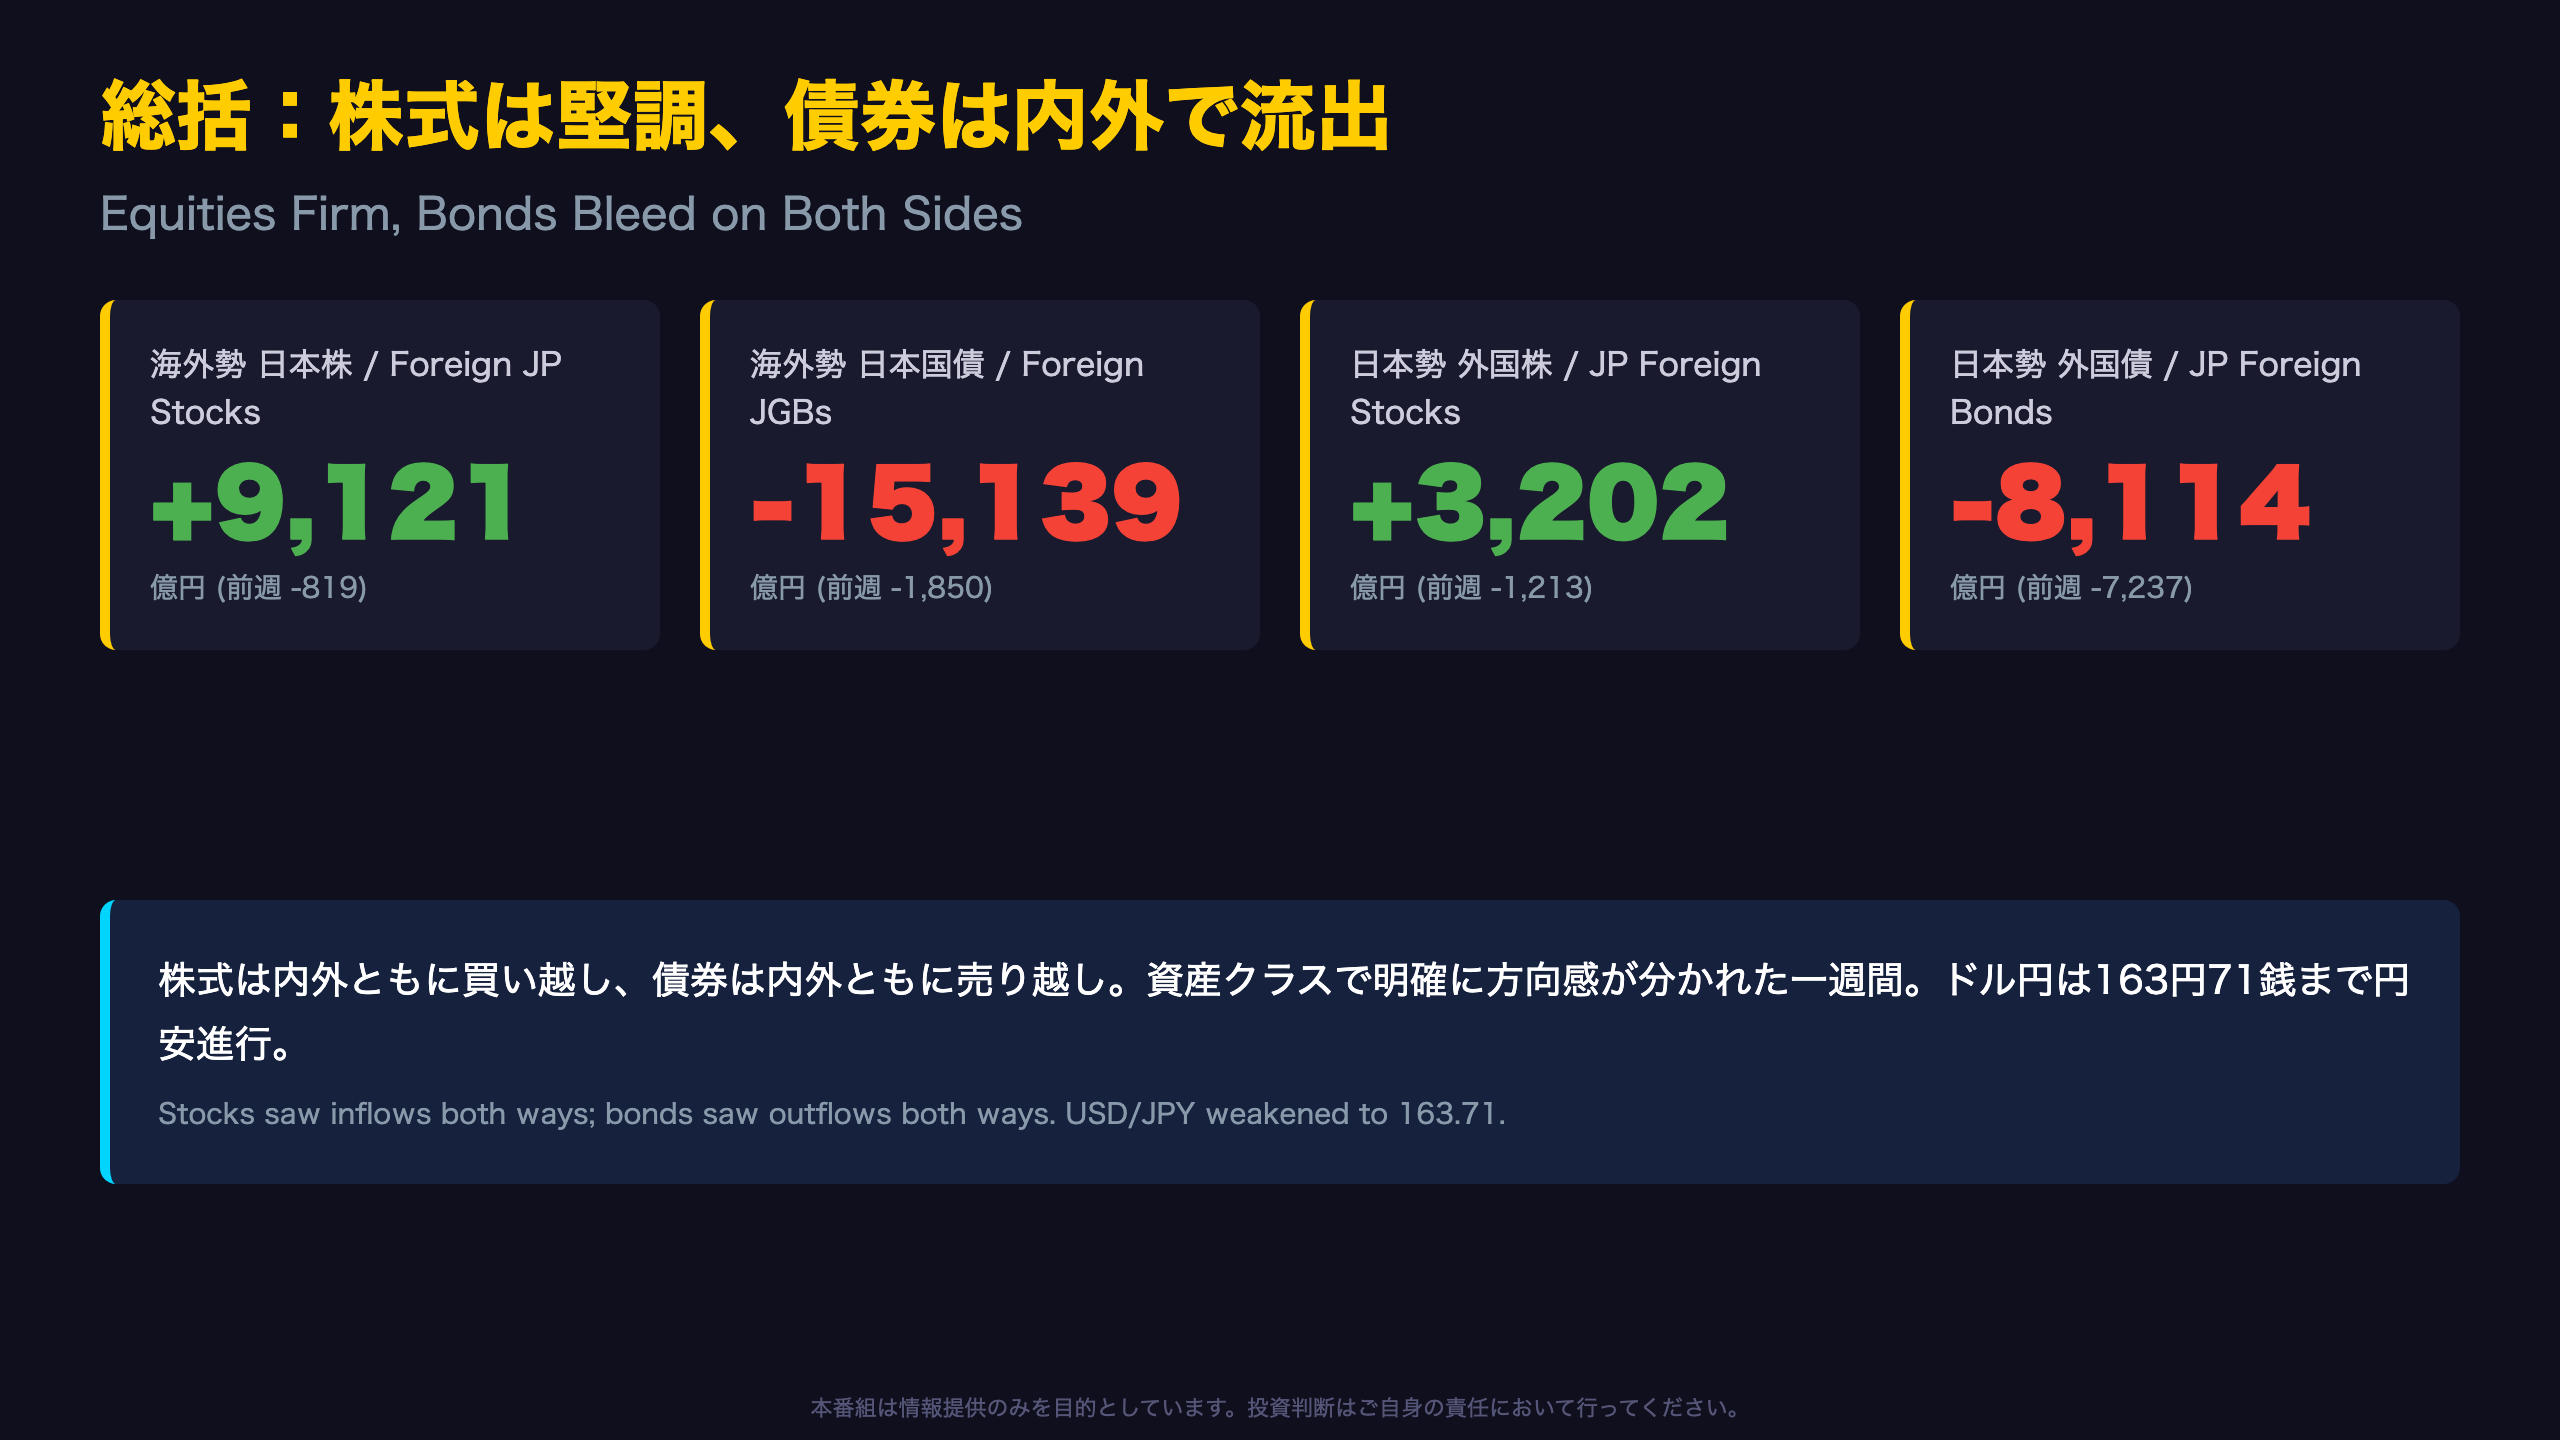
Overview
Japan’s Ministry of Finance released its weekly international securities transaction data on July 30, covering the week of July 19-25, 2026. This report—officially titled “Weekly Statistics of Securities Investment by Type of Investor”—tracks net purchases/sales of stocks and bonds by both foreign investors (non-residents) and Japanese investors (residents).
| Category | This Week | Prior Week |
|---|---|---|
| Foreign / JP Stocks | +¥912.1bn | -¥81.9bn |
| Foreign / JGBs | -¥1,513.9bn | -¥185.0bn |
| Japan / Foreign Stocks | +¥320.2bn | -¥121.3bn |
| Japan / Foreign Bonds | -¥811.4bn | -¥723.7bn |
Why This Matters for International Investors
Unlike the U.S. TIC data, which is reported monthly with a lag, Japan’s MOF releases this flow data weekly with only a few days’ delay—making it one of the freshest windows into cross-border capital movement globally.
The key pattern this week: equities attracted inflows on both sides of the border, while bonds saw outflows on both sides simultaneously. This is a distinct pattern from a simple “flight to home market” narrative—it suggests investors are rotating away from fixed income broadly, regardless of currency of denomination, rather than simply repatriating capital.
Market Implications
For USD/JPY traders, simultaneous bond outflows from both directions complicate the standard repatriation-flow narrative often used to explain yen strength around fiscal year-end. Equity resilience, meanwhile, offers a counterpoint to broader risk-off narratives circulating in global markets.
最新週のヘッドラインフロー
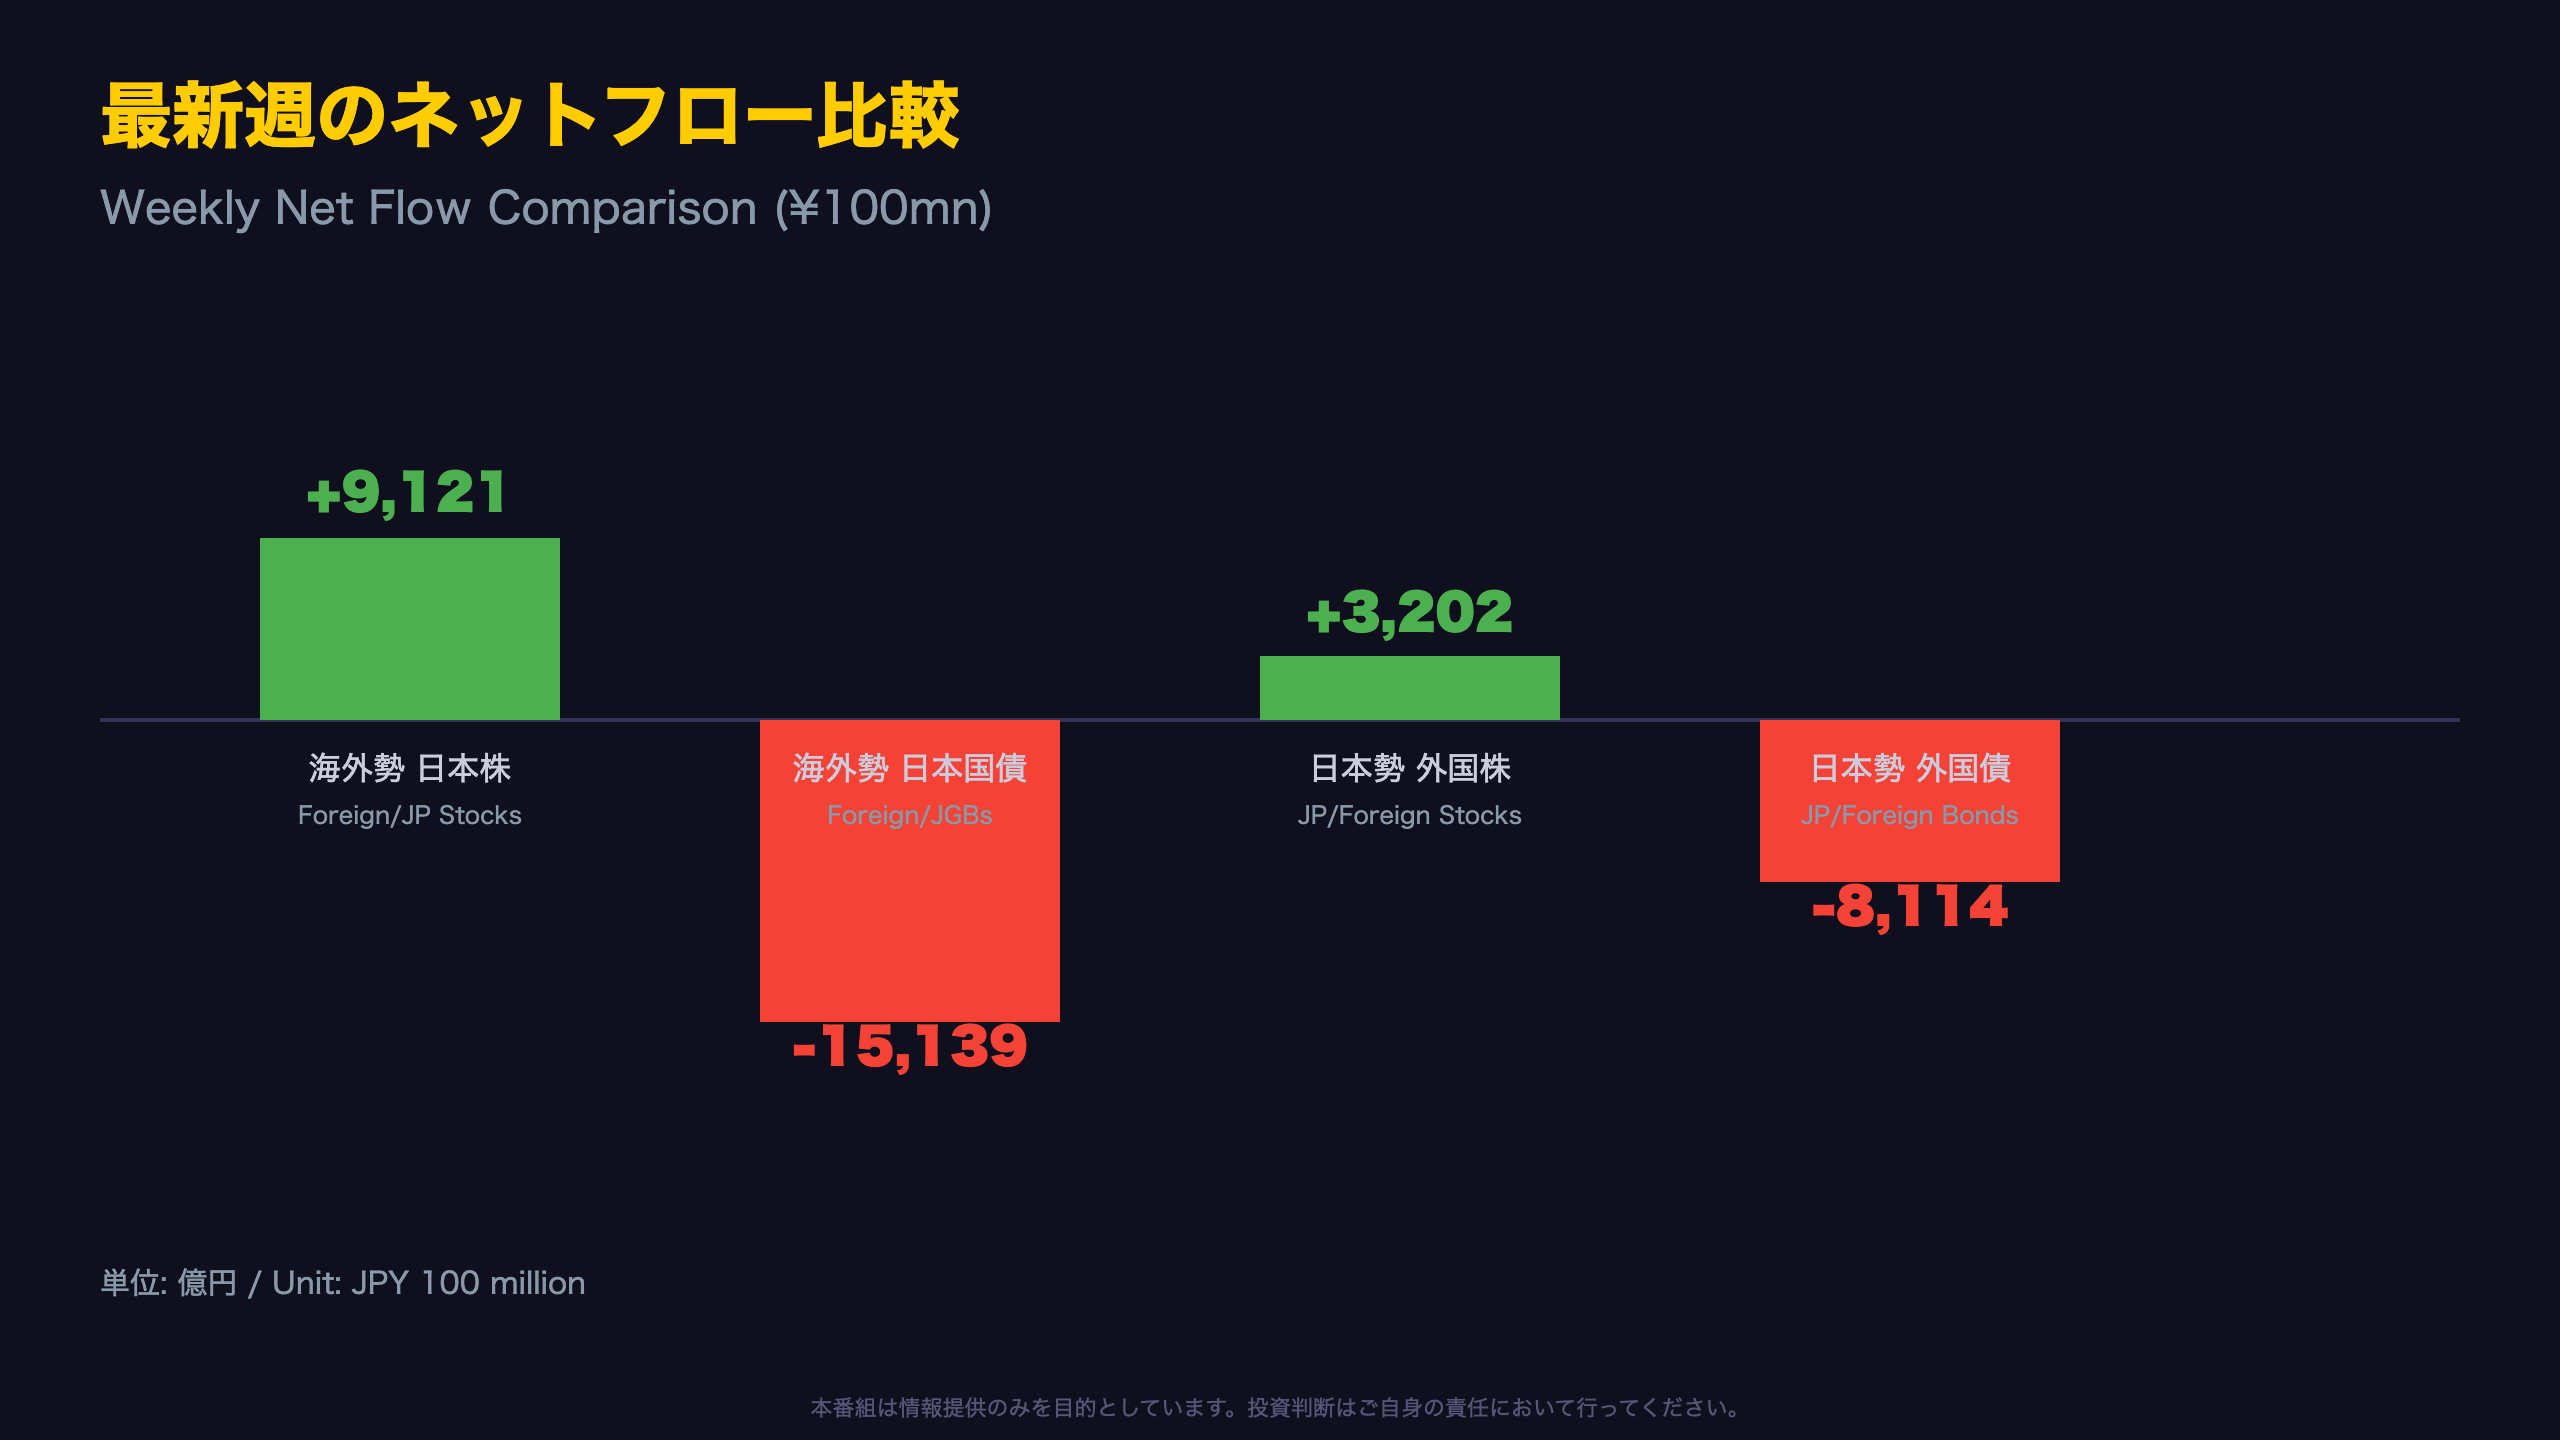
Breaking Down the Numbers
The standout shift this week is the more than eight-fold jump in foreign net selling of Japanese government bonds, from -¥185.0bn the prior week to -¥1,513.9bn.
Short-Term Bills Tell an Even Starker Story
Beyond long-term bonds, foreign net selling of Japanese short-term bills (Treasury Discount Bills) reached -¥2,887.4bn this week, an even larger figure than the long-term bond outflow. Short-term bill flows are heavily influenced by cross-currency basis and carry-trade arbitrage, so this shouldn’t be read purely as a “JGB exit” signal—it may partly reflect funding-cost dynamics rather than a directional view on Japan.
Week-over-Week Comparison
| Category | Jul 19-25 | Jul 12-18 | Change |
|---|---|---|---|
| Foreign / JP Stocks | +¥912.1bn | -¥81.9bn | +¥994.0bn |
| Foreign / JGBs (Long) | -¥1,513.9bn | -¥185.0bn | -¥1,328.9bn |
| Foreign / JGBs (Short) | -¥2,887.4bn | -¥314.1bn | -¥2,573.3bn |
| Japan / Foreign Stocks | +¥320.2bn | -¥121.3bn | +¥441.5bn |
| Japan / Foreign Bonds | -¥811.4bn | -¥723.7bn | -¥87.7bn |
Two Readings
Bulls will note the sharp reversal in equity buying signals resilient dip-buying demand. Bears will point to the simultaneous surge in both short- and long-term JGB selling as evidence of hedging-cost repricing or rate-differential positioning. Both readings require confirmation from subsequent weeks before drawing firm conclusions.
深掘り①:債券市場、内外双方で売り越し拡大
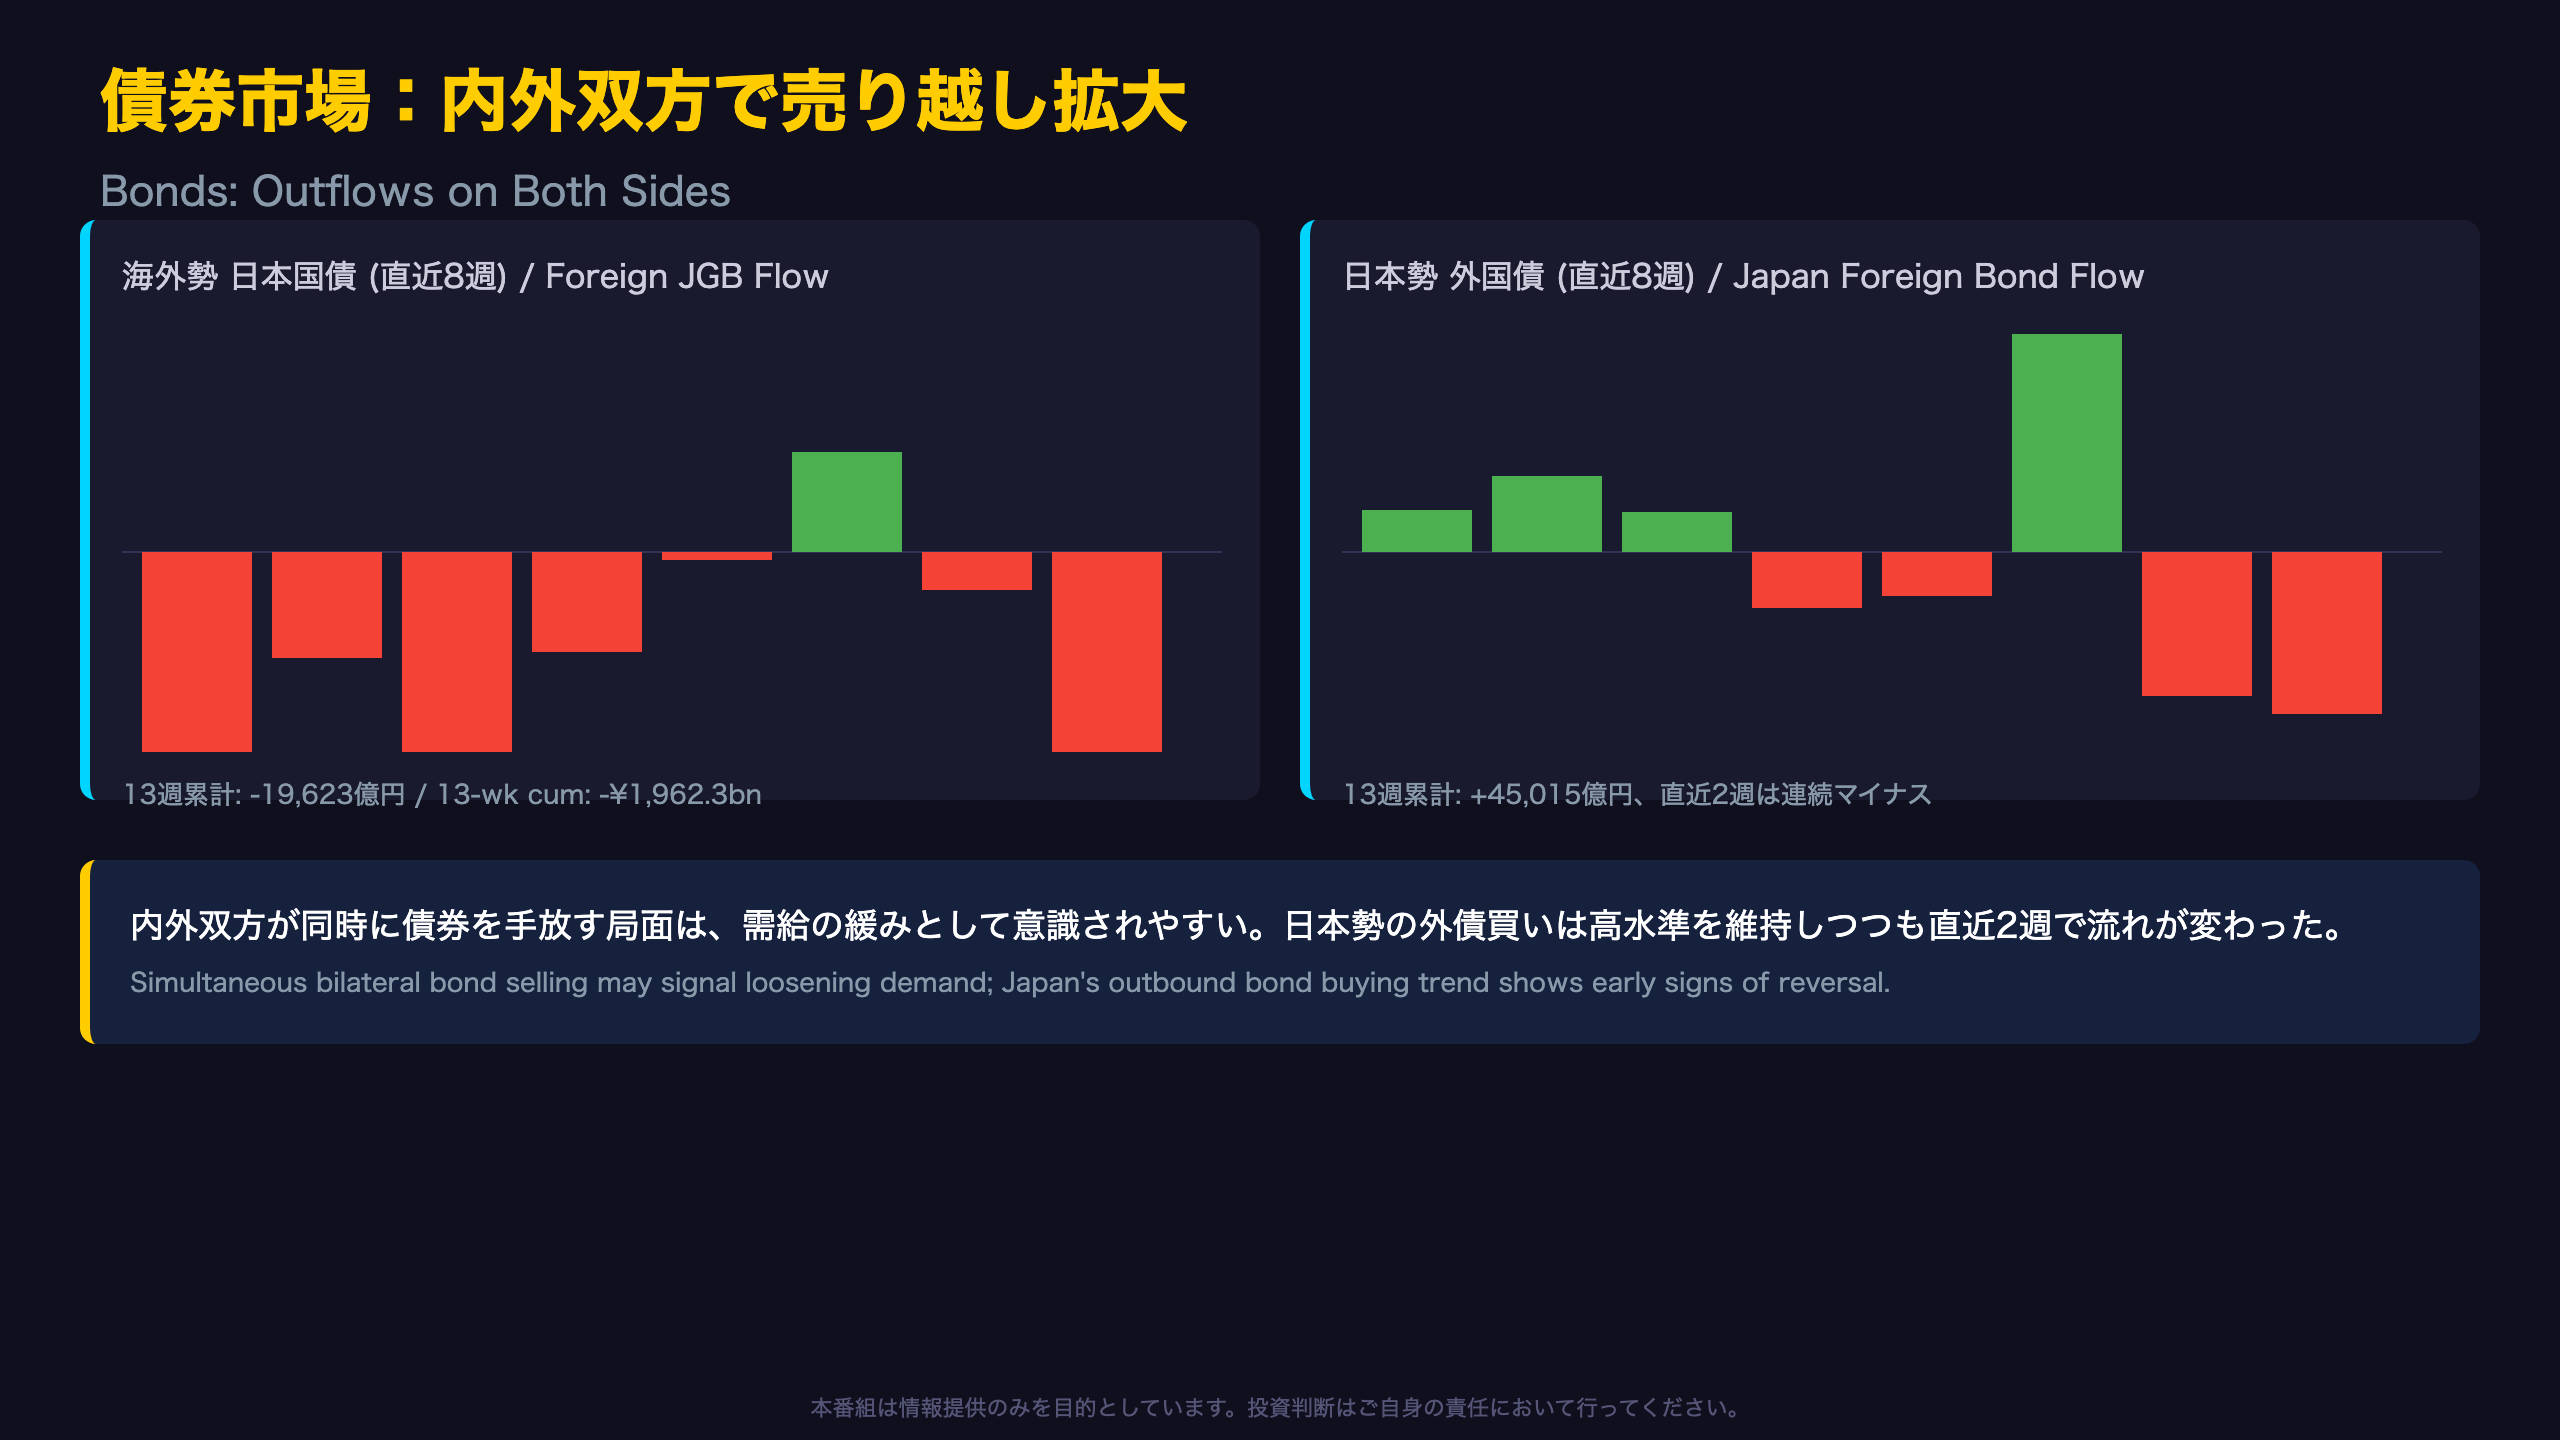
The Three-Month Bond Flow Shift
Looking at the cumulative 13-week window (Apr 26 – Jul 25) reveals a more meaningful structural shift than any single week.
| Investor Type | 13-Week Cumulative | Latest Week | Last 2 Weeks Combined |
|---|---|---|---|
| Foreign / JGBs | -¥1,962.3bn | -¥1,513.9bn | -¥1,698.9bn |
| Japan / Foreign Bonds | +¥4,501.5bn | -¥811.4bn | -¥1,535.1bn |
A Turning Point for Japanese Outbound Bond Flows
Japanese institutional investors have been net buyers of foreign bonds for most of this year, including standout weeks like +¥2,406.4bn (week of Apr 26) and +¥1,089.7bn (week of Jul 5). But the past two weeks have both turned negative—a potential early signal that the year’s dominant “outbound bond buying” theme may be losing steam, though two data points alone cannot confirm a trend reversal.
Context for International Readers
Unlike U.S. Treasury TIC data (monthly, ~6-week lag), Japan’s MOF data offers near real-time visibility into cross-border bond flows—useful for gauging demand for JGBs from abroad, a key input for BOJ policy watchers and JGB yield forecasters.
What to Watch Next
The next release (early August, covering Jul 26-Aug 2) will show whether Japanese outbound bond selling extends to a third week, and whether foreign JGB selling persists—both critical for assessing whether this is noise or the start of a structural shift.
深掘り②:株式市場は内外ともに底堅さを維持
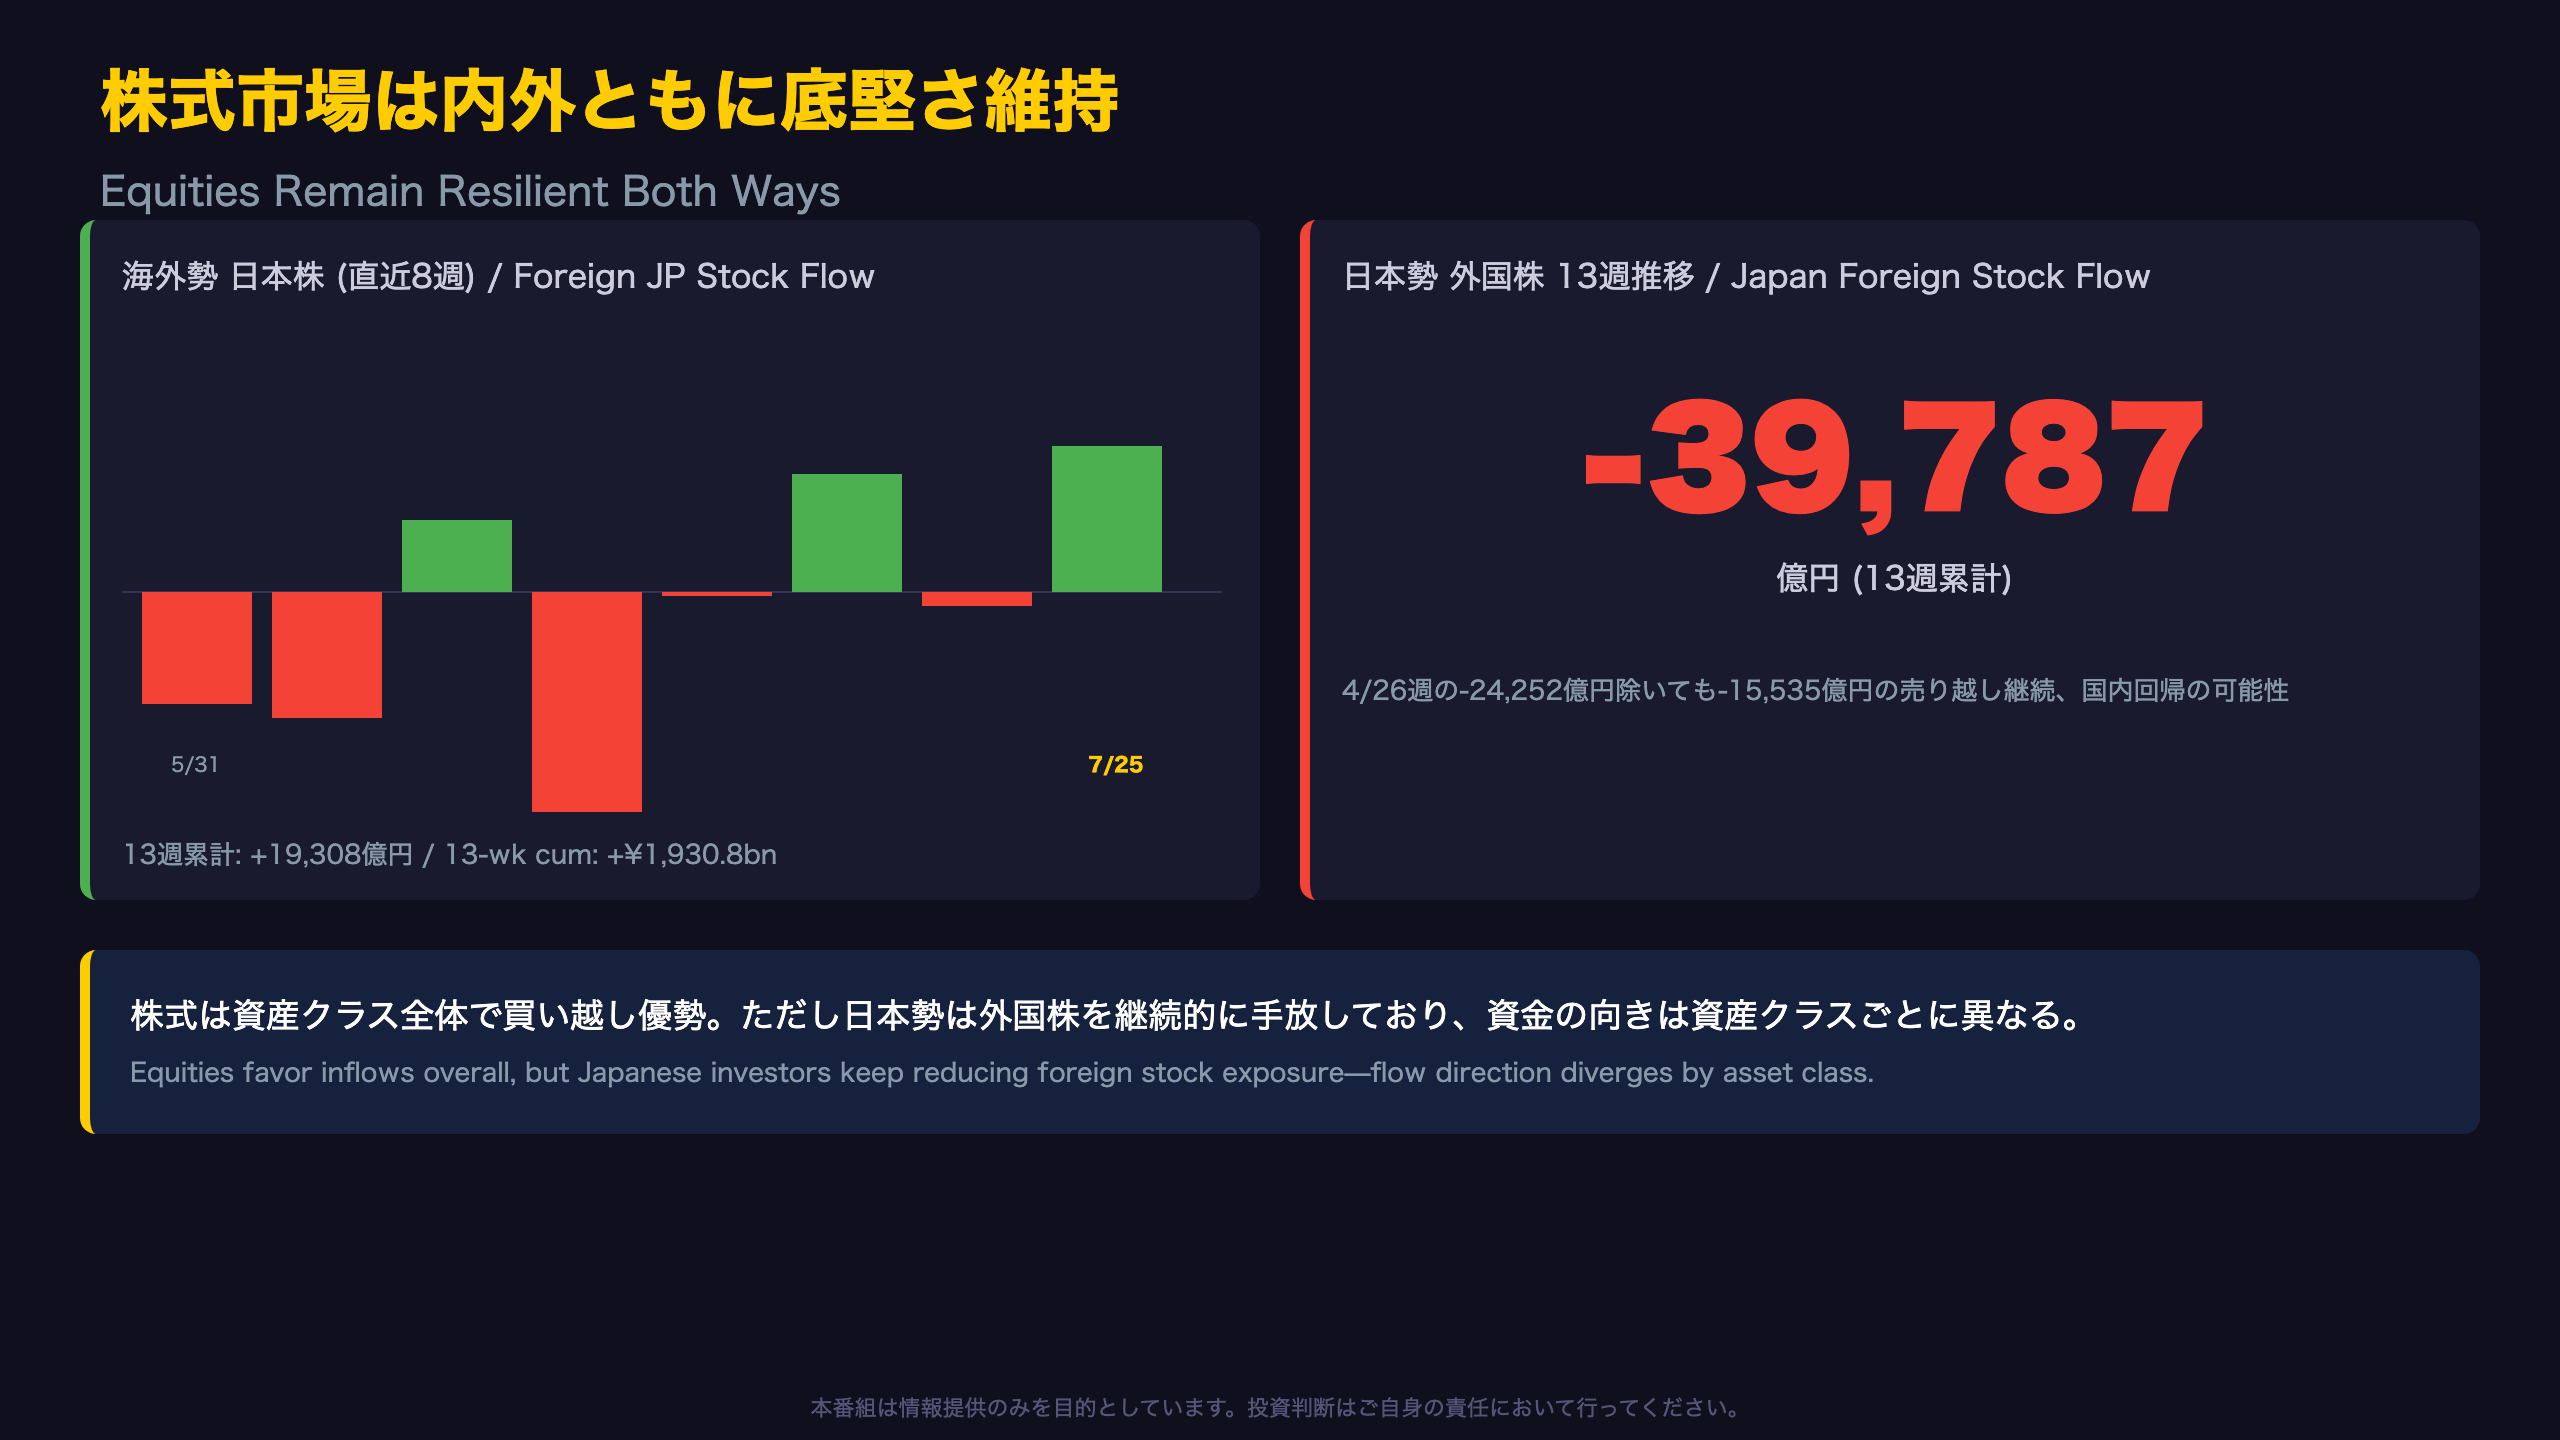
Confirming Equity Market Resilience
Foreign flows into Japanese equities total +¥1,930.8bn over the trailing 13 weeks—volatile week to week, but net positive overall.
High Week-to-Week Swings
The week of June 21 saw a sharp -¥1,817.5bn outflow, only to be followed by a +¥742.6bn recovery just two weeks later (week of Jul 5). This magnitude of swing underscores why single-week Japan equity flow data should not be read as a definitive directional signal on its own.
Japanese Investors Pulling Back from Foreign Equities
On the domestic side, Japanese investors’ foreign equity flows show a 13-week cumulative net sale of -¥3,978.7bn. A large portion of this stems from one outlier week (Apr 26, -¥2,425.2bn), but even excluding that single week, the cumulative figure remains a net sale of roughly -¥1,553.5bn — indicating the pullback isn’t purely a one-week anomaly.
For Context: Comparing to U.S. Fund Flows
Unlike U.S. mutual fund/ETF flow data (typically reported with a lag via ICI or EPFR), Japan’s weekly MOF data captures actual settled securities transactions, offering a cleaner, higher-frequency read on cross-border positioning—valuable for anyone tracking Nikkei 225 or TOPIX foreign ownership trends.
The Asset-Class Divergence
While Japanese investors partially retreated from foreign bonds recently (see prior slide), their retreat from foreign equities has been more persistent and structural over the past three months—suggesting a broader, if uneven, repatriation bias rather than a single-asset-class rotation.
為替との関係:円安は続くが、資金フローと不一致
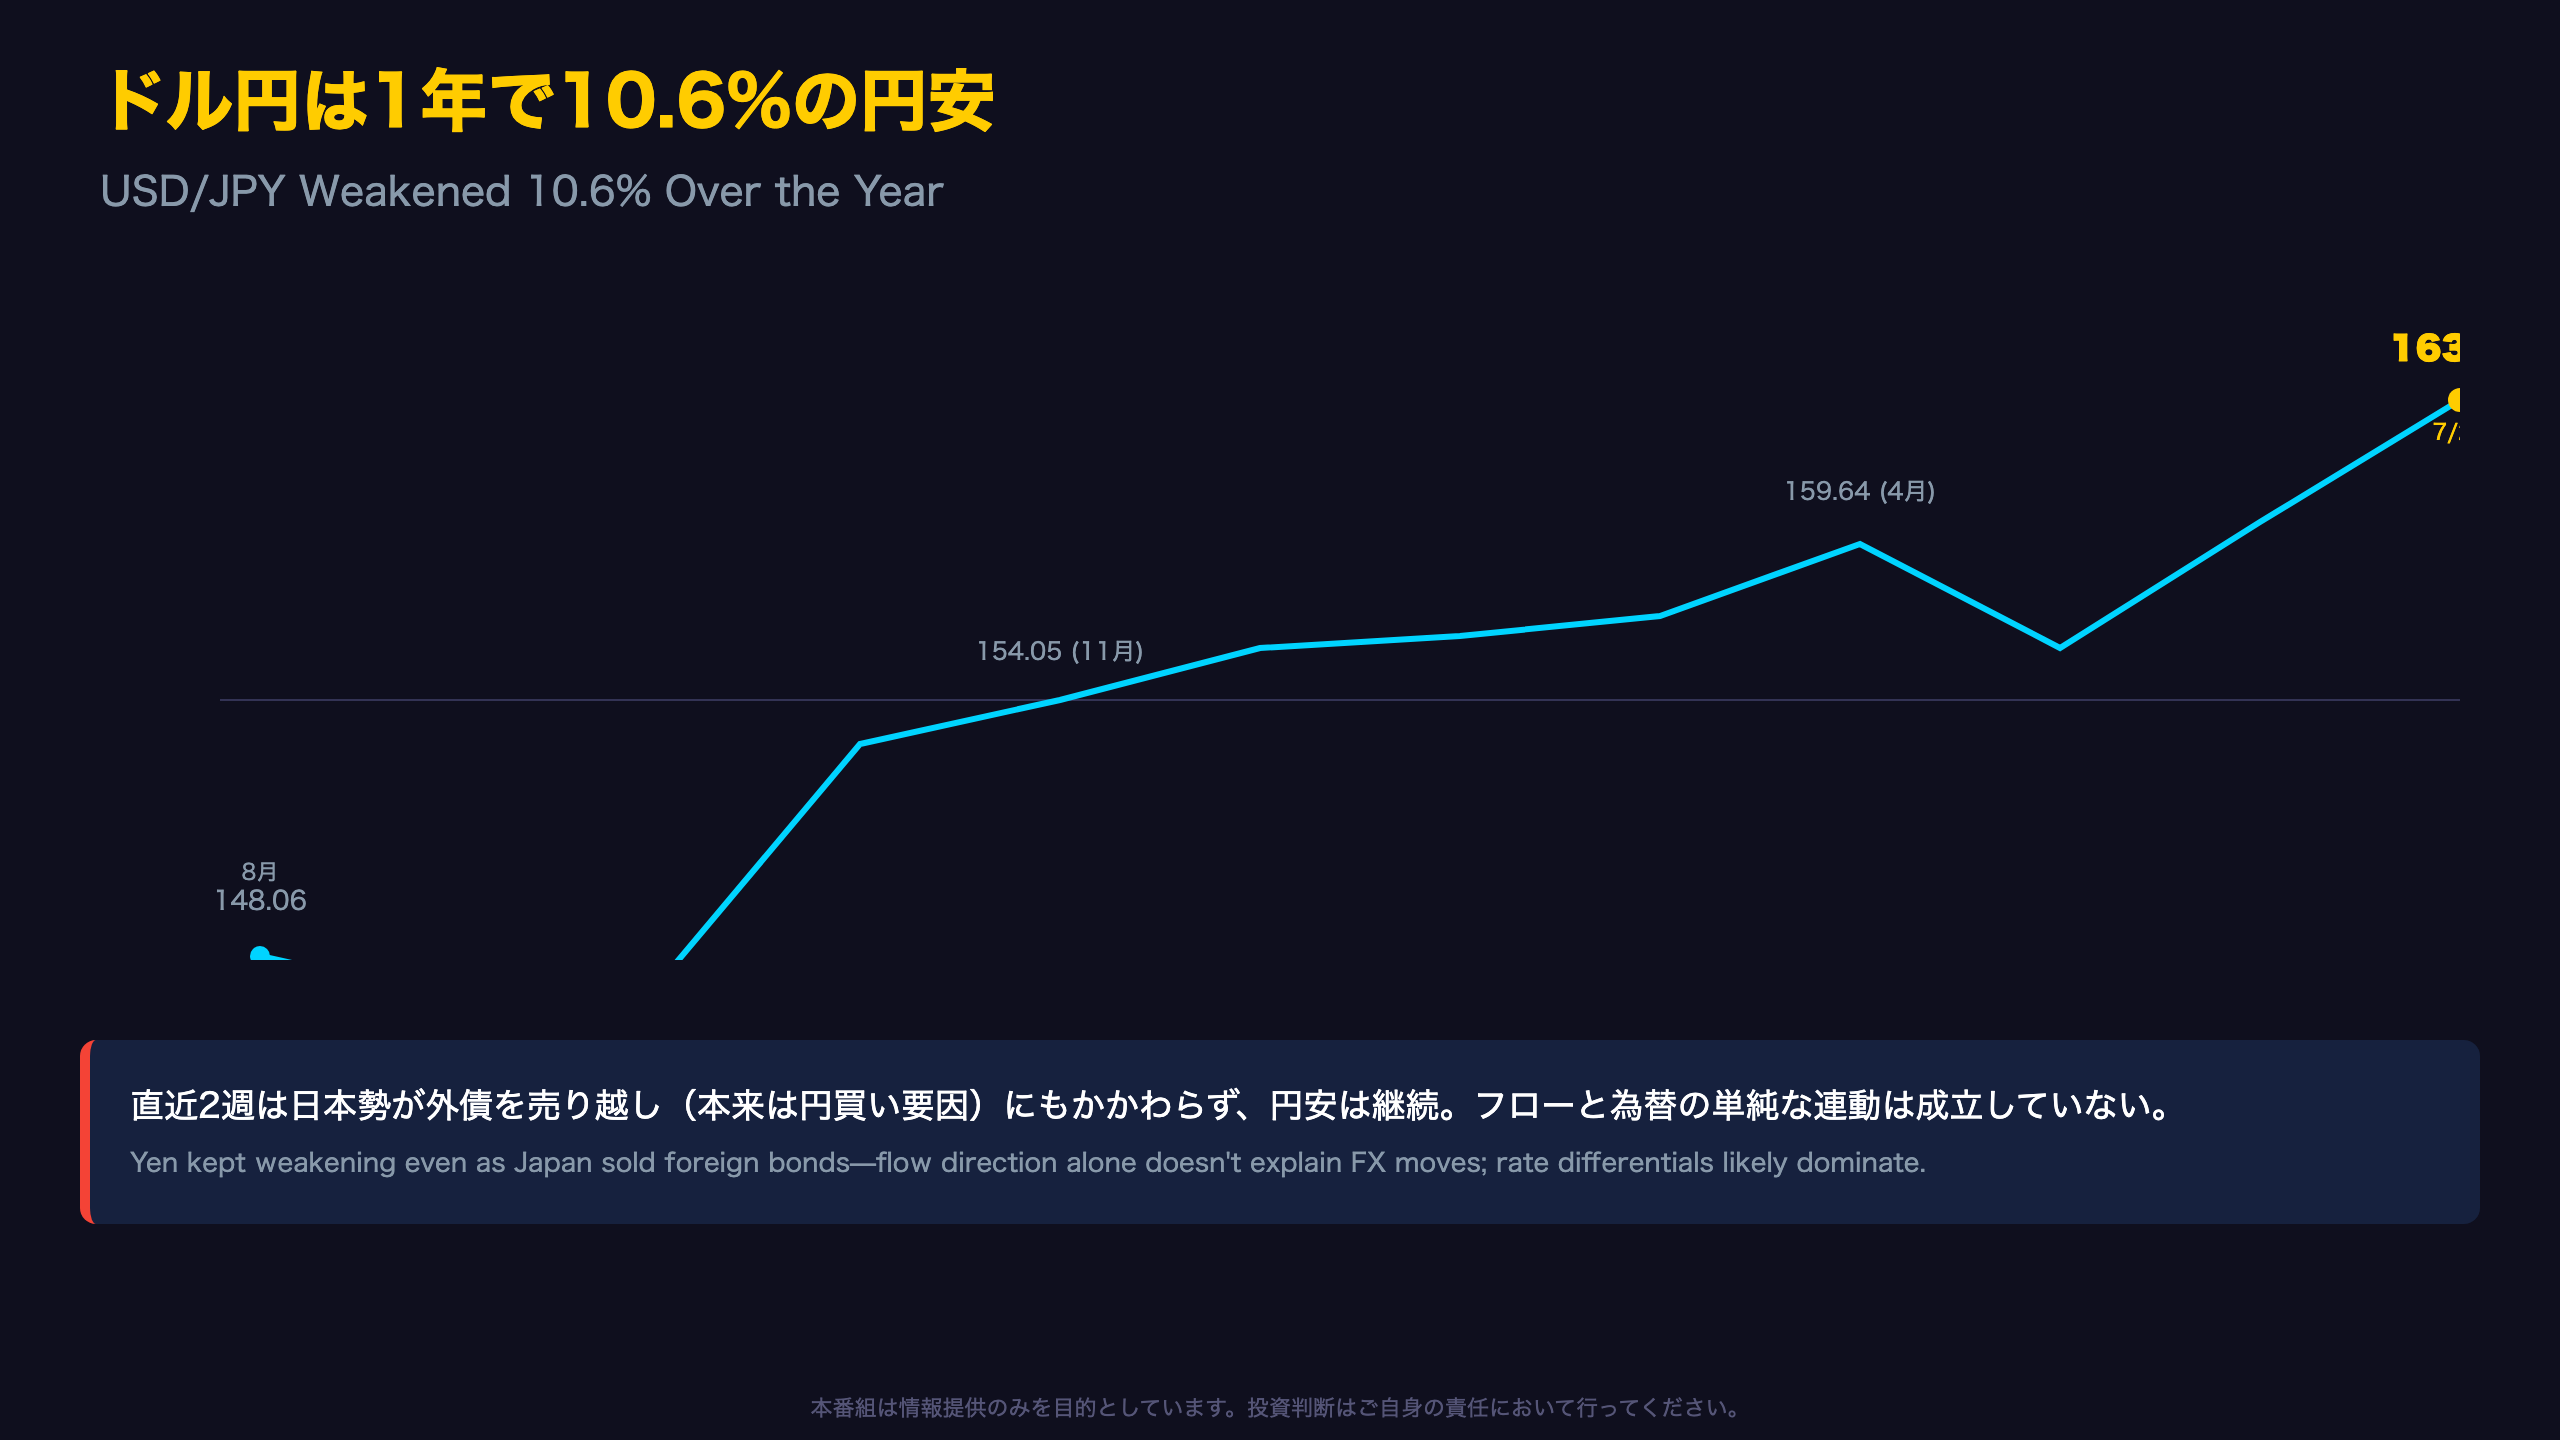
A Year of Persistent Yen Weakness
Tracking USD/JPY at representative monthly points over the past year shows a remarkably consistent depreciation trend.
| Period | USD/JPY |
|---|---|
| Aug 2025 | 148.06 |
| Nov 2025 | 154.05 |
| Feb 2026 | 157.10 |
| May 2026 | 156.76 |
| Jul 25, 2026 | 163.71 |
That’s roughly a 15.65 yen move, or about 10.6%, over twelve months. The pace notably accelerated from June 2026 onward, with the pair settling in the 160s before pushing to 163.71 in late July.
Why Flow-FX Divergence Matters
Conventional wisdom holds that when Japanese investors buy foreign bonds (capital outflow), it’s yen-negative; when they sell foreign bonds and repatriate (capital inflow), it’s yen-positive. Yet over the past two weeks, Japanese investors net-sold ¥1,535.1bn of foreign bonds—a repatriation signal—while the yen weakened rather than strengthened.
This single dataset cannot establish causality between flow direction and FX moves. It is commonly believed that interest rate differentials (particularly the U.S.-Japan gap), corporate import demand, and speculative positioning jointly drive USD/JPY, but this report alone cannot confirm which factor dominates.
A Note for Global Macro Readers
For investors comparing this to Fed policy expectations, the key takeaway is that Japan’s weekly portfolio flow data, while useful, is not a standalone predictor of USD/JPY direction—rate differentials and broader risk sentiment appear to be exerting stronger influence in the current episode.
インプリケーション:3つの糸が示す市場への含意
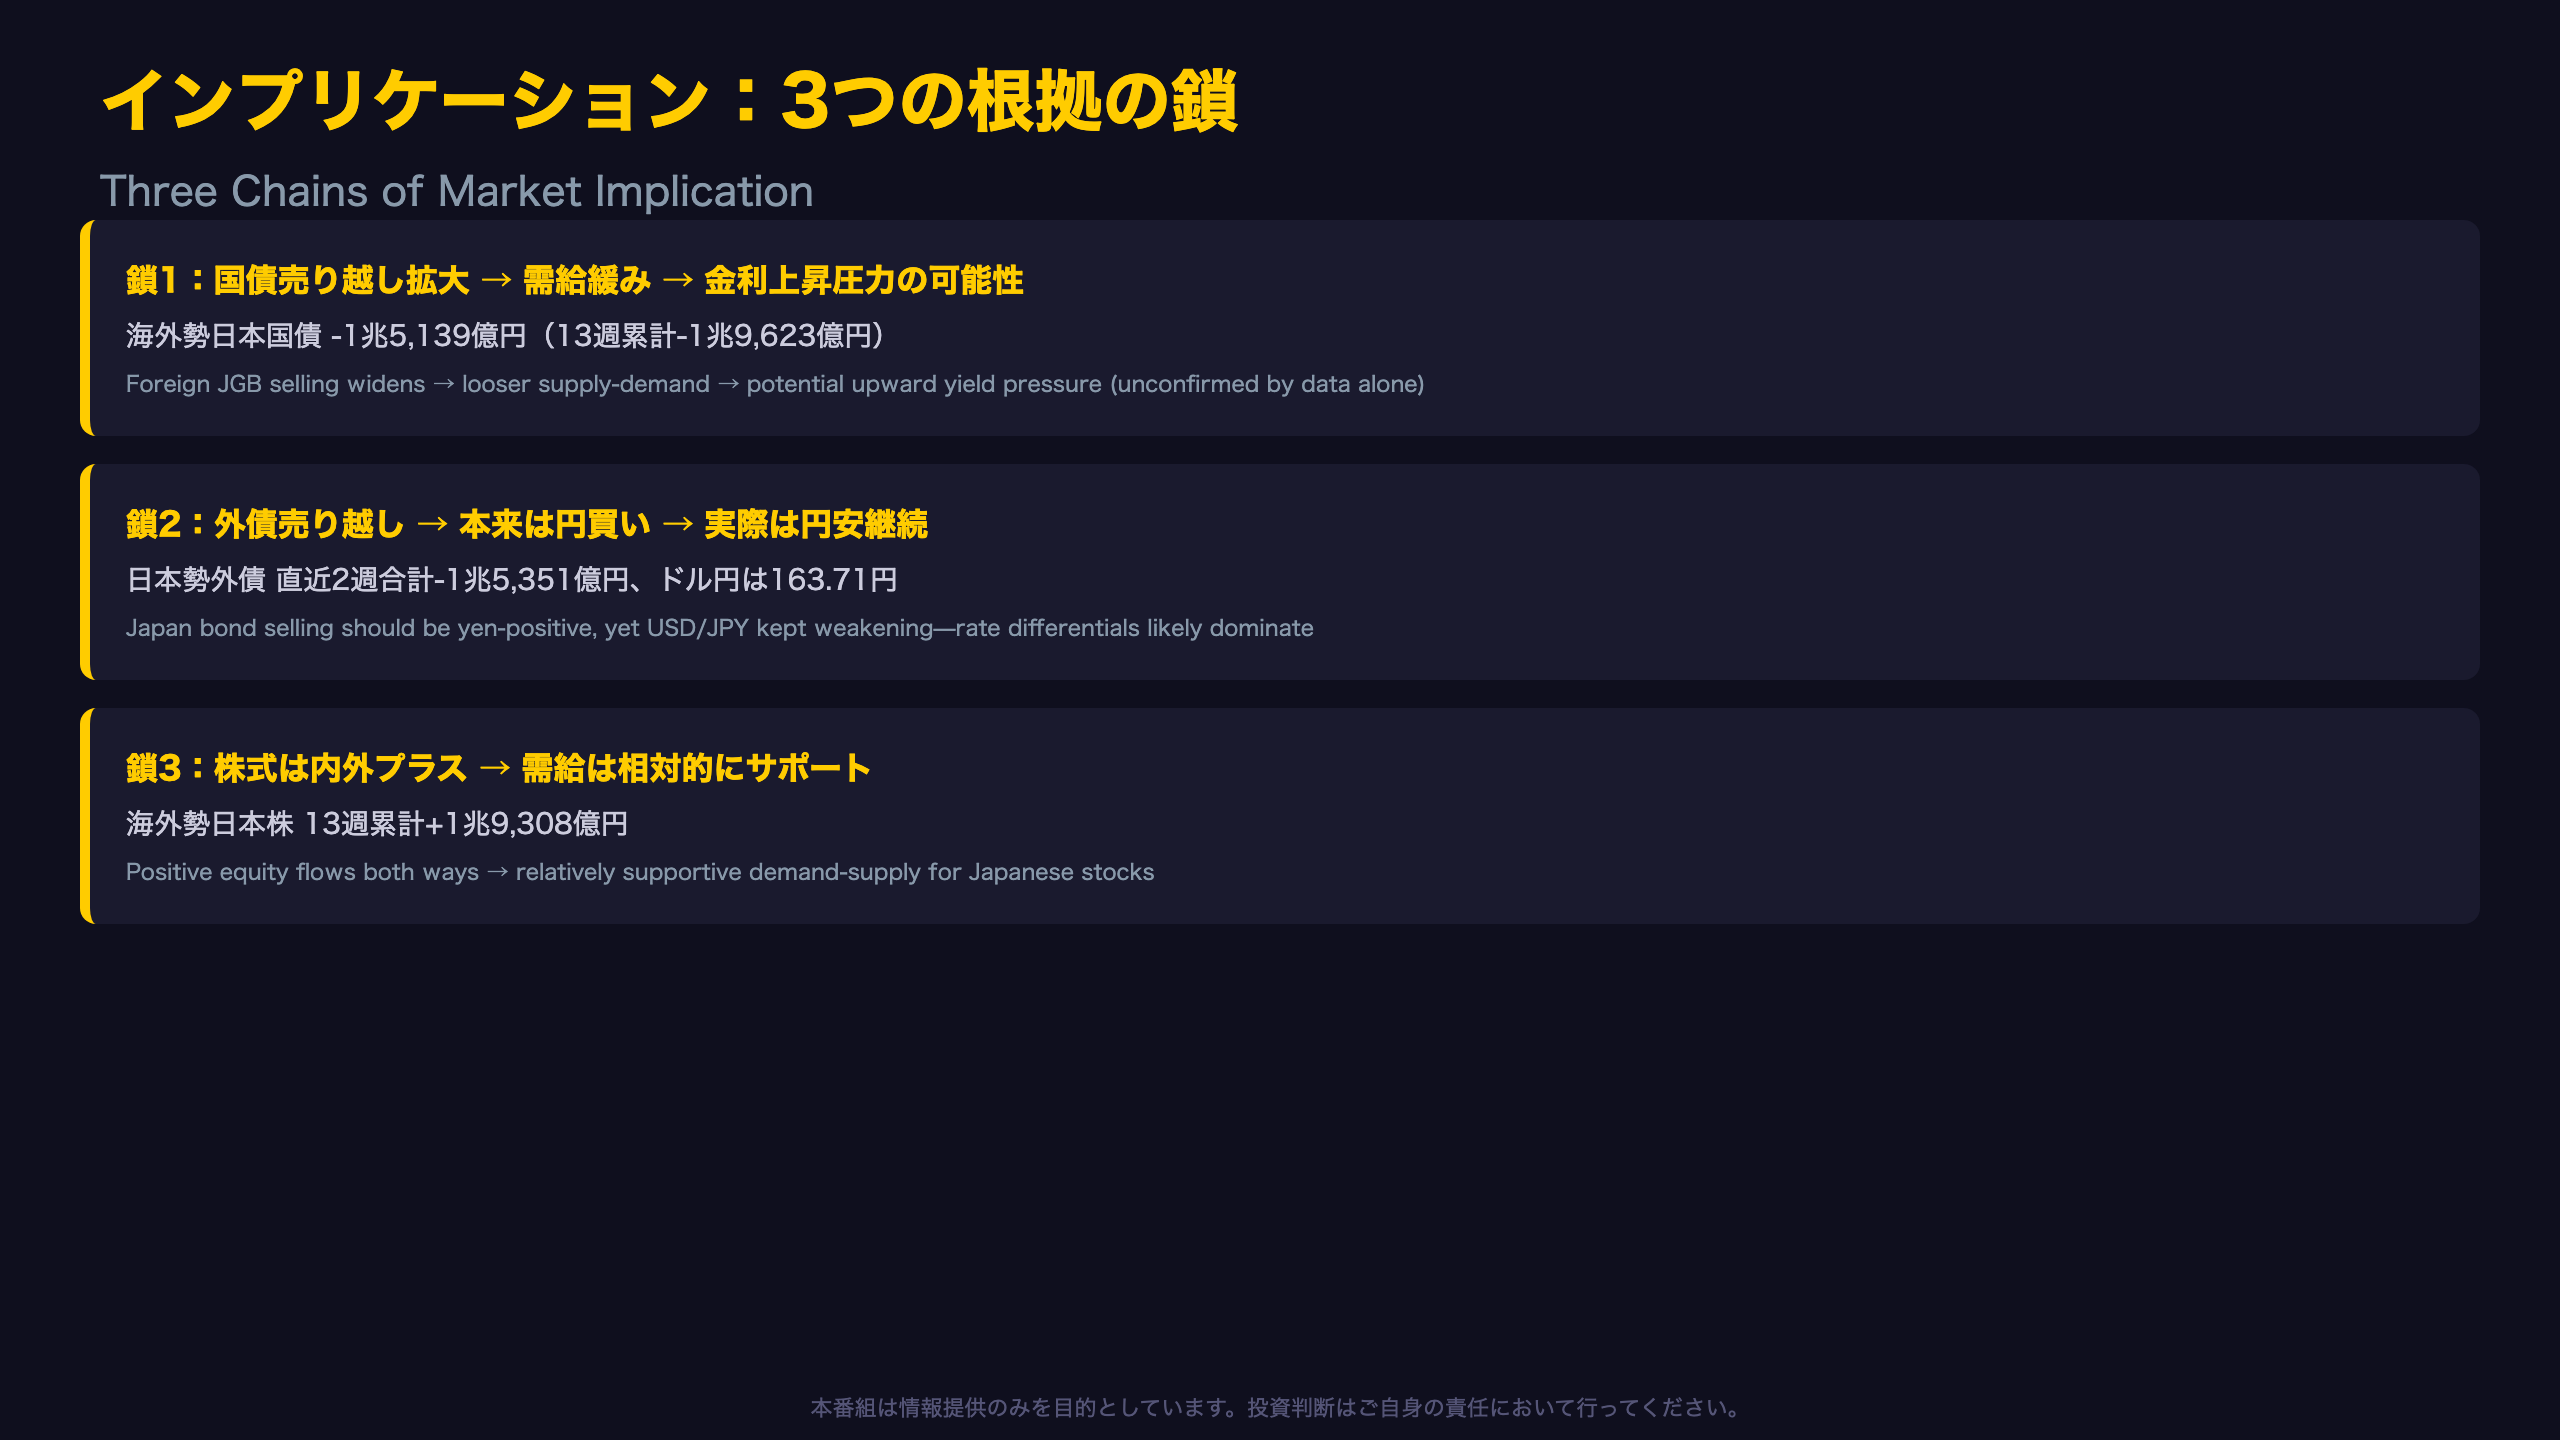
Three Chains of Reasoning for Market Implications
Chain 1: Bond Supply-Demand and Yields
Foreign investors sold a net ¥1,513.9bn of JGBs this week, bringing the 13-week cumulative outflow to ¥1,962.3bn → As foreign investors represent a key marginal buyer of JGBs, reduced demand from this group loosens the supply-demand balance → It is commonly believed that a looser demand-supply balance adds upward pressure on long-term yields, though this data alone cannot confirm the magnitude of any yield impact.
Chain 2: The FX-Flow Disconnect
Japanese investors net-sold ¥1,535.1bn of foreign bonds over the past two weeks → Textbook logic suggests capital repatriation should be yen-positive → Yet USD/JPY actually weakened from the 155 range to 163.71 over the same broader period, meaning flow direction alone fails to explain the currency’s trajectory. Interest rate differentials are likely a stronger driver, though this cannot be confirmed from this dataset alone.
Chain 3: Relative Equity Resilience
Both foreign and Japanese equity flows remain net positive over 13 weeks (foreign: +¥1,930.8bn; Japan’s foreign equity flow is the exception, at -¥3,978.7bn) → Continued inflows into Japanese equities provide relative support for domestic stock market demand-supply dynamics → This reflects realized historical flows and does not guarantee future price direction.
Bottom Line for Global Investors
This week’s data is notable for showing three diverging signals simultaneously: resilient equities, weakening bonds, and a persistently soft yen. Rather than drawing conclusions from any single indicator, investors should monitor the interplay across asset classes going forward—particularly whether JGB selling pressure persists into August, and whether the yen’s rate-differential-driven weakness continues even as portfolio flows shift.
Disclaimer: This article is for informational purposes only. All investment decisions are made solely at your own risk.