📺 Watch the Full Video Analysis
This article was automatically generated by the NFC Market Live AI analysis system. (Updated: 2026-07-27 17:52 JST)
A deep dive into the ECB’s June 2026 monetary developments release.
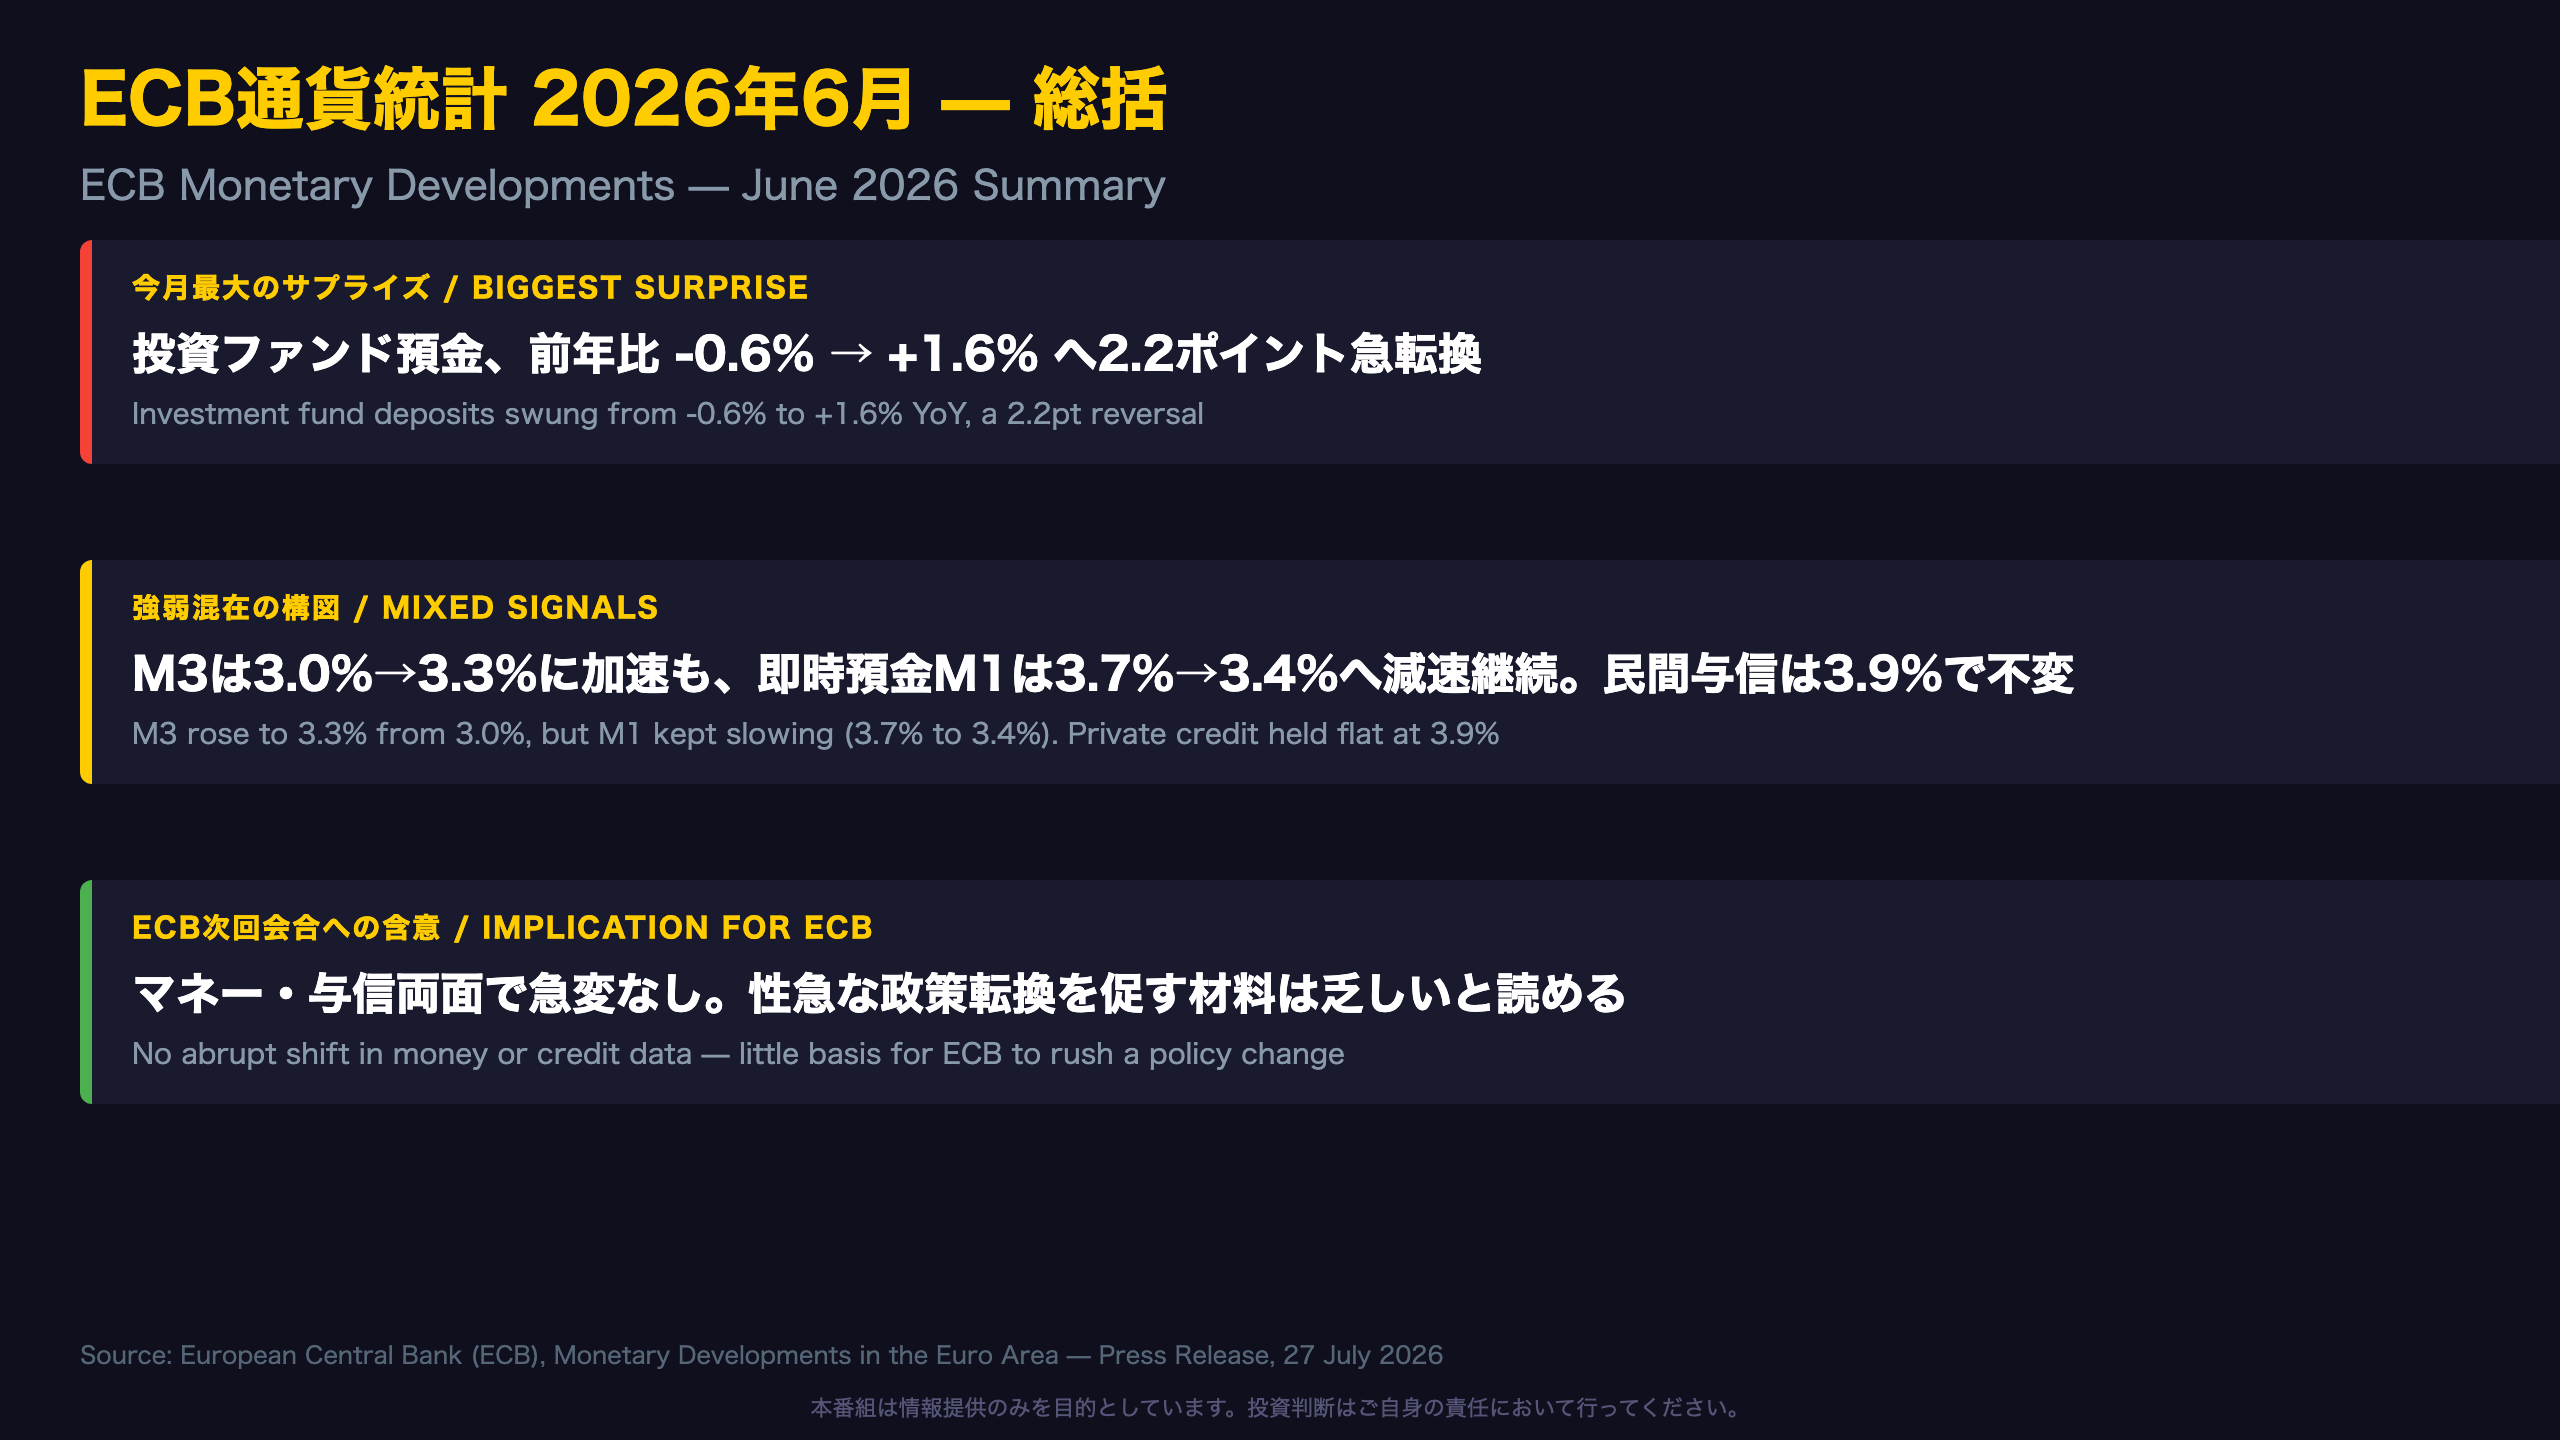
📊 Headline M3 growth accelerated to 3.3% from 3.0%, but M1 kept slowing for a 6th straight month (3.7% to 3.4%).
💶 The biggest surprise: investment fund deposits swung from -0.6% to +1.6%, a 2.2pt reversal.
🏦 Private credit growth held steady at 3.9%, unchanged from May.
⚠️ What EUR/JPY holders need to know about the ‘change’ vs ‘no change’ story in this release.
ECB通貨統計 2026年6月 — 総括
Why This Month’s ECB Data Matters for Currency Investors
The ECB’s monetary aggregates report — the eurozone’s equivalent of the Fed’s H.6 money supply release — tracks how quickly money and credit are being created within the euro area’s banking system. Unlike the Fed, which de-emphasized M2 as a policy signal years ago, the ECB explicitly keeps a “monetary analysis” pillar alongside economic analysis when setting rates, making this release directly relevant to policy expectations.
This month’s headline: M3 growth accelerated to 3.3% from 3.0%, but the ECB’s own text reveals investment fund deposits reversed from -0.6% to +1.6% — a 2.2 percentage point swing, the largest single-sector move in the release. That is unusually large for a one-month change and warrants some skepticism about whether it reflects a lasting portfolio shift or a temporary technical flow (e.g., quarter-end positioning).
What international investors should note
Compared to the US, where M2 has been a much less prominent signal since 2023, the ECB still treats monetary aggregates as a cross-check on inflation risk. A reference value once cited by the ECB (~4.5% annual M3 growth) remains a useful benchmark — current growth stays comfortably below it, arguing against monetary overheating.
For EUR/JPY holders, the key takeaway isn’t the swing itself but that credit growth (3.9%, unchanged) shows no comparable volatility — a sign underlying financing conditions aren’t seeing abrupt swings.
M3前年比、13ヶ月レンジの上限へ
M3 in Context: Comparing ECB, Fed and BOJ Frameworks
The Federal Reserve largely retired M2 as a policy signal after the 2020-22 stimulus-driven distortions, while the Bank of Japan tracks its own monetary base within its policy framework. The ECB remains comparatively more monetarist — M3 trends still factor into the Governing Council’s internal risk assessment, even as a secondary consideration.
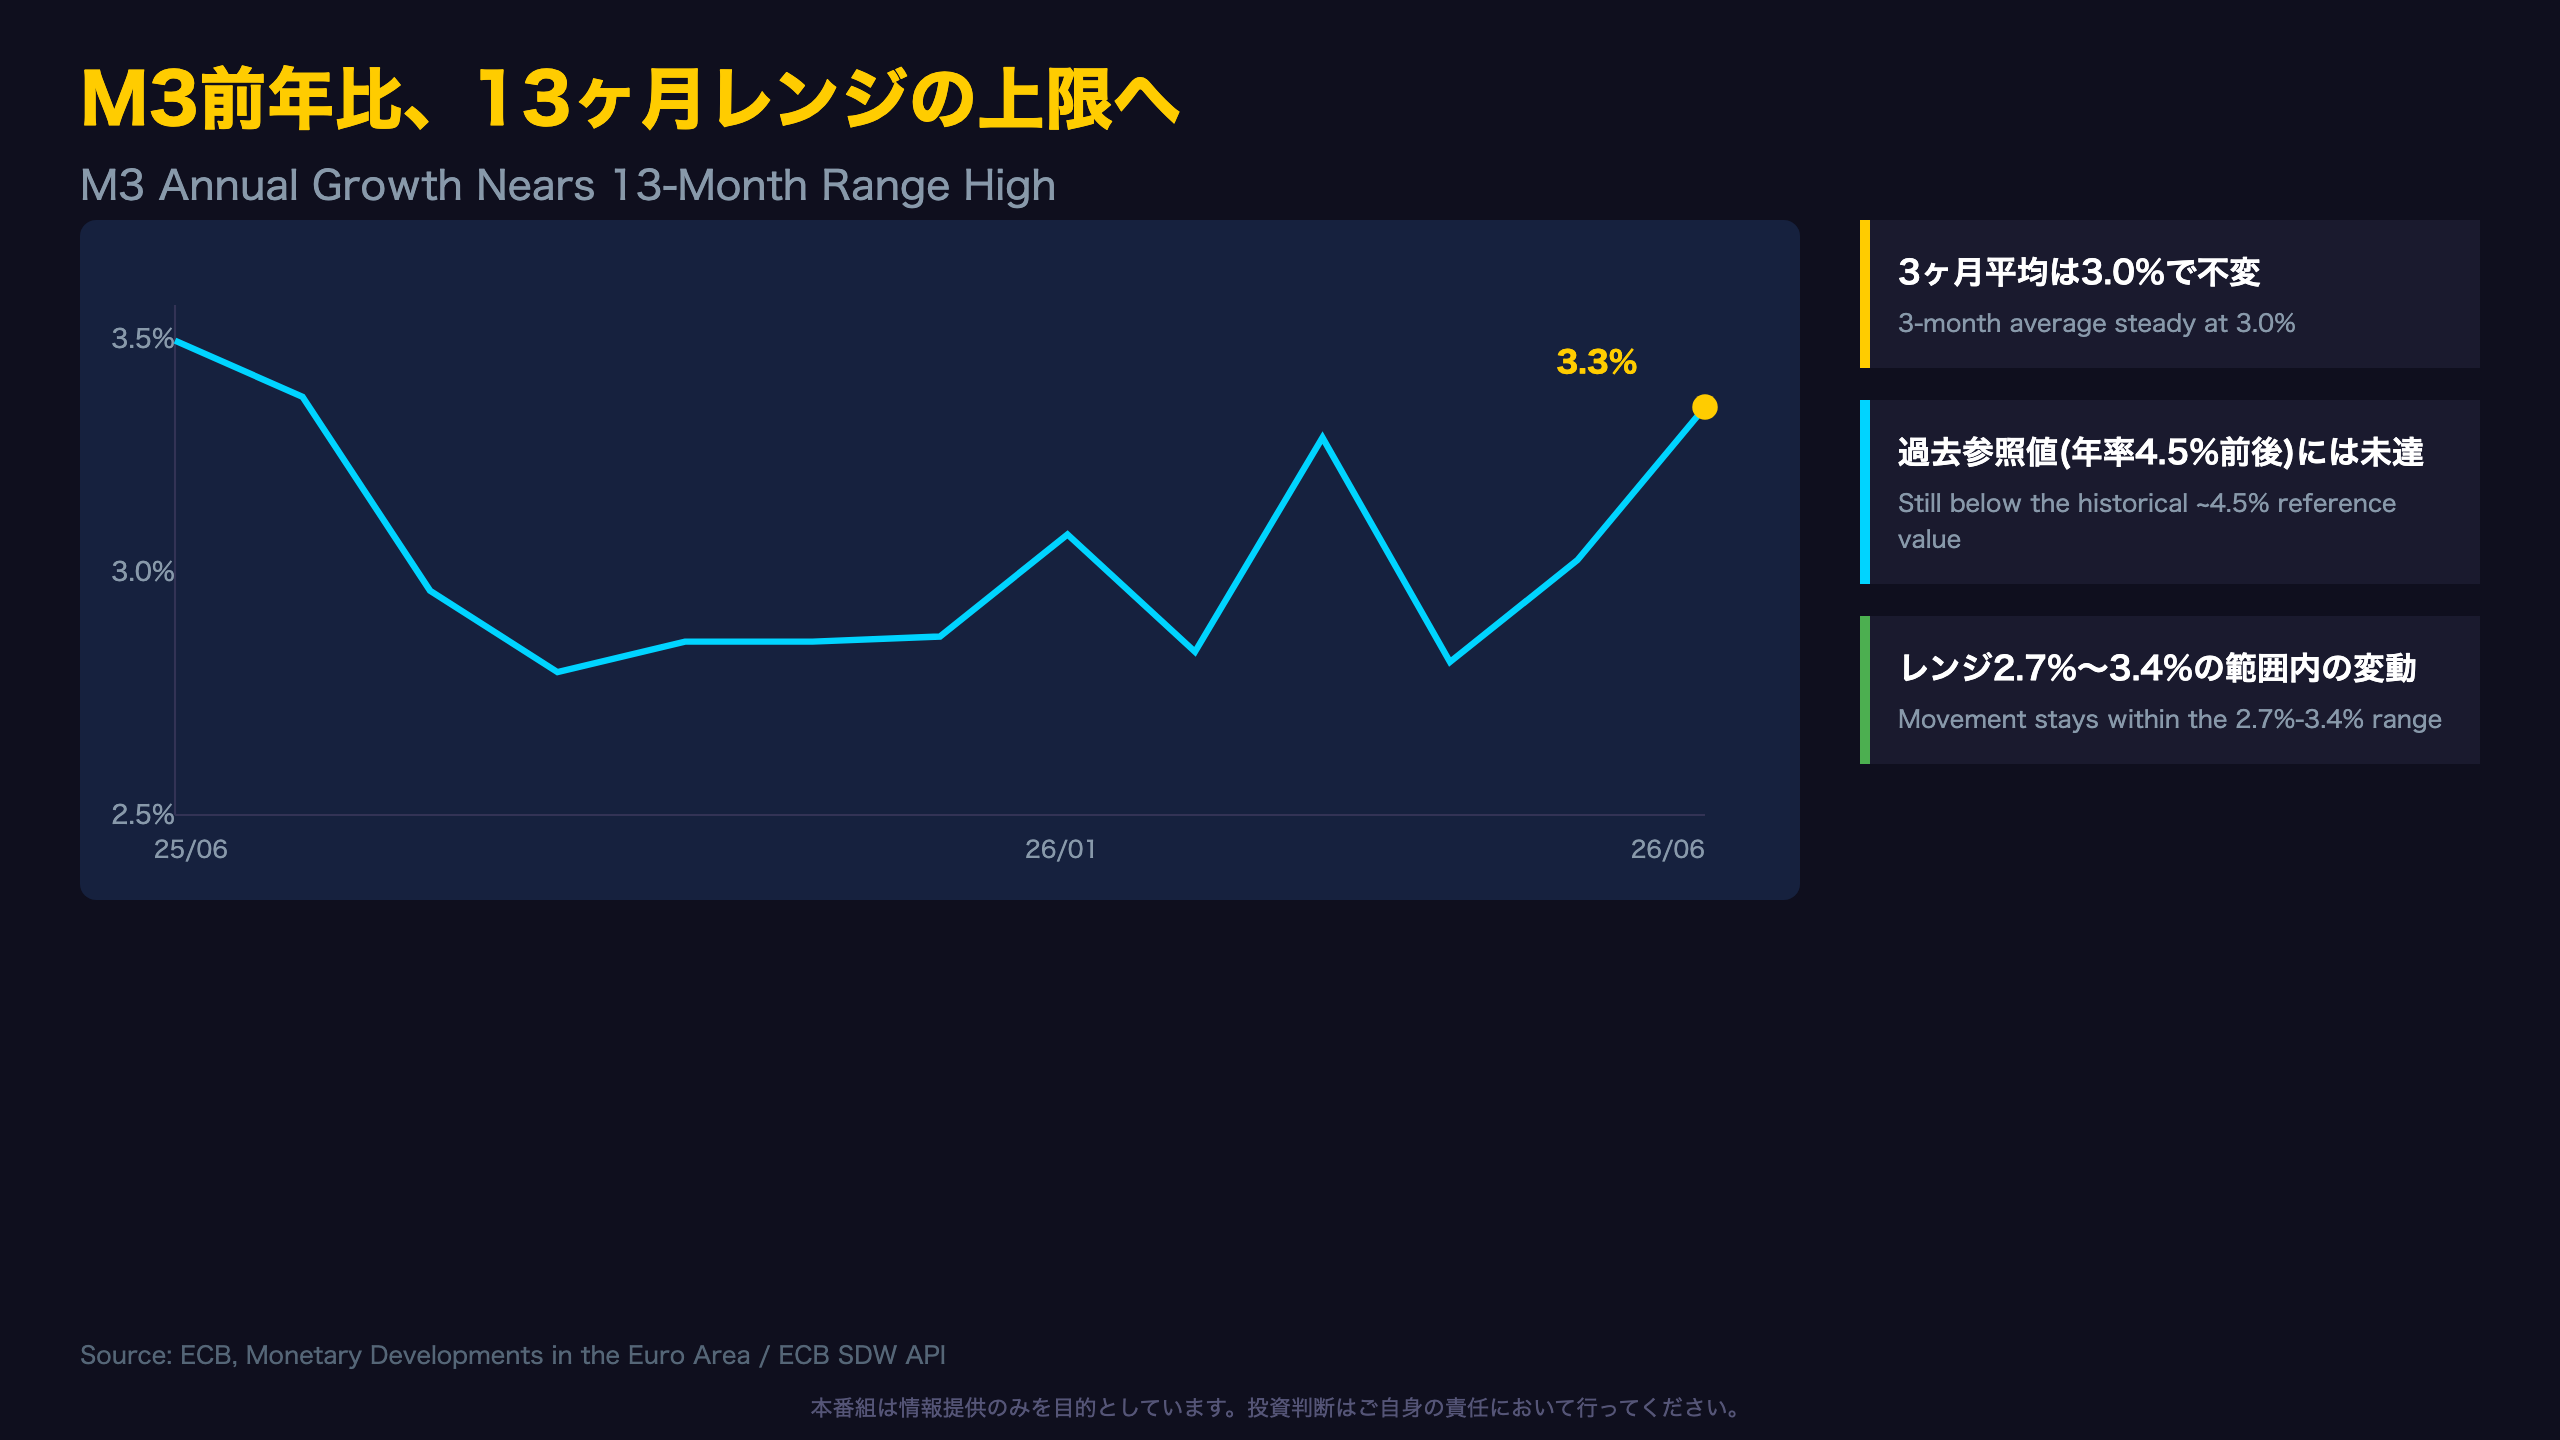
Looking at the last 13 months (June 2025 to June 2026), M3 growth ranged from 2.78% to 3.43%, oscillating without a clear breakout. June’s 3.3% sits near the top of that range, but the 3-month moving average — which the ECB explicitly cites (“averaging 3.0% in the three months up to June”) — is identical to the prior month’s average. A single month’s acceleration does not necessarily indicate an inflection point.
Reading against the historical reference value
The ECB, in earlier decades, cited an M3 reference rate of roughly 4.5% annual growth as consistent with price stability. Current growth remains more than a full percentage point below that threshold, which does not point to a monetary-driven inflation risk on its own.
Market implication: stable-to-moderate M3 growth, well within historical ranges, is generally consistent with an ECB not under pressure to change its stance abruptly based on this indicator alone.
M1、6ヶ月連続減速の裏にある資金シフト
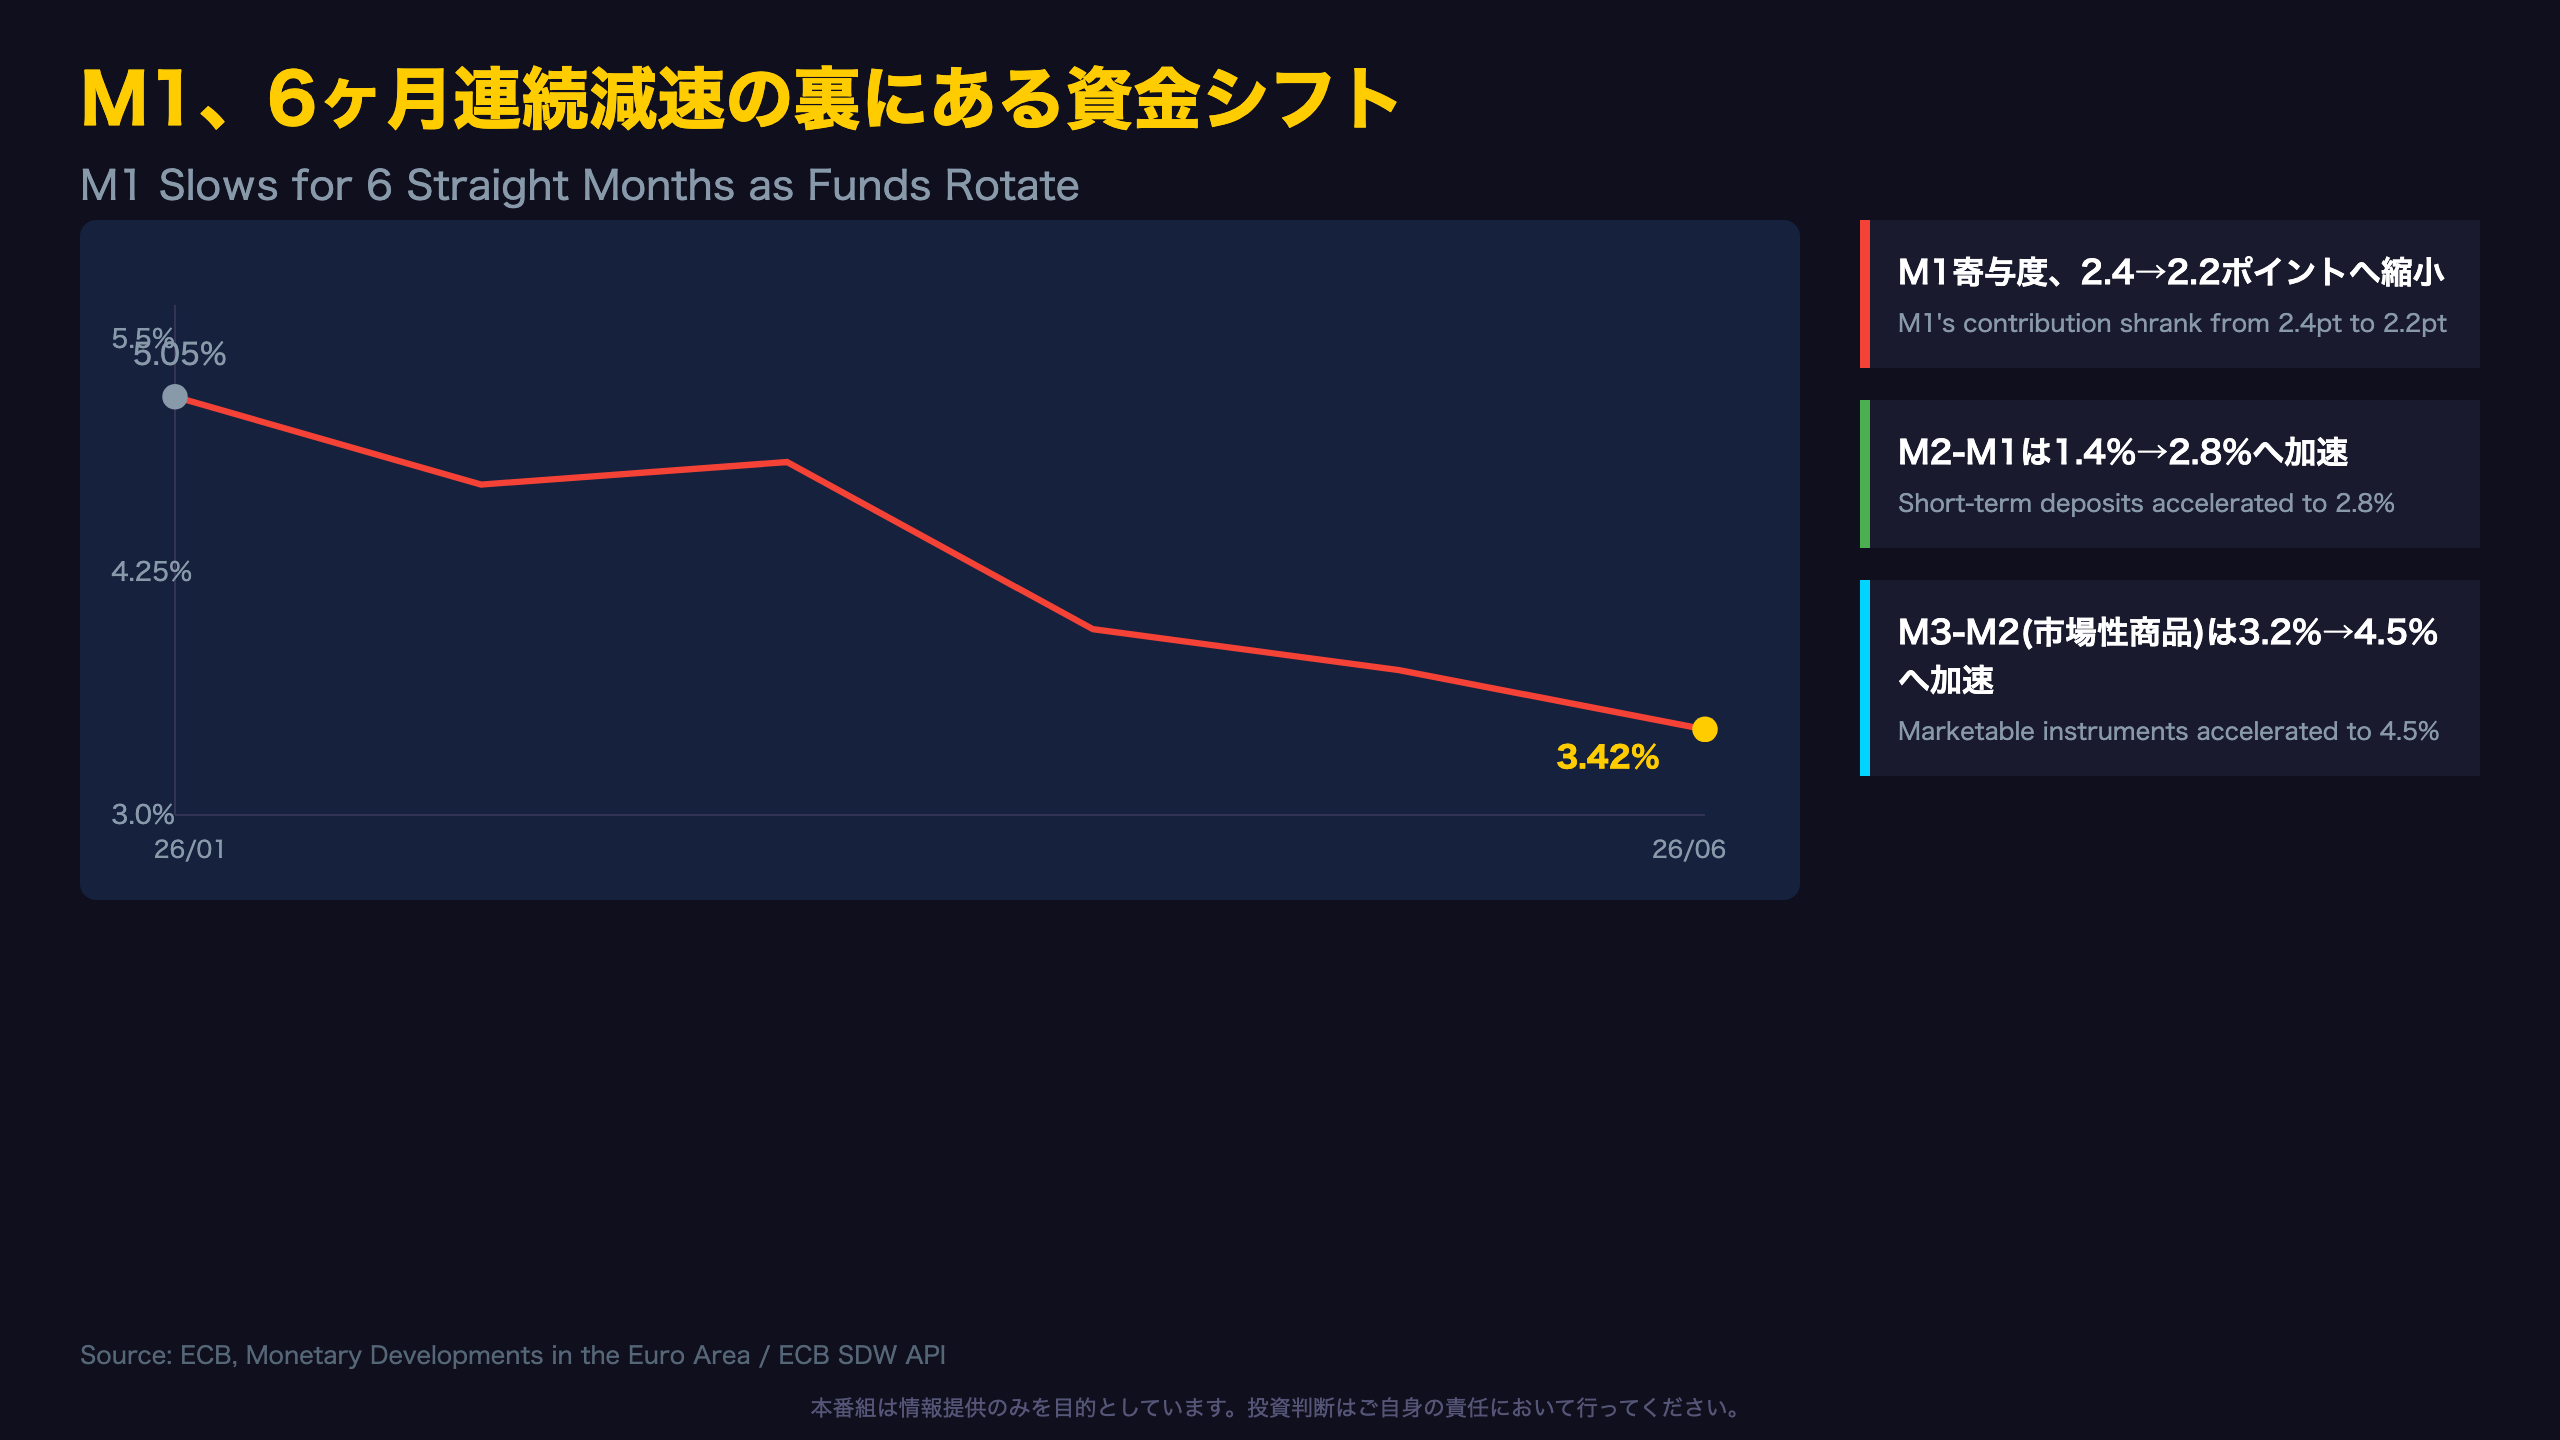
M1’s Six-Month Slide: A Rotation Story, Not a Recession Signal
M1 — cash and overnight deposits — is the most liquid slice of the money supply, comparable to the transactional component tracked by the Federal Reserve. Its growth rate falling from 5.05% in January 2026 to 3.42% in June is a meaningful, multi-month deceleration, but context matters.
The ECB’s contribution breakdown shows M1 contributed 2.2 percentage points to M3 growth in June, down only modestly from 2.4pp in May — a far more moderate move than the headline rate suggests, because M1 is being offset by faster growth elsewhere. Short-term time deposits (M2-M1) accelerated from 1.4% to 2.8%, and marketable instruments (M3-M2) — money market fund shares, short-term debt securities — accelerated from 3.2% to 4.5%.
Two ways to read this
Optimistic: with term deposits offering better yields, savers are rationally shifting idle cash — a sign of a functioning, price-responsive banking system.
Cautious: a slowing M1 has, in some historical episodes, preceded softer near-term consumer spending, since overnight deposits are the most readily spendable form of money. A single month cannot confirm that dynamic is at play; the ECB notes these figures are seasonally adjusted, reducing but not eliminating noise.
For dollar- or yen-based investors, the practical read is a portfolio composition shift within money supply, not necessarily shrinking eurozone liquidity overall.
預金セクター別、三極化する伸び率
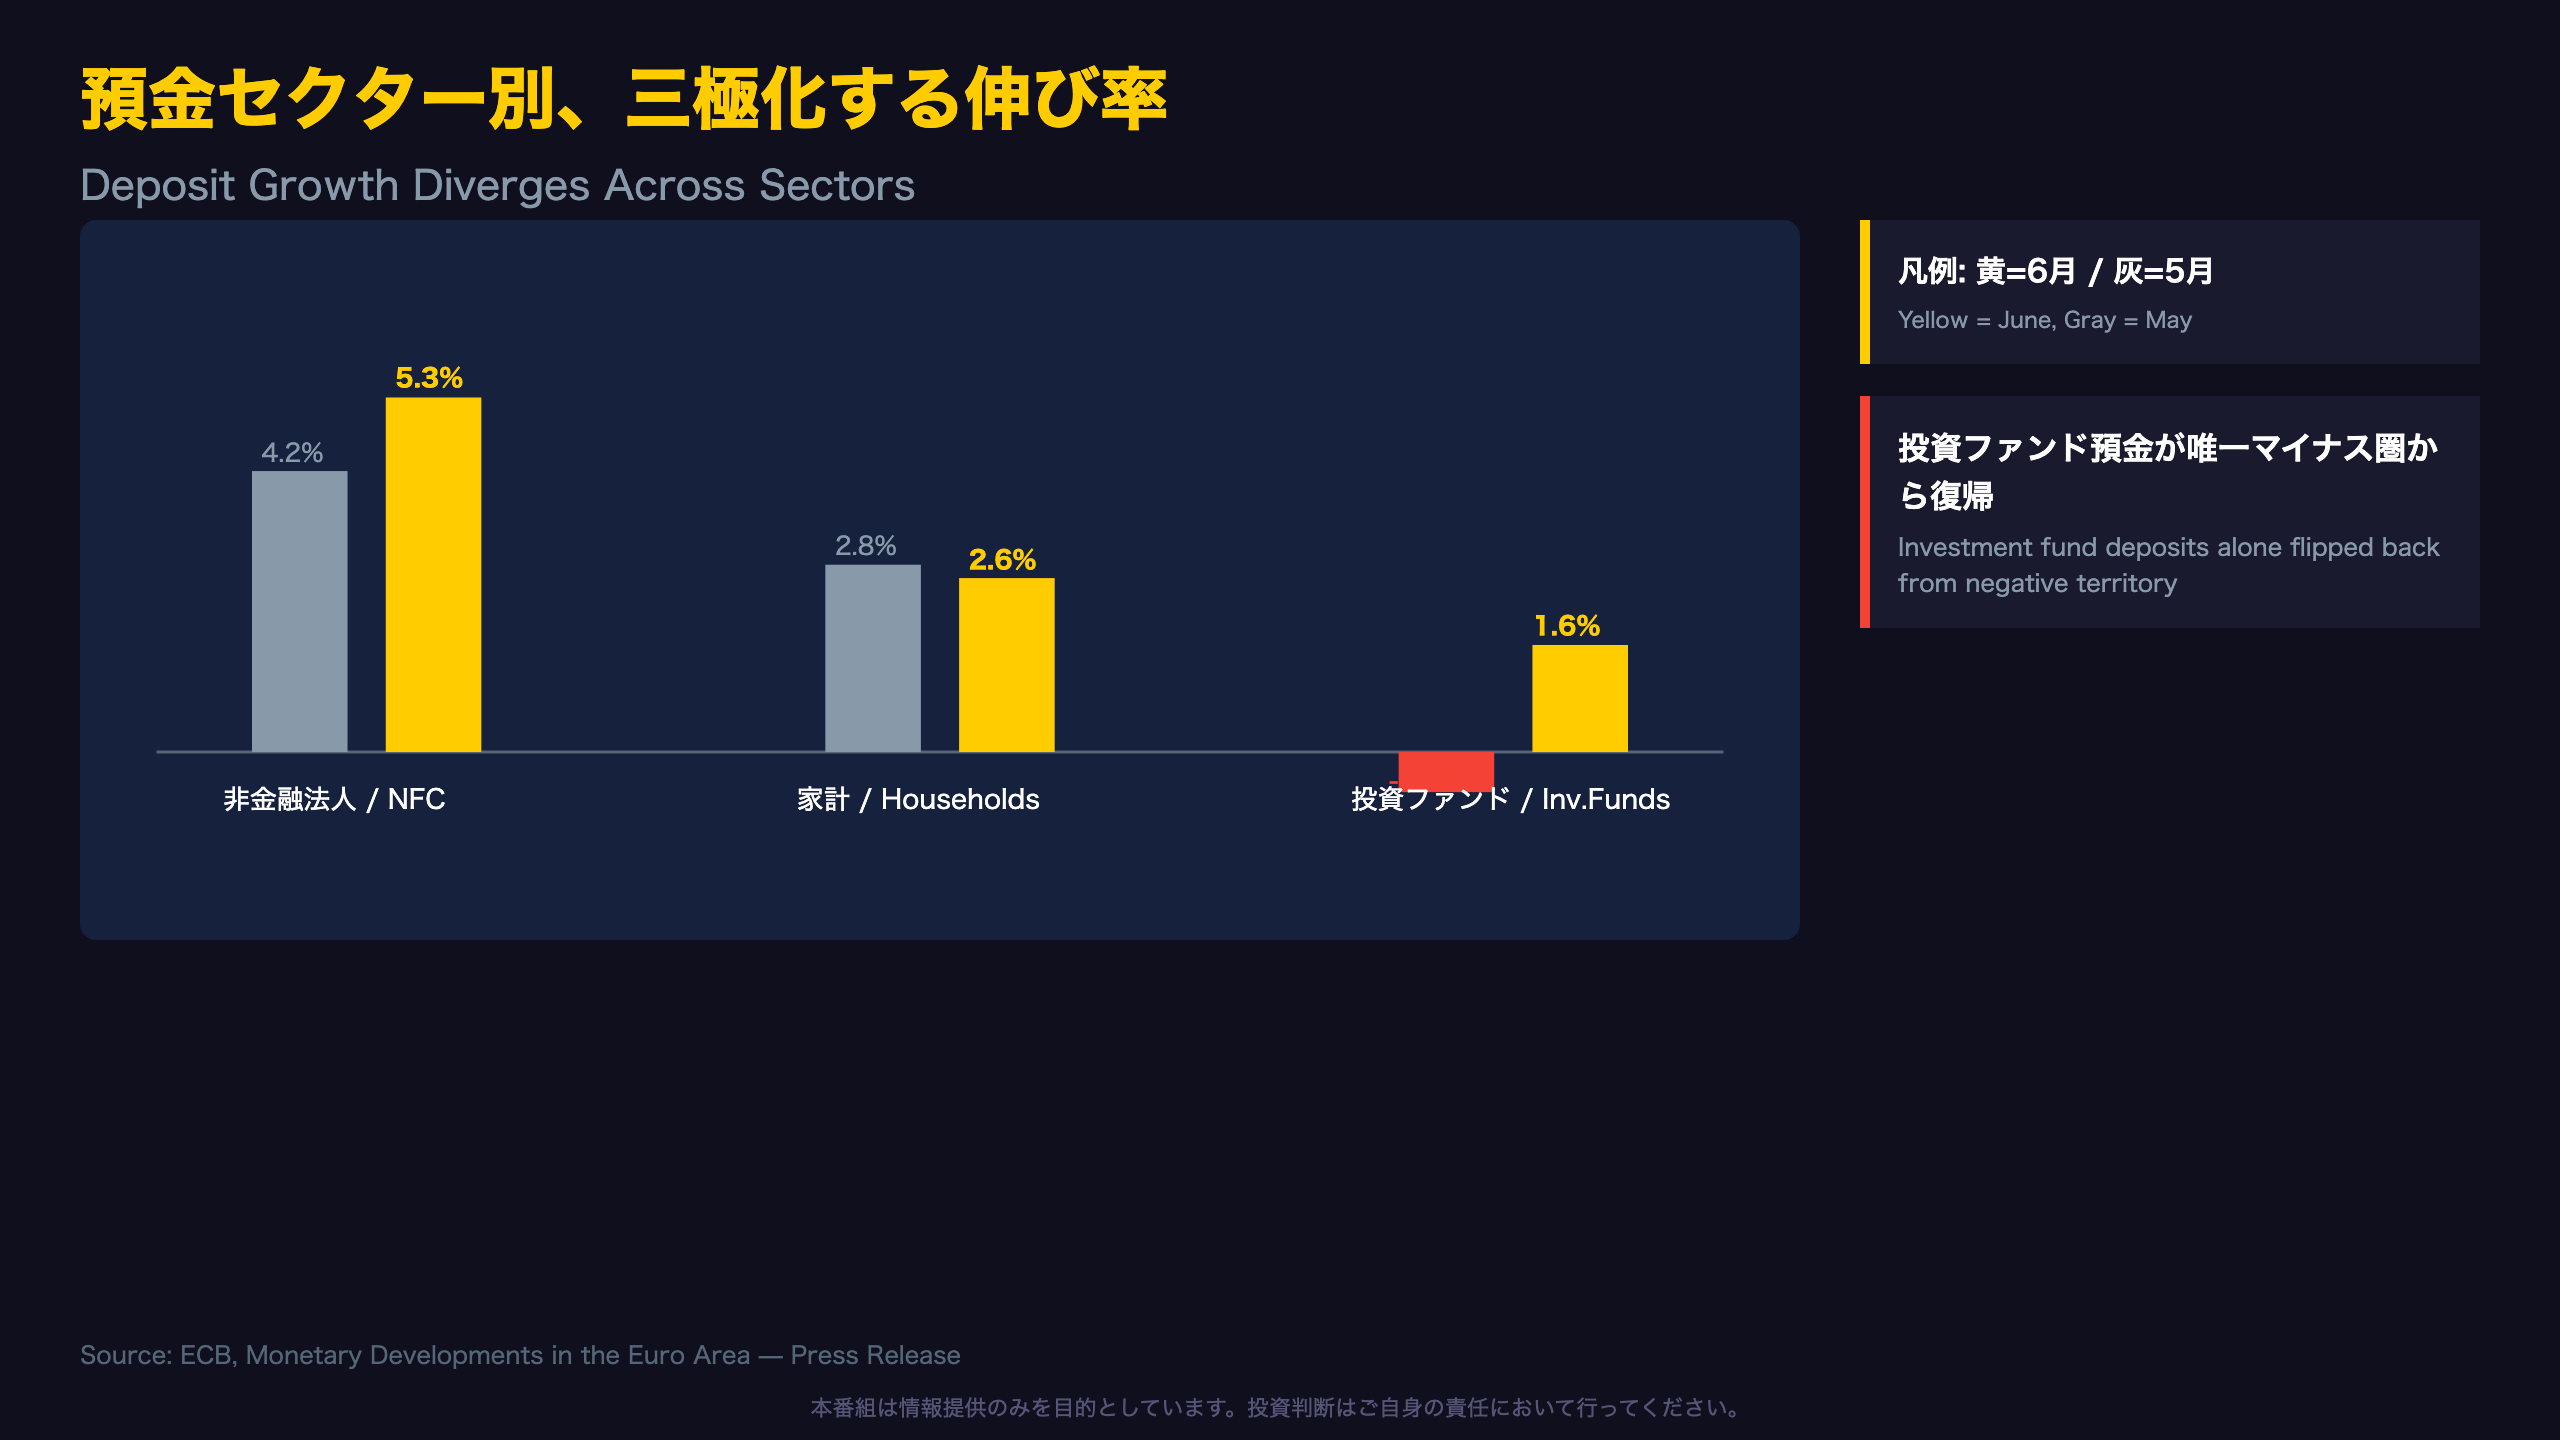
Sector Deposits Diverge: Corporates Build Cash, Households Ease
| Sector | June YoY | May YoY | Change |
|---|---|---|---|
| Non-financial corporations | 5.3% | 4.2% | +1.1pt |
| Households | 2.6% | 2.8% | -0.2pt |
| Investment funds (non-MMF) | 1.6% | -0.6% | +2.2pt |
Corporate deposit growth at 5.3% is now more than double the household rate. One plausible explanation, though not confirmed by this data alone, is that eurozone corporates are holding back capex and building cash buffers — a pattern also seen in US and UK corporate sectors amid elevated borrowing costs. An alternative explanation is simple seasonality in receivables/payables timing.
Household deposit growth easing to 2.6% from 2.8% is not, by itself, evidence of stressed consumer balance sheets — it remains solidly positive and well above the near-zero readings seen during the 2022-23 tightening cycle.
The investment fund wildcard
The swing from -0.6% to +1.6% is this release’s most dramatic single data point. Compare this to April’s reading of -5.8% (per the ECB’s prior release) — meaning this series has moved through a roughly 7.4 percentage point range in three months. This level of volatility argues for caution before drawing structural conclusions; it looks more consistent with technical, flow-driven volatility than a durable change in risk appetite.
M3対価構成、長期負債のブレーキが強まる
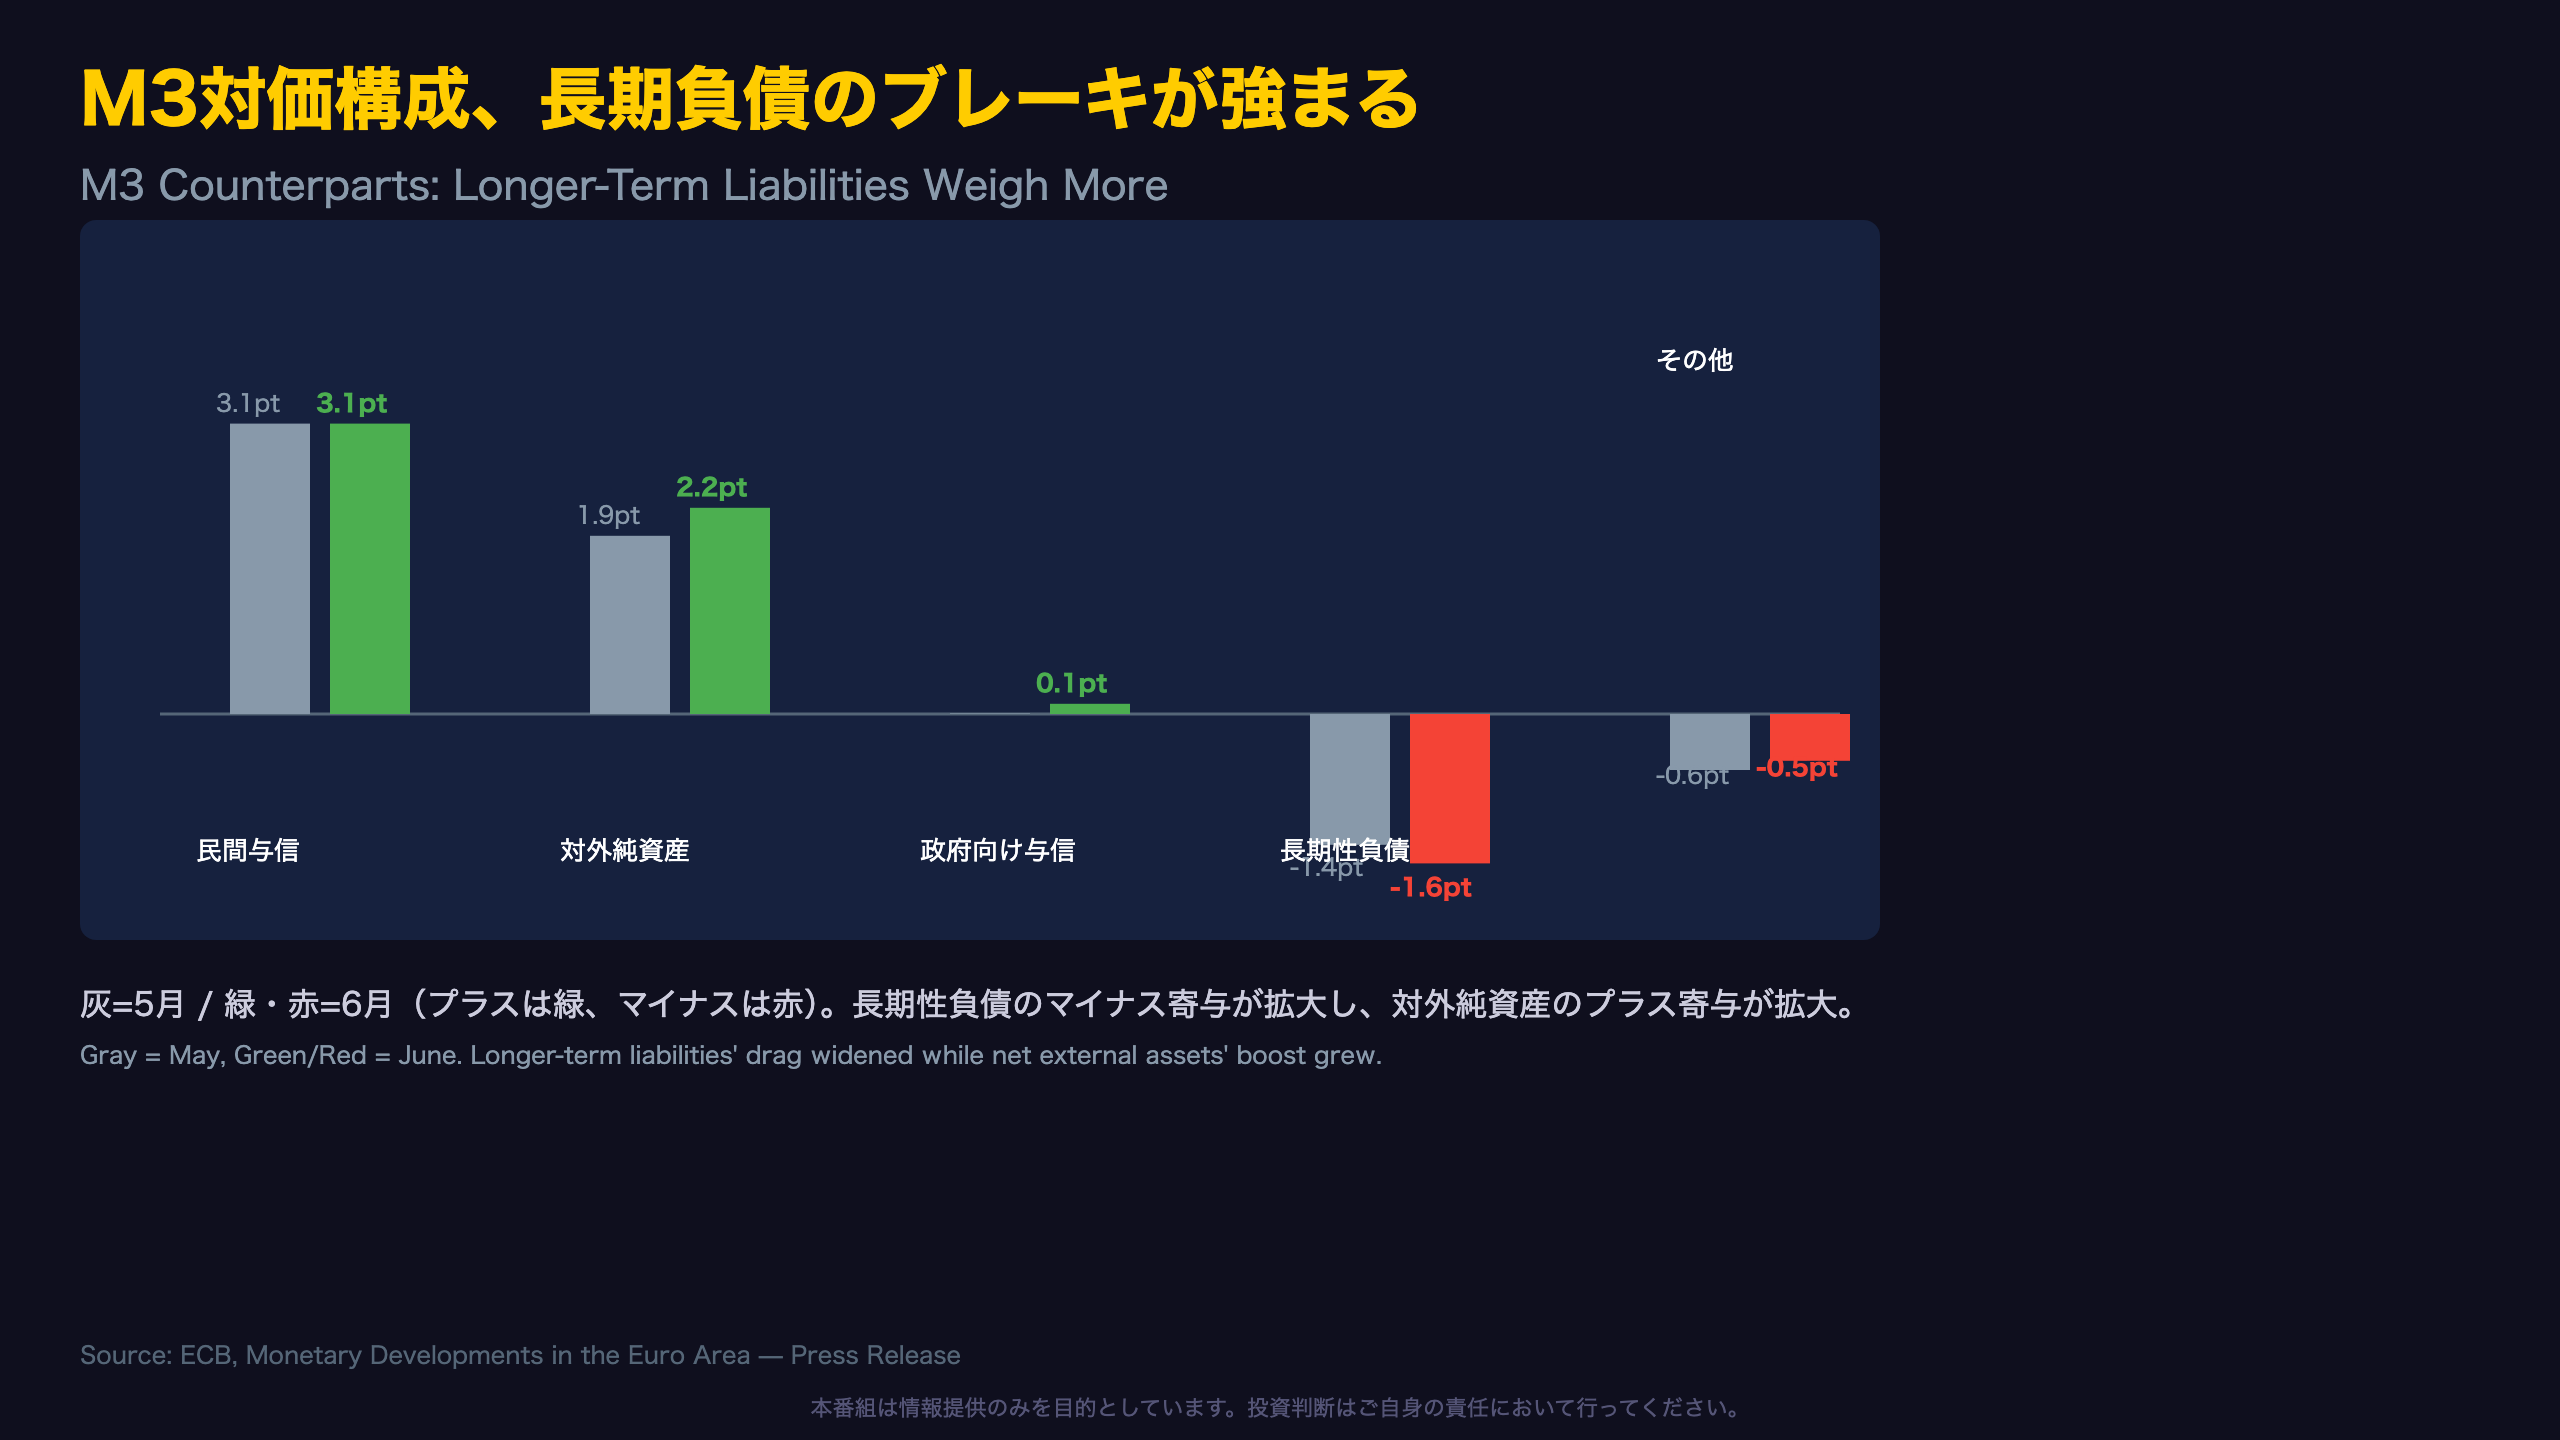
Decoding the Balance Sheet: What’s Really Driving M3
The “counterparts of M3” breakdown shows which parts of the consolidated MFI balance sheet are mechanically driving (or dragging on) money supply growth — similar in spirit to the Fed’s flow-of-funds analysis, though structured differently.
Net external assets — the eurozone banking system’s net claims on the rest of the world — contributed 2.2 percentage points to M3 growth, up from 1.9pp. A rising contribution here generally reflects capital inflows into the euro area or a narrowing of the region’s net external financing needs; either interpretation is broadly euro-supportive at the margin, though this data alone cannot isolate the cause.
Longer-term liabilities — bank bonds, capital instruments, deposits beyond two years — deepened their drag on M3 to -1.6pp from -1.4pp. Because M3 excludes long-maturity liabilities by definition, banks issuing more long-term debt mechanically subtracts from headline M3 even as total balance sheet activity expands. This could reflect balance sheet strengthening (similar to MREL/TLAC-style requirements common across European banks) rather than tightening credit conditions per se.
Crucially, claims on the private sector — the largest counterpart — held its contribution steady at 3.1pp, unchanged from May, suggesting the engine room of M3 growth is not undergoing rapid change even as peripheral items shift.
民間与信は3ヶ月連続で「不変」
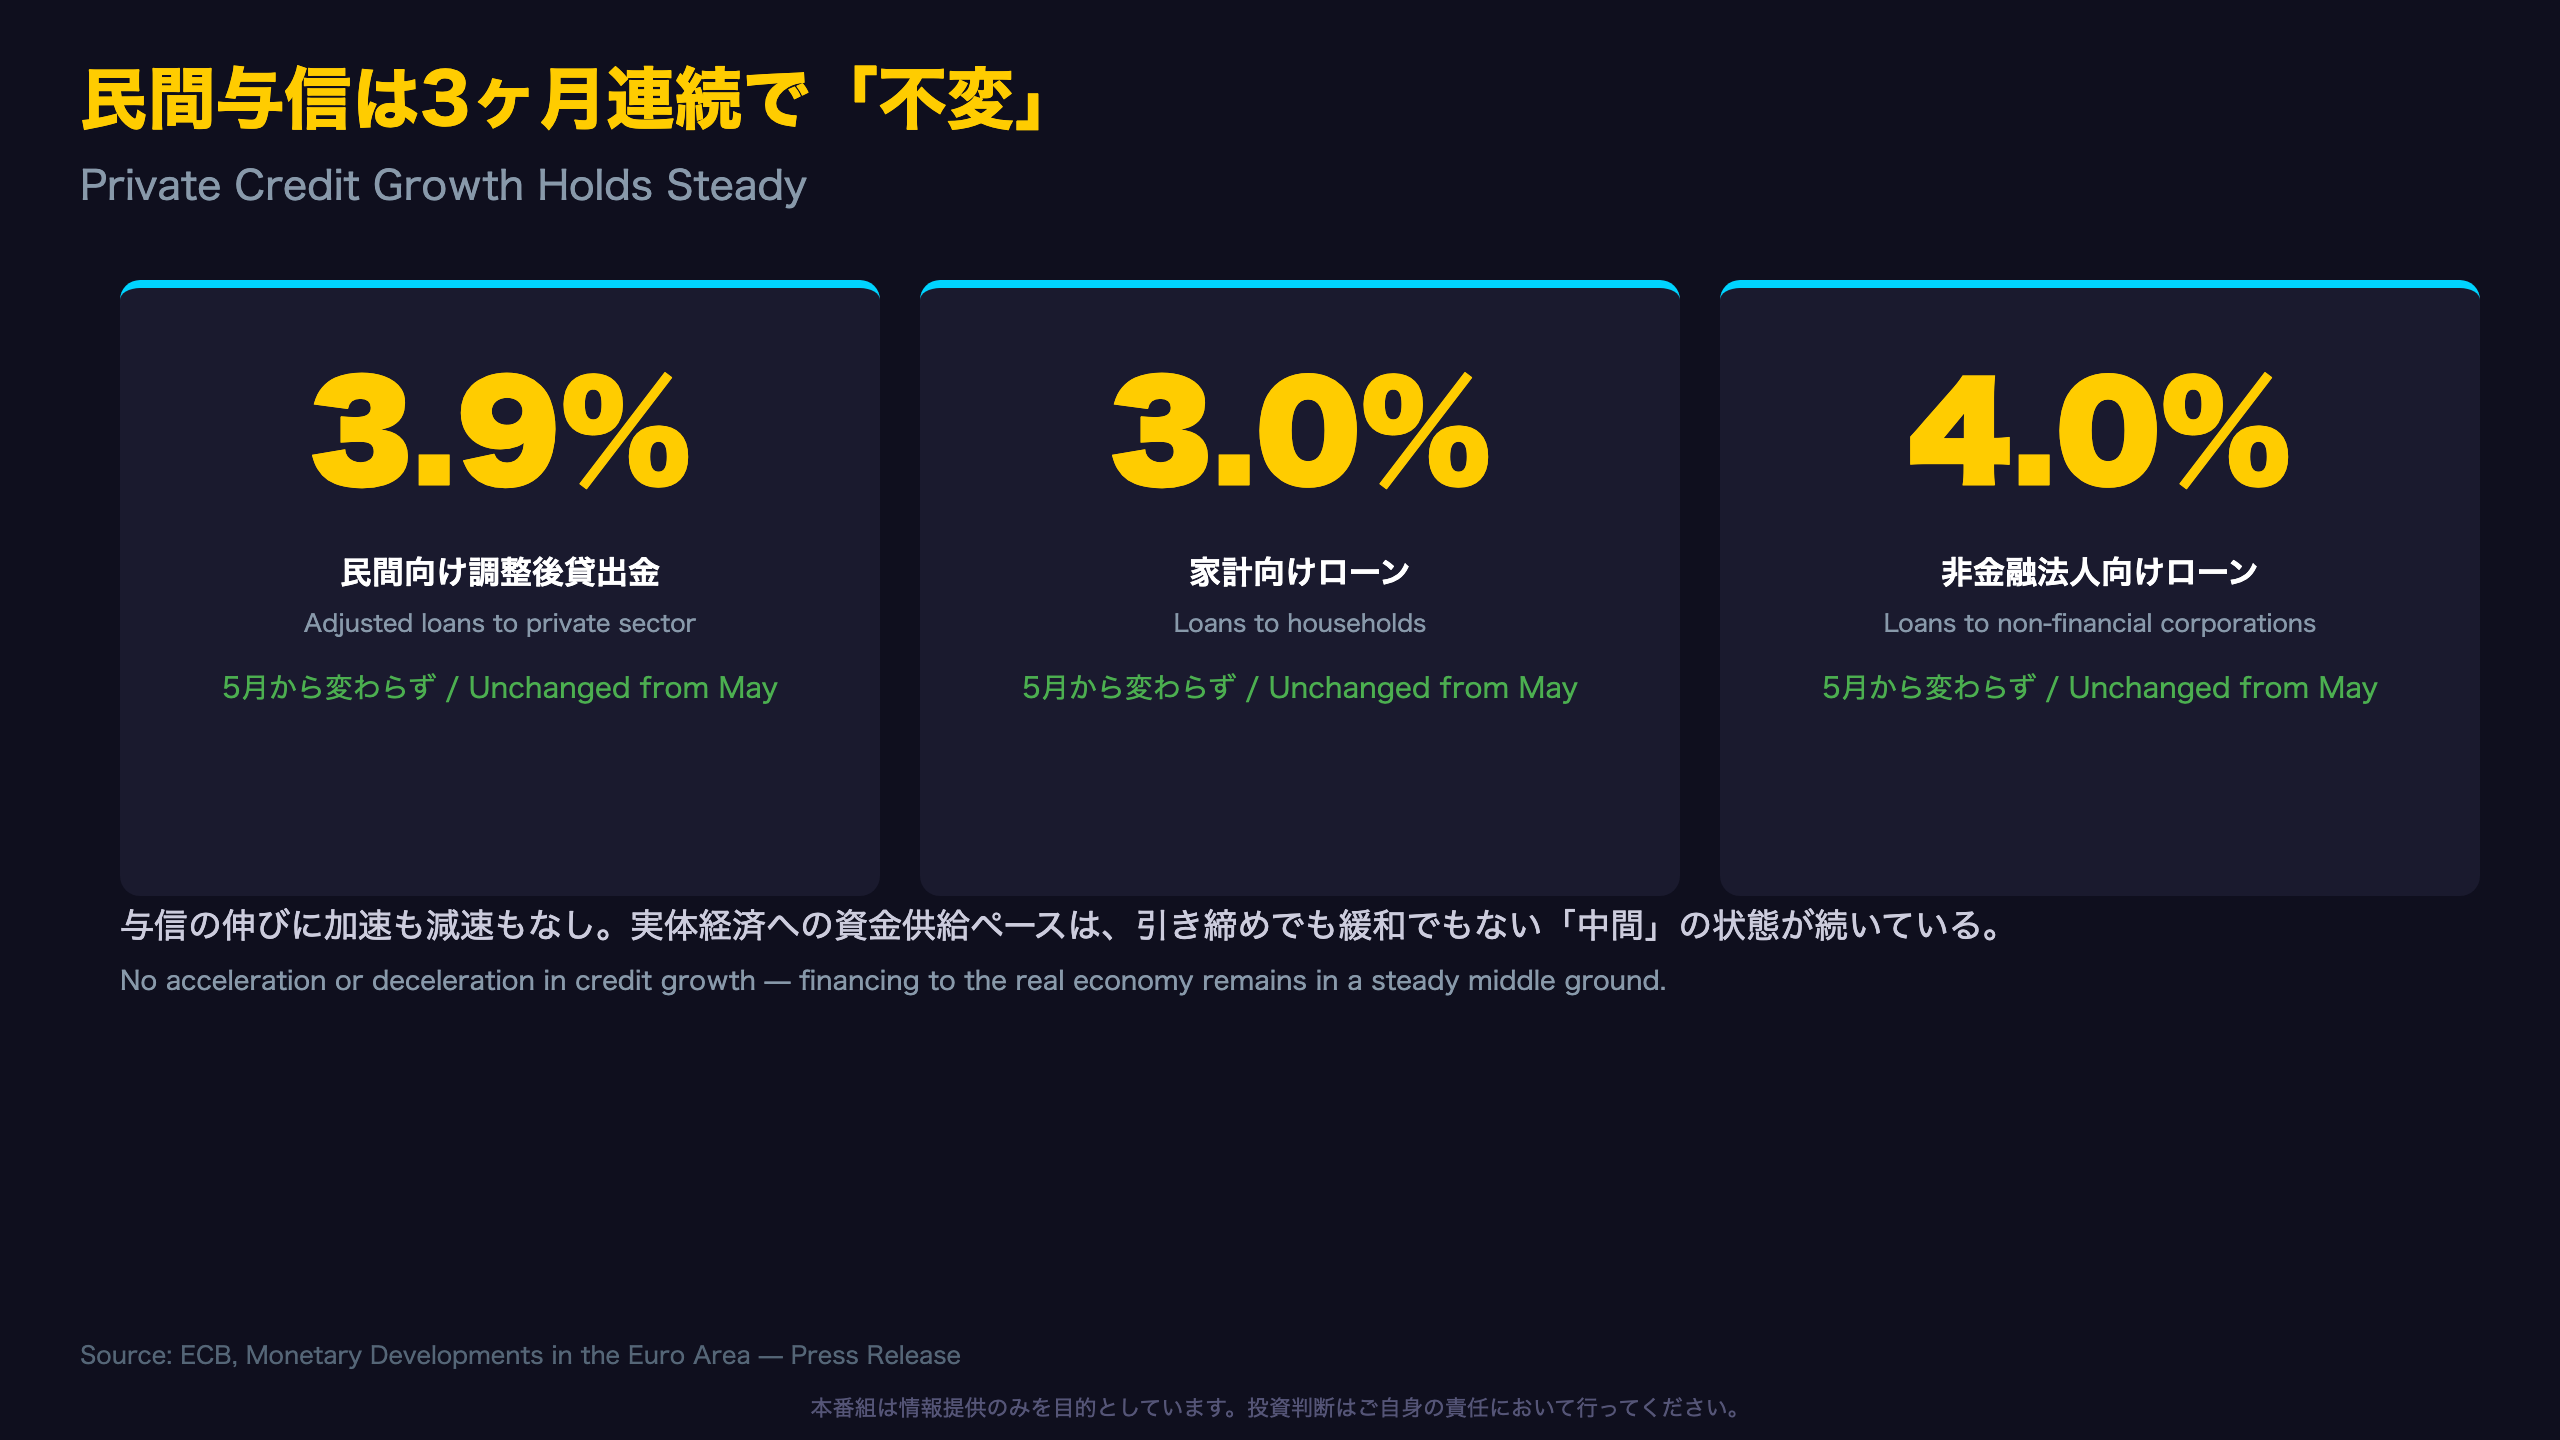
Credit Growth Flatlines: Neither Boom Nor Bust
Adjusted loan growth to the private sector — stripped of loan sales, securitizations, and notional cash pooling distortions — held at 3.9% in June, identical to May. Household loan growth was 3.0% and non-financial corporate loan growth was 4.0%, both unchanged.
For context, this stability follows a period in which loan growth to non-financial corporations rose from roughly 3.4% in April to 4.0% by June — so June’s “unchanged” reading marks a pause after a modest recovery, not a fresh deceleration. This is broadly consistent with a eurozone credit cycle in a gentle upswing that hasn’t accelerated into a credit boom, nor shown signs of a renewed credit crunch reminiscent of 2023.
Comparing frameworks
US readers may find it useful to compare this to the Fed’s Senior Loan Officer Opinion Survey, which gauges lending standards qualitatively; the ECB’s adjusted loan growth series is a quantitative analog tracking realized lending. Both currently point to a credit environment that is neither expansionary nor contractionary — a “steady state” giving the ECB flexibility rather than urgency in its next moves.
Bottom line: flat credit growth removes one potential catalyst for near-term eurozone data surprises, keeping focus on inflation and labor data instead.
EUR/JPY保有者へ:変化より「不変」に注目
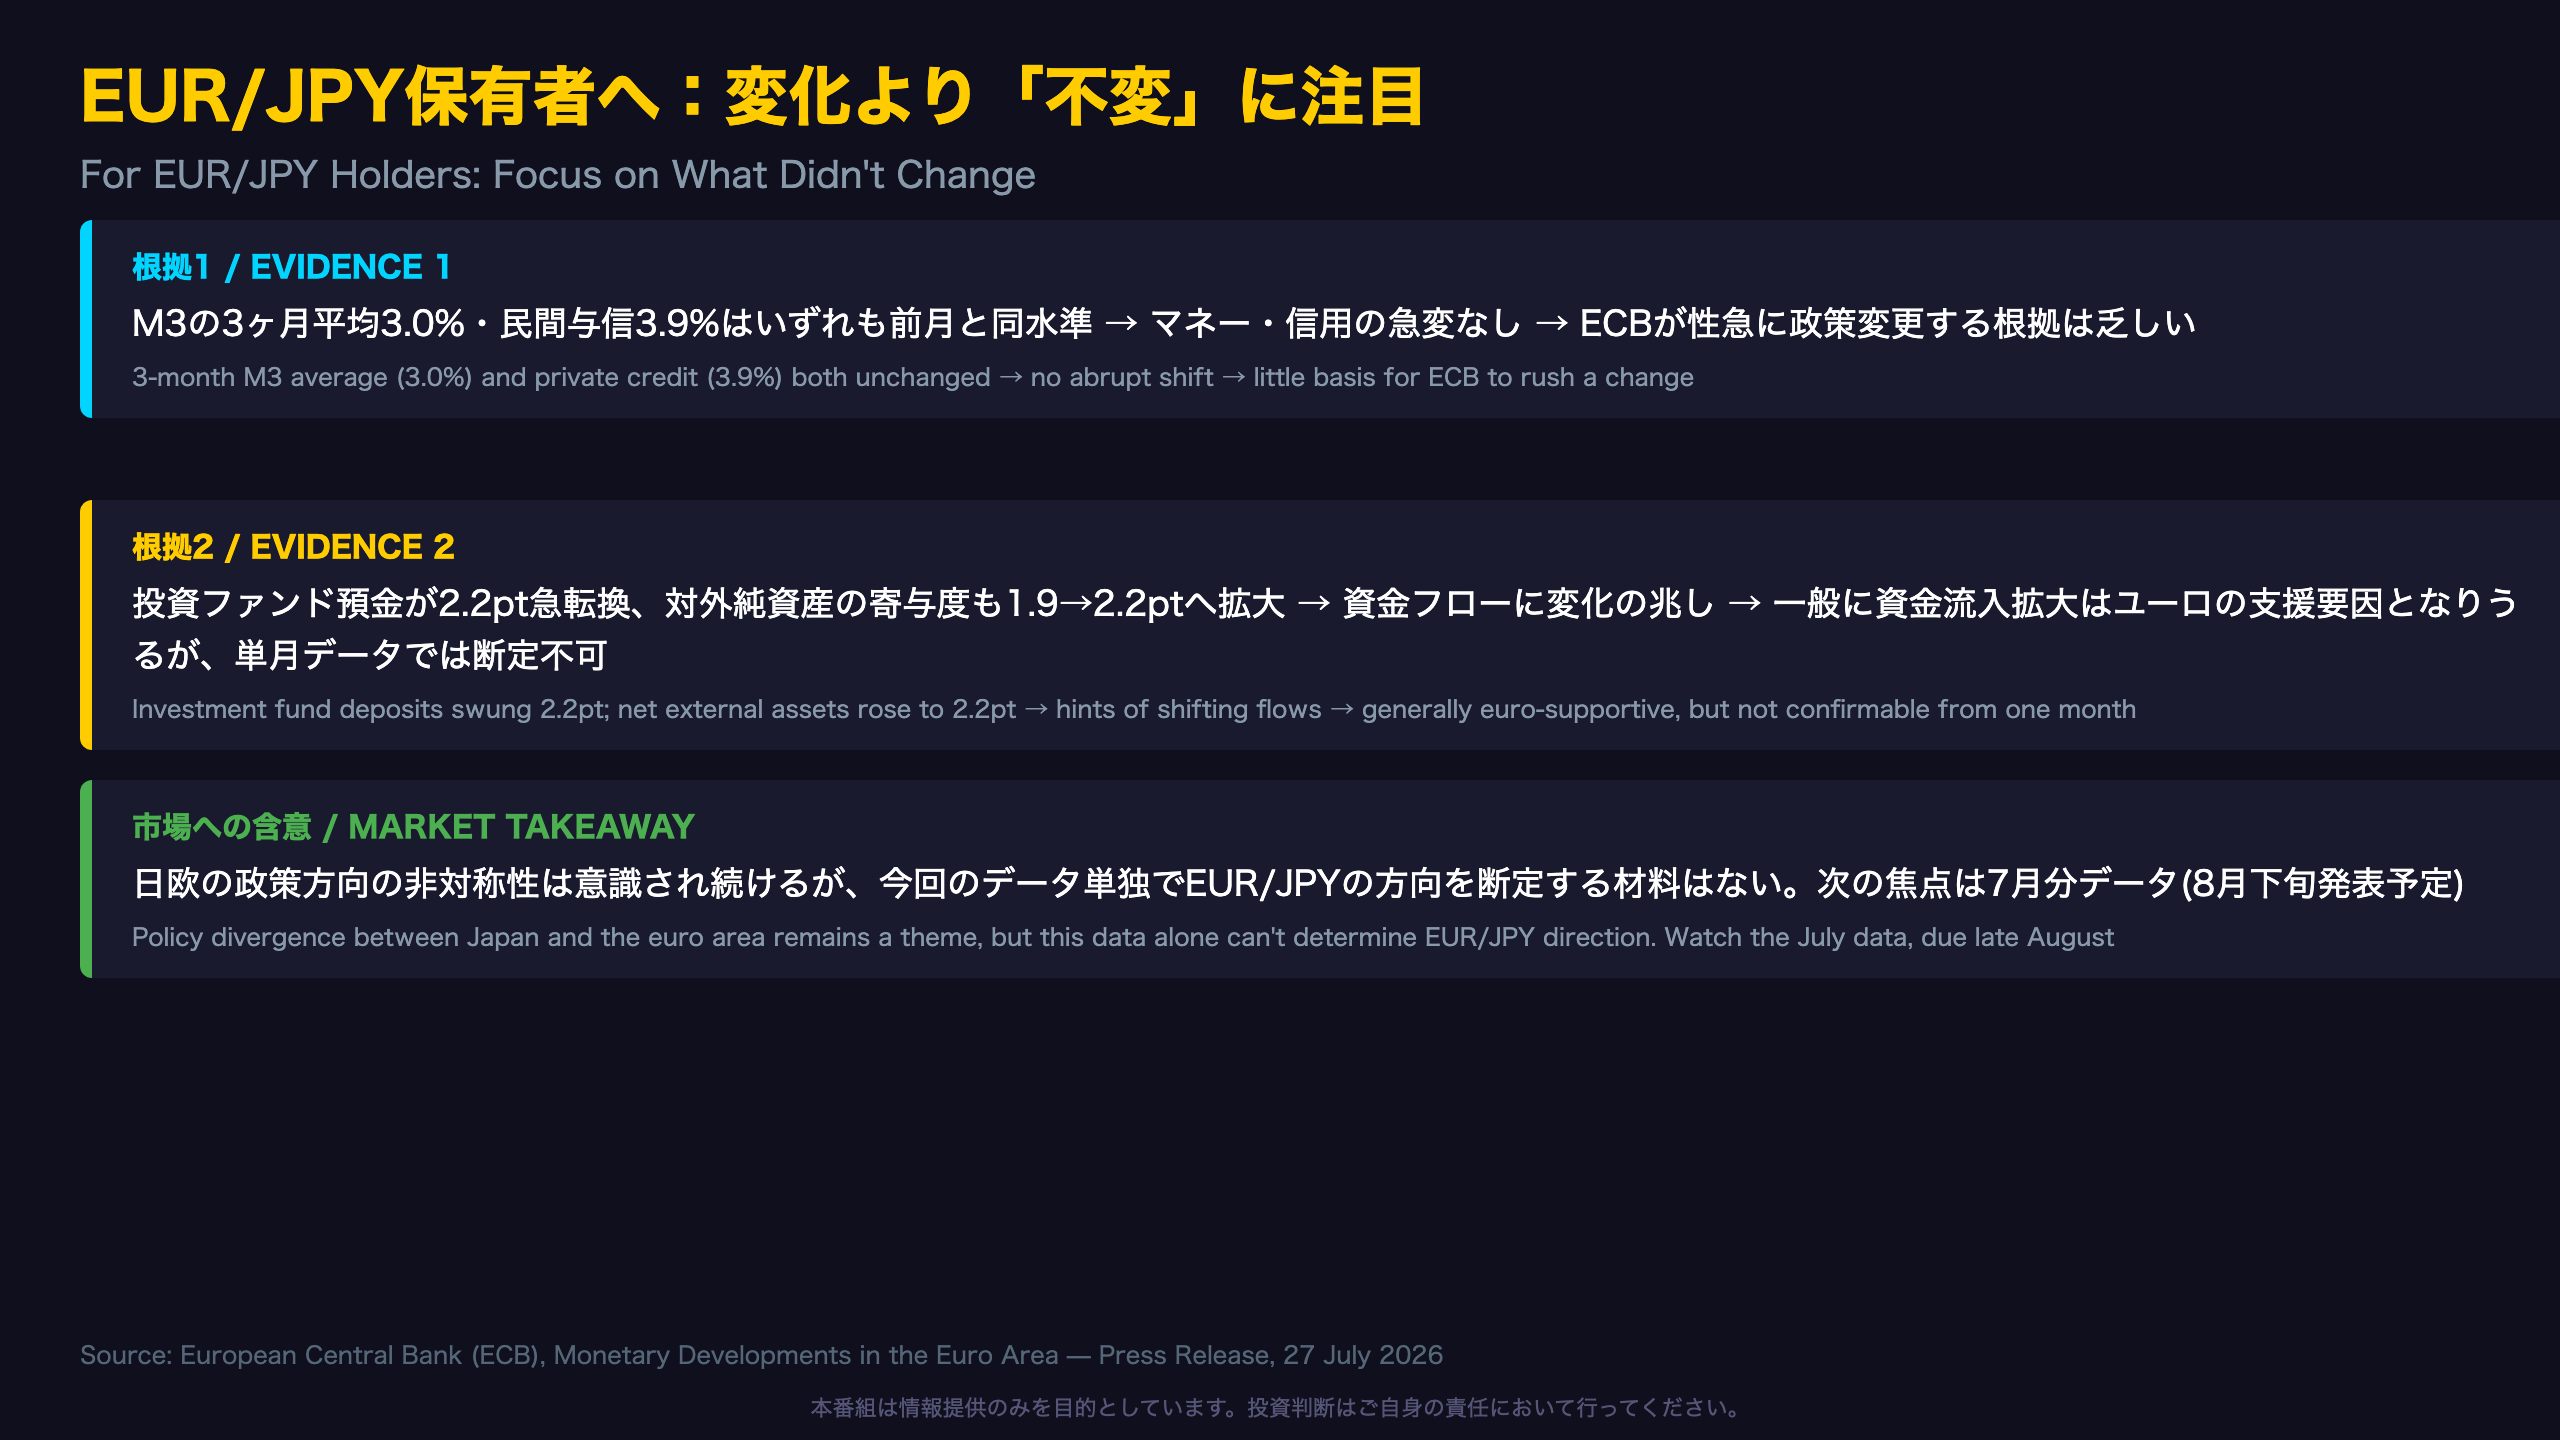
What This Means for EUR/JPY and Cross-Border Portfolios
This release’s core message for FX-focused readers is subtractive: nothing in the credit or core money data argues for the ECB to move urgently in either direction. The 3-month M3 average (3.0%) and adjusted private credit growth (3.9%) are both unchanged from the prior month — a signal of policy-neutral conditions from the “monetary pillar” of ECB analysis.
That said, two data points argue for continued attentiveness: the sharp swing in investment fund deposits (+2.2pp) and the rising contribution from net external assets (+0.3pp to 2.2pp), both pointing to capital flow dynamics that could matter more if they persist.
The Japan angle
Japanese investors holding EUR-denominated assets are simultaneously watching a Bank of Japan on a gradual policy normalization path. It is a widely discussed market view — not something this ECB release can itself confirm — that policy divergence between a normalizing BOJ and an ECB in wait-and-see mode could be a medium-term theme for EUR/JPY. This release neither strengthens nor weakens that broader narrative; it confirms the ECB side of the equation looks stable rather than urgent.
Next data point: the July 2026 monetary aggregates release is expected in late August. Watch whether investment fund deposit growth holds near +1.6% (confirming a durable shift) or reverts (confirming this month’s move was technical/seasonal noise).
Disclaimer: This article is for informational purposes only. All investment decisions are made solely at your own risk.