📺 Watch the Full Video Analysis
This article was automatically generated by the NFC Market Live AI analysis system. (Updated: 2026-07-15 21:48 JST)
📄 Primary Source
Statistics Canada
https://www150.statcan.gc.ca/n1/daily-quotidien/260715/dq260715b-eng.htm
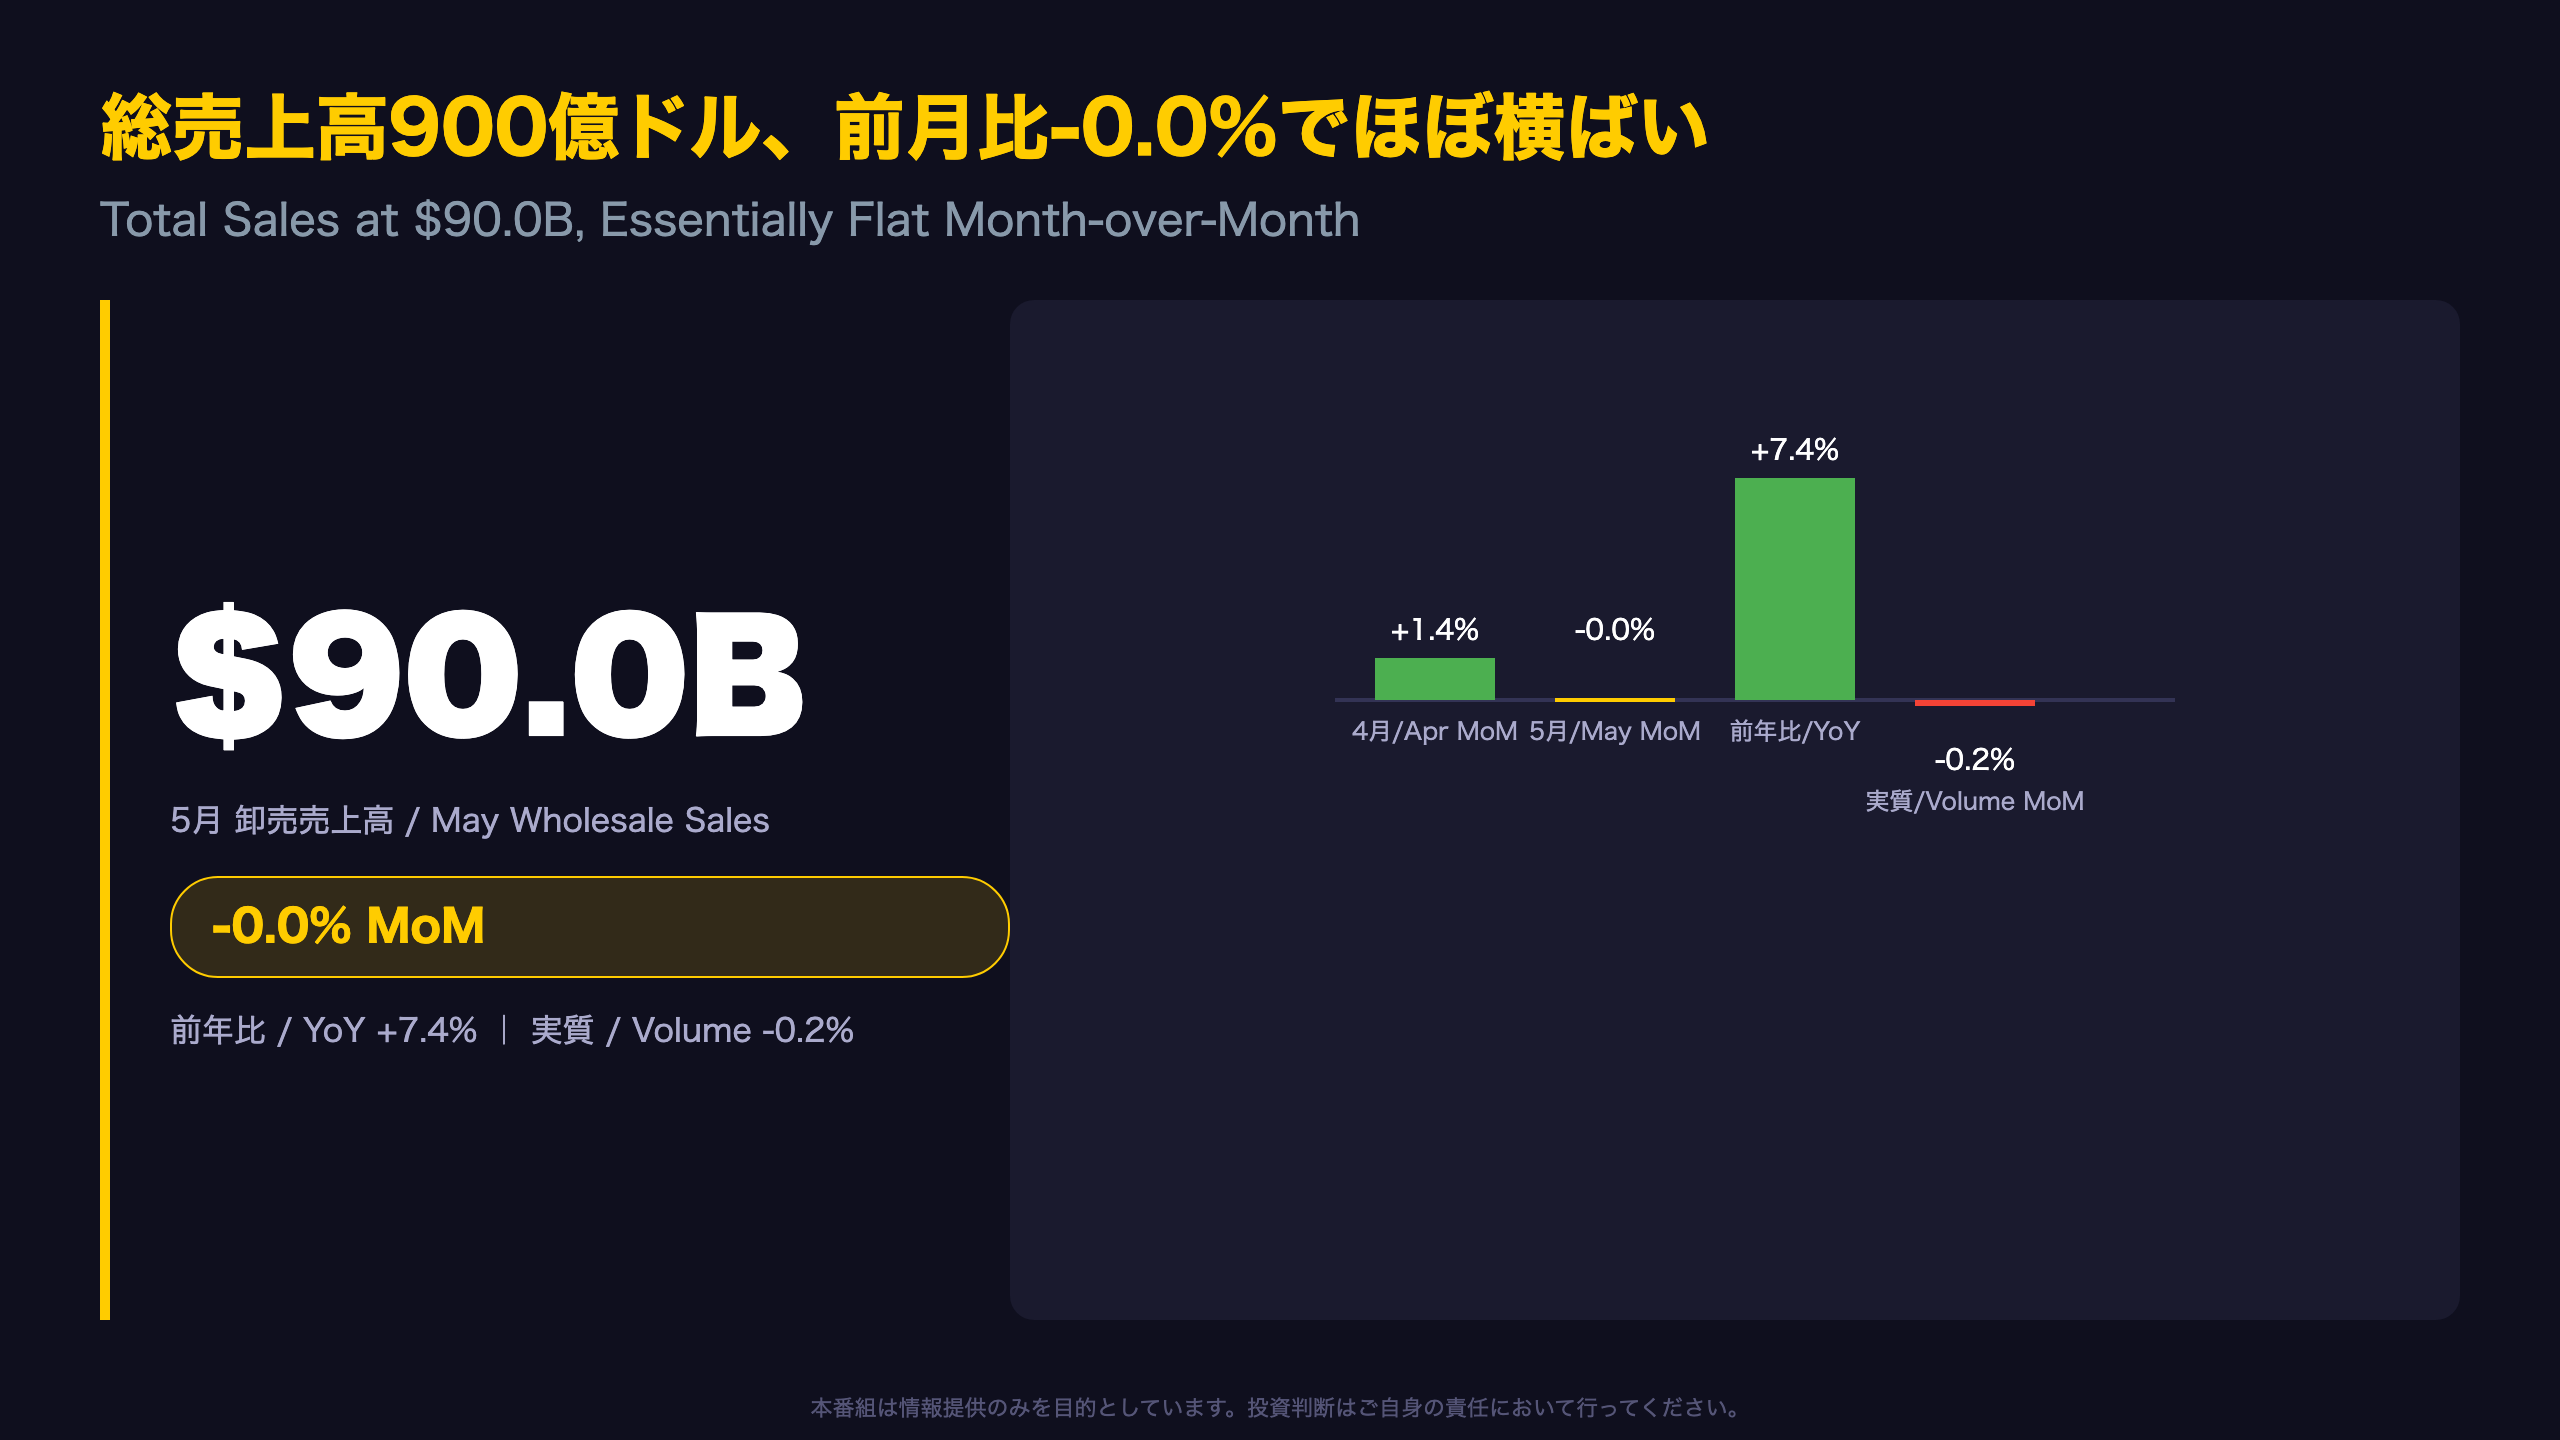
📊 Statistics Canada reported May wholesale sales of CAD 90.0 billion, essentially flat at -0.0% month-over-month.
📉 Real (volume-adjusted) sales fell -0.2%, suggesting price effects may be propping up the nominal figure.
📈 Year-over-year growth held solid at +7.4%.
🏭 Quebec and BC led provincial declines while Alberta and Ontario posted gains.
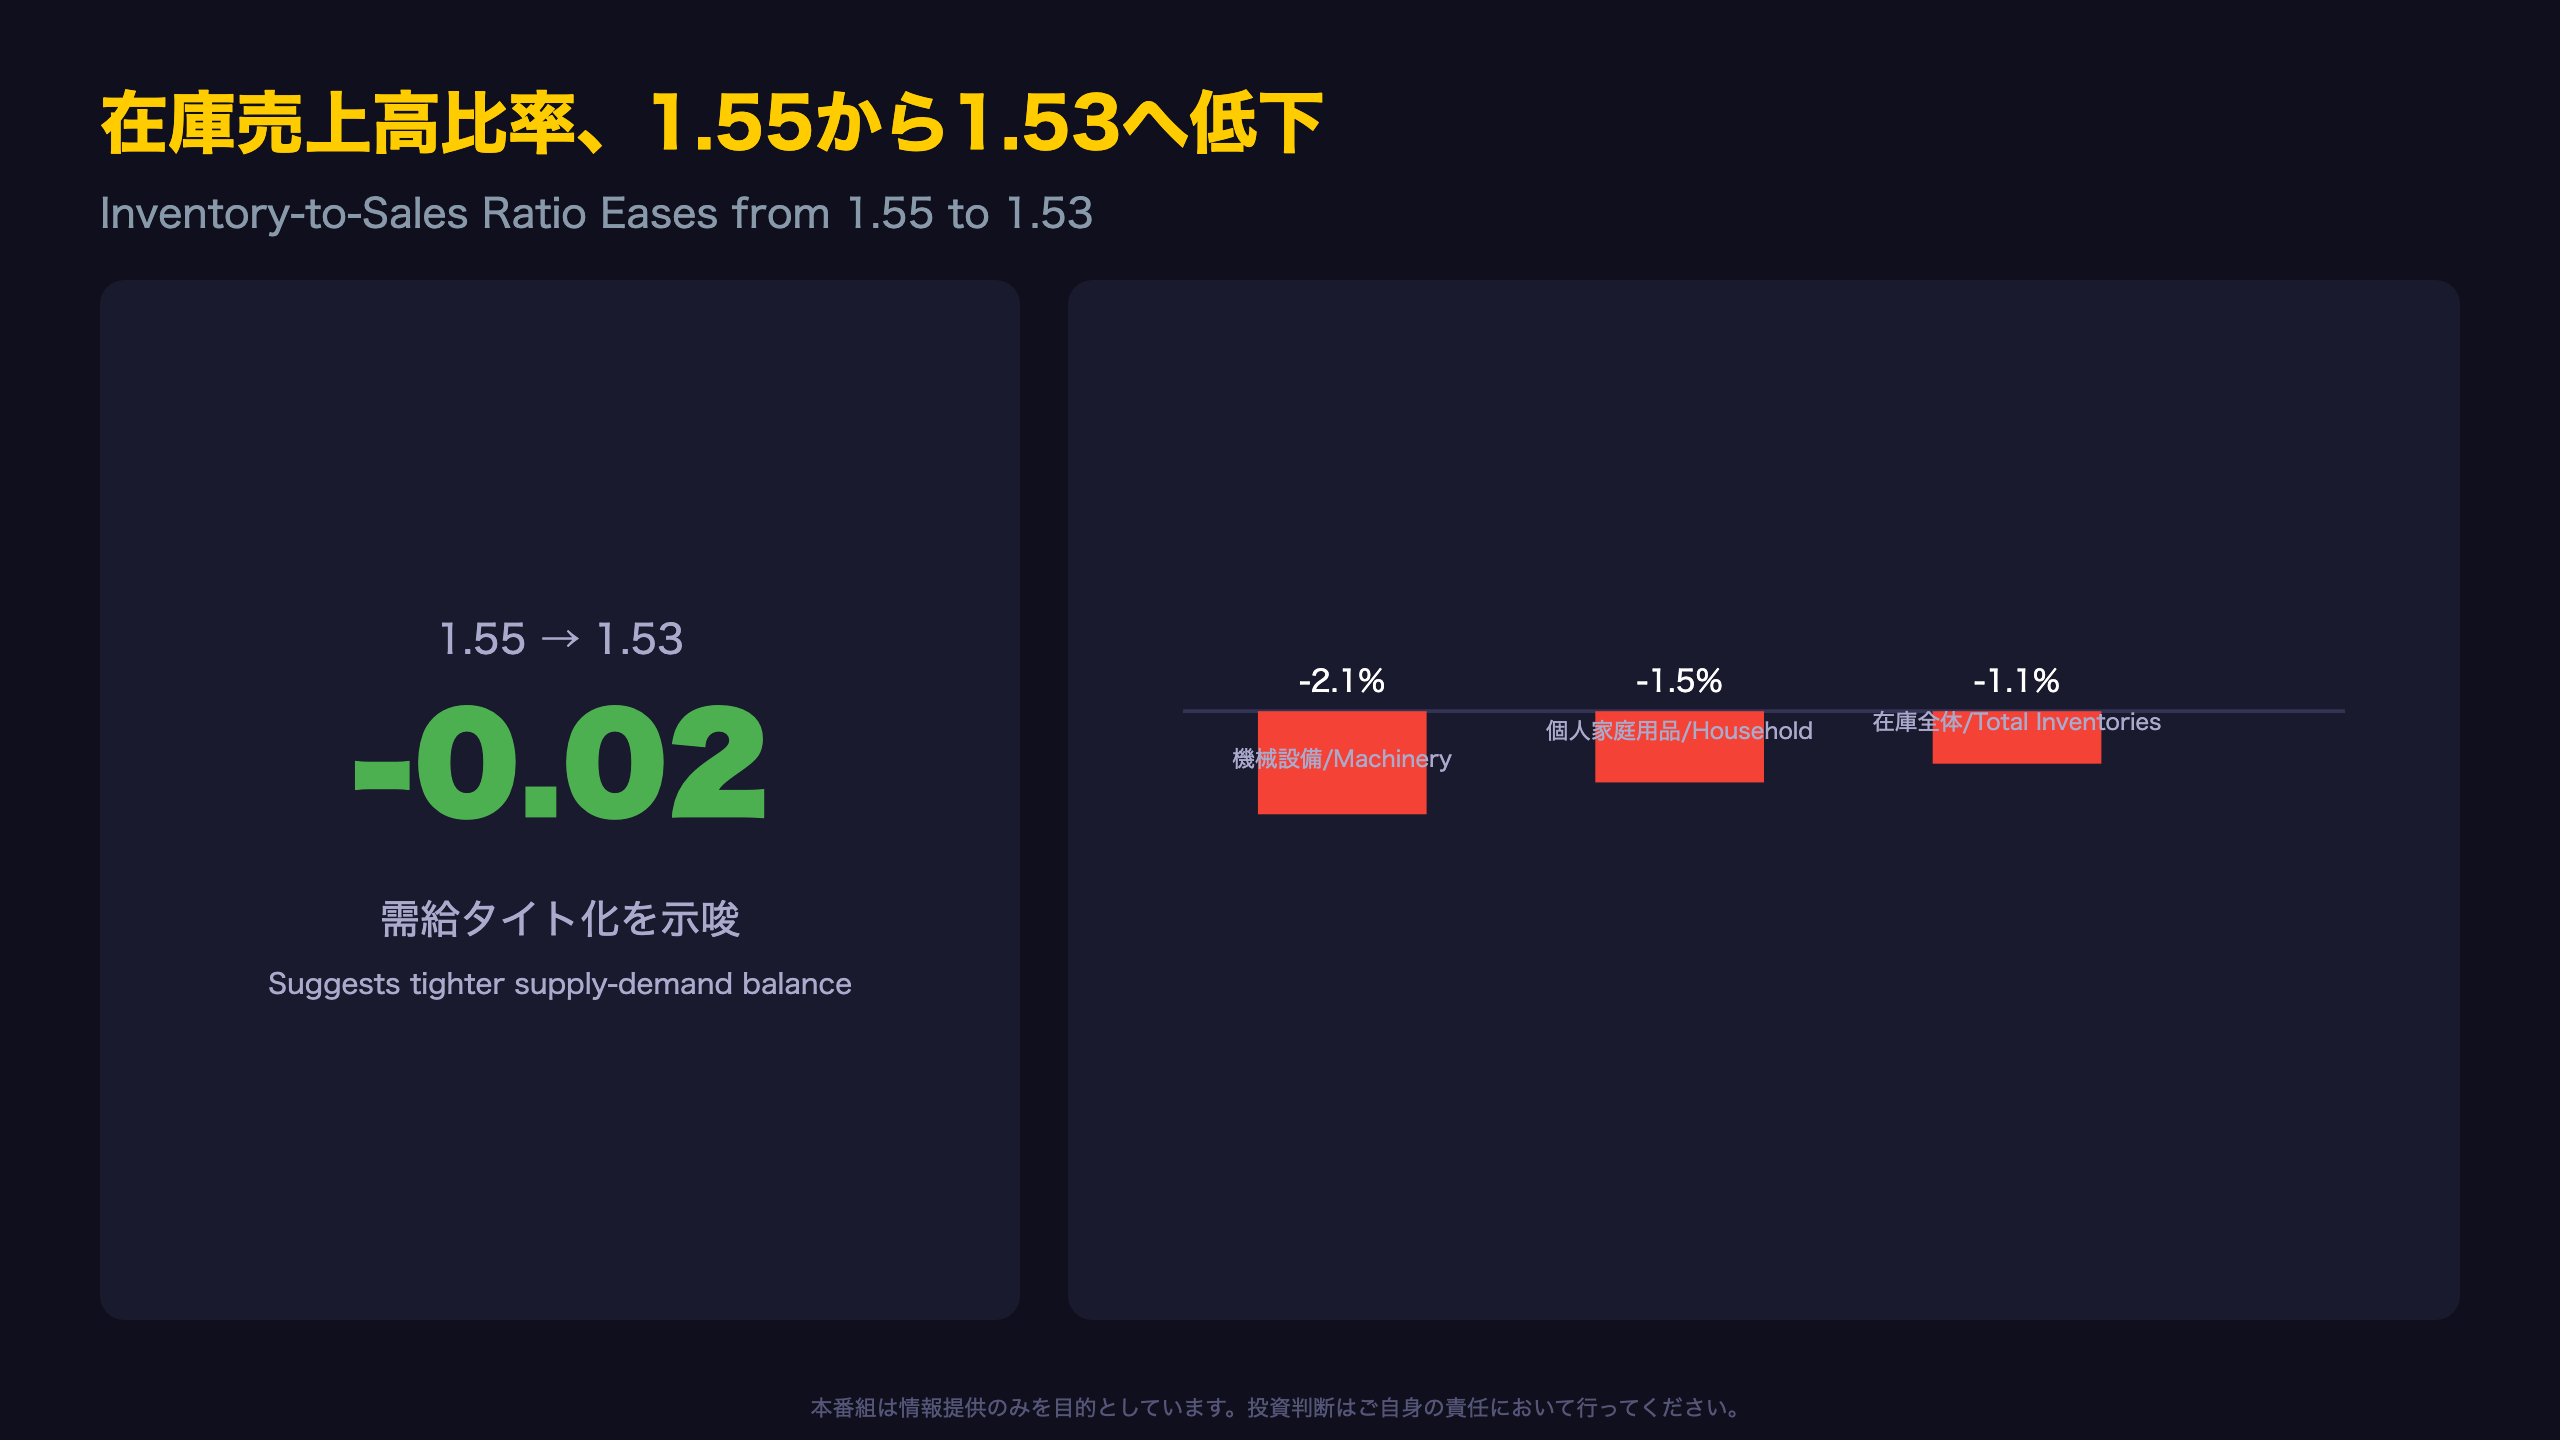
📦 The inventory-to-sales ratio eased from 1.55 to 1.53, hinting at improved supply-demand balance.
💡 We break down what this mixed data means for the Bank of Canada and CAD.
総売上高900億ドル、前月比-0.0%でほぼ横ばい
Flat Headline, Negative Real Volume: What’s Beneath Canada’s Wholesale Data
Statistics Canada’s Monthly Wholesale Trade Survey, covering all wholesale industries under NAICS (excluding petroleum products and oilseed/grain), reported total sales of CAD 90.0 billion in May 2026 — essentially flat at -0.0% month-over-month, following a +1.4% gain in April.
‘Wholesale sales were essentially unchanged (-0.0%), with sales sitting at $90.0 billion in May, after rising 1.4% in April.’ — Statistics Canada, The Daily
Nominal vs. Real: A Notable Divergence
While year-over-year sales grew a healthy +7.4%, the volume-adjusted (real) measure — which strips out price effects using chained 2012-dollar deflators — actually declined 0.2%. This divergence suggests price effects may be propping up the nominal headline while underlying transaction volumes softened, though a single month’s data cannot confirm a structural trend.
Context for International Readers
Unlike the U.S. Census Bureau’s Wholesale Trade Survey, Statistics Canada’s release includes both current-dollar and volume-deflated series, offering a built-in check against price-driven distortions — useful when assessing real economic momentum.
Four of seven subsectors, representing 68% of total sales, declined in May, signaling a broad-based but moderate softening rather than a sharp contraction. The next release (June data) arrives August 14, with an advance estimate on July 24 — a key checkpoint for confirming whether this flattening trend persists.
サブセクター別:食品・医薬品が減少、化学品が相殺
Pharma’s ‘Second Decline in Three Months’: A Closer Look
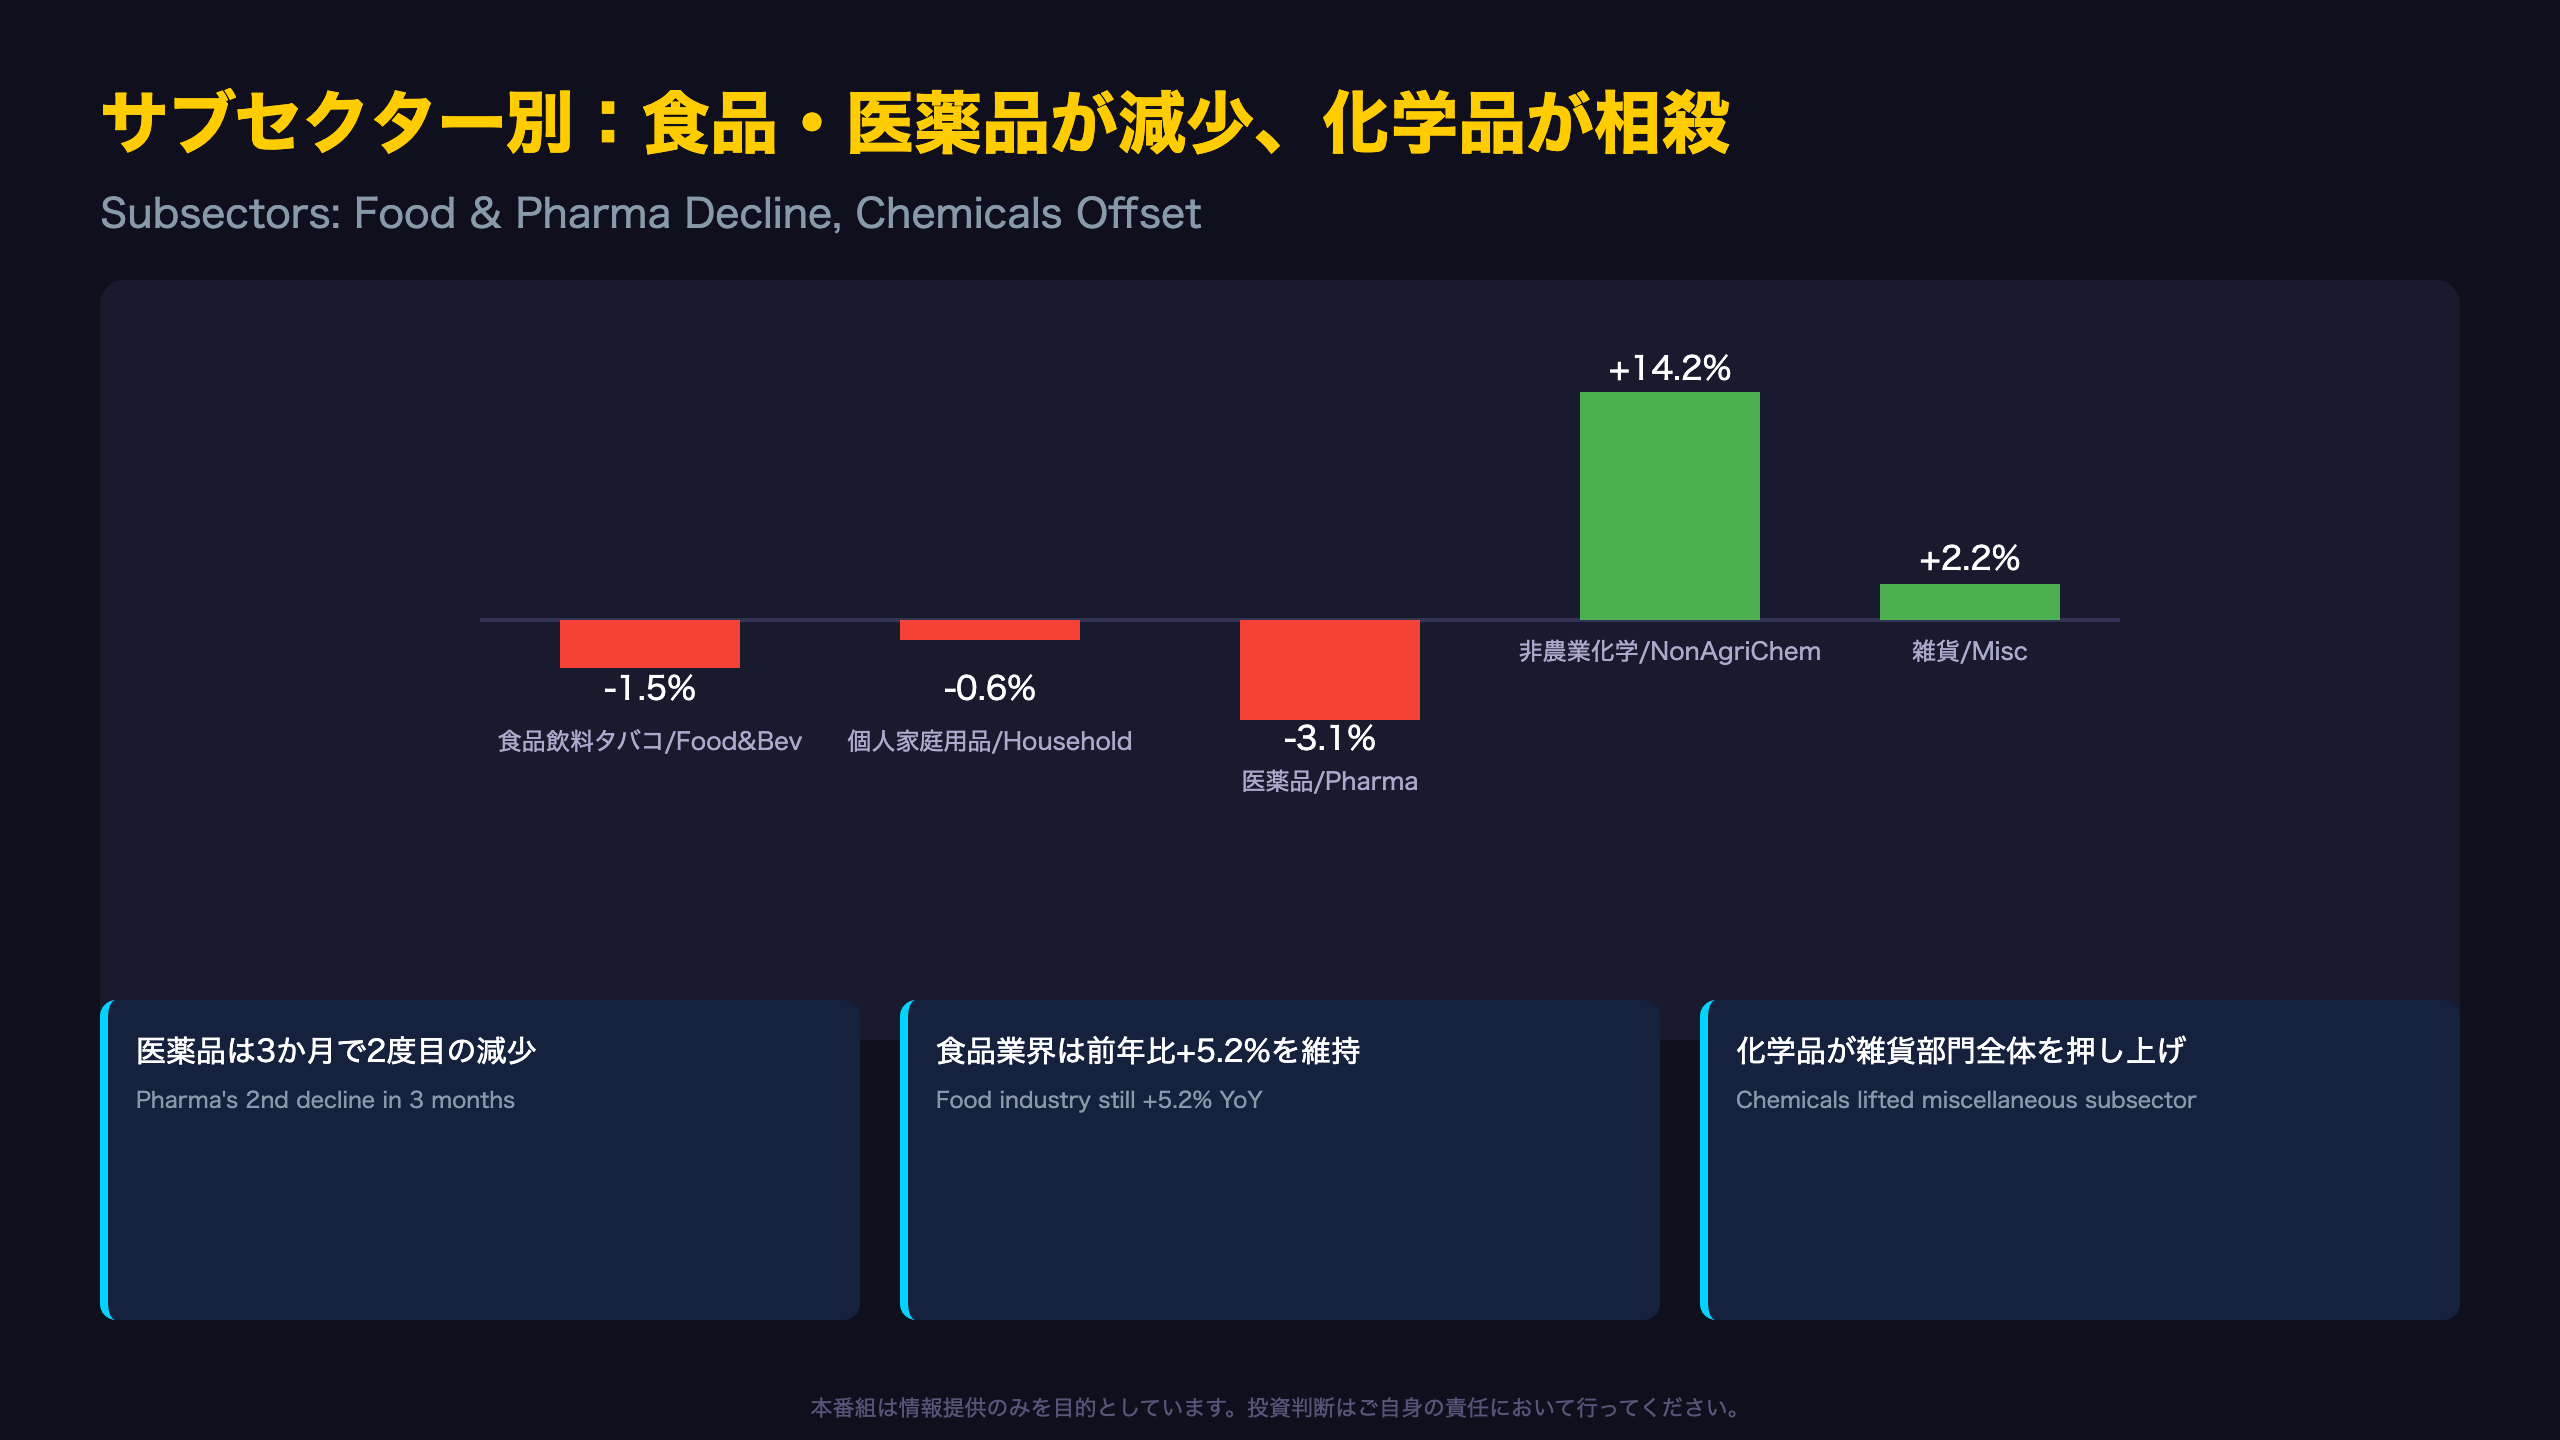
Within the personal and household goods subsector (-0.6% to CAD 13.1 billion), pharmaceuticals stood out with a -3.1% drop to CAD 7.5 billion — described by Statistics Canada as ‘its second decrease in three months.’ For investors accustomed to U.S. pharmaceutical wholesale data tracked by the Census Bureau’s MWTS, this pattern may reflect inventory rebalancing or ordering-cycle effects rather than a demand collapse, though a single data point cannot confirm the cause.
A Tale of Two Timeframes: Food
The food, beverage and tobacco subsector fell 1.5% month-over-month, yet the food industry group alone was up 5.2% year-over-year. This divergence between short-term monthly noise and the longer annual trend is a useful reminder that single-month declines don’t necessarily signal a change in the underlying demand trajectory.
The Chemical Offset
Non-agricultural chemical and allied products surged 14.2% to CAD 2.2 billion, lifting the broader miscellaneous subsector by 2.2% to CAD 11.9 billion. Since this category often reflects industrial and manufacturing input demand rather than consumer spending, its strength suggests upstream activity may be holding up even as downstream consumer categories cool — a nuance that matters for gauging the health of Canada’s broader supply chain.
With four of seven subsectors (68% of sales) in decline, May’s data shows a patchwork of sector-level divergence rather than a uniform slowdown.
州別動向:ケベック・BCが減少主導、資源州は堅調
Diverging Regional Fortunes Beneath a Flat National Headline
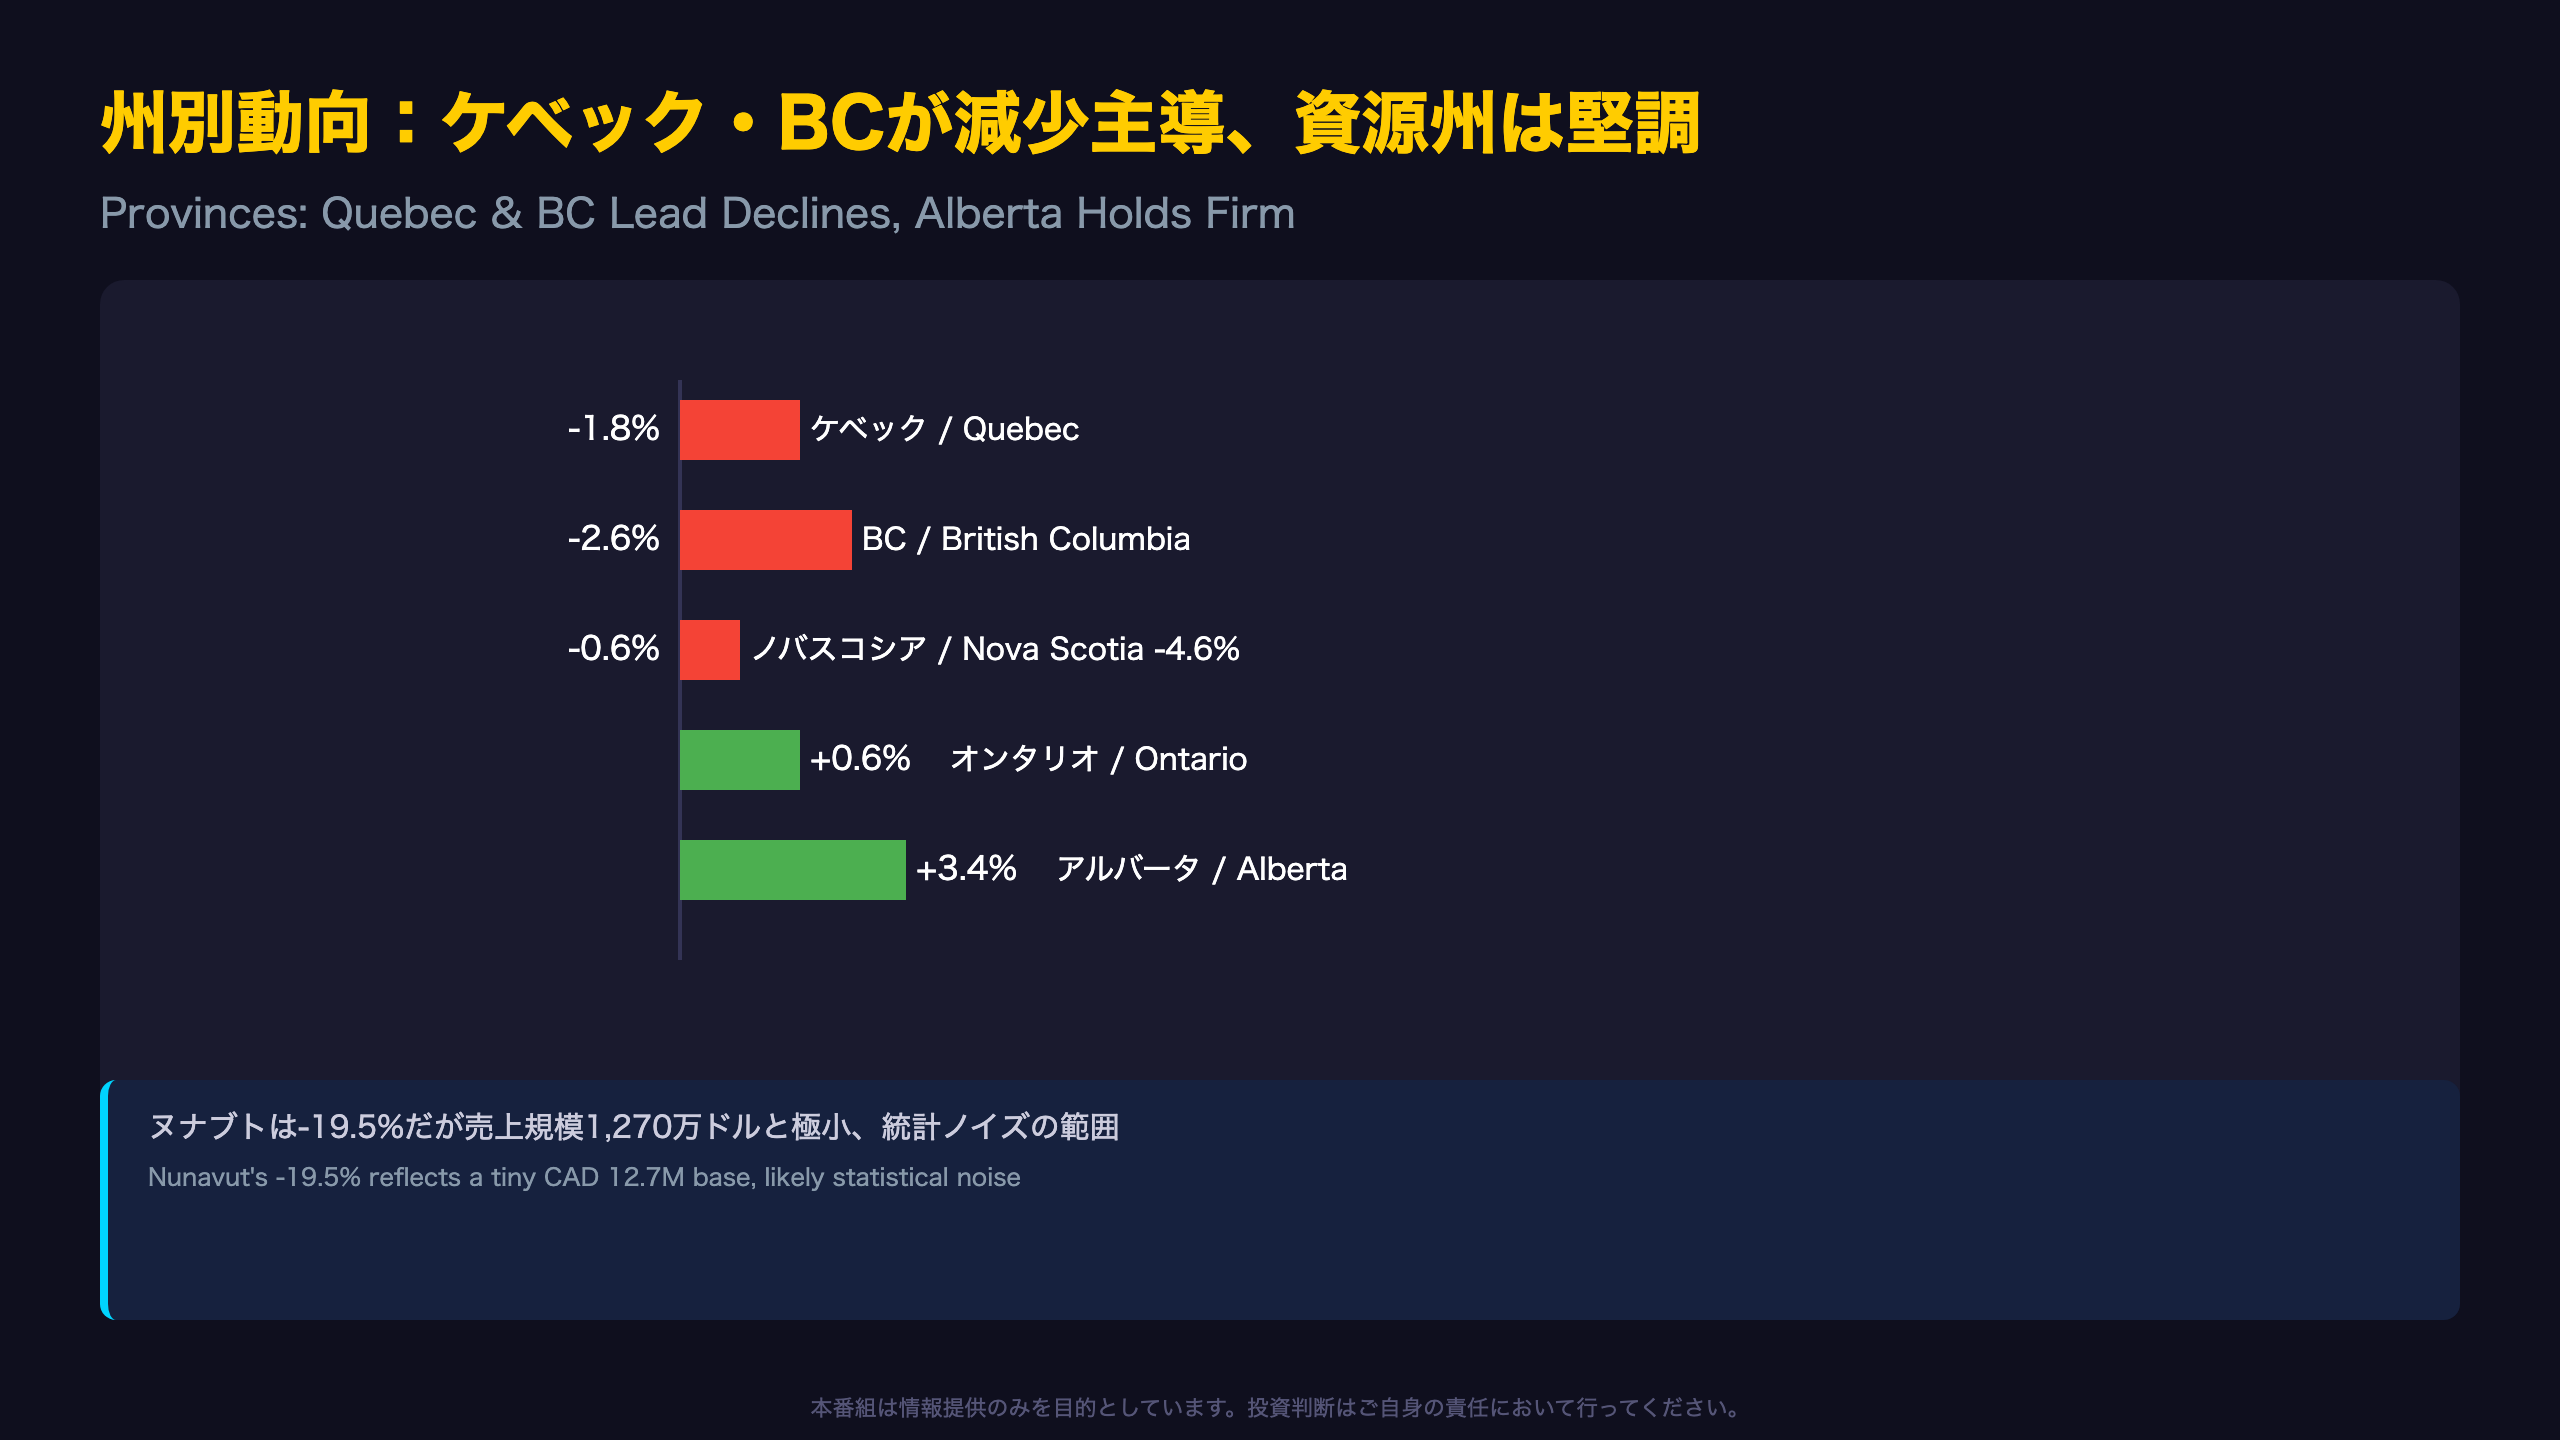
While Canada’s national wholesale sales were essentially flat, the provincial breakdown reveals significant divergence. Eight of ten provinces posted declines, while Alberta (+3.4%) and Ontario (+0.6%) — the country’s largest wholesale market — provided offsetting strength that kept the national figure from falling further.
Quebec’s Food-Led Decline
Quebec’s -1.8% drop to CAD 15.7 billion was driven primarily by a steep -6.7% decline in food, beverage and tobacco to CAD 3.3 billion, a much sharper drop than the national subsector average of -1.5%. The report does not specify a cause, so this should be read as a provincial data point rather than evidence of a broader national food-sector deterioration.
British Columbia’s Broad Weakness
British Columbia posted the second-largest provincial decline (-2.6% to CAD 8.2 billion), with six of seven subsectors weaker. Building materials and supplies fell -9.0% to CAD 1.9 billion, the steepest subsector decline nationwide, potentially reflecting a softer construction and housing market in the province, though this remains a single-month observation.
Resource Provinces Hold Up
Alberta’s +3.4% gain suggests resilient resource-linked demand, while Ontario, representing over half of national wholesale sales at CAD 47.2 billion, posted a modest +0.6% gain, providing crucial stability to the national aggregate.
Note: Nunavut’s -19.5% decline is statistically dramatic but reflects a tiny base (CAD 12.7 million) and should be treated as noise rather than a meaningful signal.
For US/UK readers: Canada’s provincial wholesale breakdown offers a regional granularity not typically seen in the U.S. Census Bureau’s national-only release, making it a useful proxy for regional divergence between resource-heavy West and consumer-heavy Central Canada.
在庫売上高比率、1.55から1.53へ低下
The Inventory-to-Sales Ratio: A Key Leading Indicator
The inventory-to-sales ratio, closely watched by supply-chain analysts and monetary policymakers alike, measures how many months it would take to deplete current inventories at the prevailing sales pace. In May, this ratio declined from 1.55 to 1.53 months.
‘The inventory-to-sales ratio decreased from 1.55 to 1.53 in May. This ratio measures the time in months required to exhaust inventories if sales remain at current levels.’ — Statistics Canada
What Drove the Decline
Total wholesale inventories fell -1.1% to CAD 137.7 billion, with five of seven subsectors posting declines. Machinery, equipment and supplies led with a -2.1% drop to CAD 40.7 billion, followed by personal and household goods at -1.5% to CAD 23.1 billion.
Two Ways to Read This
A falling inventory-to-sales ratio is typically read as a positive sign, inventories tightening relative to demand, which can support future production and restocking orders. However, in this case, sales themselves were essentially flat (-0.0%), meaning the ratio declined primarily because inventories fell faster than sales, not because sales accelerated. This nuance matters: it could reflect either healthy demand absorption or a deliberate inventory drawdown by wholesalers responding to softer expectations. The data alone cannot distinguish between these two scenarios.
Looking Ahead
For context, U.S. wholesale inventory-to-sales ratios, tracked by the Census Bureau, serve a similar function in gauging supply-chain slack, useful for cross-border comparison. Canada’s next wholesale trade release (June data) arrives August 14, with an advance estimate on July 24.
インプリケーション:BoCとCADへの示唆
Policy and Market Implications
The Bank of Canada’s Perspective
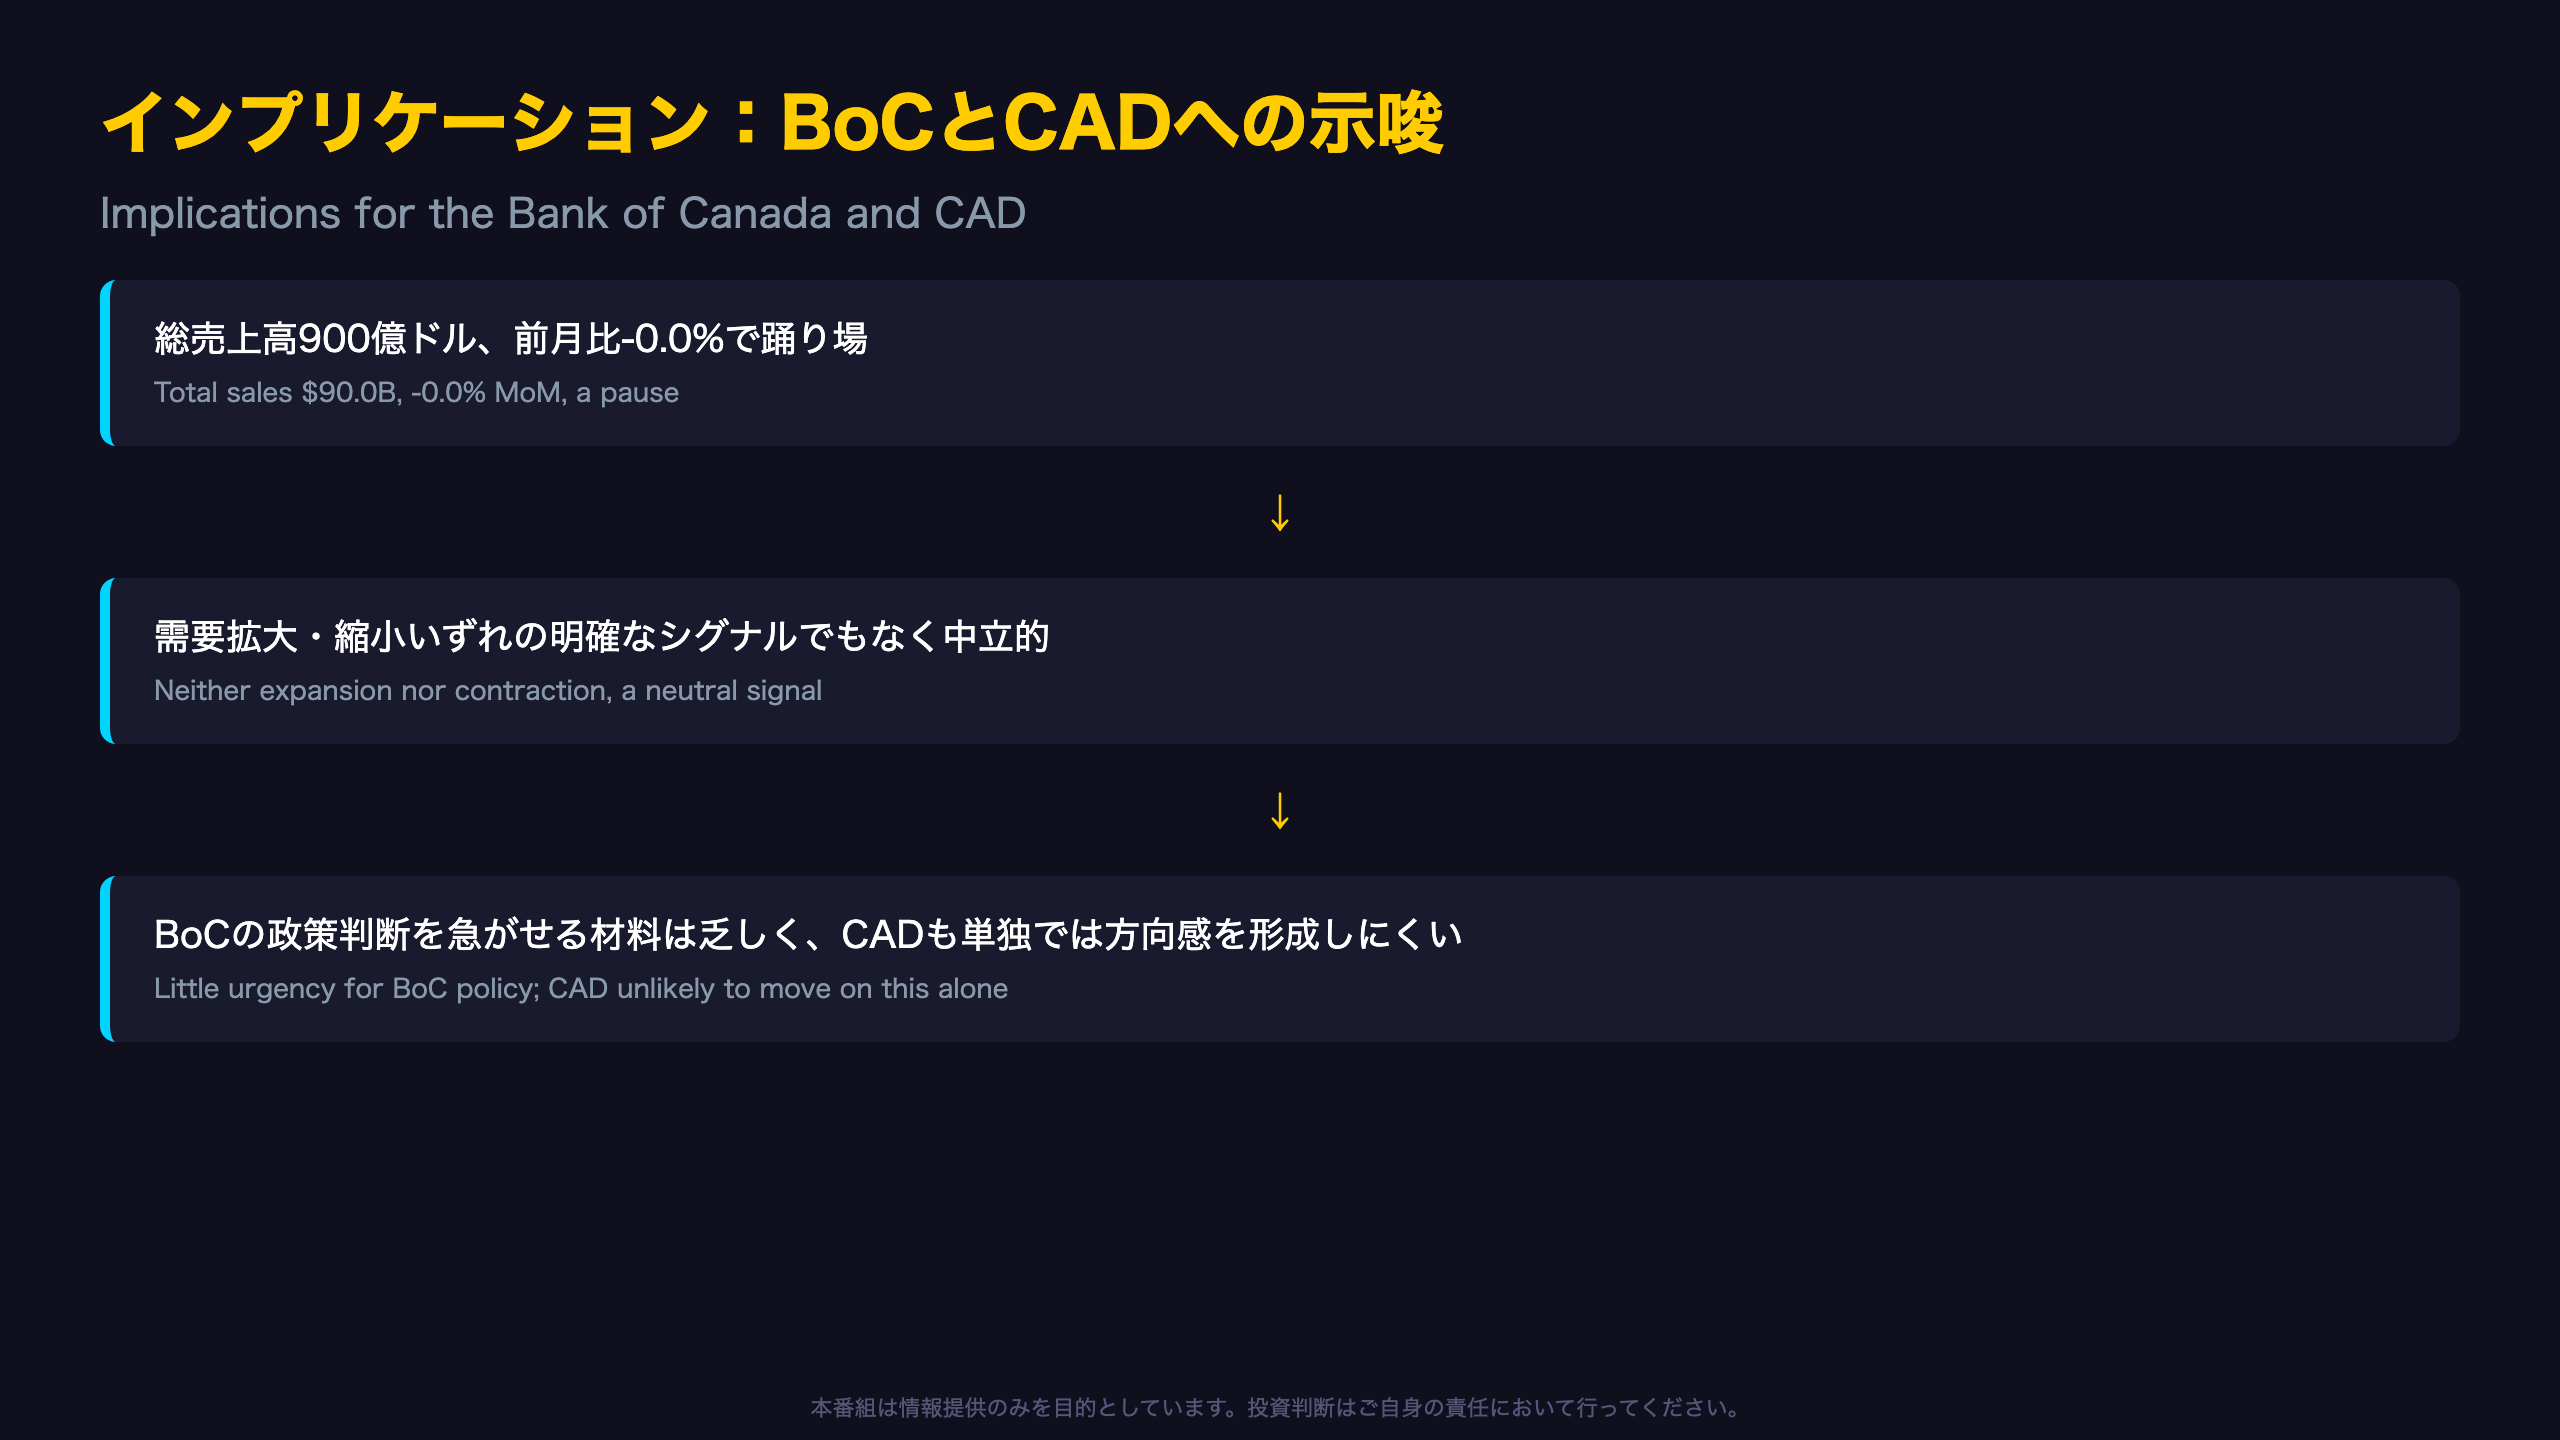
This release is unlikely to be a major input into near-term policy decisions. Total sales were essentially flat (-0.0% MoM), a neutral outcome that signals neither overheating nor a sharp slowdown. However, the -0.2% decline in volume-adjusted (real) sales, contrasted with flat nominal sales, hints that price effects may be cushioning the headline figure, a nuance the Bank of Canada’s inflation-focused Governing Council may note, though a single month cannot establish a trend.
The Inventory Cycle Angle
The inventory-to-sales ratio’s decline from 1.55 to 1.53 months suggests a modest improvement in supply-demand balance across the wholesale channel. Generally, a falling ratio is viewed as supportive of future ordering and production activity, but this single data point cannot confirm whether this is the start of a sustained trend or a temporary adjustment.
Implications for the Canadian Dollar (CAD)
Wholesale trade data typically carries less market-moving weight for CAD than headline releases like GDP, employment, or CPI. A ‘roughly flat’ result like this one is unlikely to be a standalone directional catalyst for the currency. It is generally understood that larger-than-expected surprises in economic data tend to increase currency volatility, but this specific release does not provide grounds for a directional call on CAD.
What’s Next
The advance estimate for June wholesale trade arrives July 24, with the full release following on August 14. The key question going forward is whether May’s pause proves temporary or whether the real-volume softness becomes a more persistent theme. For context, this report can be compared with the U.S. Census Bureau’s Monthly Wholesale Trade Survey, which serves a similar bridge function between manufacturing output and retail-level demand.
Disclaimer: This article is for informational purposes only. All investment decisions are made solely at your own risk.