
📺 Watch the Full Video Analysis
This article was automatically generated by the NFC Market Live AI analysis system. (Updated: 2026-07-12 16:39 JST)
📄 Primary Source
米国労働省(DOL)— 新規失業保険申請件数
https://www.dol.gov/newsroom/releases/eta/eta20260709
米国エネルギー情報局(EIA)— 週間石油状況レポート
https://www.eia.gov/petroleum/supply/weekly/pdf/highlights.pdf
連邦準備制度理事会(FRB)— H.4.1 バランスシート
https://www.federalreserve.gov/releases/h41/current/h41.htm
📊 A deep dive into this week’s three key U.S. macro releases.
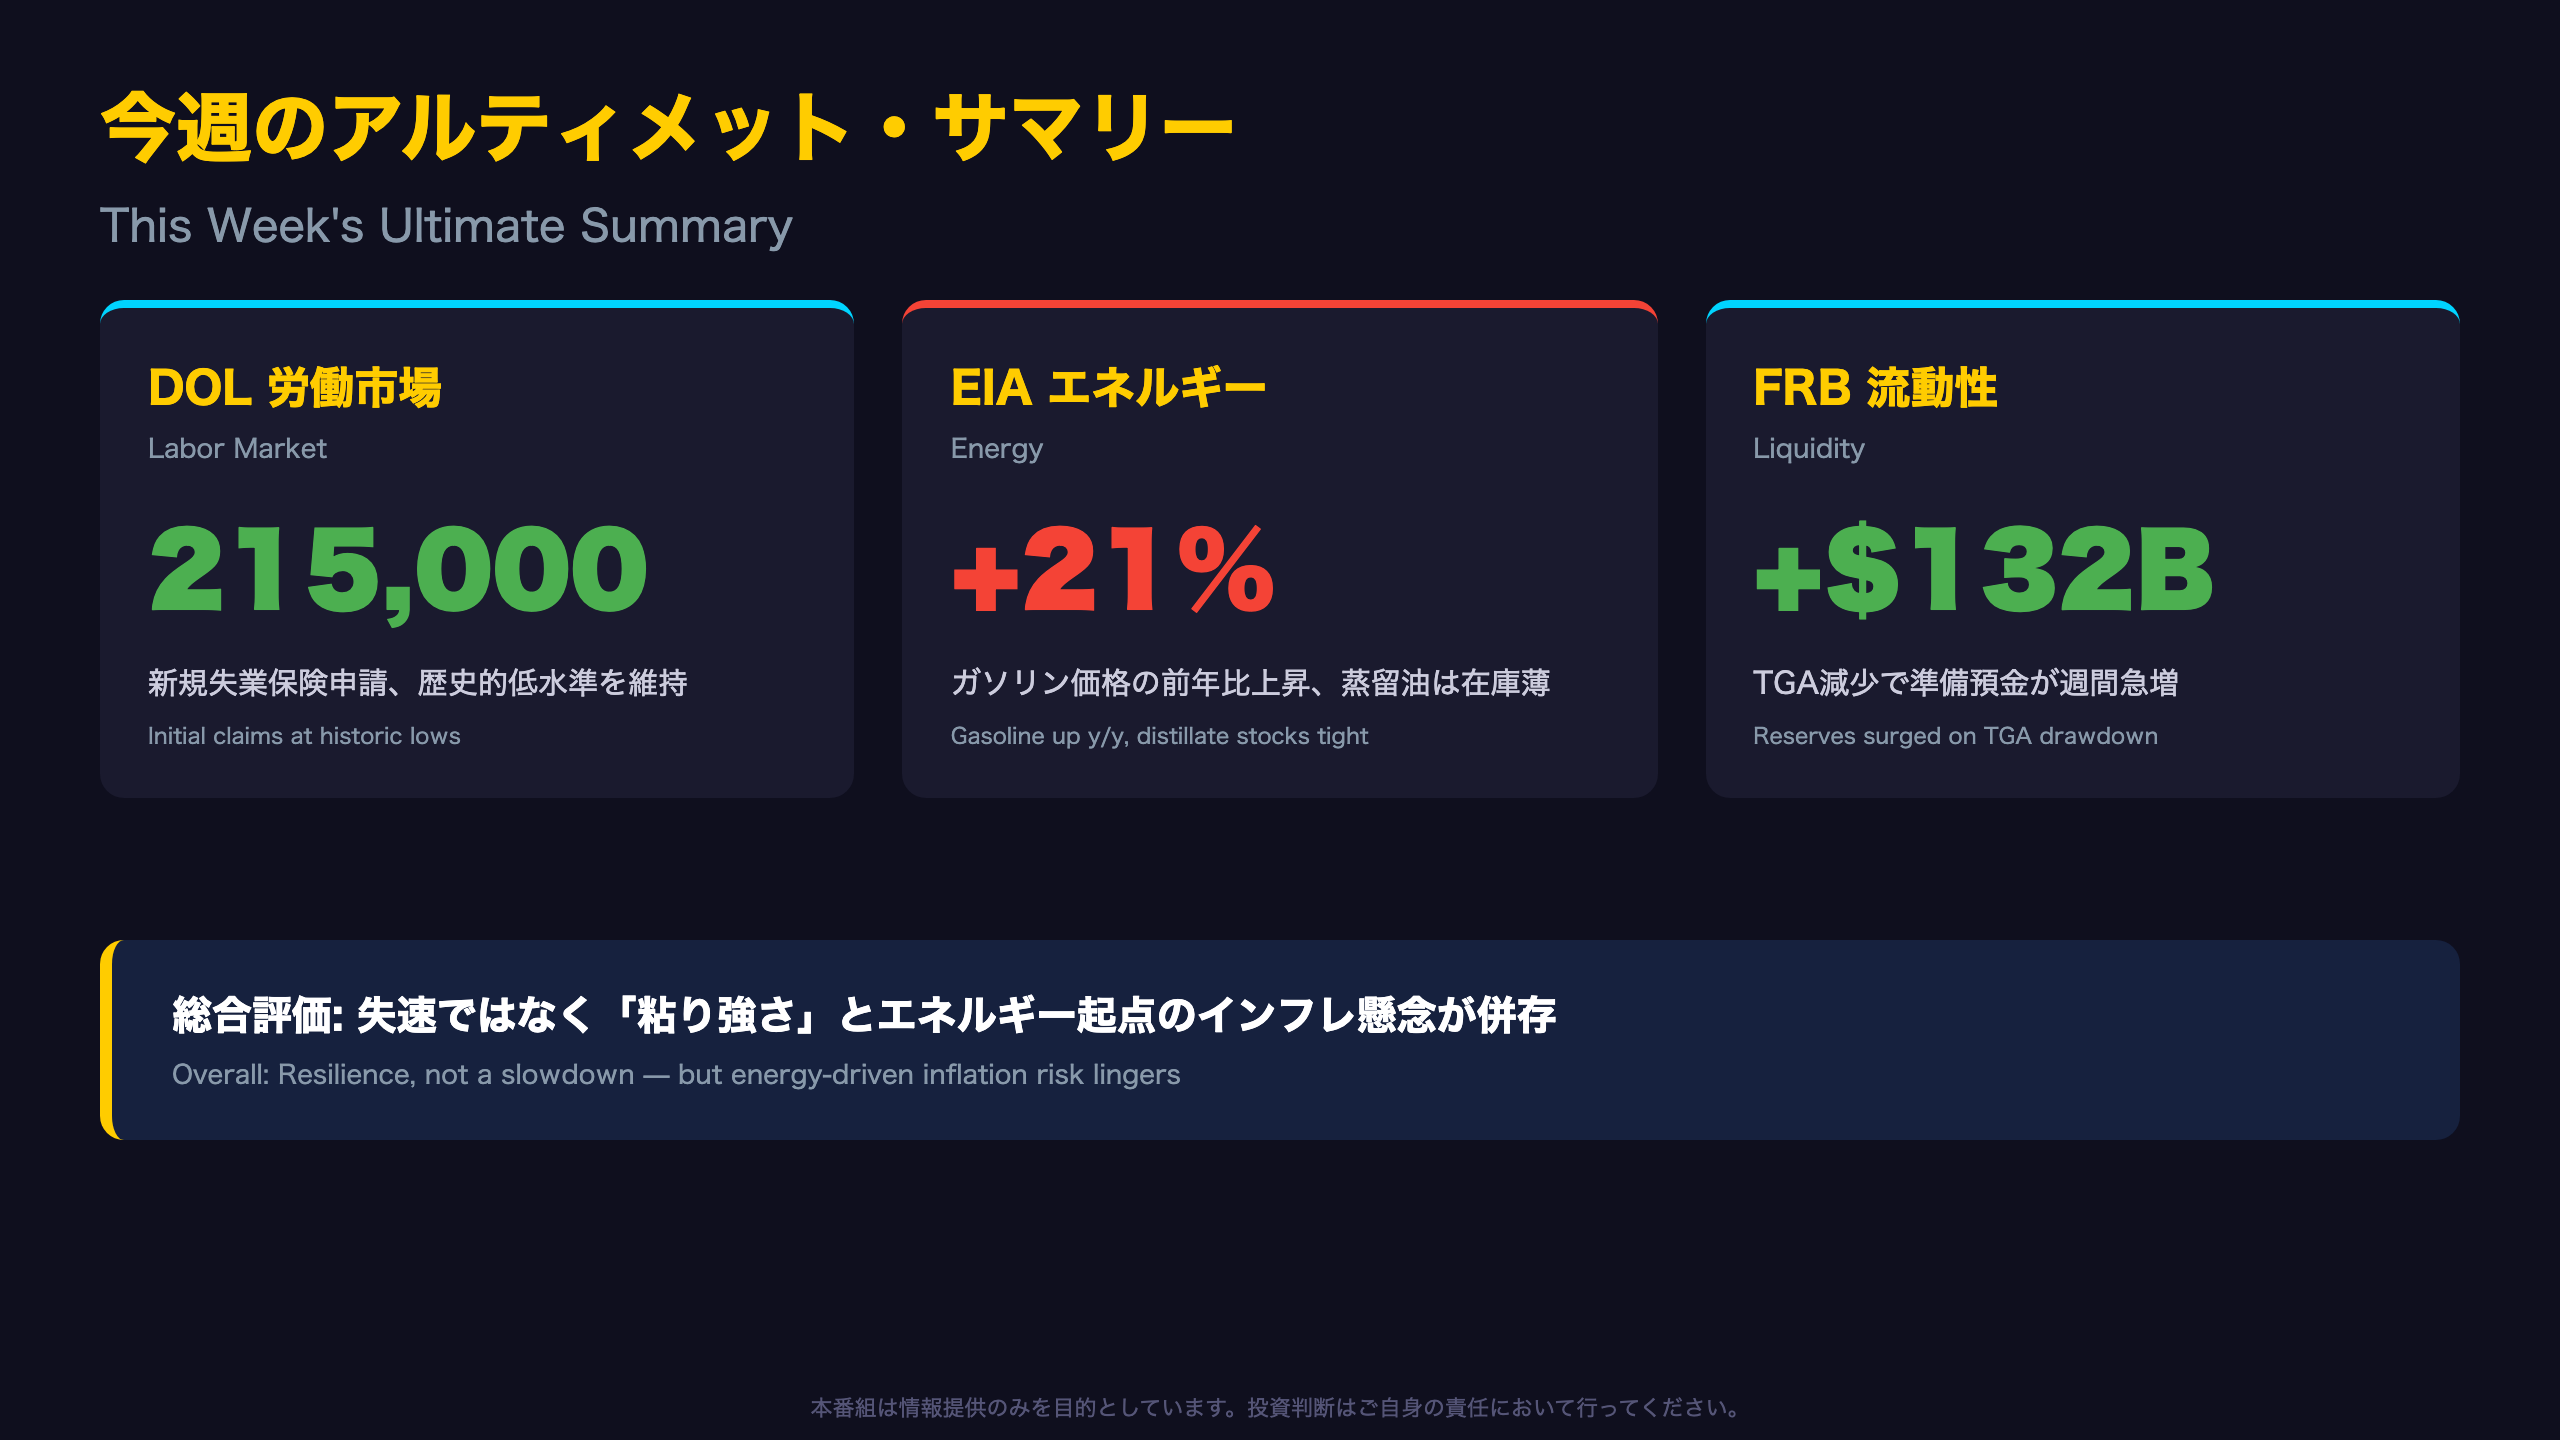
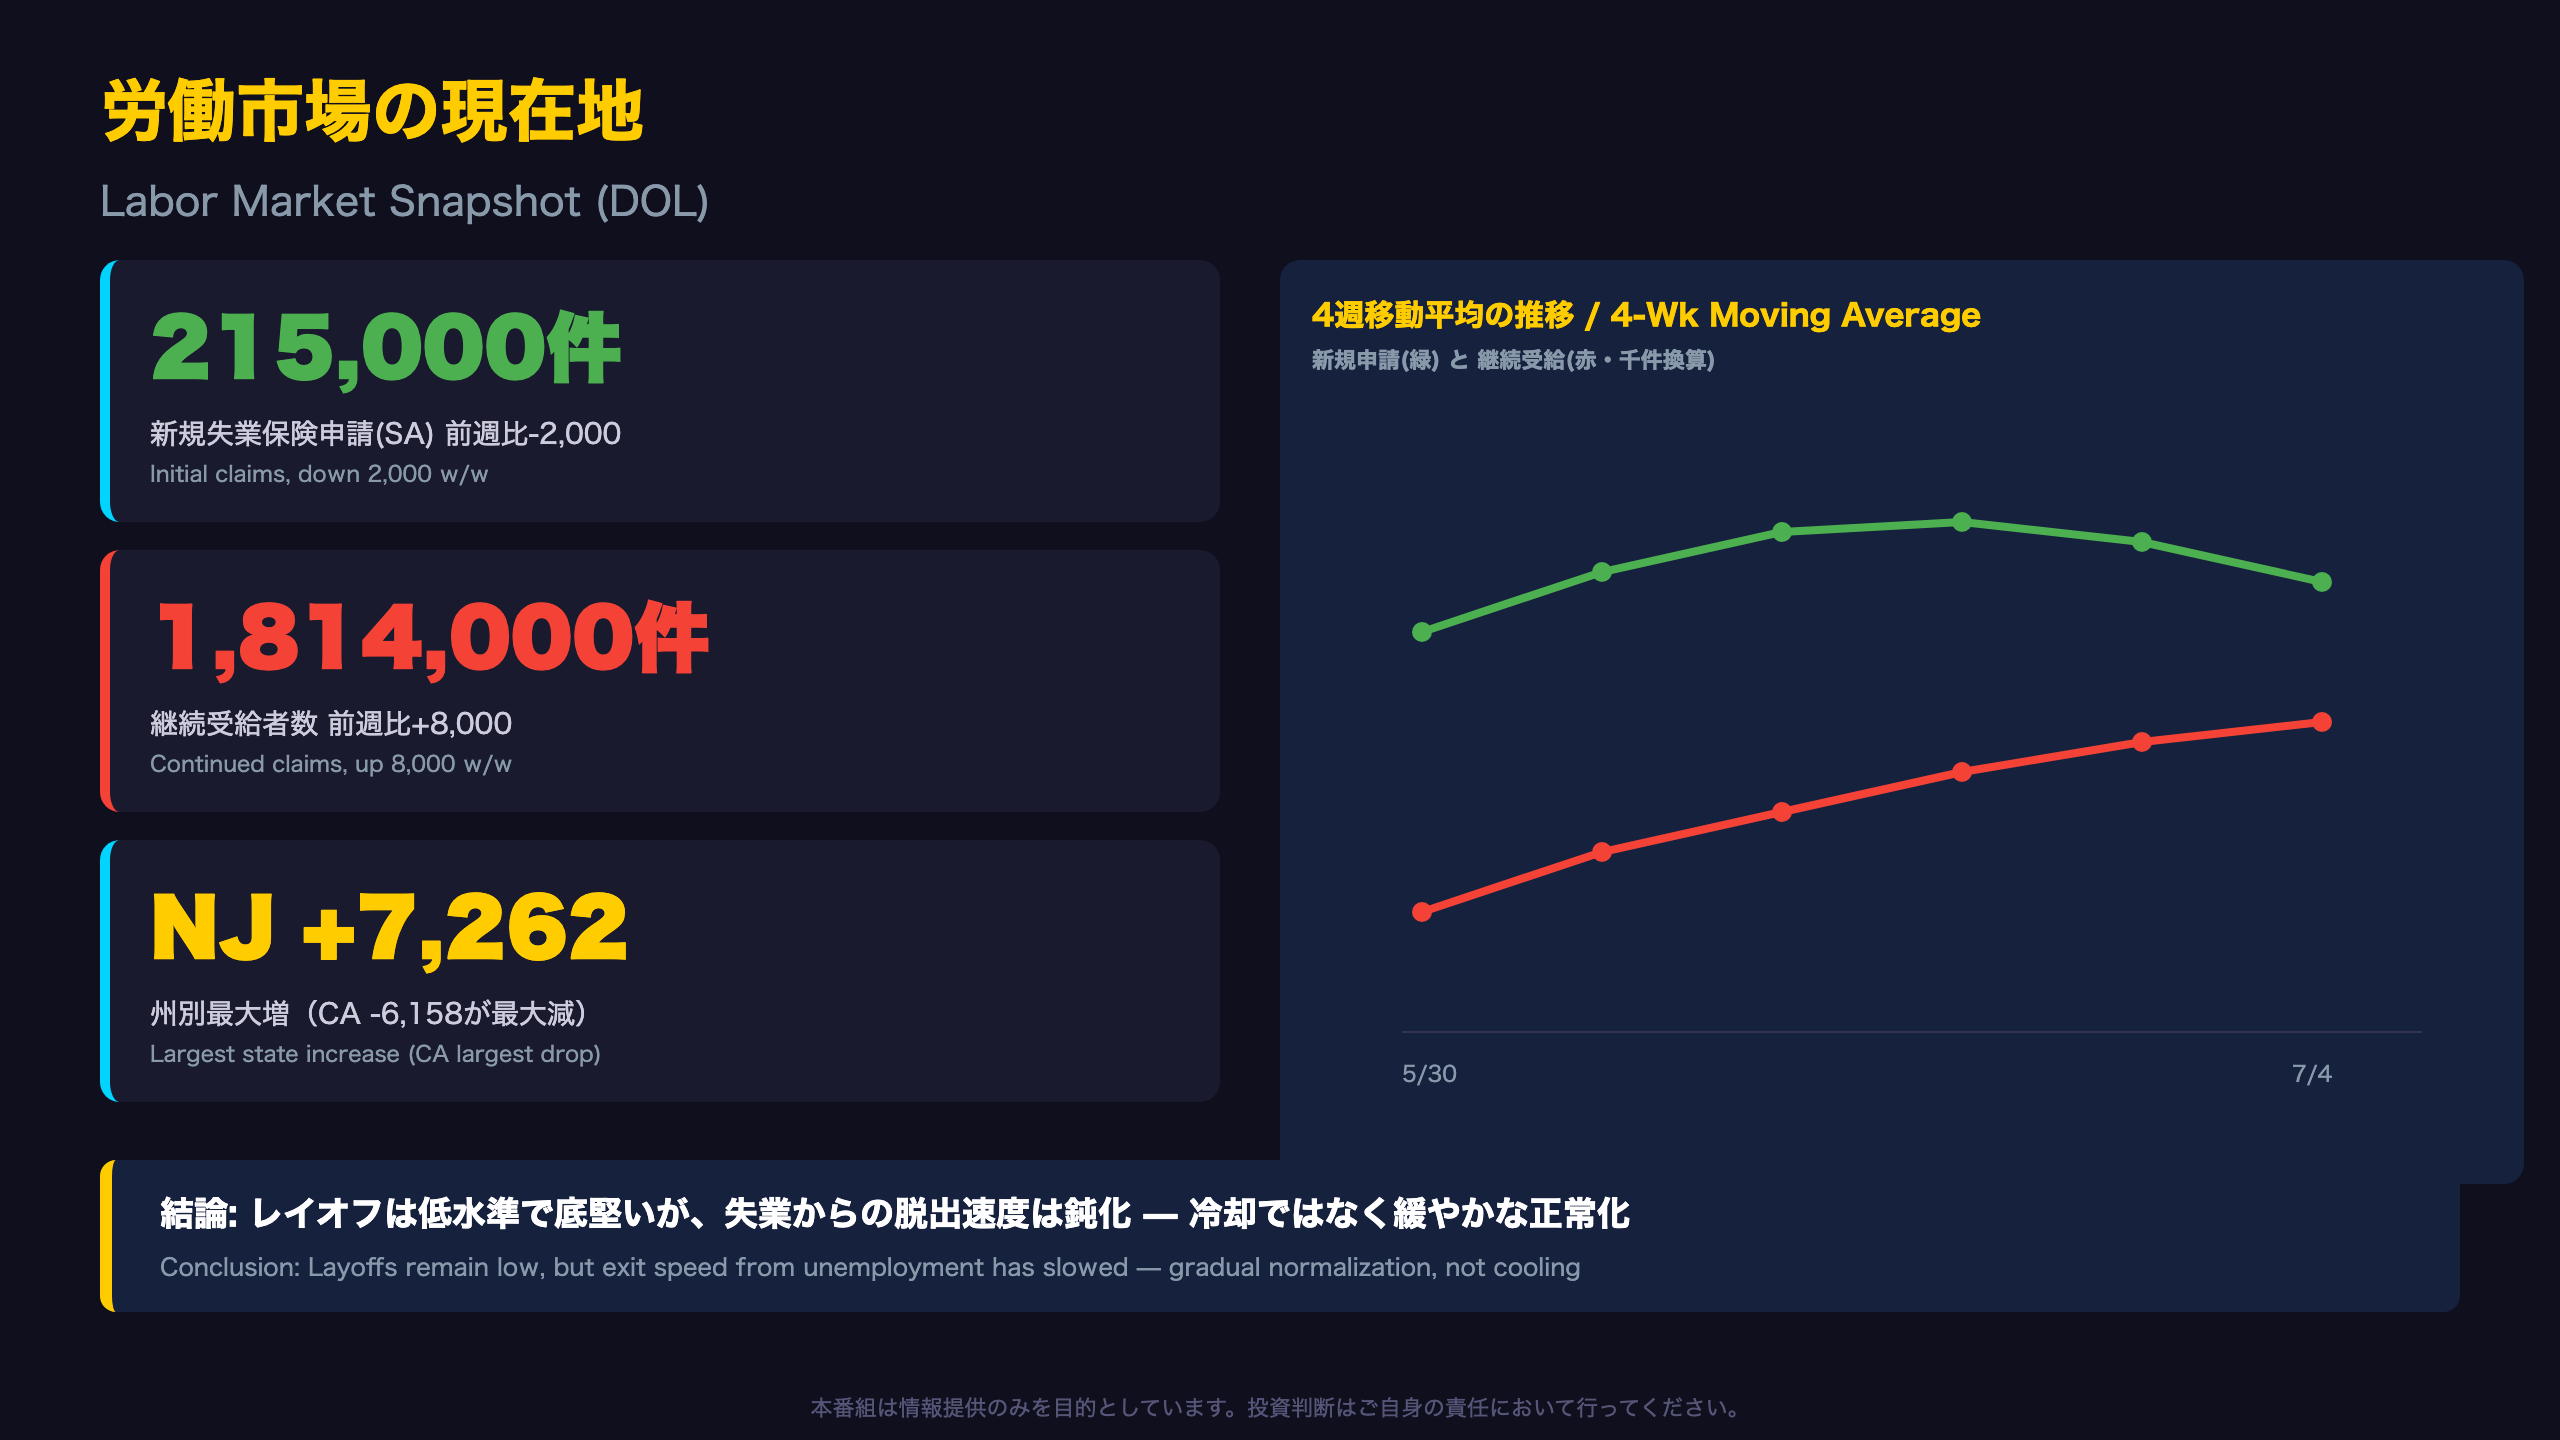
Initial jobless claims held at a historically low 215,000, underscoring labor market resilience, even as continued claims drifted modestly higher. 💼
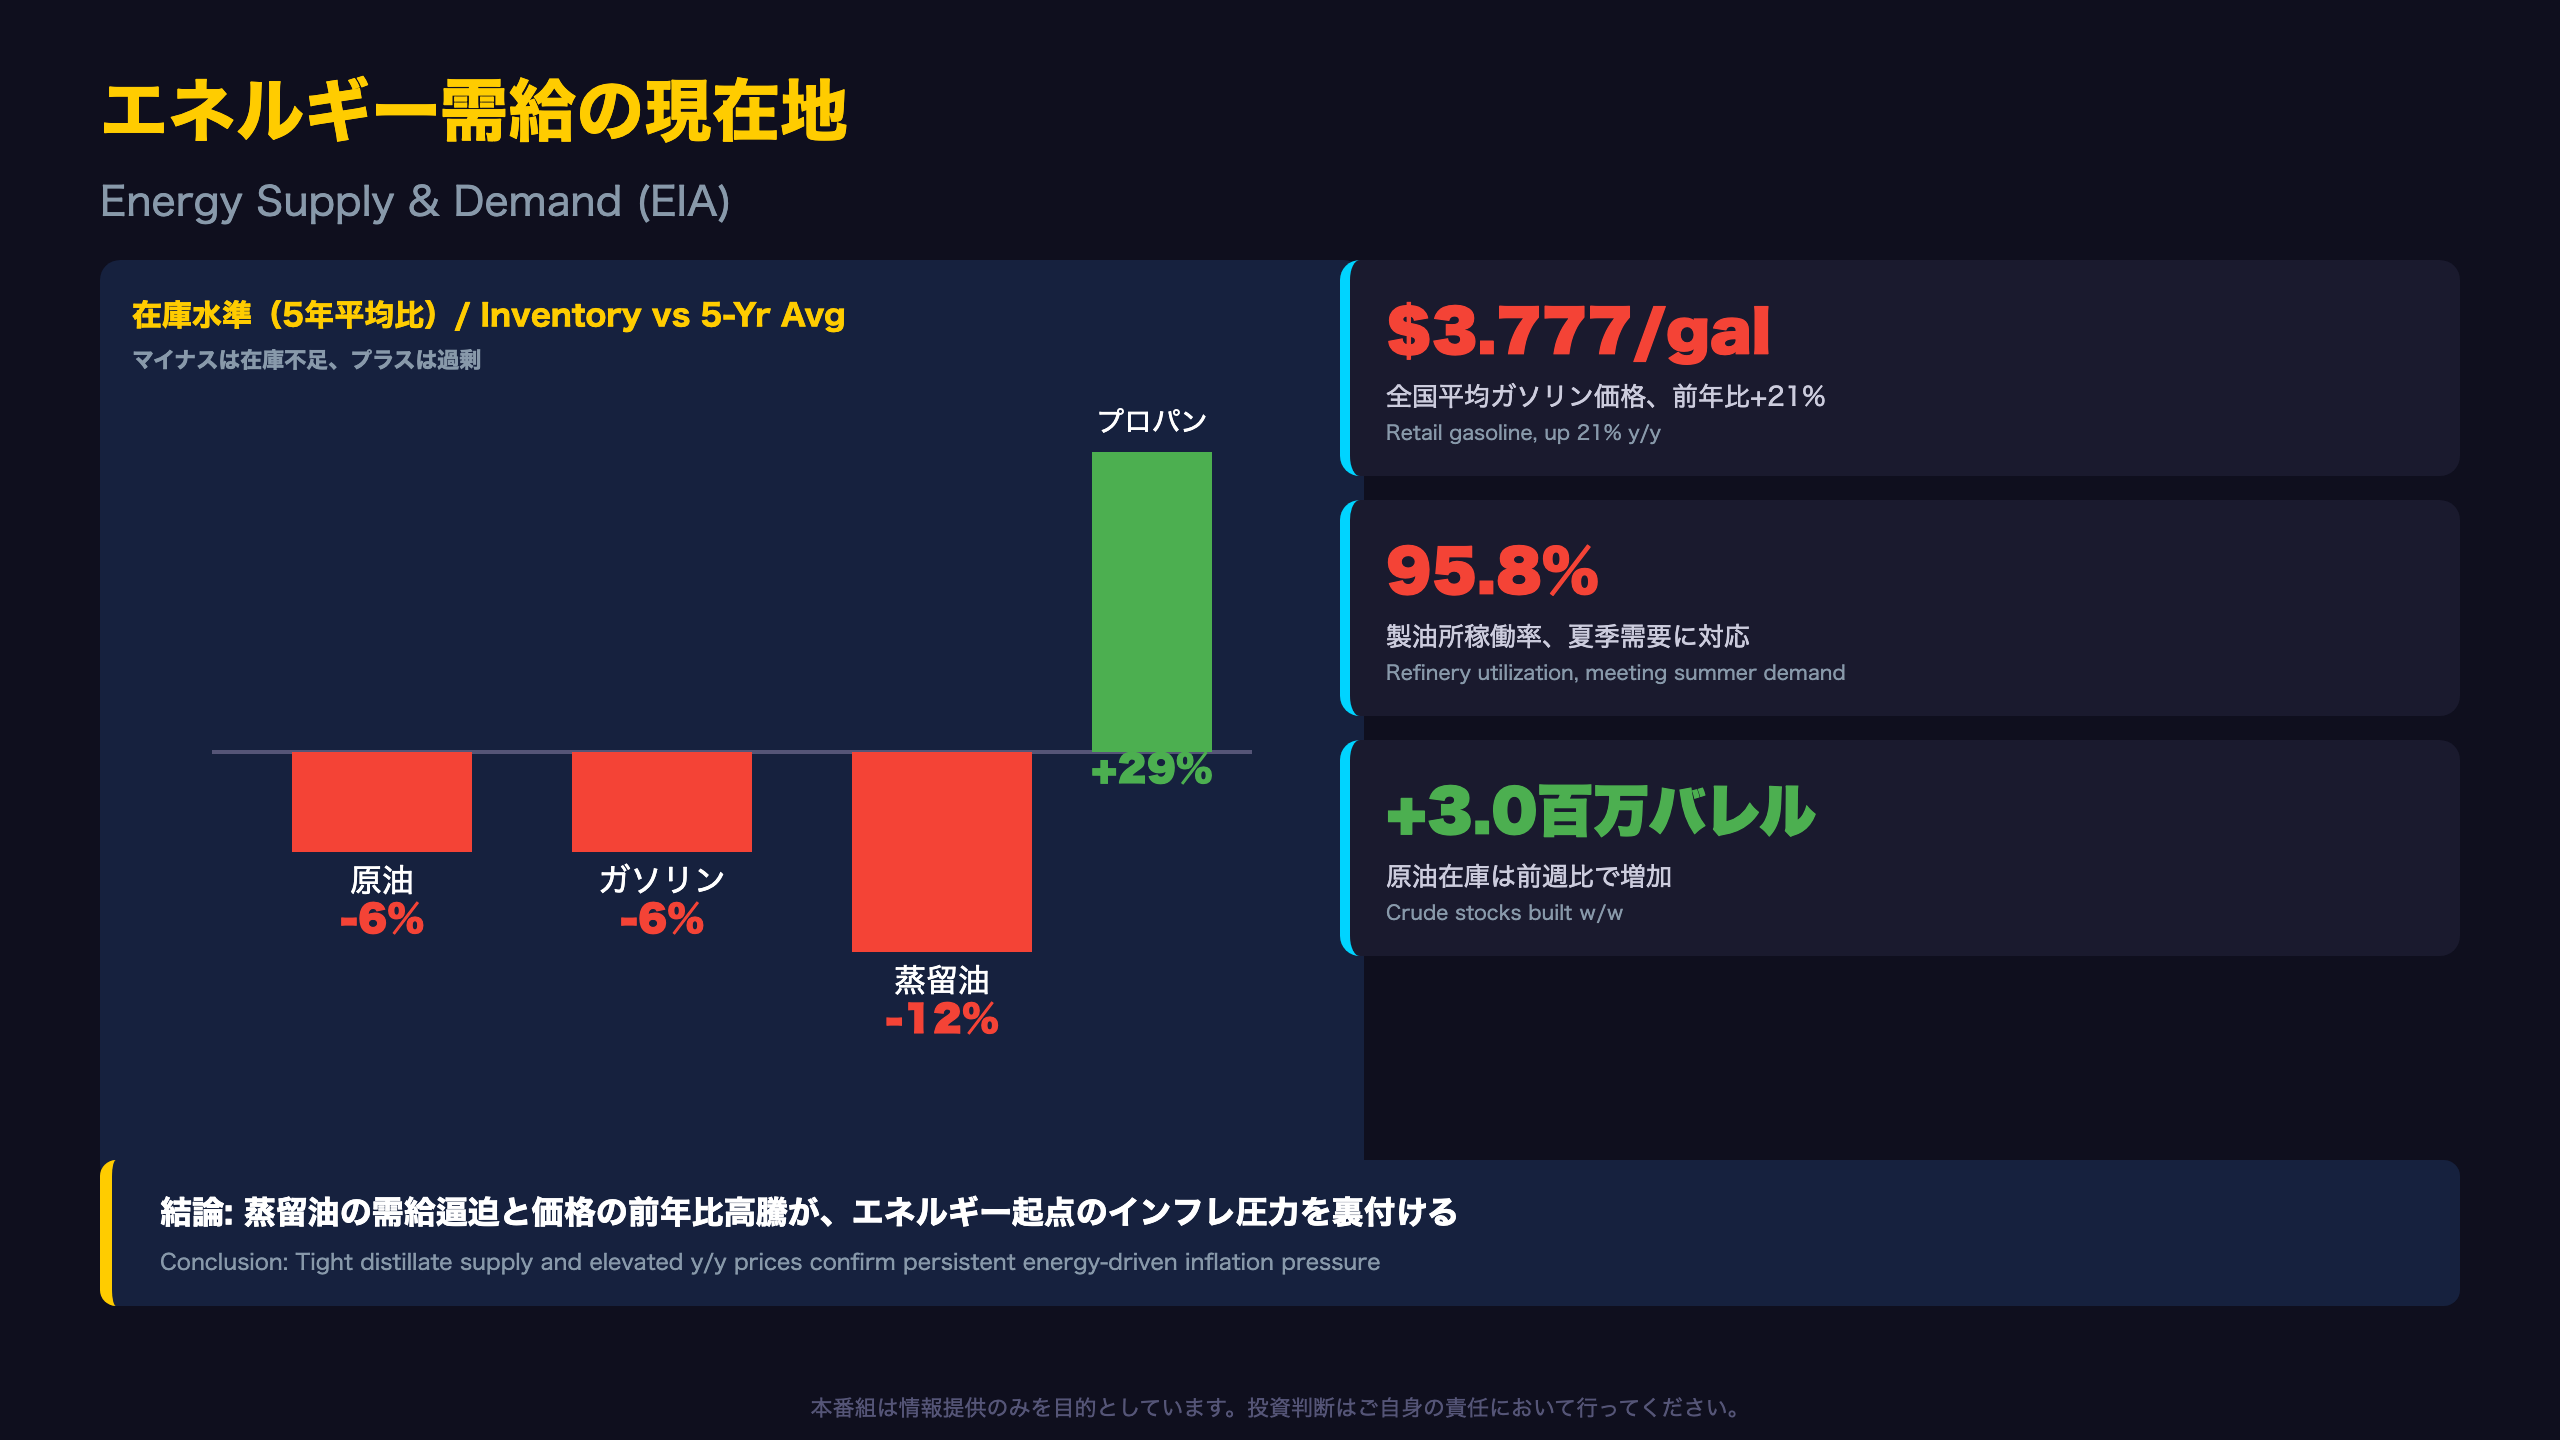
Gasoline prices are up 21% year-over-year and distillate inventories sit 12% below their five-year average, keeping energy-driven inflation pressure alive. ⛽
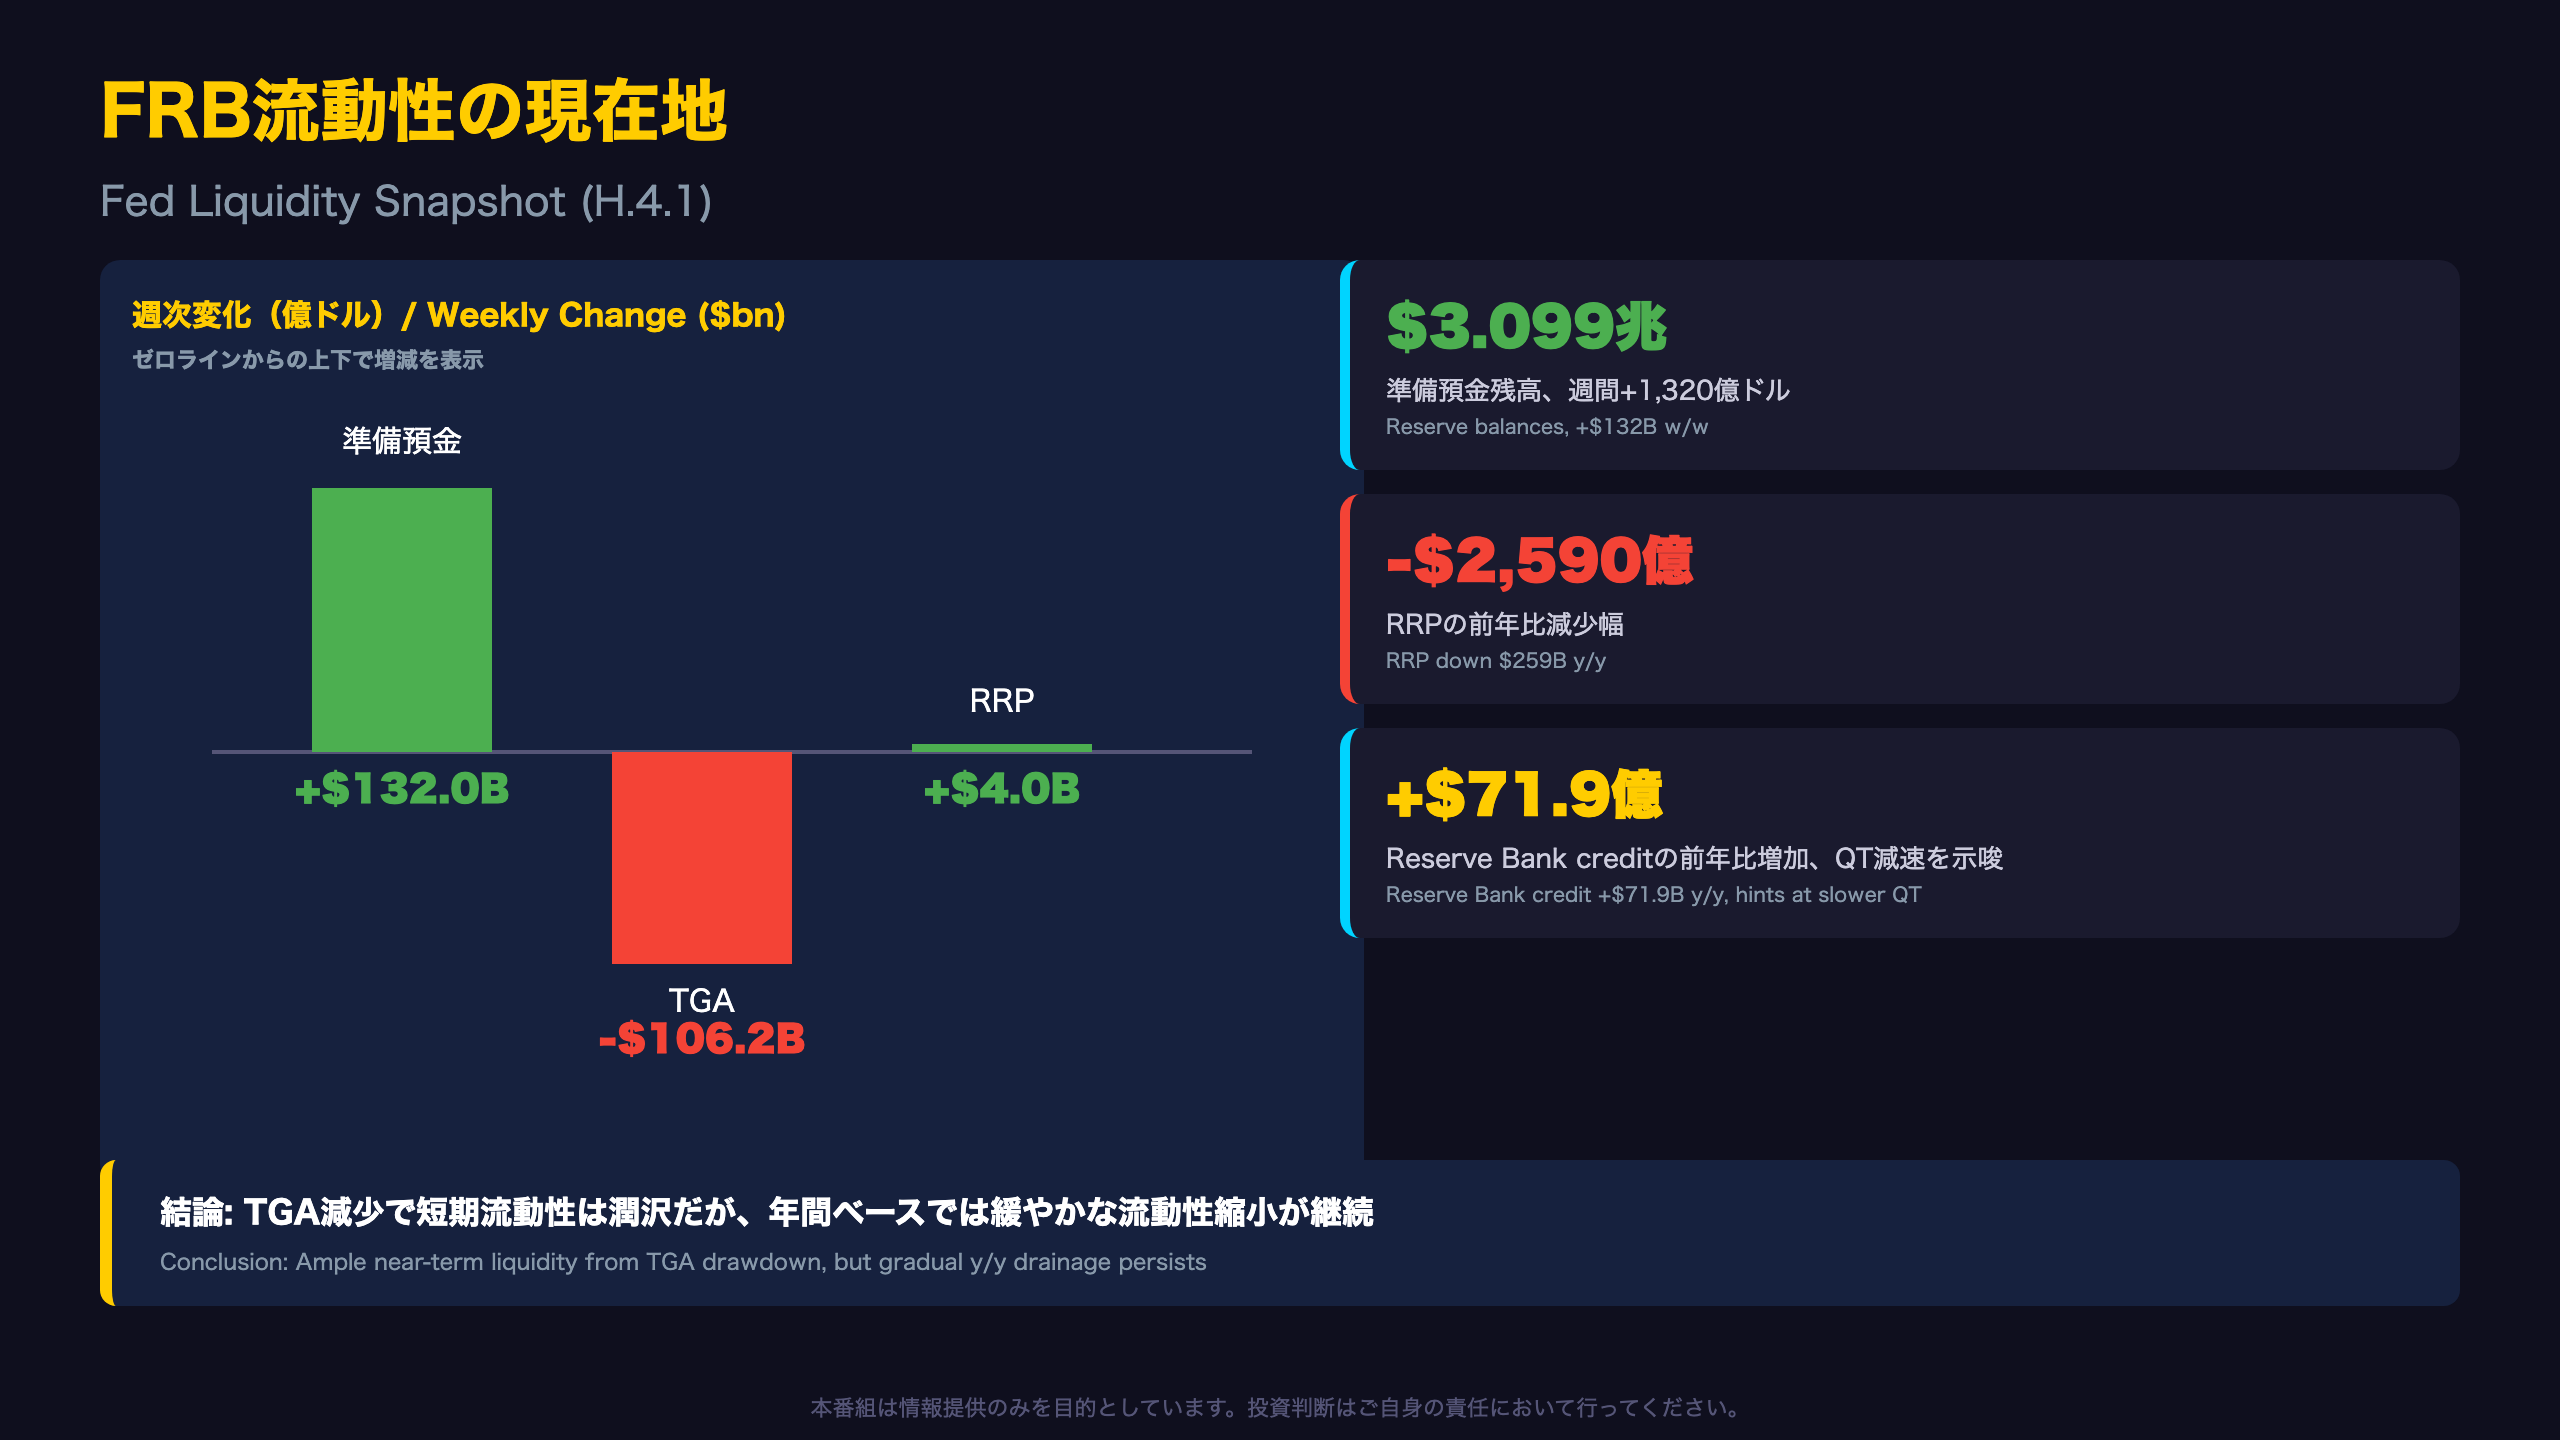
The Fed’s reserve balances jumped $132 billion in a single week on a TGA drawdown, while reverse repo usage fell sharply year-over-year — a tug-of-war in liquidity conditions. 💰
Ahead of next week’s CPI print, we break down the strengths and risks in this week’s data.
今週のアルティメット・サマリー
Why These Three Weekly Releases Matter
Each week, the U.S. Department of Labor (DOL) publishes initial jobless claims, the Energy Information Administration (EIA) issues its Weekly Petroleum Status Report, and the Federal Reserve releases the H.4.1 balance sheet statement. Individually niche, together they offer a same-week snapshot of three distinct engines of the U.S. economy: labor, energy, and monetary liquidity.
Key figures at a glance
- Initial claims (SA): 215,000, down 2,000 w/w — comfortably below year-ago levels (228,000)
- Retail gasoline: $3.777/gal, up $0.652 (21%) year-over-year
- Reserve balances: $3.099 trillion, up $132 billion in a single week
A word of caution on weekly noise
Weekly series are prone to large swings from seasonal-adjustment quirks and one-off drivers such as Treasury General Account (TGA) movements — the government’s checking account at the Fed. This week’s reserve jump is largely mechanical: a falling TGA pushes cash back into the banking system, and could reverse next week.
What’s next
With July CPI due in the coming weeks, the gasoline price trend highlighted here is a direct input into the energy component of headline inflation and is worth tracking closely by both U.S. and international investors positioning around Fed policy expectations.
労働市場の現在地(DOL詳細)
Understanding the Continued Claims Cycle
Continued claims fell from 1.89 million last November to roughly 1.75-1.76 million in April, before drifting back to the 1.81 million range in June-July. This oscillation looks more like range-bound normalization than the sustained uptrend typically seen ahead of a recession.
DOL’s technical notes describe continued claims as “not a leading indicator… they roughly coincide with economic cycles at their peaks and lag at cycle troughs.”
Beneath the headline: structural signals
Separate model-based analysis (outside this week’s DOL release) flags the labor force participation rate (61.8%) and employment-population ratio (59.2%) running well below their recent historical averages (62.4% and 60.0%), while long-term unemployment (1.988 million) sits notably above its typical level (1.484 million) — pointing to potentially longer unemployment durations even as headline layoffs stay low.
State-level dispersion
Insured unemployment rates in Puerto Rico (2.5%), Minnesota (2.2%), and New Jersey (2.1%) run well above the 1.2% national rate, a reminder that aggregates can mask regional divergence relevant to regional bank and credit exposure.
What to watch next week
A print above 220,000 on initial claims would confirm a turn higher in the 4-week average.
エネルギー需給の現在地(EIA詳細)
Why Distillate Is the Tightest Corner of the Barrel
The 5.0-million-barrel draw in distillate (diesel/heating oil) stocks was proportionally the sharpest of the three major categories — crude built by 3.0 million barrels while gasoline drew a modest 1.9 million. Relative to the five-year seasonal average, crude and gasoline both sit about 6% below normal, but distillate is running 12% below.
Per EIA: “Distillate fuel inventories decreased by 5.0 million barrels last week and are about 12% below the five-year average for this time of year.”
Four-week demand trends
- Total products supplied (demand proxy): 20.6 million b/d (+0.3% y/y)
- Gasoline supplied: 9.0 million b/d (-2.2% y/y)
- Distillate supplied: 3.8 million b/d (-0.9% y/y)
- Jet fuel supplied: +4.1% y/y
The jet fuel strength likely reflects robust summer air travel, while softer gasoline demand may partly reflect consumers pulling back amid elevated pump prices, though a single week cannot confirm a structural shift.
Bull/bear balance
Bearish for inflation: retail gasoline and diesel are both up more than 20% y/y. Less alarming: crude stocks built this week and crude imports rebounded to 5.6 million b/d (+351,000 b/d w/w).
Looking ahead
Distillate is worth tracking into the autumn heating season — a repeat draw next week would reinforce the tightness narrative relevant to diesel-sensitive freight and industrial cost inputs.
FRB流動性の現在地(H.4.1詳細)
Has QT Actually Paused?
The year-over-year increase of $71.9 billion in Reserve Bank credit is notable given that quantitative tightening has been official Fed policy since 2022. MBS holdings fell $190.1 billion year-over-year, consistent with ongoing passive runoff, while Treasury securities — particularly short-dated Bills — rose $291.2 billion year-over-year.
A shift in composition
| Holding | Latest | Y/Y Change |
|---|---|---|
| Treasury Bills | $496.4bn | +$301.0bn |
| MBS | $1,948.4bn | -$190.1bn |
This pattern is consistent with, though not conclusive proof of, the Fed reinvesting a portion of MBS paydowns into Bills rather than letting the balance sheet shrink further — a compositional rebalancing rather than genuine reduction.
Separating TGA noise from structural liquidity
This week’s $132.0 billion reserve jump closely tracks a $106.2 billion TGA decline. Since the TGA is still up $454.2 billion year-over-year, any future rebuild could reverse this week’s reserve gain.
What ON RRP usage tells us
RRP balances rose modestly week-over-week but are down $259.0 billion year-over-year, consistent with money funds rotating into higher-yielding Bills — a slow drain on the Fed’s liquidity buffer independent of headline totals.
What to watch next
Whether the TGA resumes rebuilding, and whether reserves hold above the $3 trillion “ample reserves” threshold, are key signals for repo-market stress risk ahead.
ストラテジスト総括
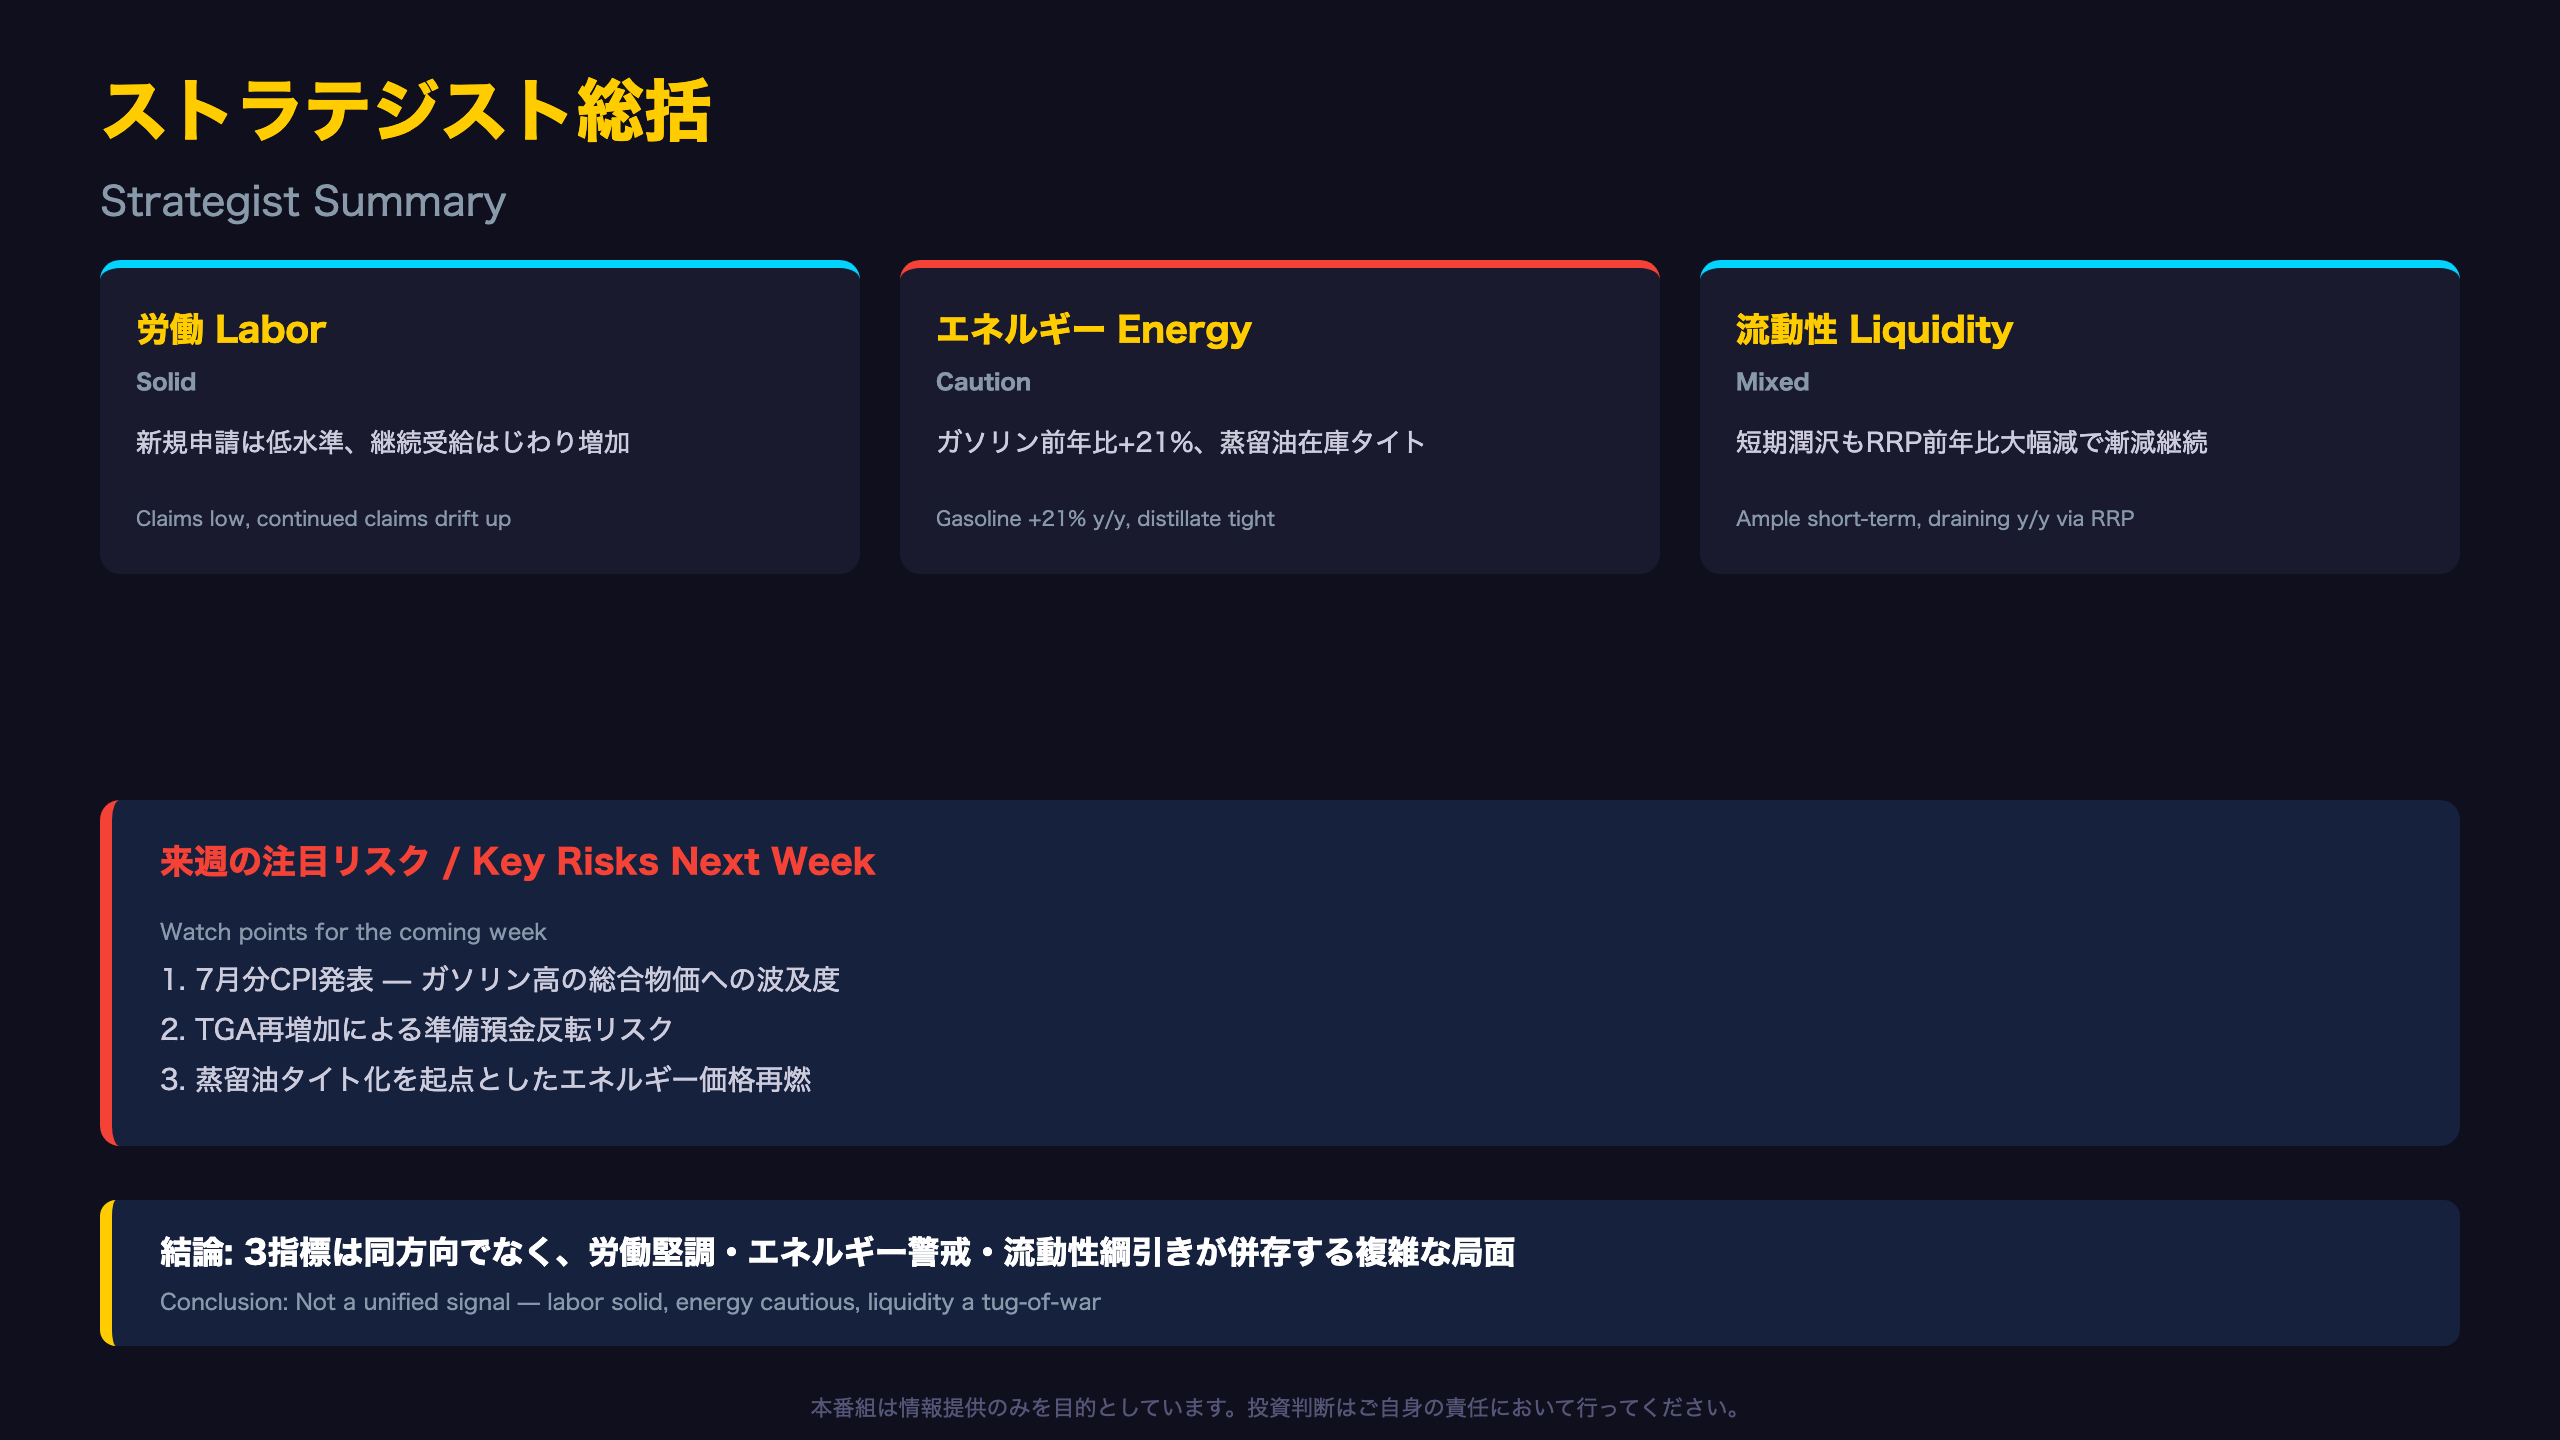
What the HMM Regime Model Adds to the Picture
A hidden Markov model tracking the broader macro backdrop classifies the current environment as Regime “R1,” with a 100% posterior probability sustained over the last five weeks and a 99.6% probability of remaining in R1 next week — at the composite level, no signal of an imminent regime shift.
But individual series show meaningful divergence
The same framework flags statistically significant deviations in several price series: gasoline CPI (+28.4% y/y vs. a regime average of -2.8%, Z=2.68), energy CPI (+17.9% y/y vs. -0.02%, Z=2.40), and airline fares CPI (+20.7% y/y vs. -1.67%, Z=2.21). Labor force participation and employment-population ratio show comparable divergence, suggesting headline labor quantity indicators remain solid while quality metrics and energy-linked inflation run outside their typical range.
Key catalysts next week
The upcoming July CPI release is the most important event to watch, given this week’s double-digit year-over-year gasoline and diesel increases. Continued monitoring of DOL claims, EIA petroleum data, and the Fed’s H.4.1 release will help confirm whether these trends persist.
Risk scenarios for investors
- TGA rebuild risk: a resumed TGA buildup could reverse this week’s reserve surge, tightening short-term funding markets.
- Distillate-led energy inflation: continued draws could push diesel prices higher ahead of winter, feeding into transportation and core inflation costs.
Note for international readers: U.S. CPI weights owners’ equivalent rent heavily, so energy swings, while impactful, typically carry a smaller headline weight than in some European CPI baskets.
Disclaimer: This article is for informational purposes only. All investment decisions are made solely at your own risk.







