📺 Watch the Full Video Analysis
This article was automatically generated by the NFC Market Live AI analysis system. (Updated: 2026-07-12 03:17 JST)
📄 Primary Source
日本銀行
https://www.boj.or.jp/statistics/pi/cgpi_release/cgpi2606.pdf
📊 A deep dive into Japan’s June 2026 Corporate Goods Price Index (CGPI), released by the Bank of Japan on July 10.
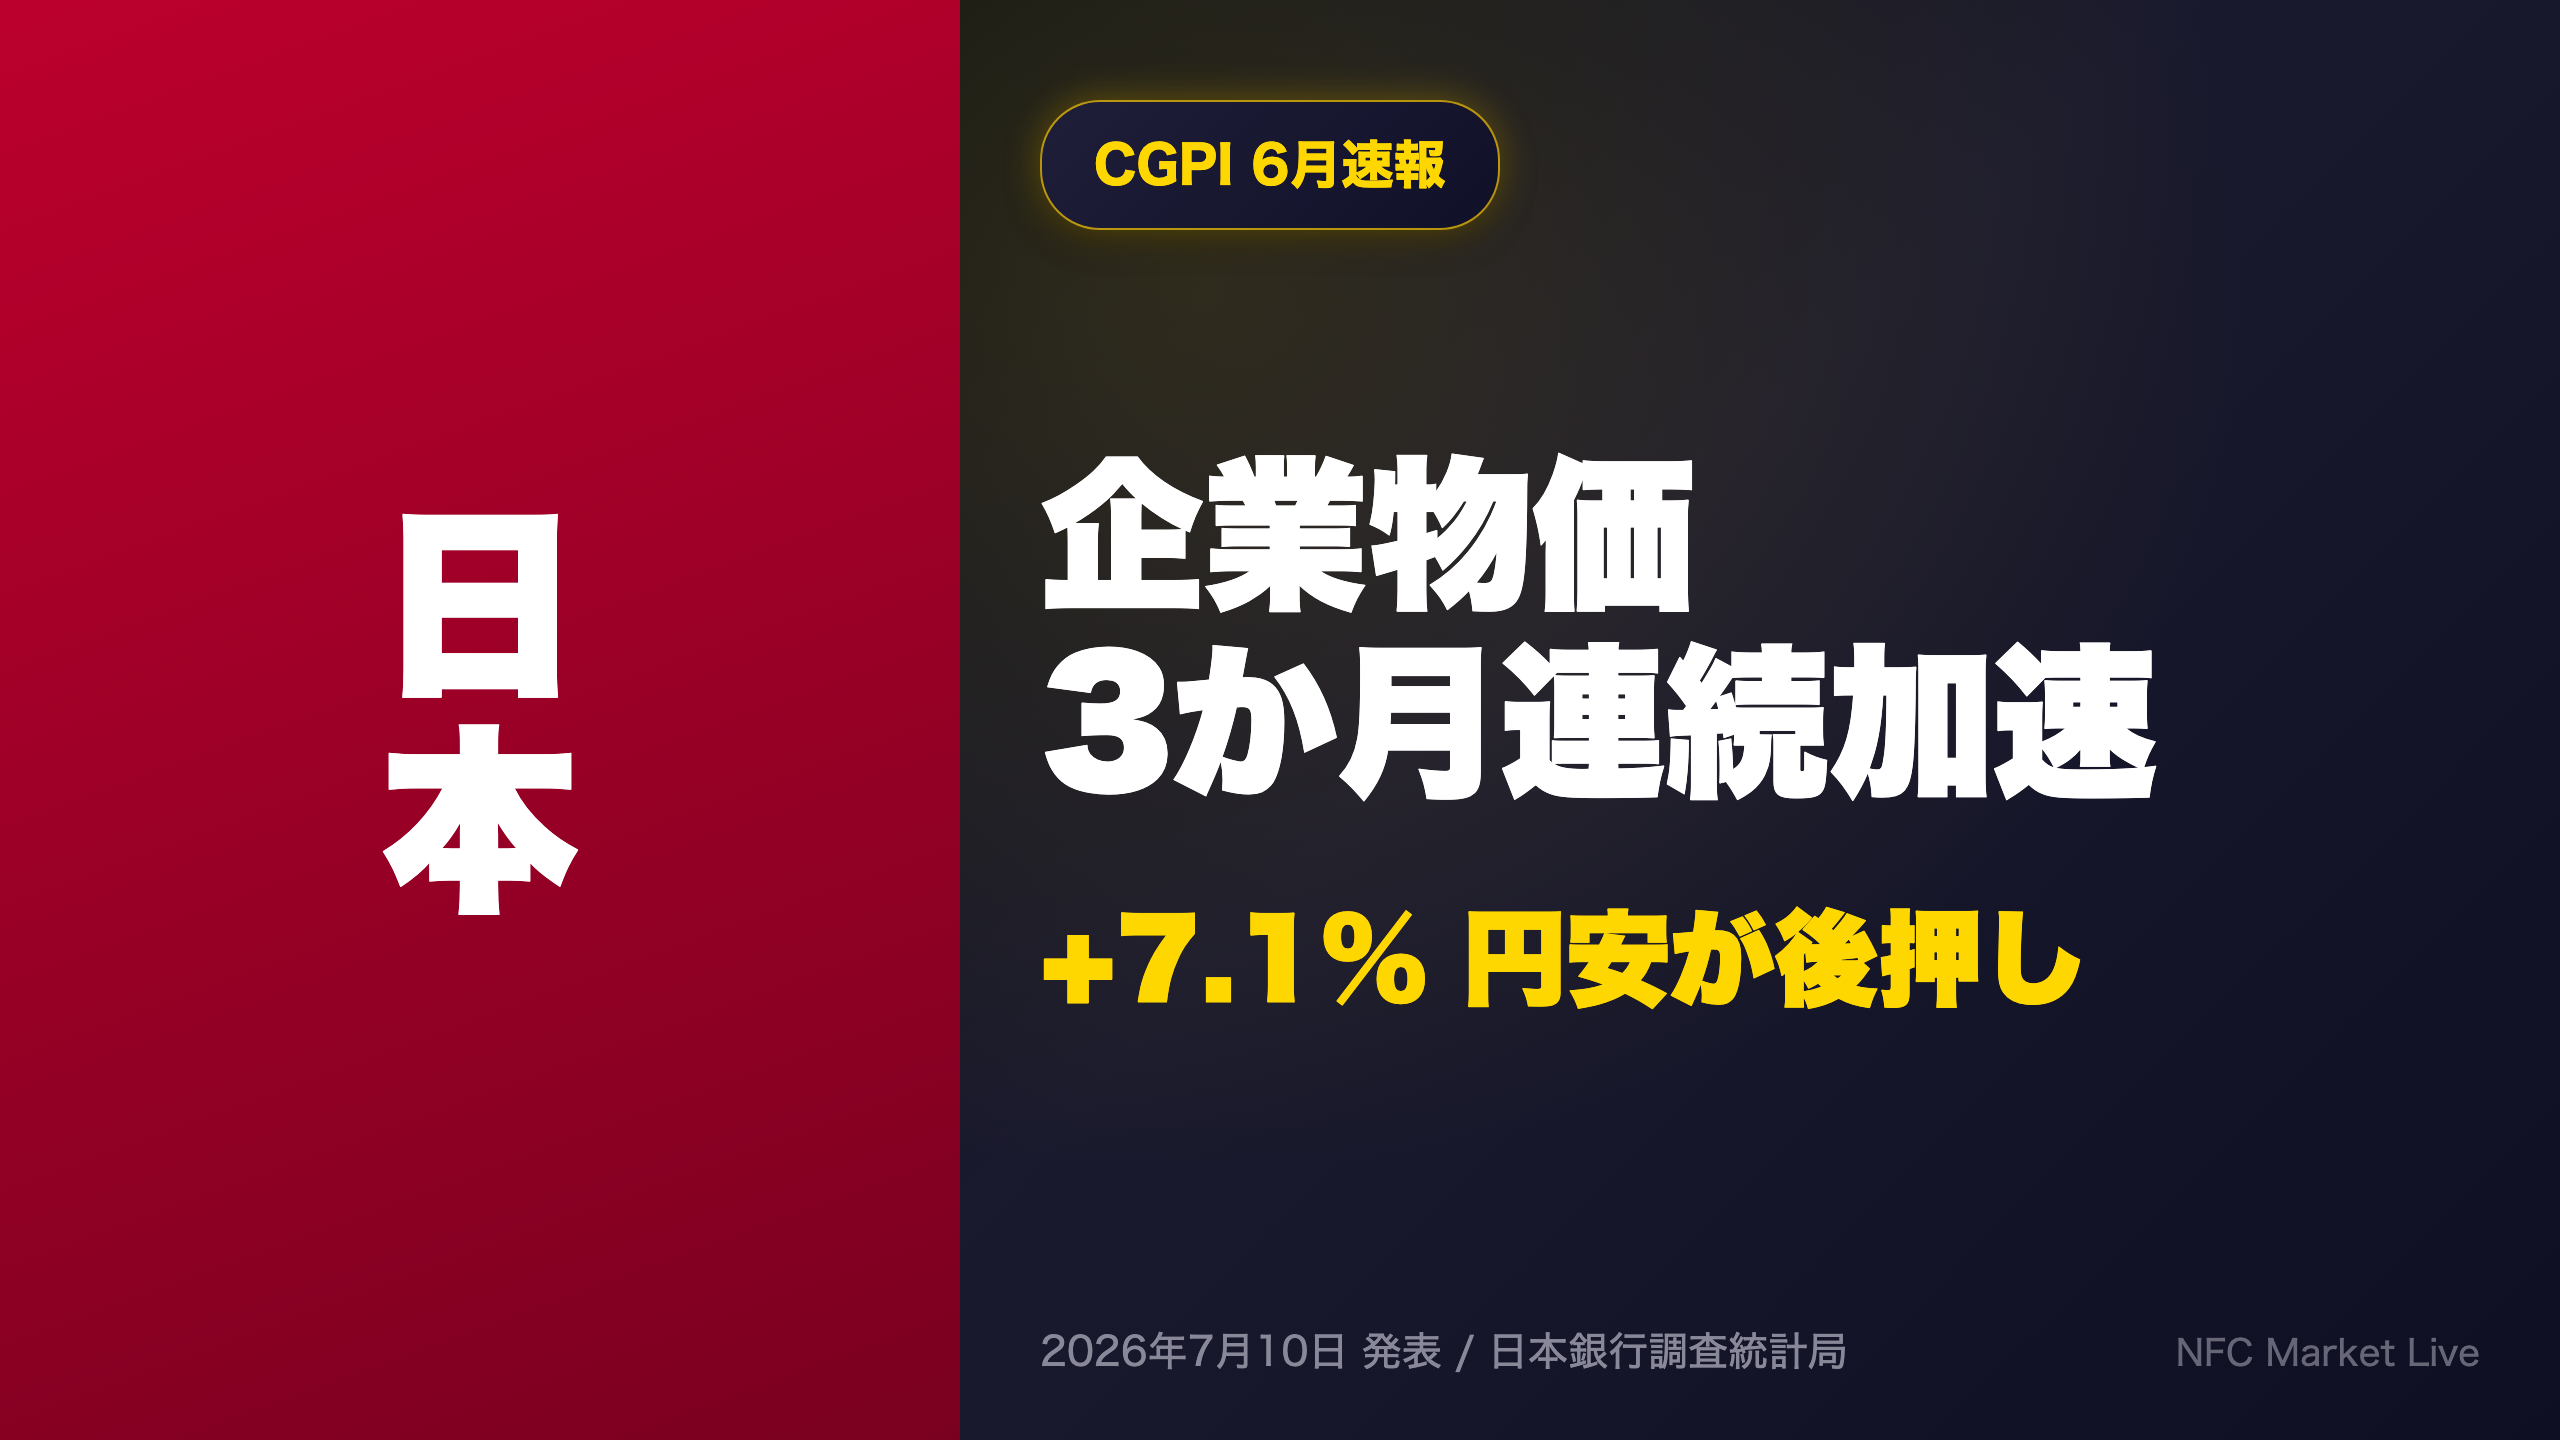
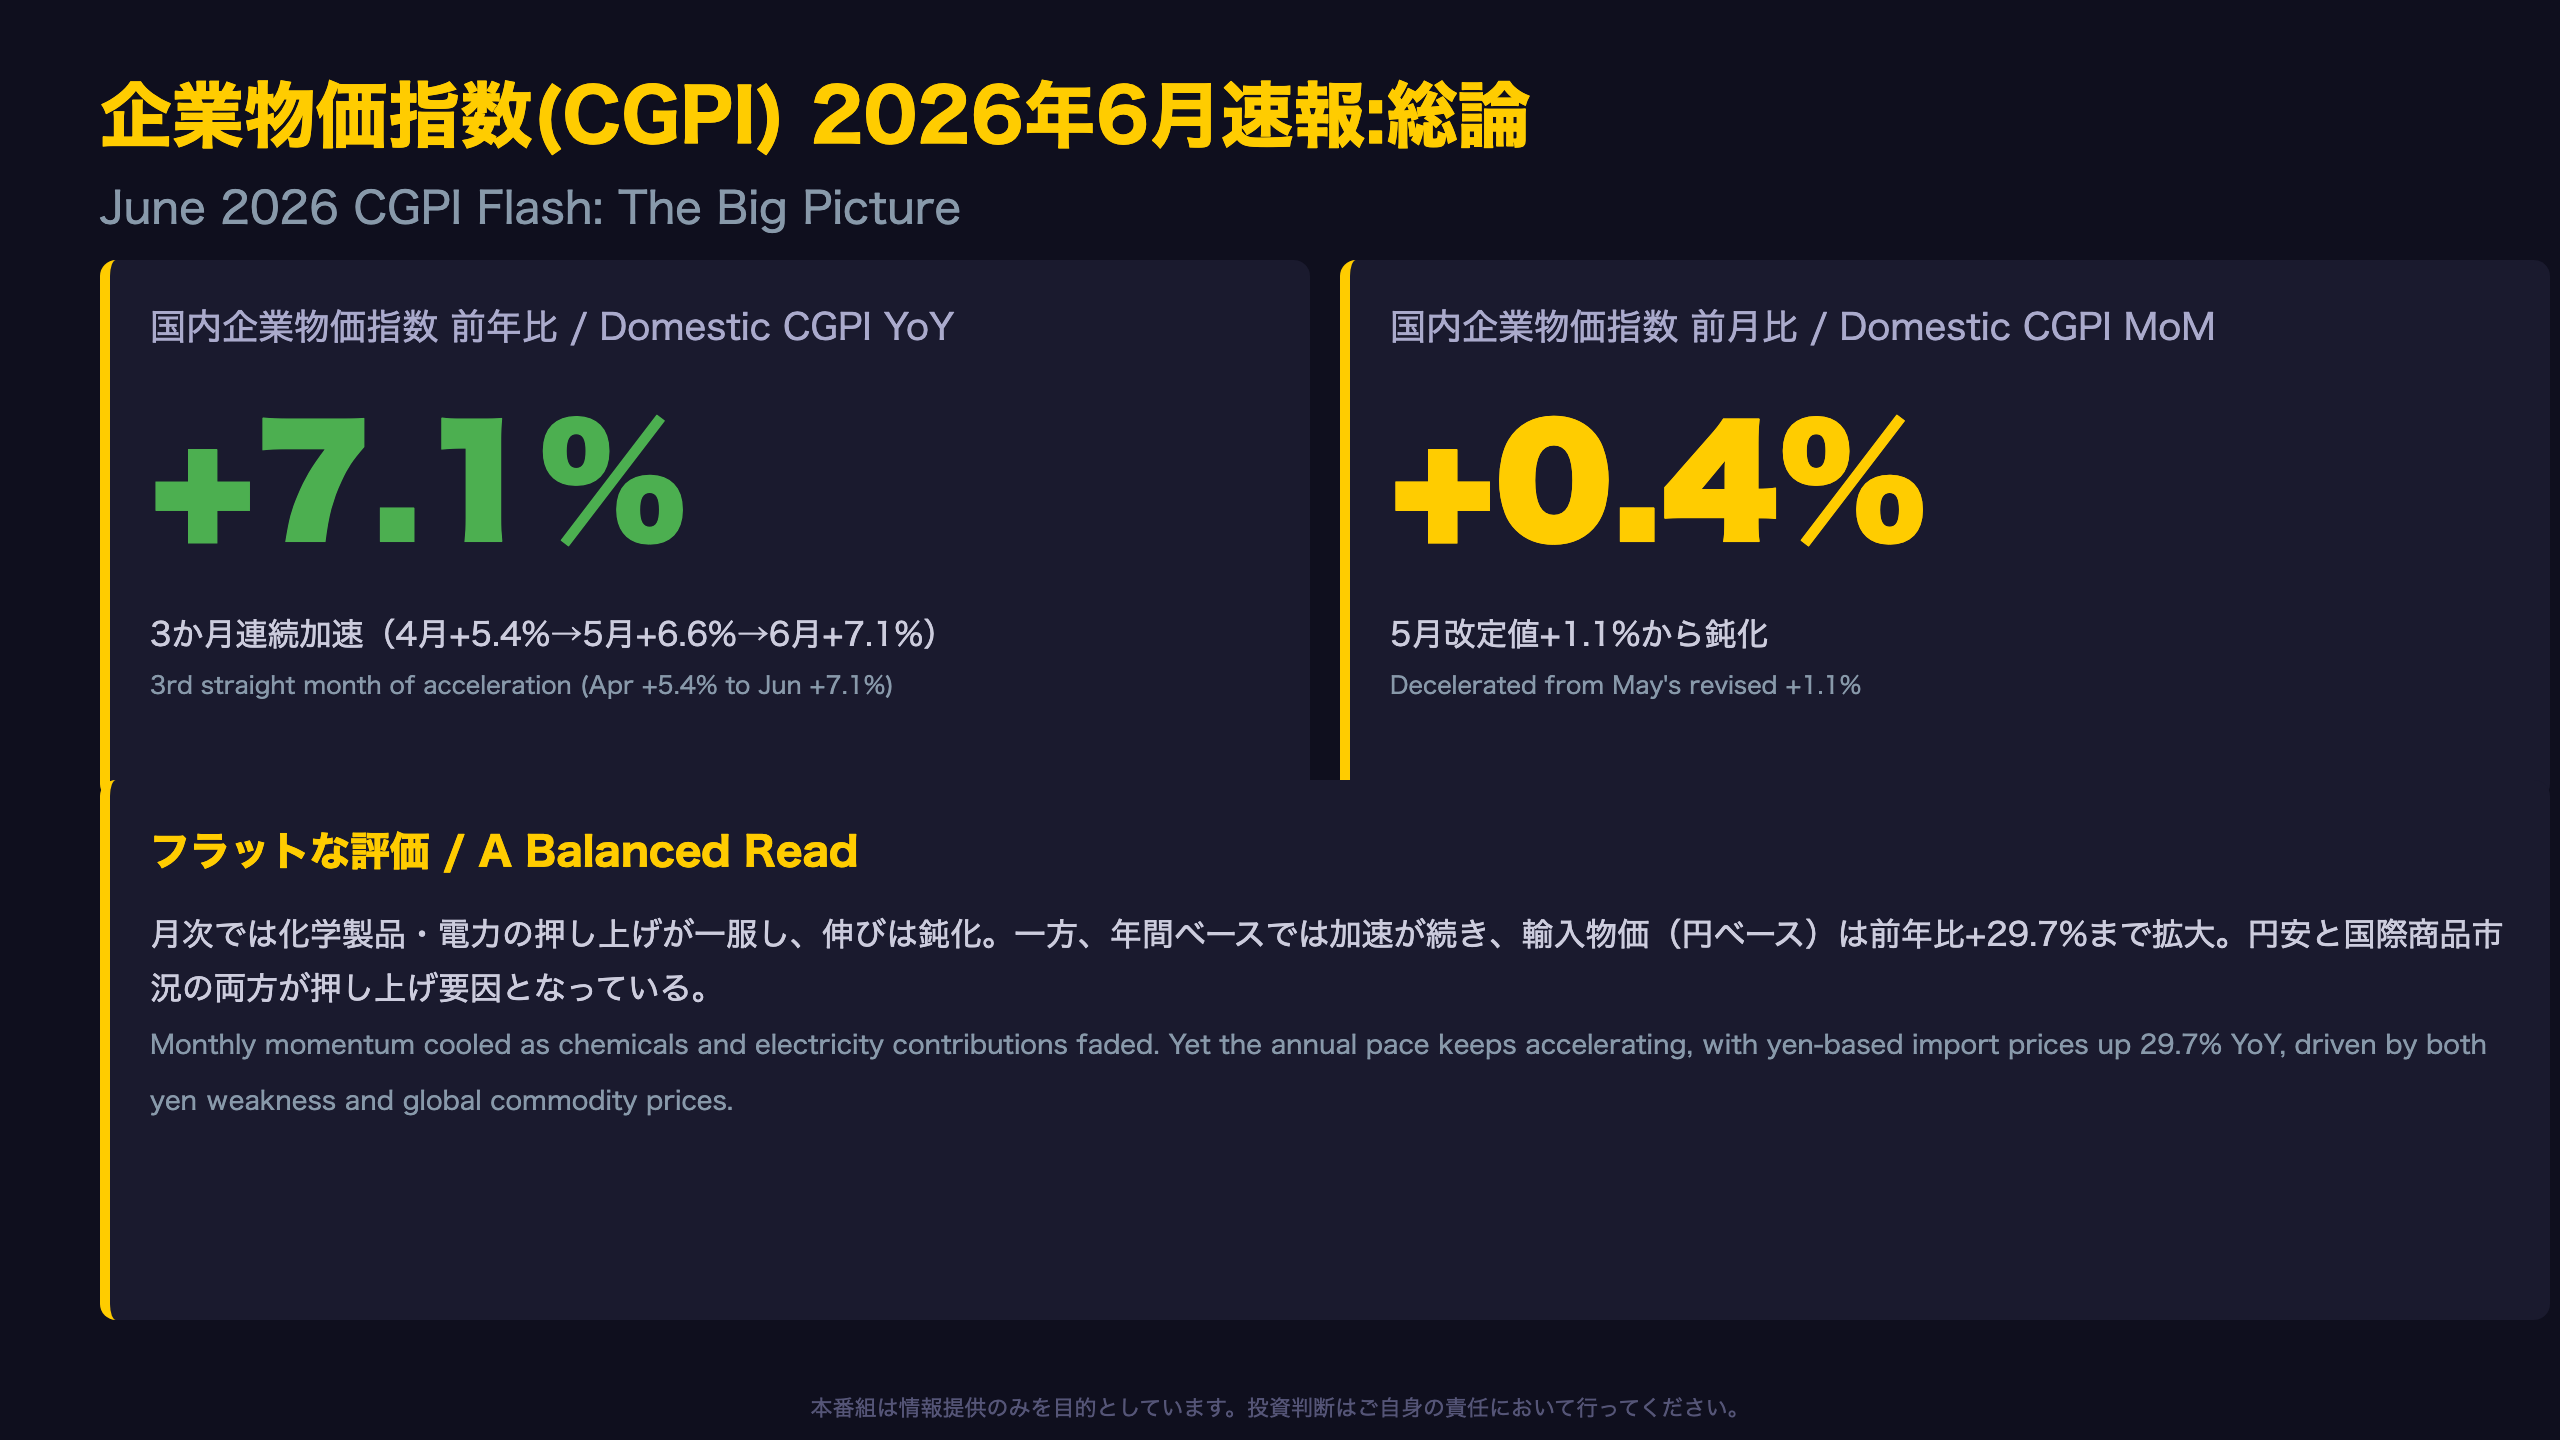
📈 Domestic CGPI rose +7.1% YoY, accelerating for a 3rd straight month (Apr +5.4% → May +6.6% → Jun +7.1%).
💡 Import prices jumped +29.7% YoY in yen terms, versus +17.8% on a contract-currency basis — the ~12pt gap reveals how much yen weakness is driving the surge.
⚠️ We break down whether upstream metal and energy cost pressure will cascade downstream, and what it means for BOJ policy.
総論:3か月連続の加速と月次減速の共存
Three Straight Months of YoY Acceleration
The standout feature of Japan’s June 2026 Corporate Goods Price Index (CGPI), released by the Bank of Japan, is that the year-on-year rate has accelerated for three consecutive months, not just a single print. Working through the index levels: April’s YoY was +5.4%, May’s was revised up to +6.6%, and June came in at +7.1%.
The CGPI is Japan’s producer-price equivalent to the U.S. PPI, tracking wholesale-level costs before they reach consumers — making sustained acceleration here a meaningful leading signal.
The revision matters
May’s flash reading was originally +0.9% month-on-month; it has since been revised up to +1.1%. That means June’s +0.4% represents deceleration from an even stronger base than initially reported, making the real slowdown somewhat larger than headline comparisons suggest.
Looking ahead
The next CGPI release is scheduled for August 13. July typically brings seasonal summer electricity surcharge adjustments, so the electricity/gas/water contribution (just +0.09 points in June) will be worth watching for a rebound.
押し上げ要因の交代:化学・電力から石油へ
Shifting Cost Drivers: From Chemicals to Petroleum
Japan’s Corporate Goods Price Index (CGPI), compiled by the Bank of Japan, is the rough equivalent of the U.S. Producer Price Index (PPI) — it tracks wholesale-level prices before they reach consumers, making it a leading indicator for future CPI trends.
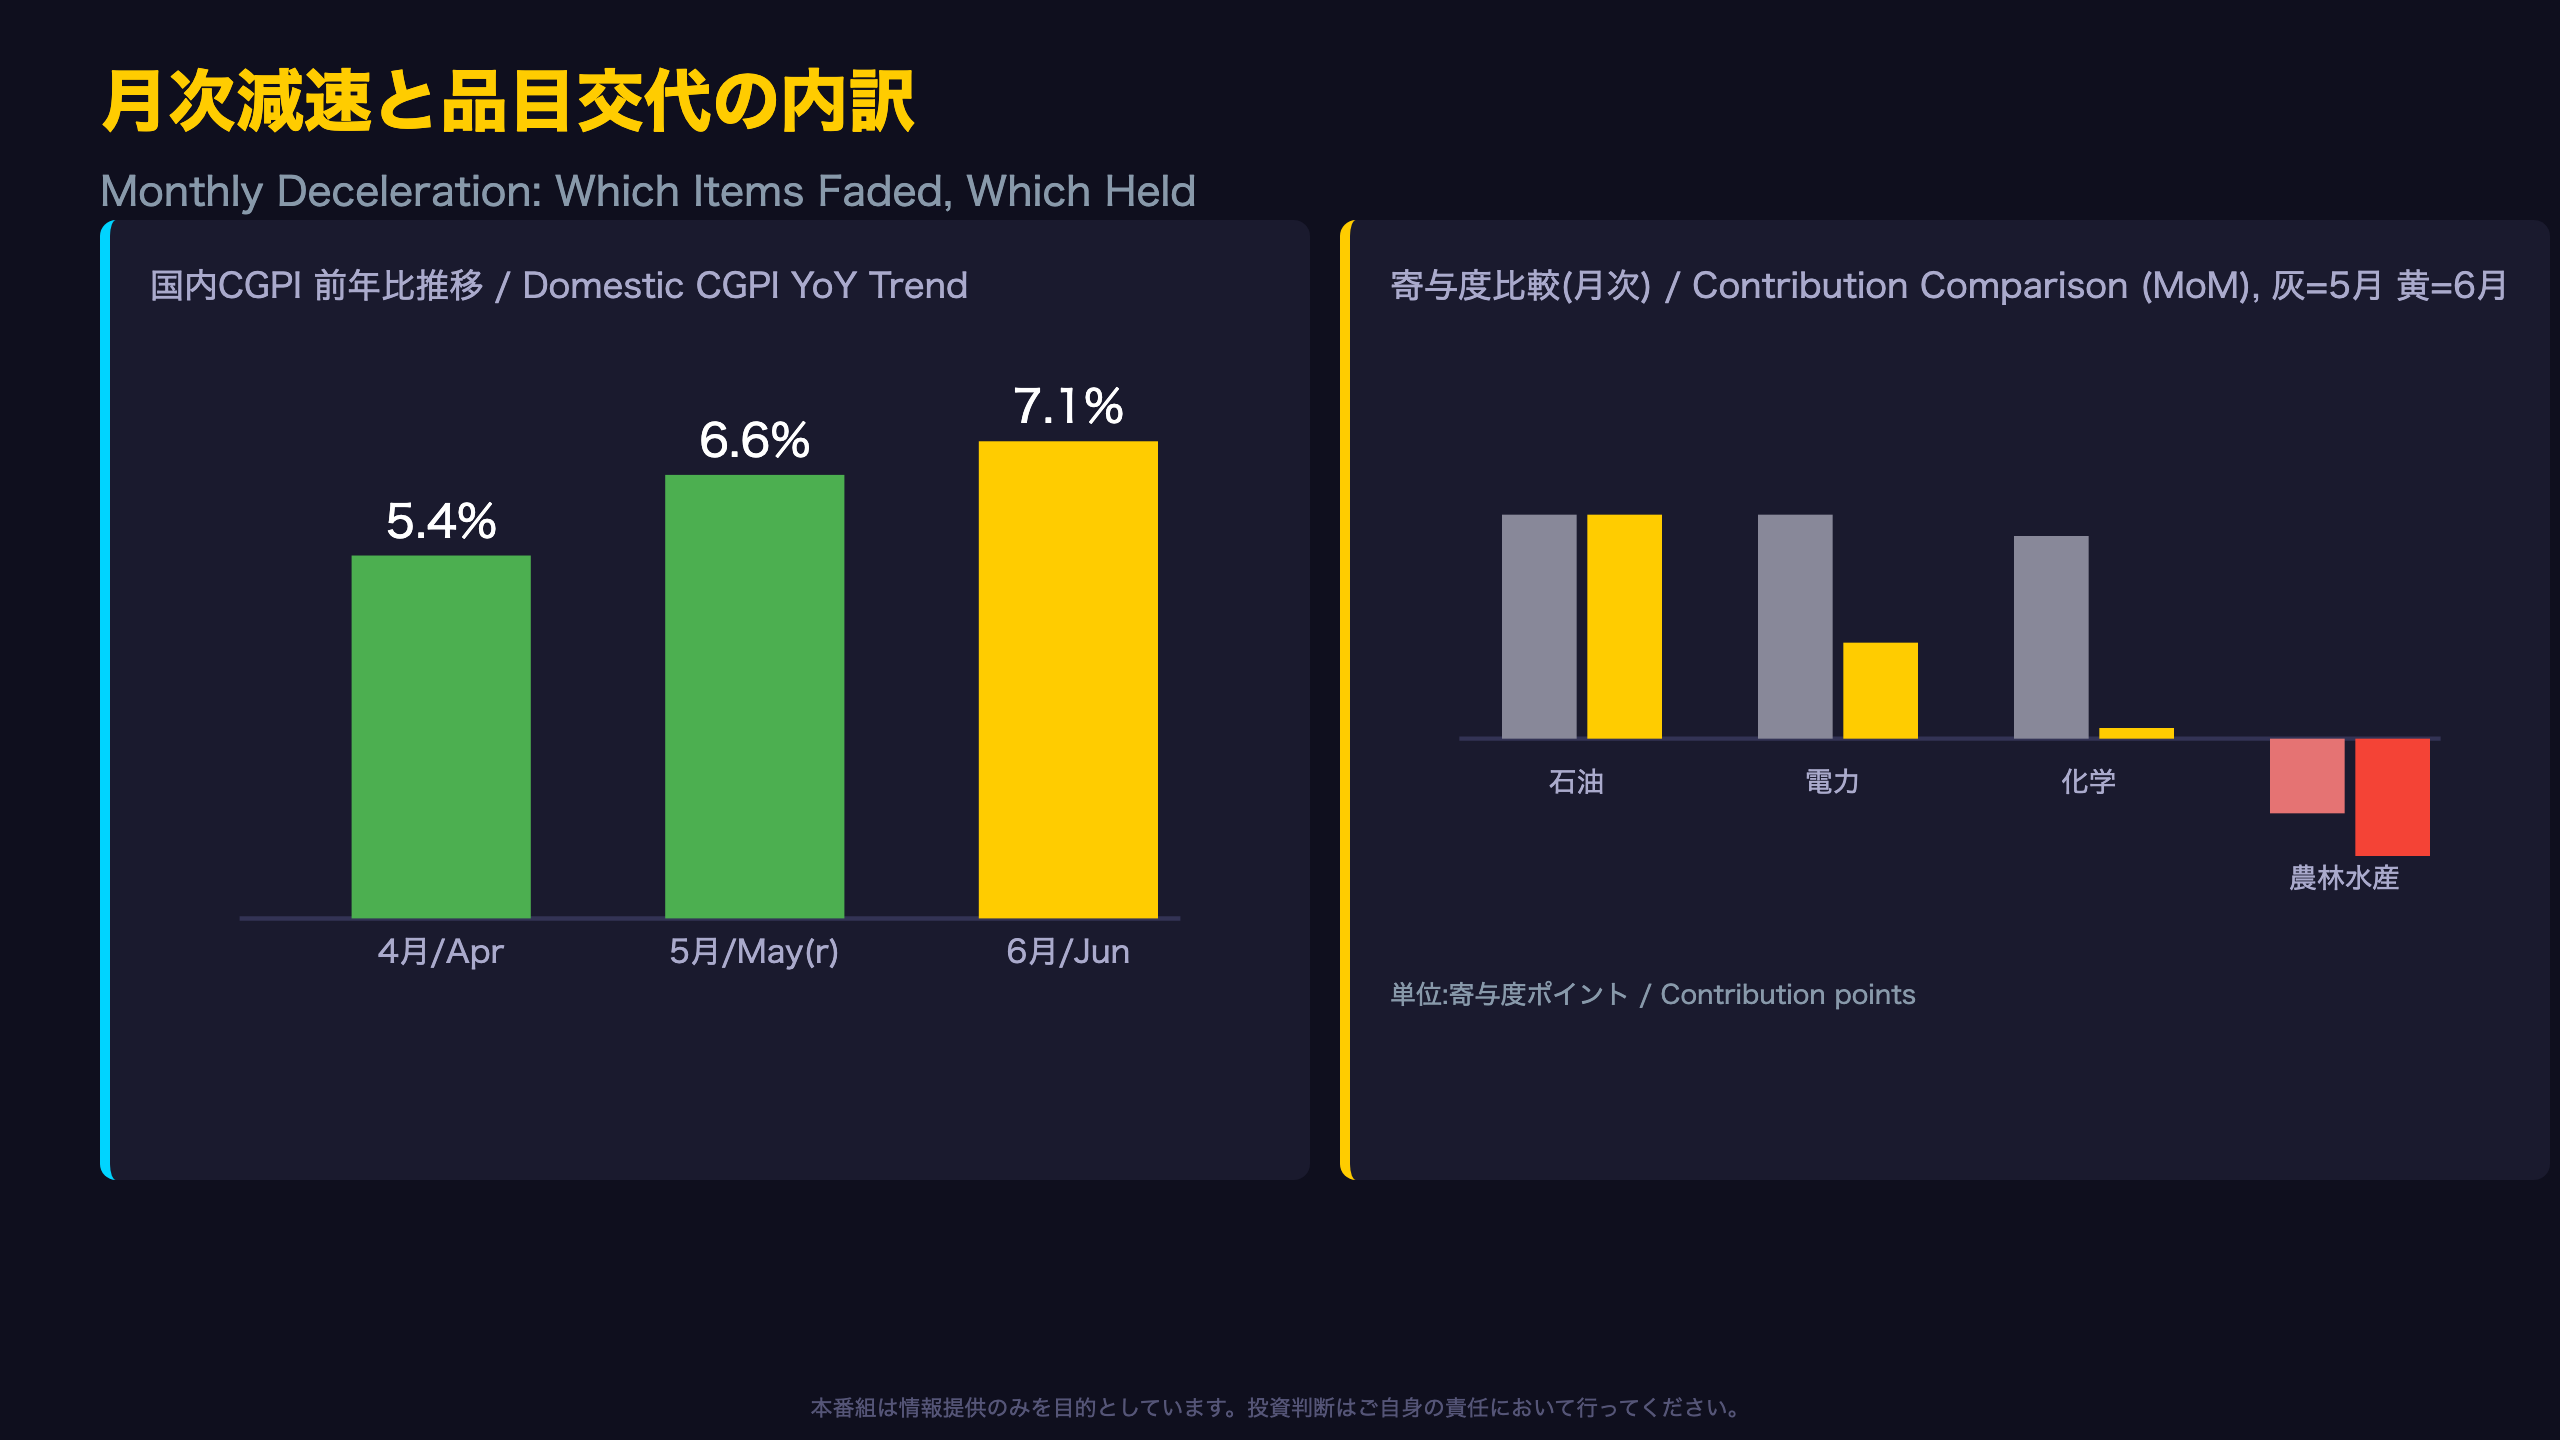
In June 2026, the composition of price pressure shifted notably. Non-ferrous metals, which contributed +0.17 points in May (driven by copper-clad wire, copper, and aluminum alloy ingots), dropped out of the list of major movers entirely in June, suggesting its contribution has faded close to zero. Chemical products saw an even sharper deceleration, from +0.19 points in May to just +0.01 points in June, with the underlying product mix shifting from polyethylene and polypropylene to synthetic rubber and chemical fertilizers.
Petroleum and coal products were the sole stable contributor, holding steady at +0.21 points in both months, reflecting persistent energy cost pressure from fuel oil and gasoline.
On the downside, agriculture and marine products’ drag deepened from -0.07 to -0.11 points, driven by falling rice and pork prices at the wholesale level. Whether this translates into softer food CPI remains uncertain based on this data alone. For international investors, this divergence — stable energy costs, fading industrial input costs, and falling farm-gate food prices — illustrates a more nuanced inflation picture than the aggregate MoM figure suggests.
為替効果の分離:輸出入物価は本当はどう動いたか
Separating FX Effects from Underlying Price Trends
One of the most valuable exercises in reading Japan’s trade price data is separating currency effects from real (contract-currency) price movements. The Bank of Japan publishes both a yen-denominated and a contract-currency (foreign-currency) version of its export and import price indices, allowing this decomposition, similar in spirit to how the U.S. reports import/export prices in dual formats.
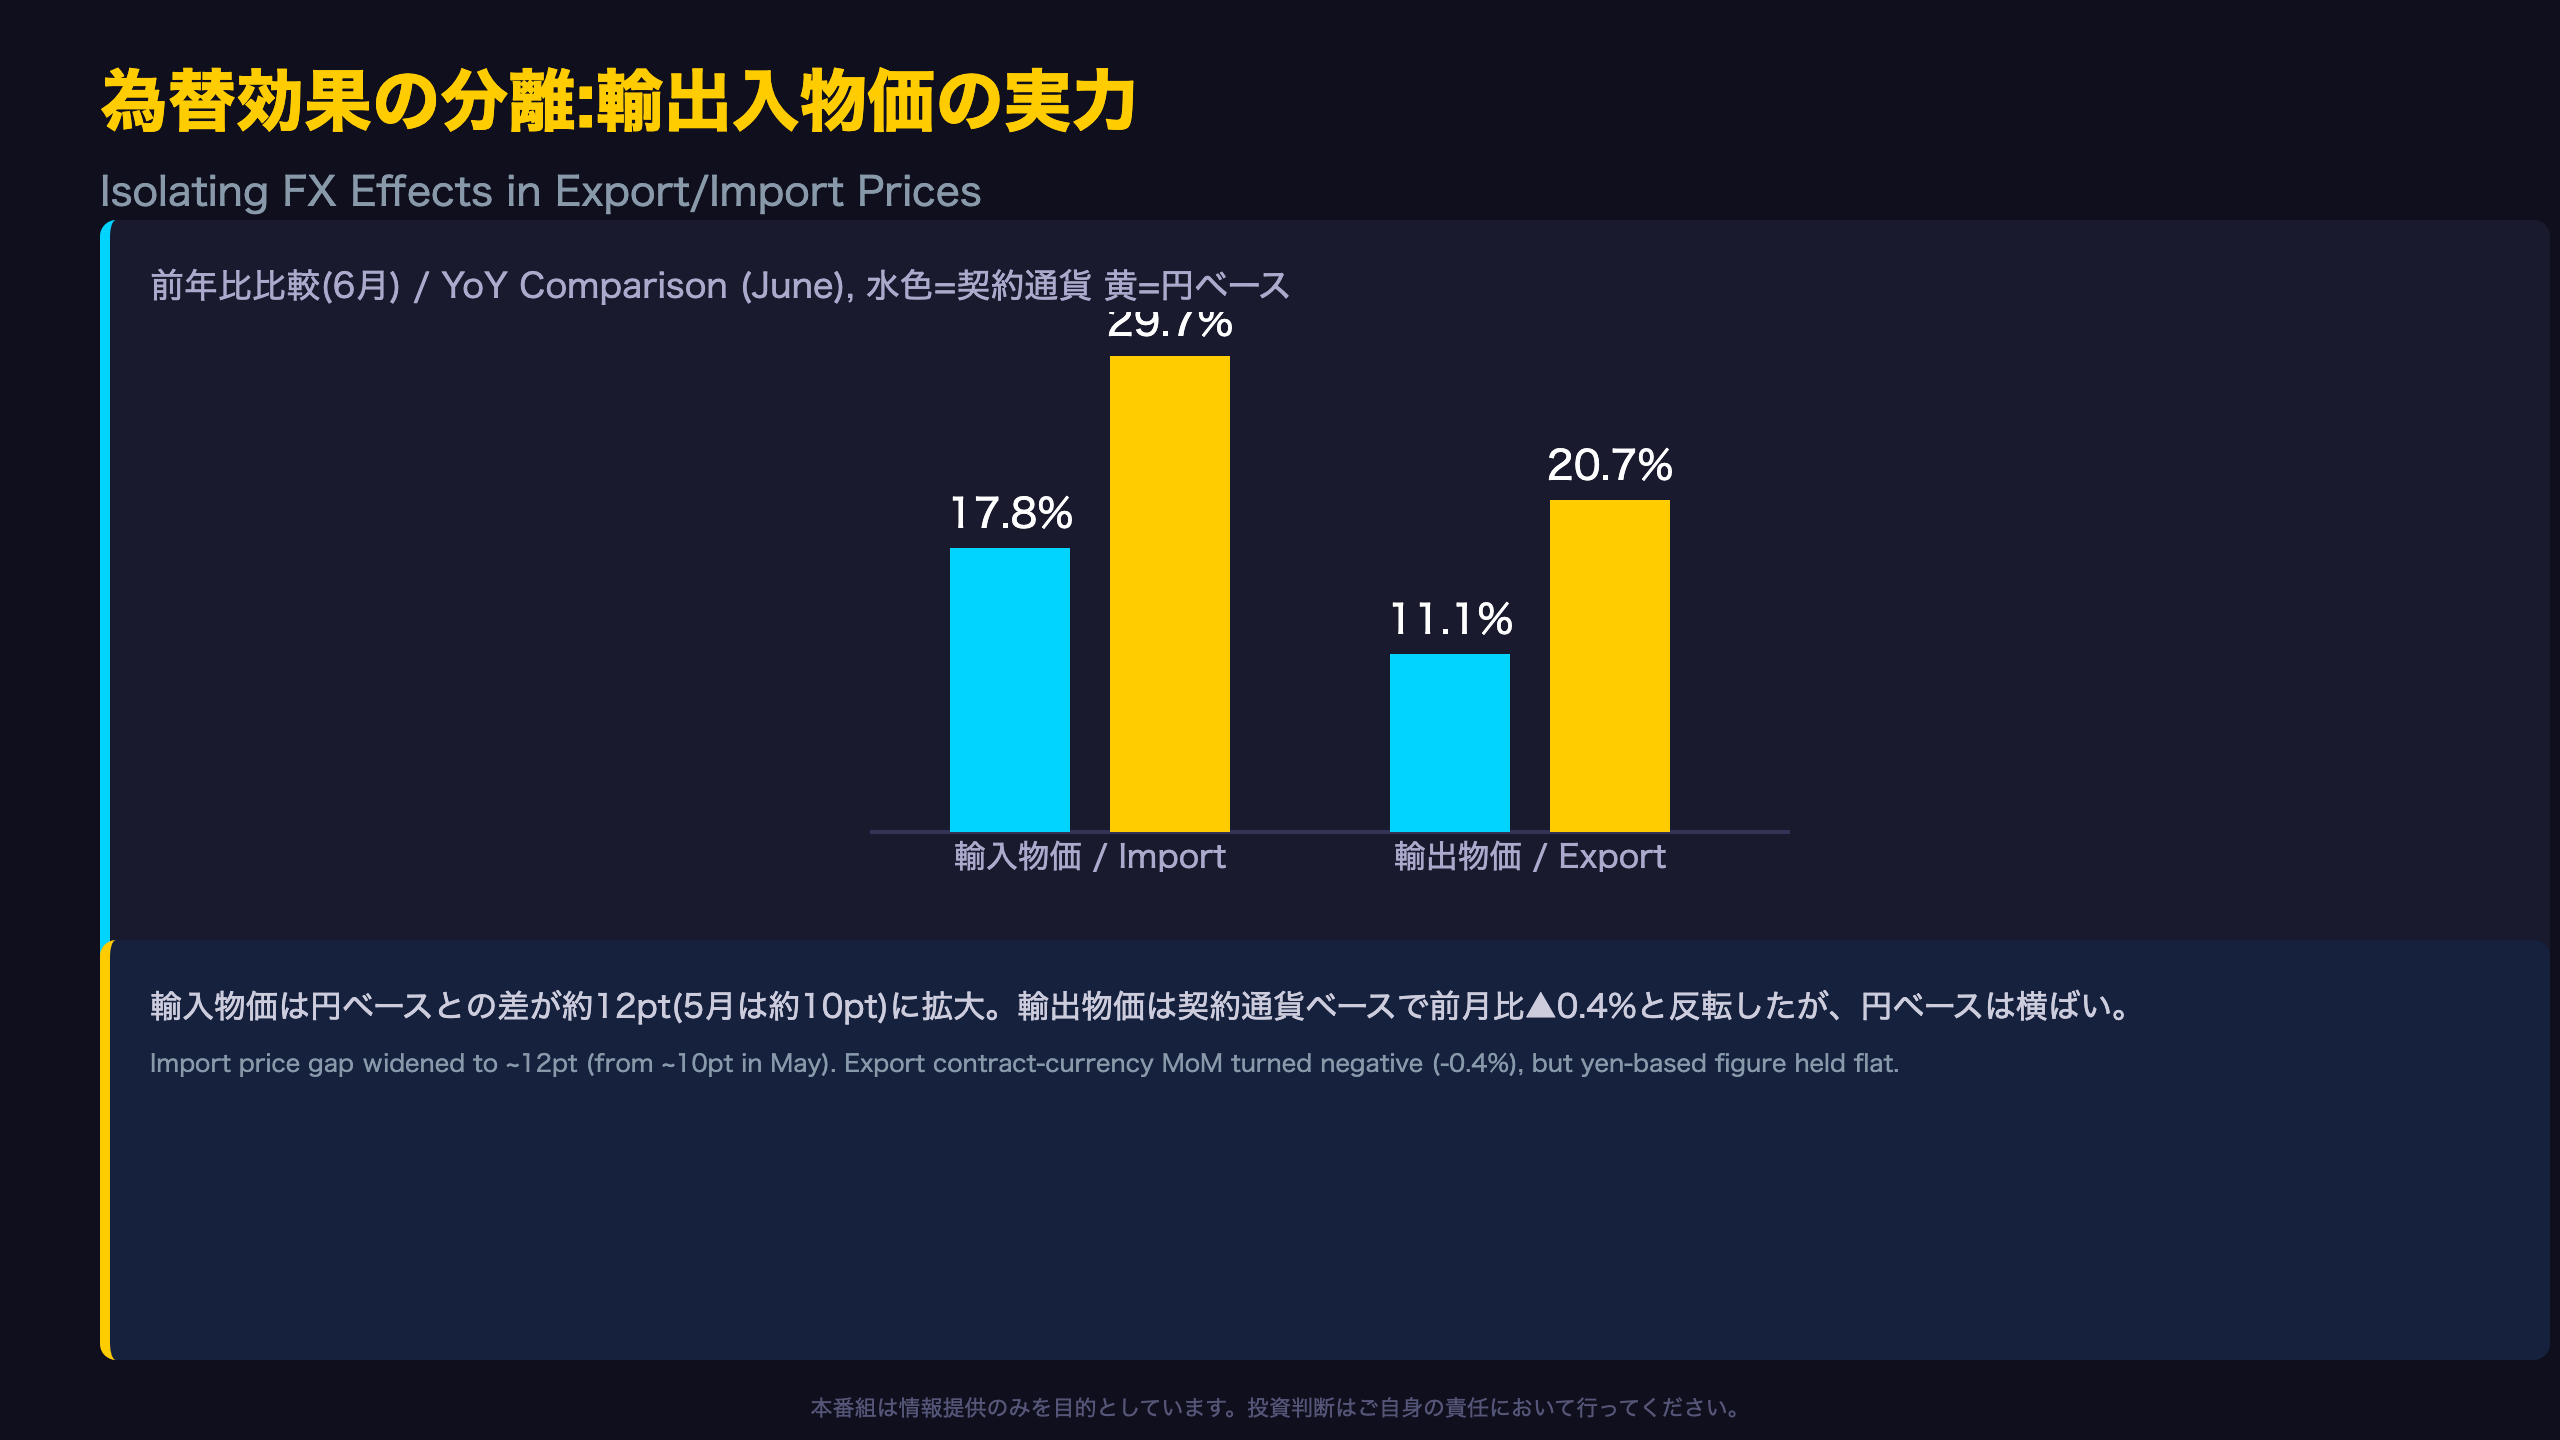
In June, import prices rose 29.7% YoY in yen terms but only 17.8% YoY in contract-currency terms, implying that roughly 12 percentage points of the year-on-year increase is attributable to yen weakness rather than global commodity price gains. This gap widened from about 10 points in May.
Export prices tell a related story: contract-currency YoY actually decelerated (11.7% to 11.1%), and the contract-currency month-on-month reading turned negative (-0.4%), driven by falling fuel-linked export goods (gasoil, jet fuel) and metals (gold bullion, scrap iron). Yet the yen-denominated figure held essentially flat (20.6% to 20.7%), because yen depreciation offset the underlying price softness.
Market implication: for USD-based investors, this suggests Japanese exporters’ pricing power in foreign-currency terms may be softening slightly, even as their yen-denominated revenue outlook looks stable, a nuance that pure yen-based headlines can obscure.
川上と川下の乖離:価格転嫁の進捗を読む
Why We Can’t See the Full Pipeline, and What We Use Instead
The Bank of Japan separately publishes a ‘demand stage and usage classification’ index that splits prices into raw materials, intermediate goods, and finished goods, similar in spirit to how the U.S. PPI reports ‘stage of processing’ data. However, this breakdown is not included in the report excerpt analyzed here (explicitly unavailable in the source text).
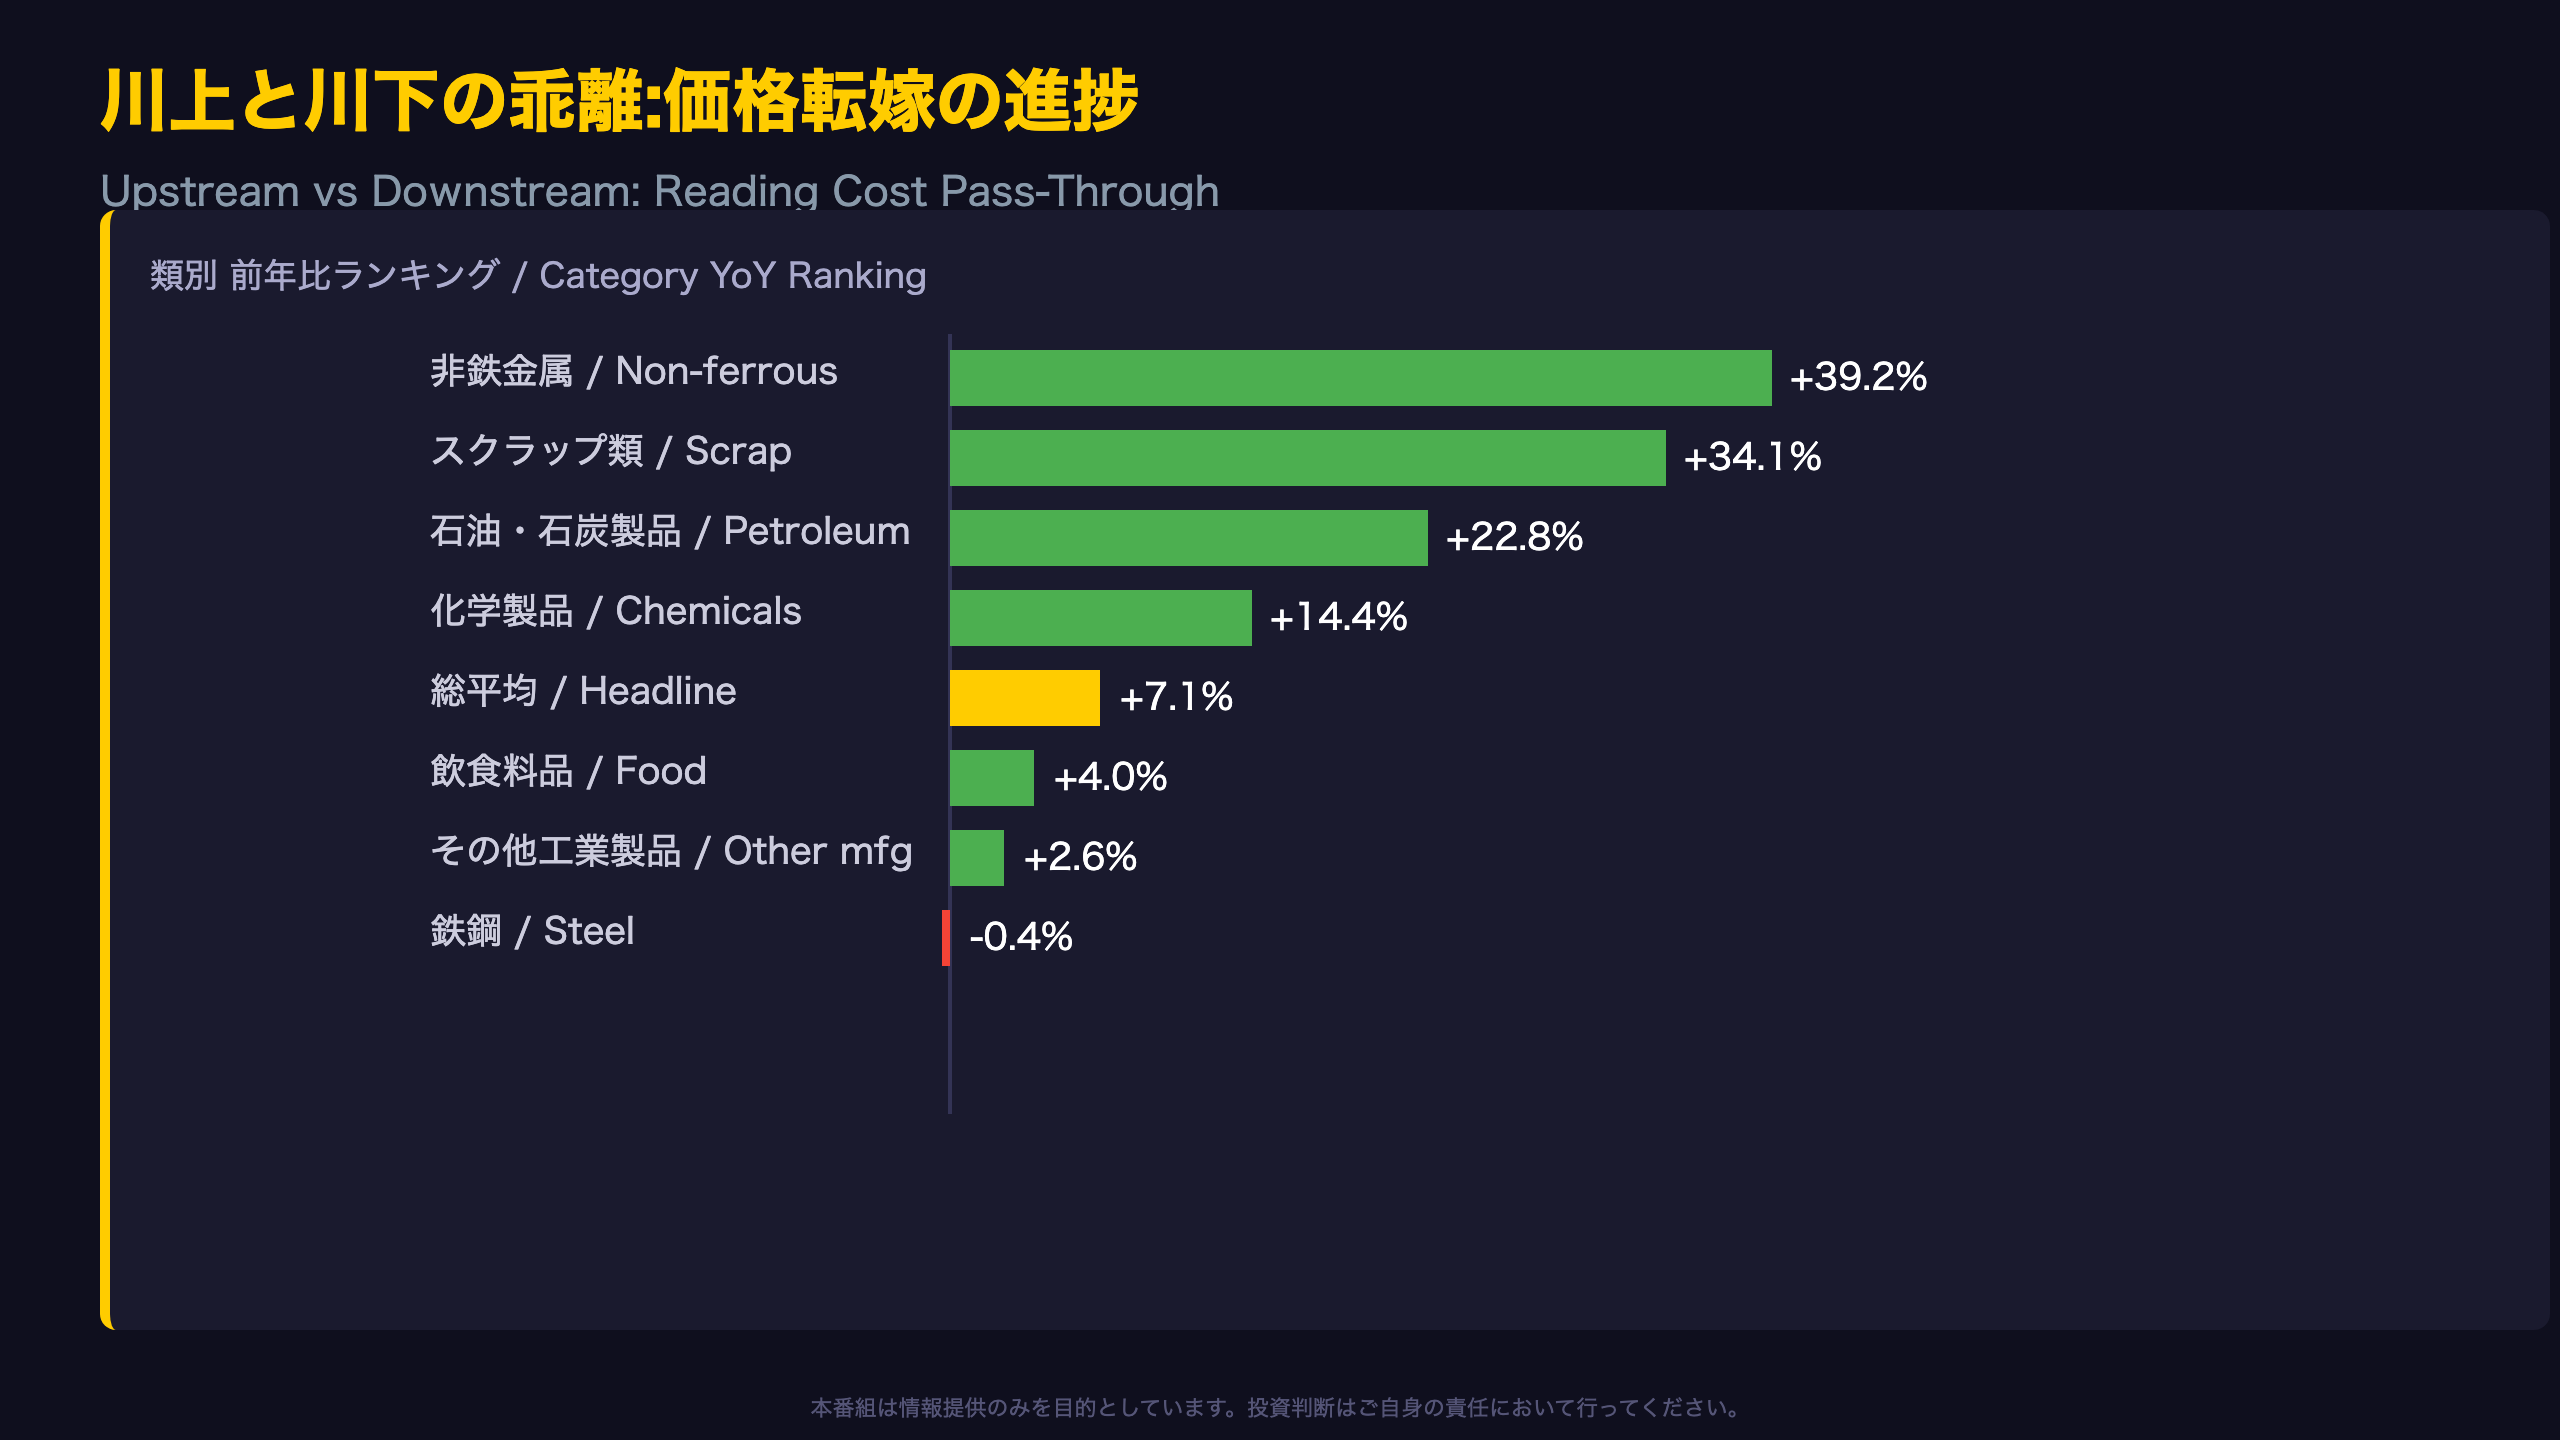
As a proxy, we examine category-level year-on-year price changes:
- Non-ferrous metals: +39.2%
- Scrap materials: +34.1%
- Petroleum & coal products: +22.8%
- Chemicals: +14.4%
- Headline average: +7.1%
- Food products: +4.0%
- Other manufactured goods: +2.6%
- Steel: -0.4% (the only negative category)
The roughly 30-plus percentage-point gap between upstream commodity categories and finished-goods-adjacent categories suggests incomplete cost pass-through, a pattern familiar to investors who track the U.S. PPI’s crude-vs-finished-goods spread. Interestingly, steel is the sole category in negative territory, showing that even within upstream materials, price trends are not uniform.
For equity investors, this divergence implies potential margin compression risk for downstream manufacturers that cannot fully pass through rising raw material costs, though the timing and magnitude of any eventual pass-through to consumer prices cannot be determined from this data alone.
根拠の鎖:日銀の金融政策への3つの論点
The Chain of Evidence: Three Policy Talking Points
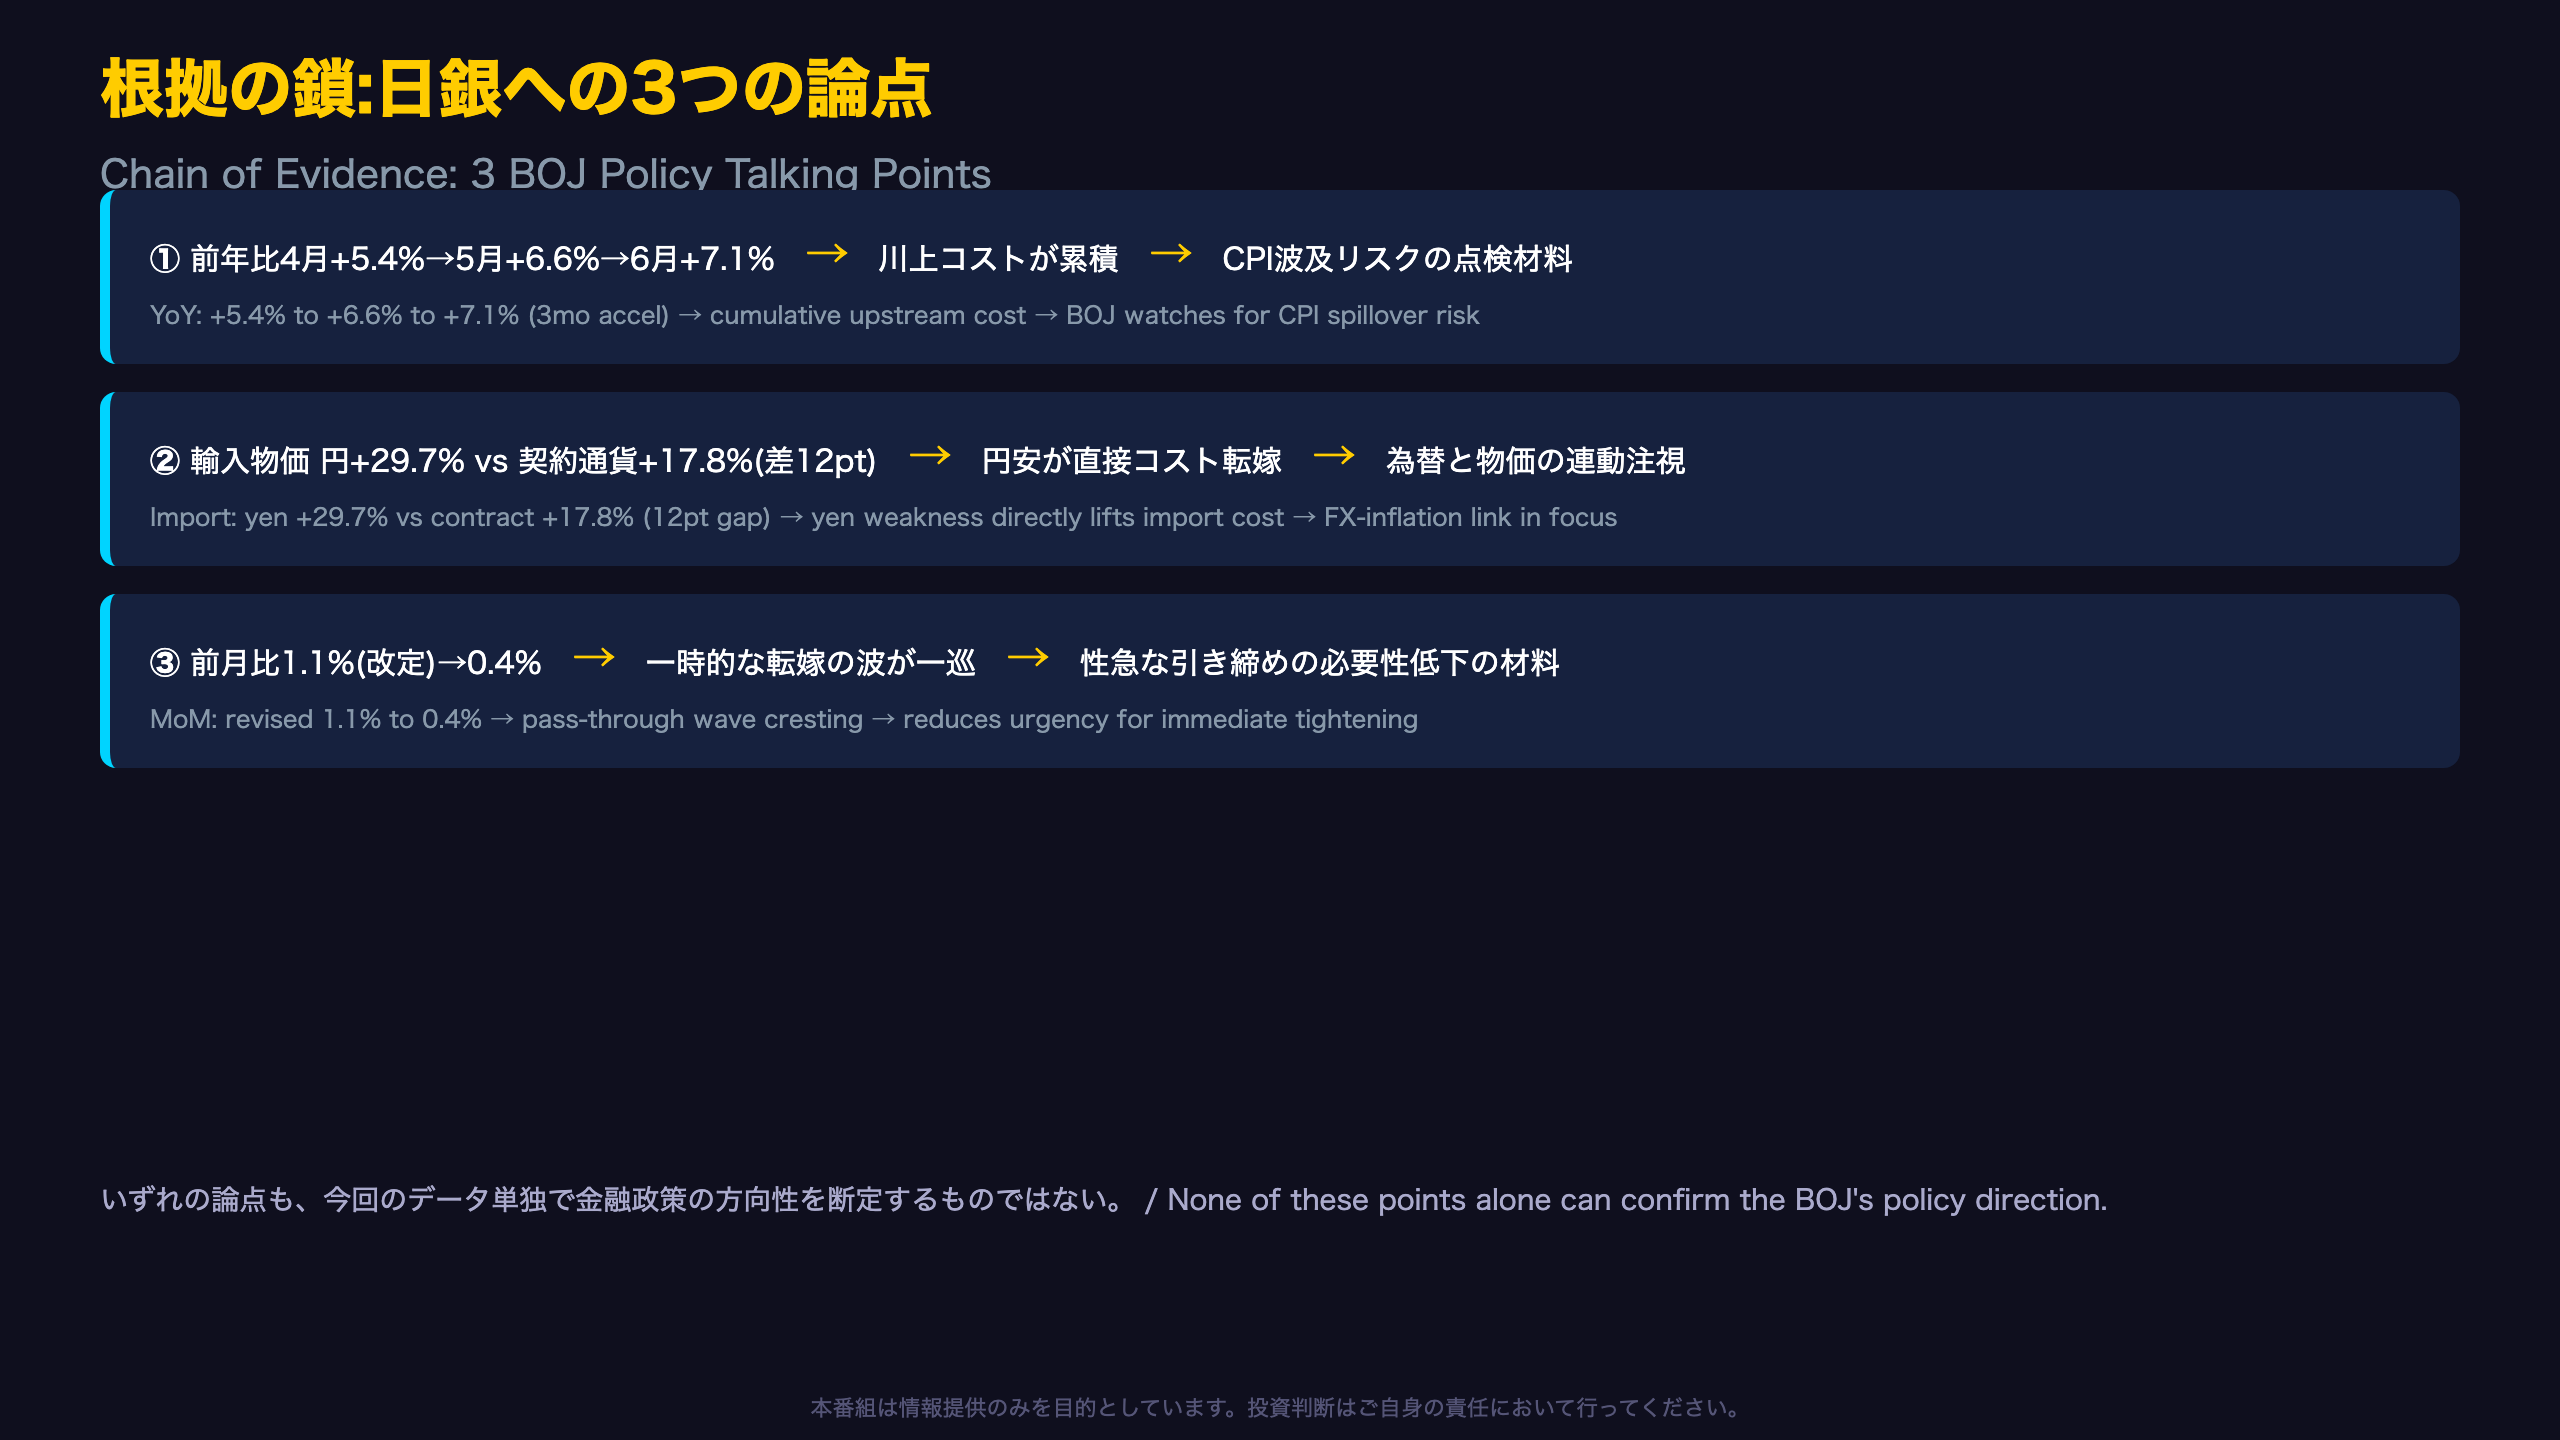
1. Three consecutive months of YoY acceleration
Fact: Domestic CGPI year-on-year rose from +5.4% (April) to +6.6% (May, revised) to +7.1% (June).
Mechanism: Upstream cost increases accumulate in manufacturers’ cost structures, building pressure for further price pass-through.
Implication: It is generally believed that sustained producer price inflation raises the risk of eventual CPI spillover, but this data alone cannot confirm how the BOJ will act at its next meeting.
2. Yen weakness explains a growing share of import inflation
Fact: Import price index rose 29.7% YoY in yen terms versus 17.8% in contract-currency terms, a 12-point gap, up from roughly 10 points in May.
Mechanism: Yen depreciation directly raises the yen-converted cost of imports, independent of any change in foreign-currency prices.
Implication: Some market participants believe that if yen weakness were to reverse, import-driven inflation could decelerate, but this is a general assumption, not something this single release can confirm.
3. Monthly deceleration
Fact: Month-on-month growth slowed from a revised 1.1% (May) to 0.4% (June), mainly due to fading contributions from chemicals and electricity.
Mechanism: Once a wave of cost pass-through is absorbed, monthly growth naturally moderates.
Implication: This deceleration could support a ‘no urgent need to tighten further’ reading, but it sits in tension with the accelerating annual trend, meaning the next release, due August 13, will be an important test of the underlying trajectory.
結論:市場への含意と次回発表
Historical Context and What Comes Next
Japan’s domestic CGPI year-on-year rate of +7.1% deserves to be viewed against recent trend history. According to the report’s own annual series, 2023’s full-year average ran around +4.4% and 2024’s around +2.4%, meaning the acceleration seen through 2026 (from +2.4% in January to +7.1% in June) represents a clear upward shift from the prior two years’ trend.
Bull and bear cases
The inflationary case: Upstream categories, non-ferrous metals, scrap, and petroleum, are all running at 20-40% year-on-year gains, raising the risk that these pressures eventually cascade into finished goods and consumer prices.
The disinflationary case: On a month-on-month basis, contributions from chemicals and electricity are fading fast, suggesting a wave of cost pass-through may already be cresting. Agricultural and marine products are also a growing drag, showing the acceleration is not uniform across categories.
Bridge to the next release
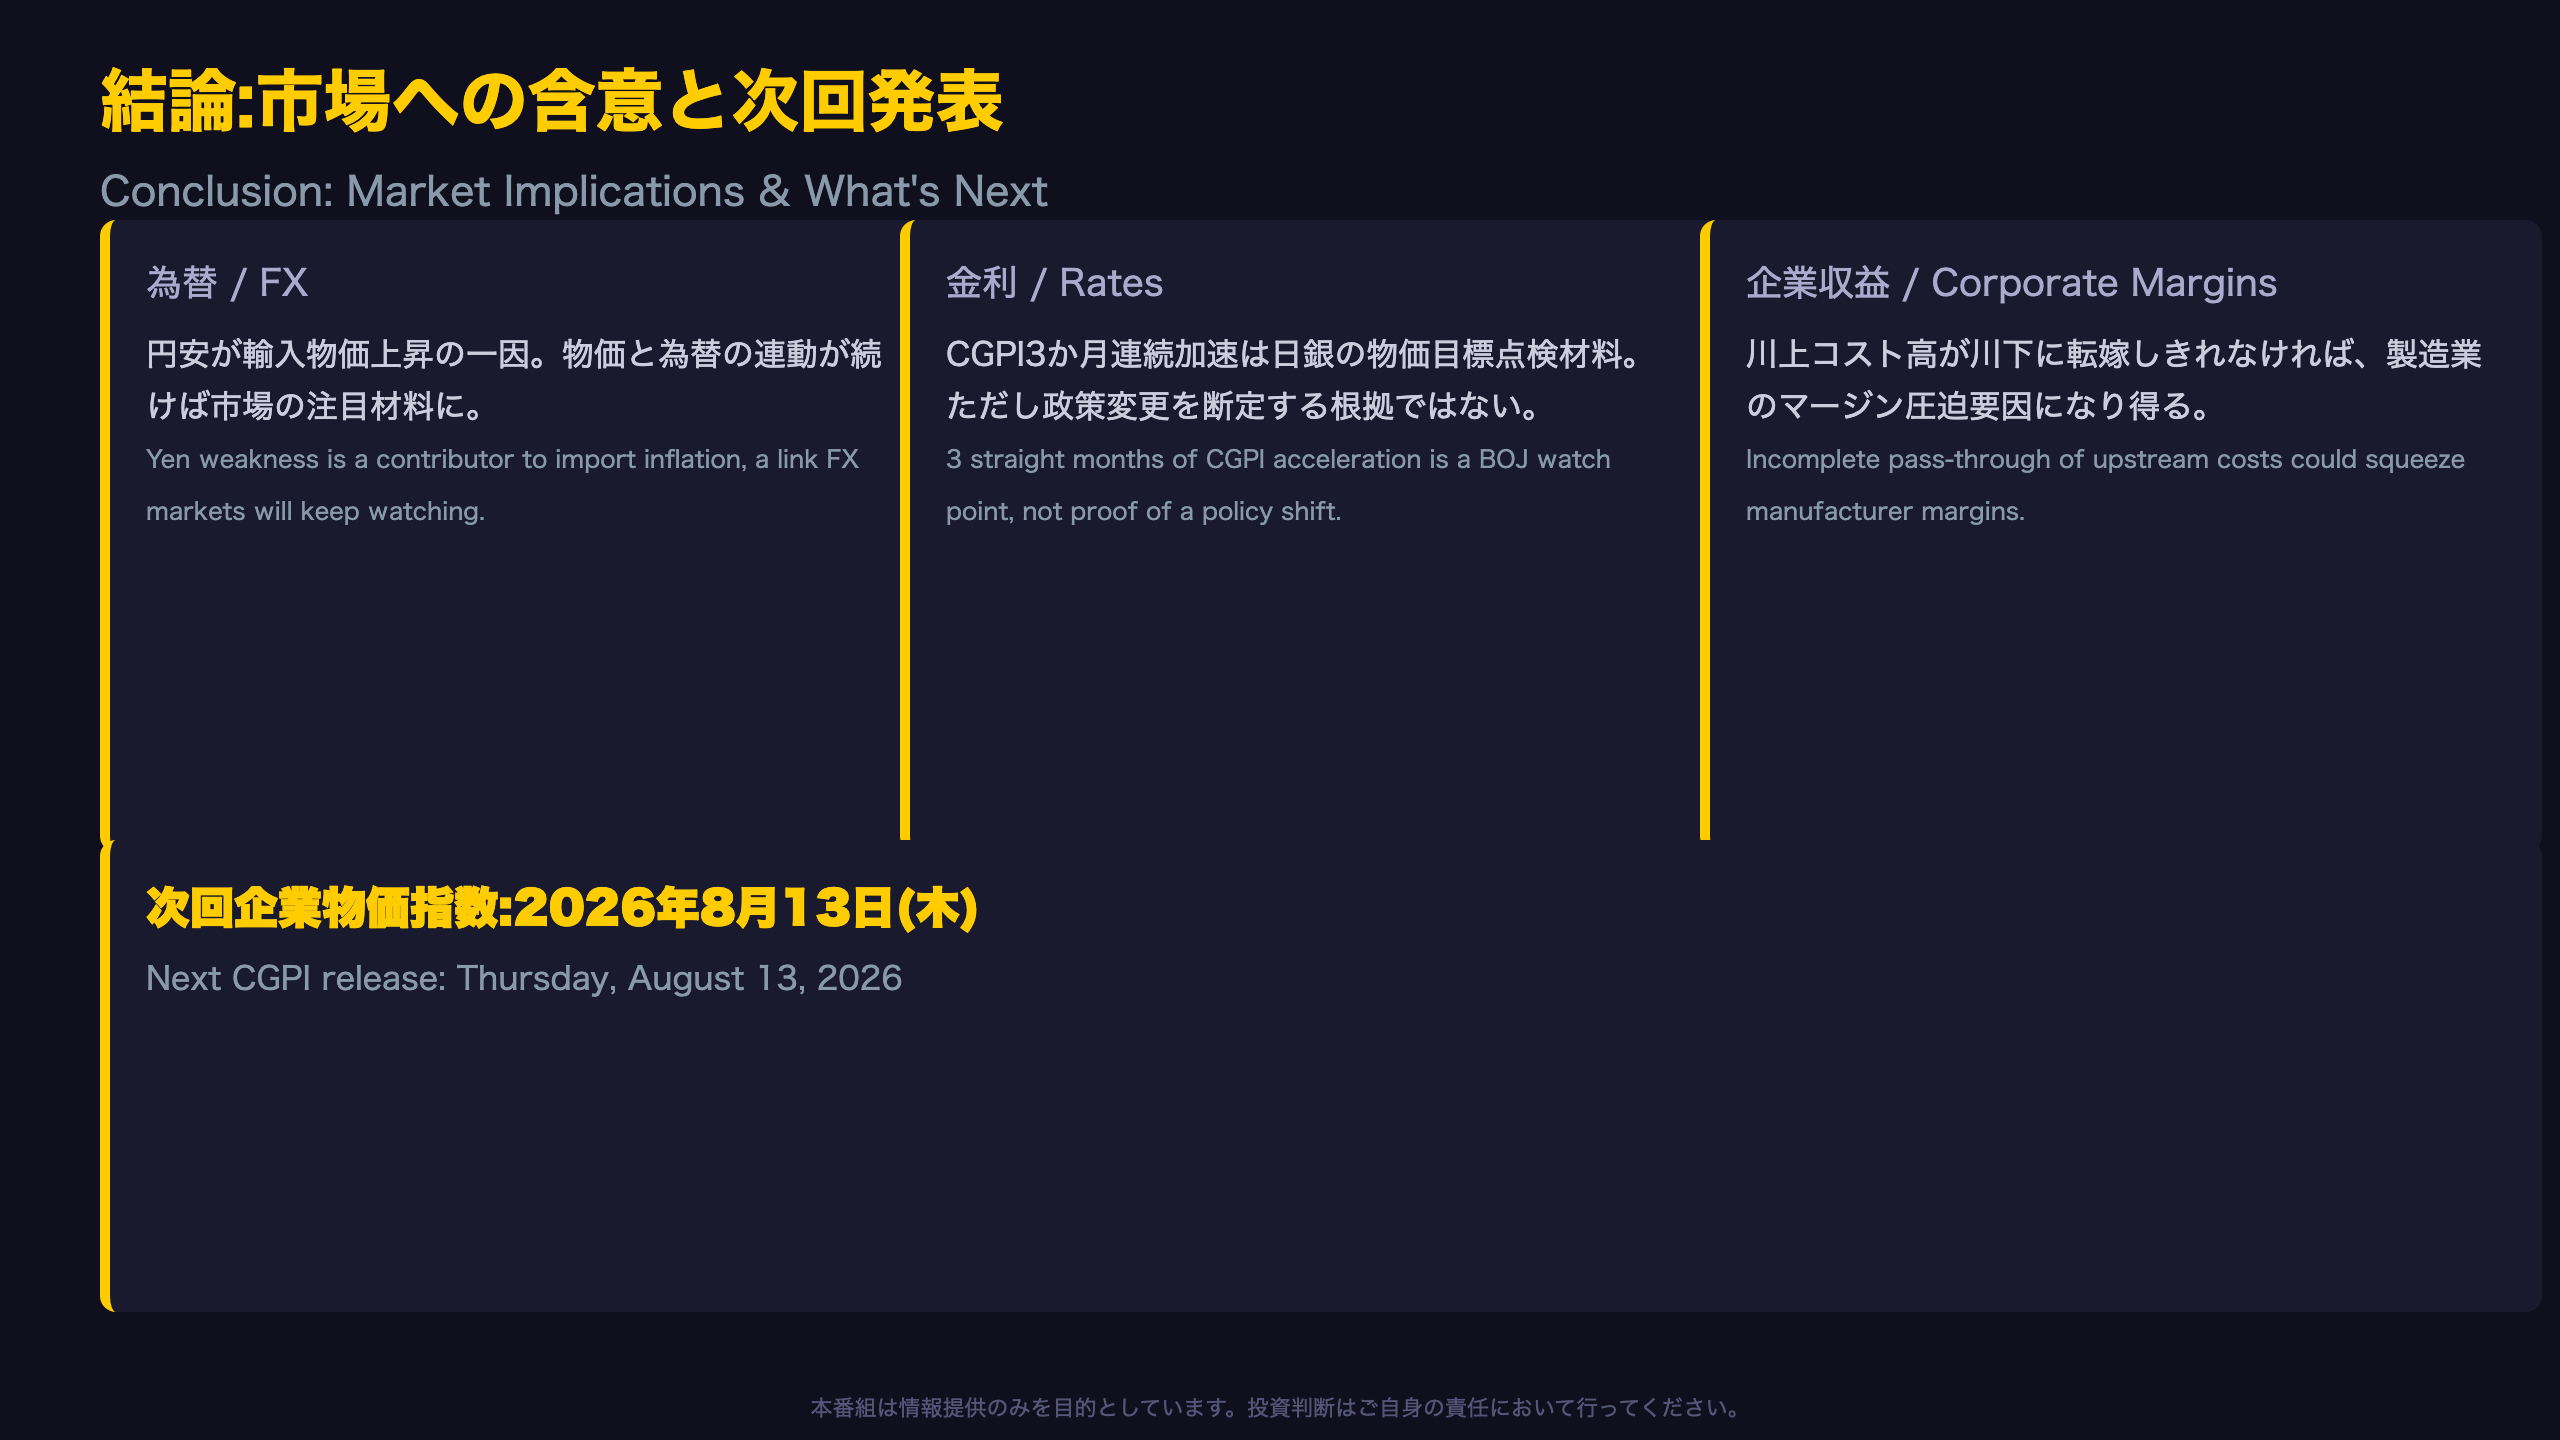
The next CGPI release is scheduled for August 13. July typically sees seasonal adjustments to summer electricity surcharges, so watch how the electricity/gas contribution evolves. Combined with upcoming CPI data and the BOJ’s Tankan survey, these releases will help clarify how far upstream cost pressure has cascaded downstream.
For international investors: a weakening yen amplifying import inflation, combined with accelerating producer prices, is a combination global bond and FX investors typically watch closely when assessing BOJ policy risk, though translating this single data point into a specific rate-path forecast would exceed what the data can support.
Disclaimer: This article is for informational purposes only. All investment decisions are made solely at your own risk.







