
📺 Watch the Full Video Analysis
This article was automatically generated by the NFC Market Live AI analysis system. (Updated: 2026-07-07 23:03 JST)
📄 Primary Source
U.S. Census Bureau
https://www.census.gov/foreign-trade/Press-Release/current_press_release/ft900.pdf
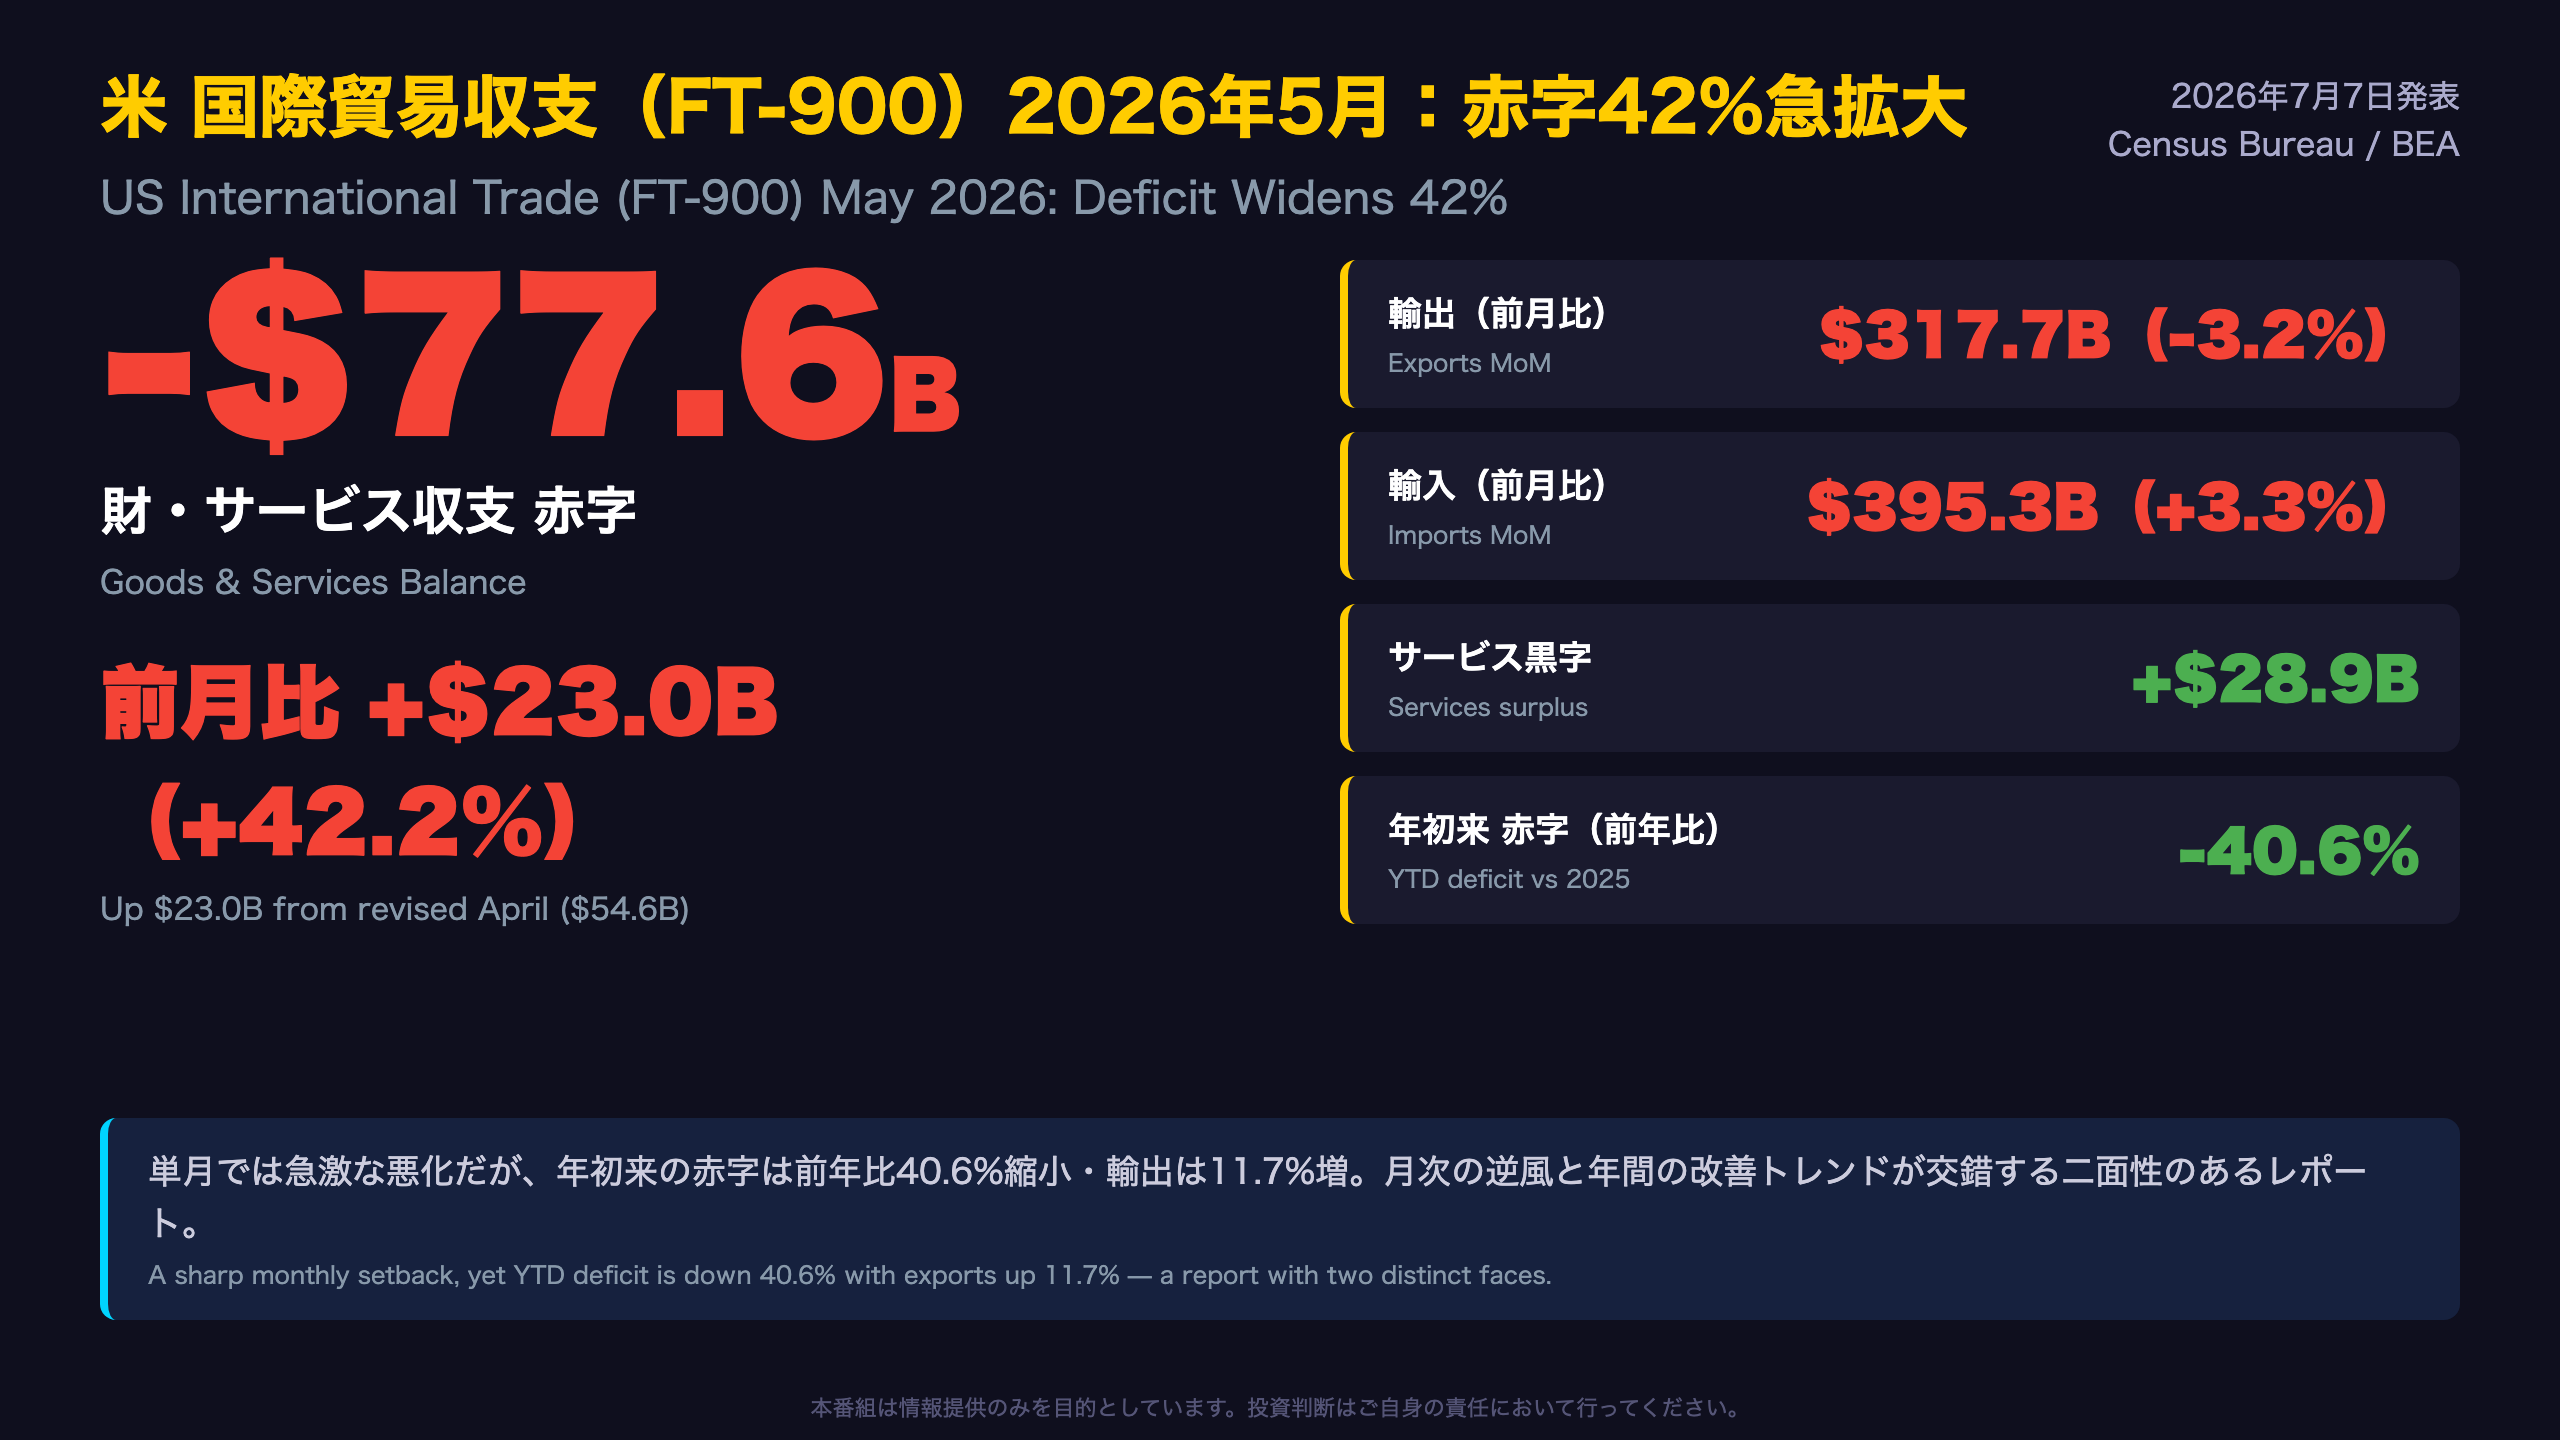
📊 The US Census Bureau and BEA released the May 2026 FT-900 trade report on July 7, 2026. The goods & services deficit widened sharply to $77.6B, up $23.0B (+42.2%) from April.
📉 Exports fell $10.5B to $317.7B, driven by a $6.2B drop in nonmonetary gold and a $4.1B decline in computers/accessories. Imports rose $12.5B to $395.3B.
📈 Yet year-to-date, the deficit is down 40.6% vs 2025 — a striking divergence between monthly deterioration and annual improvement.
💊 Pharma imports collapsed YTD (-$87.3B), deficits concentrated in Taiwan & Vietnam, and the Switzerland balance flipped from surplus to deficit.
💡 We break down what this means for Q2 GDP, net exports, and markets.
The Ultimate Summary:赤字42%急拡大の正体
Understanding the FT-900: America’s Most GDP-Sensitive Trade Report
The FT-900 is the joint monthly release from the US Census Bureau and the Bureau of Economic Analysis (BEA), and it is the primary source data for the net exports component of US GDP. When this number swings, GDP nowcasts move with it.
The headline in context
May’s $77.6B deficit is a jarring 42.2% jump from April’s revised $54.6B. But zoom out: through the first four months of 2026, the monthly deficit had been remarkably stable in a $54–57B range — dramatically below the $60–133B monthly readings seen through 2025. Year-to-date, the deficit is down a striking 40.6% versus the same period of 2025, with exports up 11.7% and imports down 2.1%.
Why the three-month average matters
The release notes the three-month moving average deficit rose $7.5B to $62.9B — but that is still $23.8B below the average for the three months ending May 2025. For investors accustomed to volatile monthly trade prints (a lesson US markets learned painfully during the 2025 gold-flow distortions), the smoothed series is the better trend gauge.
Comparison for global readers
Unlike Japan or Germany, the US runs a persistent structural goods deficit offset partially by a large services surplus ($28.9B in May). The services surplus has been a steady $26–29B per month for over two years — a stabilizing anchor beneath volatile goods flows.
Next release: August 4, 2026.
Deep Dive①:輸出減の正体は「金とコンピュータ」の反動

Anatomy of the Export Drop: Two Items, Not a Broad Slump
The gold story global investors should know
Nonmonetary gold — physical gold crossing US customs, distinct from central-bank monetary gold — fell $6.2B in May, roughly halving from April’s $11.9B to $5.8B. Year-to-date gold exports total $64.4B, a stunning 2.3x the $28.3B recorded in the same period of 2025. This mirrors the massive gold-flow distortions that whipsawed US trade data in early 2025, when arbitrage between London and New York vaults inflated and deflated monthly readings. The May decline reads as normalization, not weakness.
Tech exports: payback after a boom
Computers (-$2.1B) and computer accessories (-$2.0B) drove the capital goods decline. But the YTD picture is remarkable: computer exports are up $13.7B (+91%) and accessories up $12.6B (+57%) versus 2025. Semiconductor exports are also up $6.9B YTD. One soft month against that backdrop does not break the trend — though it bears watching whether AI-related hardware demand is plateauing.
Energy: the quiet outperformer
Crude oil exports rose $2.0B in May, with volumes at 5.71 million barrels per day (vs 3.57M a year earlier) and unit prices at $107.85/barrel, up from $62.08 in January. For FX watchers, strong energy exports remain a structural support for the dollar’s trade fundamentals.
Services exports also hit a record $107.1B, led by travel (+$0.4B) — a reminder that the US surplus engine keeps compounding.
Deep Dive②:輸入増は「広範」──消費・自動車・半導体

The Import Side: A Thermometer for US Domestic Demand
Broad-based gains
May’s $12.3B rise in goods imports spanned nearly every end-use category: consumer goods +$3.5B, industrial supplies +$3.1B, autos +$2.2B, capital goods +$1.1B. For macro watchers, breadth matters more than magnitude — when US households and businesses pull in more foreign goods across the board, it typically signals demand resilience rather than distress. Real (inflation-adjusted) imports rose 1.9%, confirming volume growth.
The pharma normalization story
Pharmaceutical imports rose $1.9B in May, but the YTD picture is extraordinary: $69.7B versus $157.0B a year earlier — a $87.3B collapse. Early 2025 saw massive front-running of anticipated tariffs, particularly via Ireland (a global pharma manufacturing hub for US drugmakers). Imports from Ireland are down from $84.1B to $24.4B YTD. This single factor explains most of the improvement in the 2026 US trade deficit, a nuance often missed in headline commentary.
AI hardware: first crack or pause?
Capital goods imports are up $151.9B YTD (+34%), with computers +$85.7B and telecom equipment +$21.4B — consistent with the AI datacenter buildout. May’s $3.4B drop in computer imports is the first meaningful interruption. One month is insufficient to call a turn, but semiconductor and accessories imports still rose, suggesting reallocation within the tech complex rather than retrenchment.
Autos
Passenger car imports rose $1.0B in May, though YTD they remain down $12.0B versus 2025 — Japan and South Korea remain the largest sources at $14.5B and $13.0B YTD respectively.
Deep Dive③:国別収支──台湾・ベトナムに赤字集中、スイスは黒字→赤字転換

The Deficit’s New Geography: From China to the Chip Belt
Taiwan doubles, China halves
For readers tracking the US-China decoupling narrative, this report offers hard numbers. The YTD deficit with China has narrowed from $102.3B to $58.3B, while the Taiwan deficit has more than doubled to $98.5B — now nearly twice the China gap and on pace to become America’s largest bilateral deficit. Vietnam ($94.4B YTD) tells the same story from the assembly side. The Advanced Technology Products (Exhibit 16a) data confirm the driver: the ATP deficit with Taiwan alone is $87.3B YTD, dominated by information and communications products.
The Switzerland whipsaw
Switzerland’s balance swung from a $4.4B US surplus in April to a $2.3B deficit in May as US exports there collapsed $6.9B. Switzerland is the world’s gold-refining hub, and this reversal is the bilateral fingerprint of the nonmonetary gold unwind discussed earlier. YTD, the US runs a $16.7B surplus with Switzerland versus a $46.0B deficit a year ago — a $63B swing driven almost entirely by bullion.
Europe: the pharma dividend
The EU deficit has shrunk 77% YTD, from $138.7B to $31.7B. Ireland accounts for the bulk (from -$77.2B to -$15.0B), but Germany also improved. For EUR watchers, a structurally smaller US-EU imbalance reduces one perennial source of transatlantic trade friction — though tariff policy remains the wild card.
NAFTA neighbors
The Mexico deficit widened $5.3B in May to $20.1B, with imports hitting $53.5B. Canada’s deficit was comparatively modest at $7.0B.
インプリケーション:Q2 GDPと市場への示唆

Market Implications: Following the Chain of Evidence
GDP: the arithmetic is unfriendly for Q2
[Real goods exports -6.6%, real imports +1.9% (Exhibit 11)] → [net exports enter the GDP identity directly] → [drag on Q2 GDP]. This chain holds mechanically. The mitigating factors: April’s deficit was small ($54.6B), diluting May’s swing in the quarterly average, and the BEA will use the Advance Economic Indicators Report for June when compiling the advance Q2 GDP estimate. Forecasters using GDPNow-style models will mark down net-export contributions on this report, but the quarter is not decided by one month.
The dollar: two-sided
The 40.6% YTD deficit reduction is a genuine improvement in US external balances — structurally dollar-supportive. Conventionally, a re-widening deficit is considered a dollar headwind, but this single data point cannot confirm a trend shift, especially given the outsized role of gold-flow distortions in both the improvement and the May reversal.
Sector reads
- AI/Semis: The $3.4B drop in computer imports is the first interruption in a $85.7B YTD surge. Accessories and semiconductor imports still rose, so this looks more like mix-shift than capex retreat — but if it repeats on August 4, the signal strengthens.
- Energy: Crude export volumes up ~60% YoY with unit prices at $107.85/bbl. US energy remains a growing external revenue engine.
- Pharma/Ireland: The base effect from 2025’s tariff front-running will fade from H2 comparisons, meaning YTD deficit improvement rates will naturally compress.
What to watch on August 4
- Does nonmonetary gold stabilize in the $5–6B range? 2. Does the computer import decline persist? 3. Does the 3-month average deficit re-widen beyond $62.9B?
Disclaimer: This article is for informational purposes only. All investment decisions are made solely at your own risk.







