📺 Watch the Full Video Analysis
This article was automatically generated by the NFC Market Live AI analysis system. (Updated: 2026-07-07 14:15 JST)
📄 Primary Source
内閣府経済社会総合研究所
https://www.esri.cao.go.jp/jp/stat/di/202605psummary.pdf
Deep dive into Japan’s May 2026 Composite Index (CI), released by the Cabinet Office’s ESRI. The Coincident Index rose to 118.5, marking a 3rd straight monthly gain, with the official assessment upgraded to ‘Improving.’ 📊 The Leading Index extended its streak to 12 consecutive months of gains, signaling continued resilience. 📈 However, capital goods shipments and the job openings ratio both softened, hinting at emerging cracks in investment and labor demand. 💡 We break down all 10 coincident sub-indices to reveal the real story behind the headline number — and what it means for BOJ policy and markets. ⚠️
景気の現在地:一致指数「改善」も内訳に温度差
The Big Picture: Japan’s Coincident Index Turns ‘Improving’
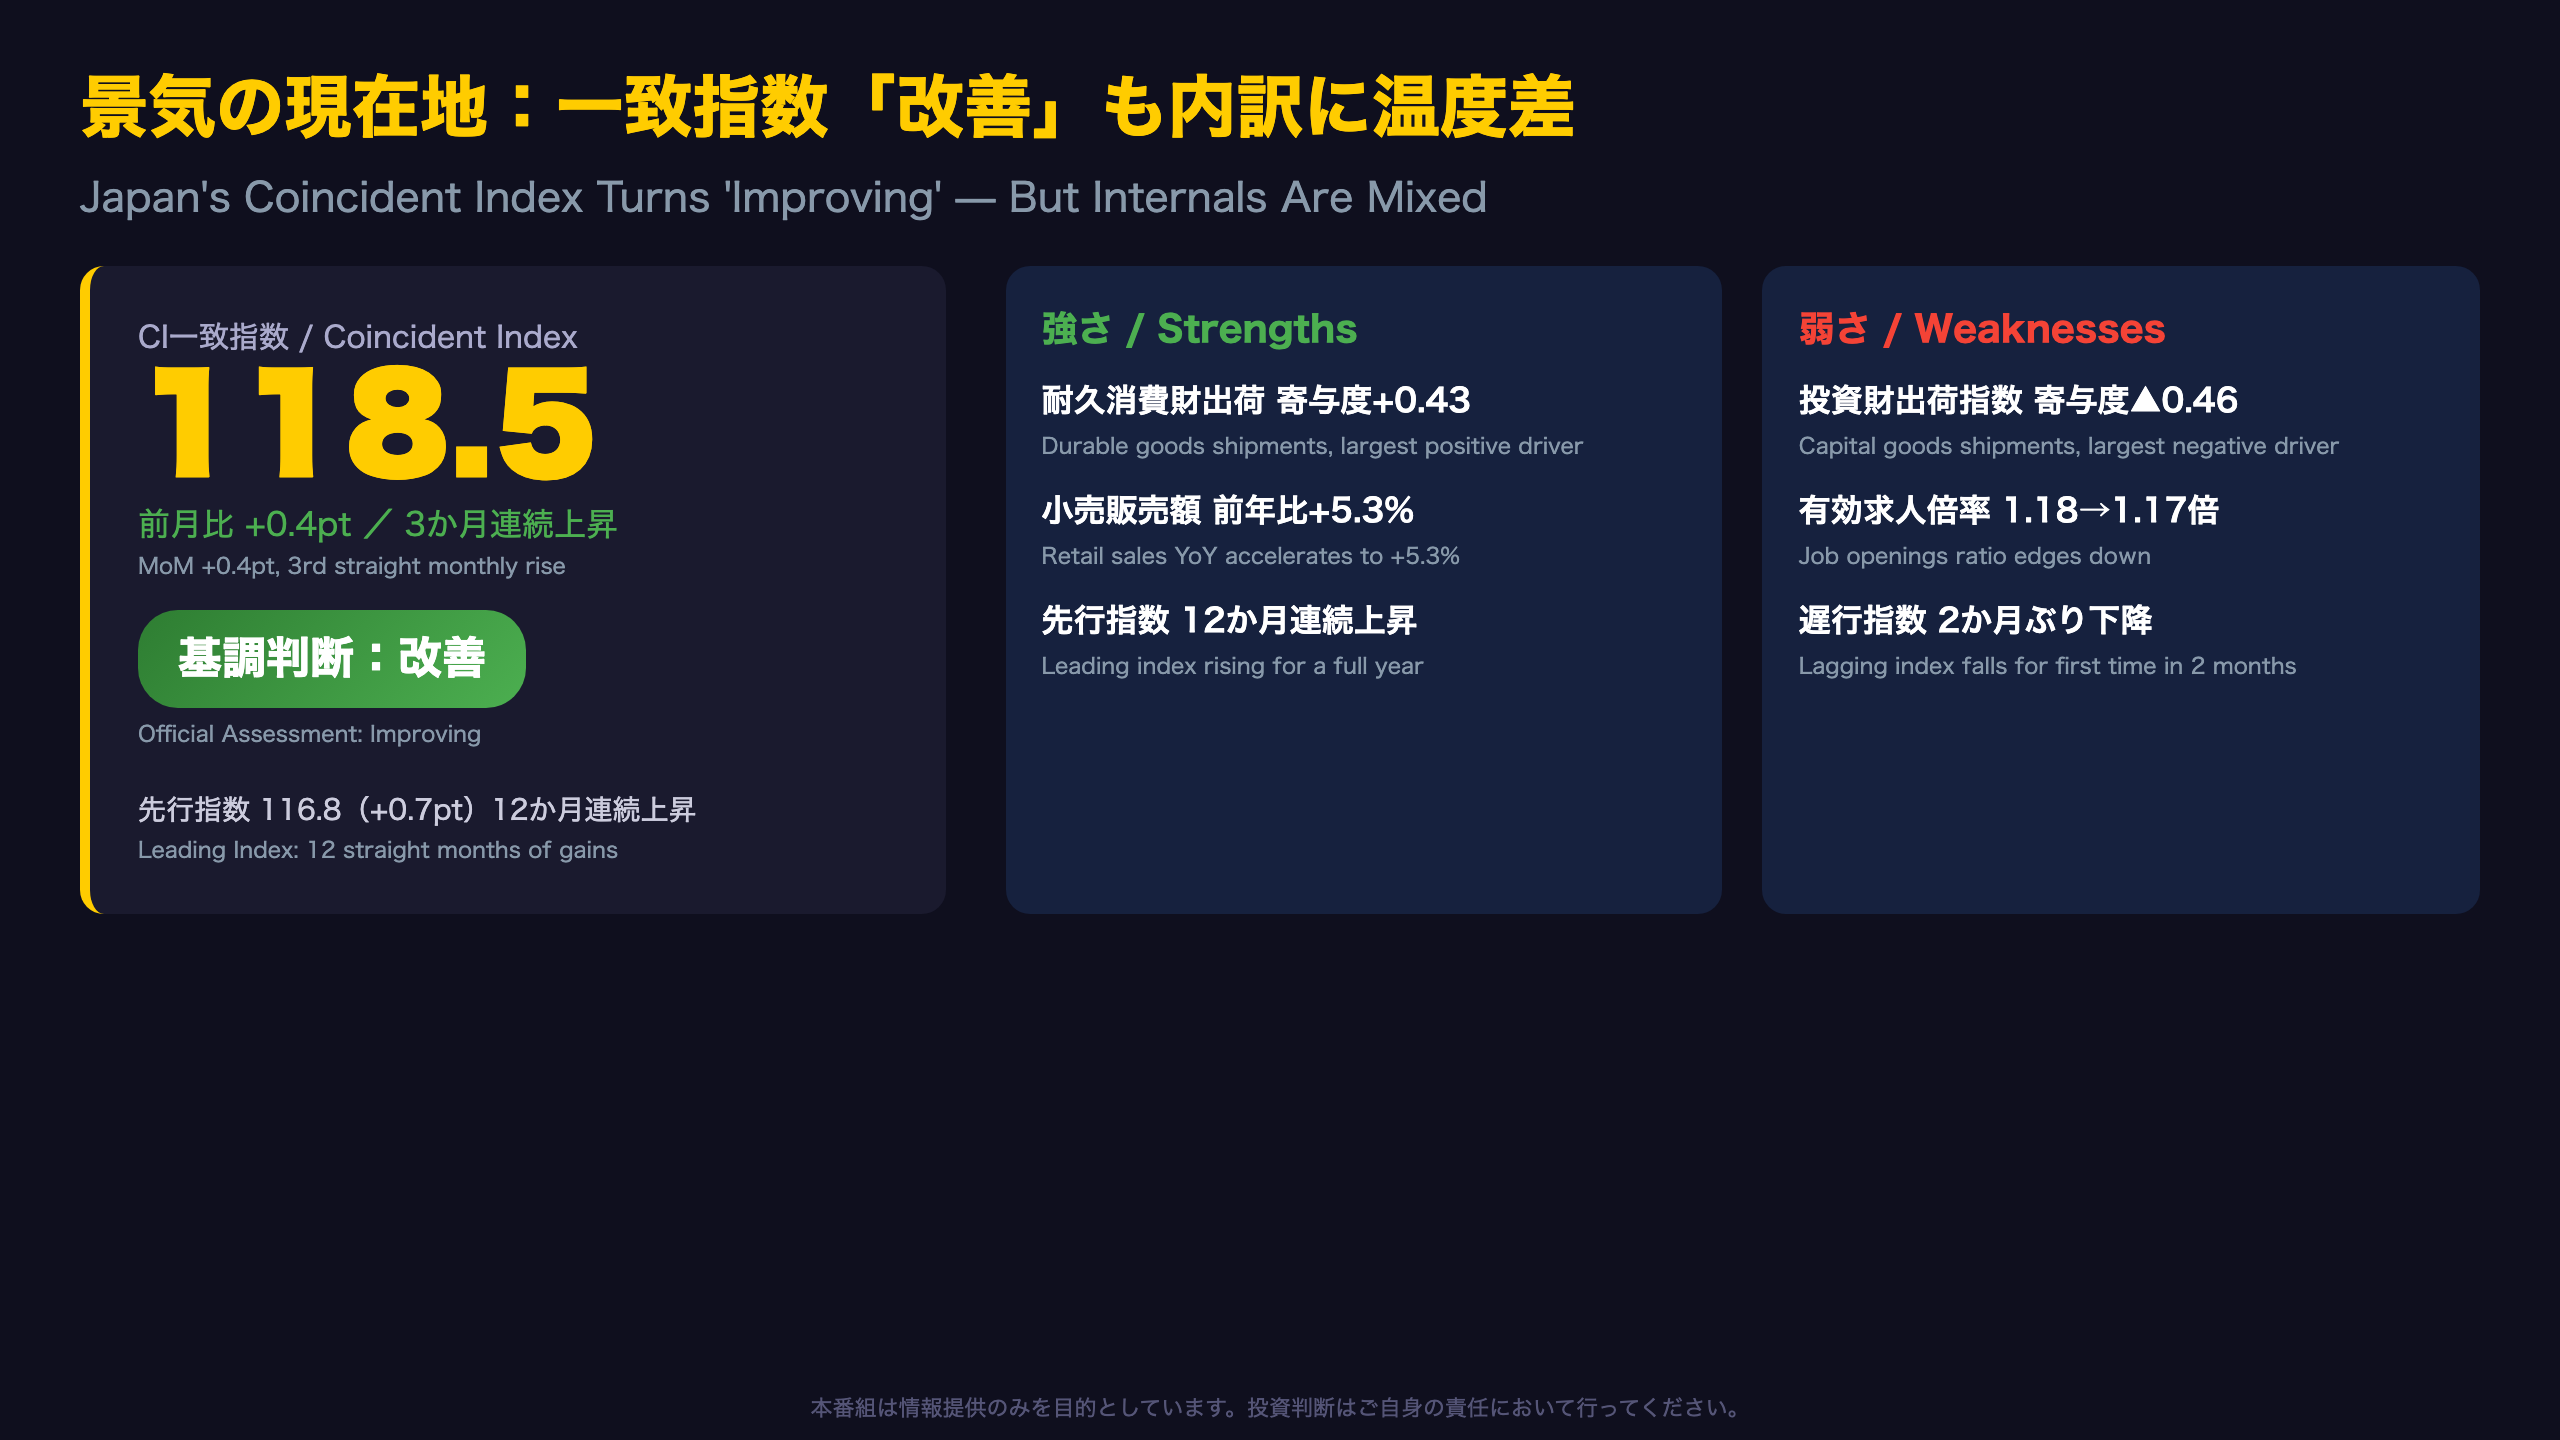
On July 7, 2026, Japan’s Cabinet Office — through its Economic and Social Research Institute (ESRI) — released the preliminary Composite Index (CI) for May 2026. The Coincident Index rose to 118.5 (2020=100), up 0.4 points month-on-month, a third consecutive monthly gain. The official qualitative assessment was upgraded to ‘Improving’ (改善).
For readers unfamiliar with Japanese macro statistics: the CI is Japan’s rough equivalent of a coincident economic indicator system, similar in spirit to the U.S. Conference Board’s indices, but interpreted through a rules-based classification (Improving / Pausing / Phase Change / Worsening / Bottoming Out) rather than a single recession-probability headline.
“The Composite Index (Coincident Index, preliminary), synthesizing 10 indicators including production and employment, rose 0.4 points month-on-month in May, marking a third consecutive month of increase.” — Cabinet Office ESRI
A Nuanced Read
While the headline is positive, decomposing the 10 series reveals a split: durable goods (+0.43) and retail sales (+0.34) drove the gain, while capital goods shipments (-0.46) and the job openings ratio (-0.19) dragged. This is not broad-based acceleration, but consumption-led strength offsetting investment-side softness.
Comparison to the U.S. Framework
Unlike ISM PMI or nonfarm payrolls, which markets parse for immediate rate signals, Japan’s CI feeds more indirectly into BOJ policy discussions alongside the Tankan survey and wage data. Investors should treat this release as trend confirmation, not a standalone catalyst for JPY or JGB moves.
一致指数、3か月連続上昇で「改善」に格上げ
From ‘Turning Point’ to ‘Improving’: The Revision Story
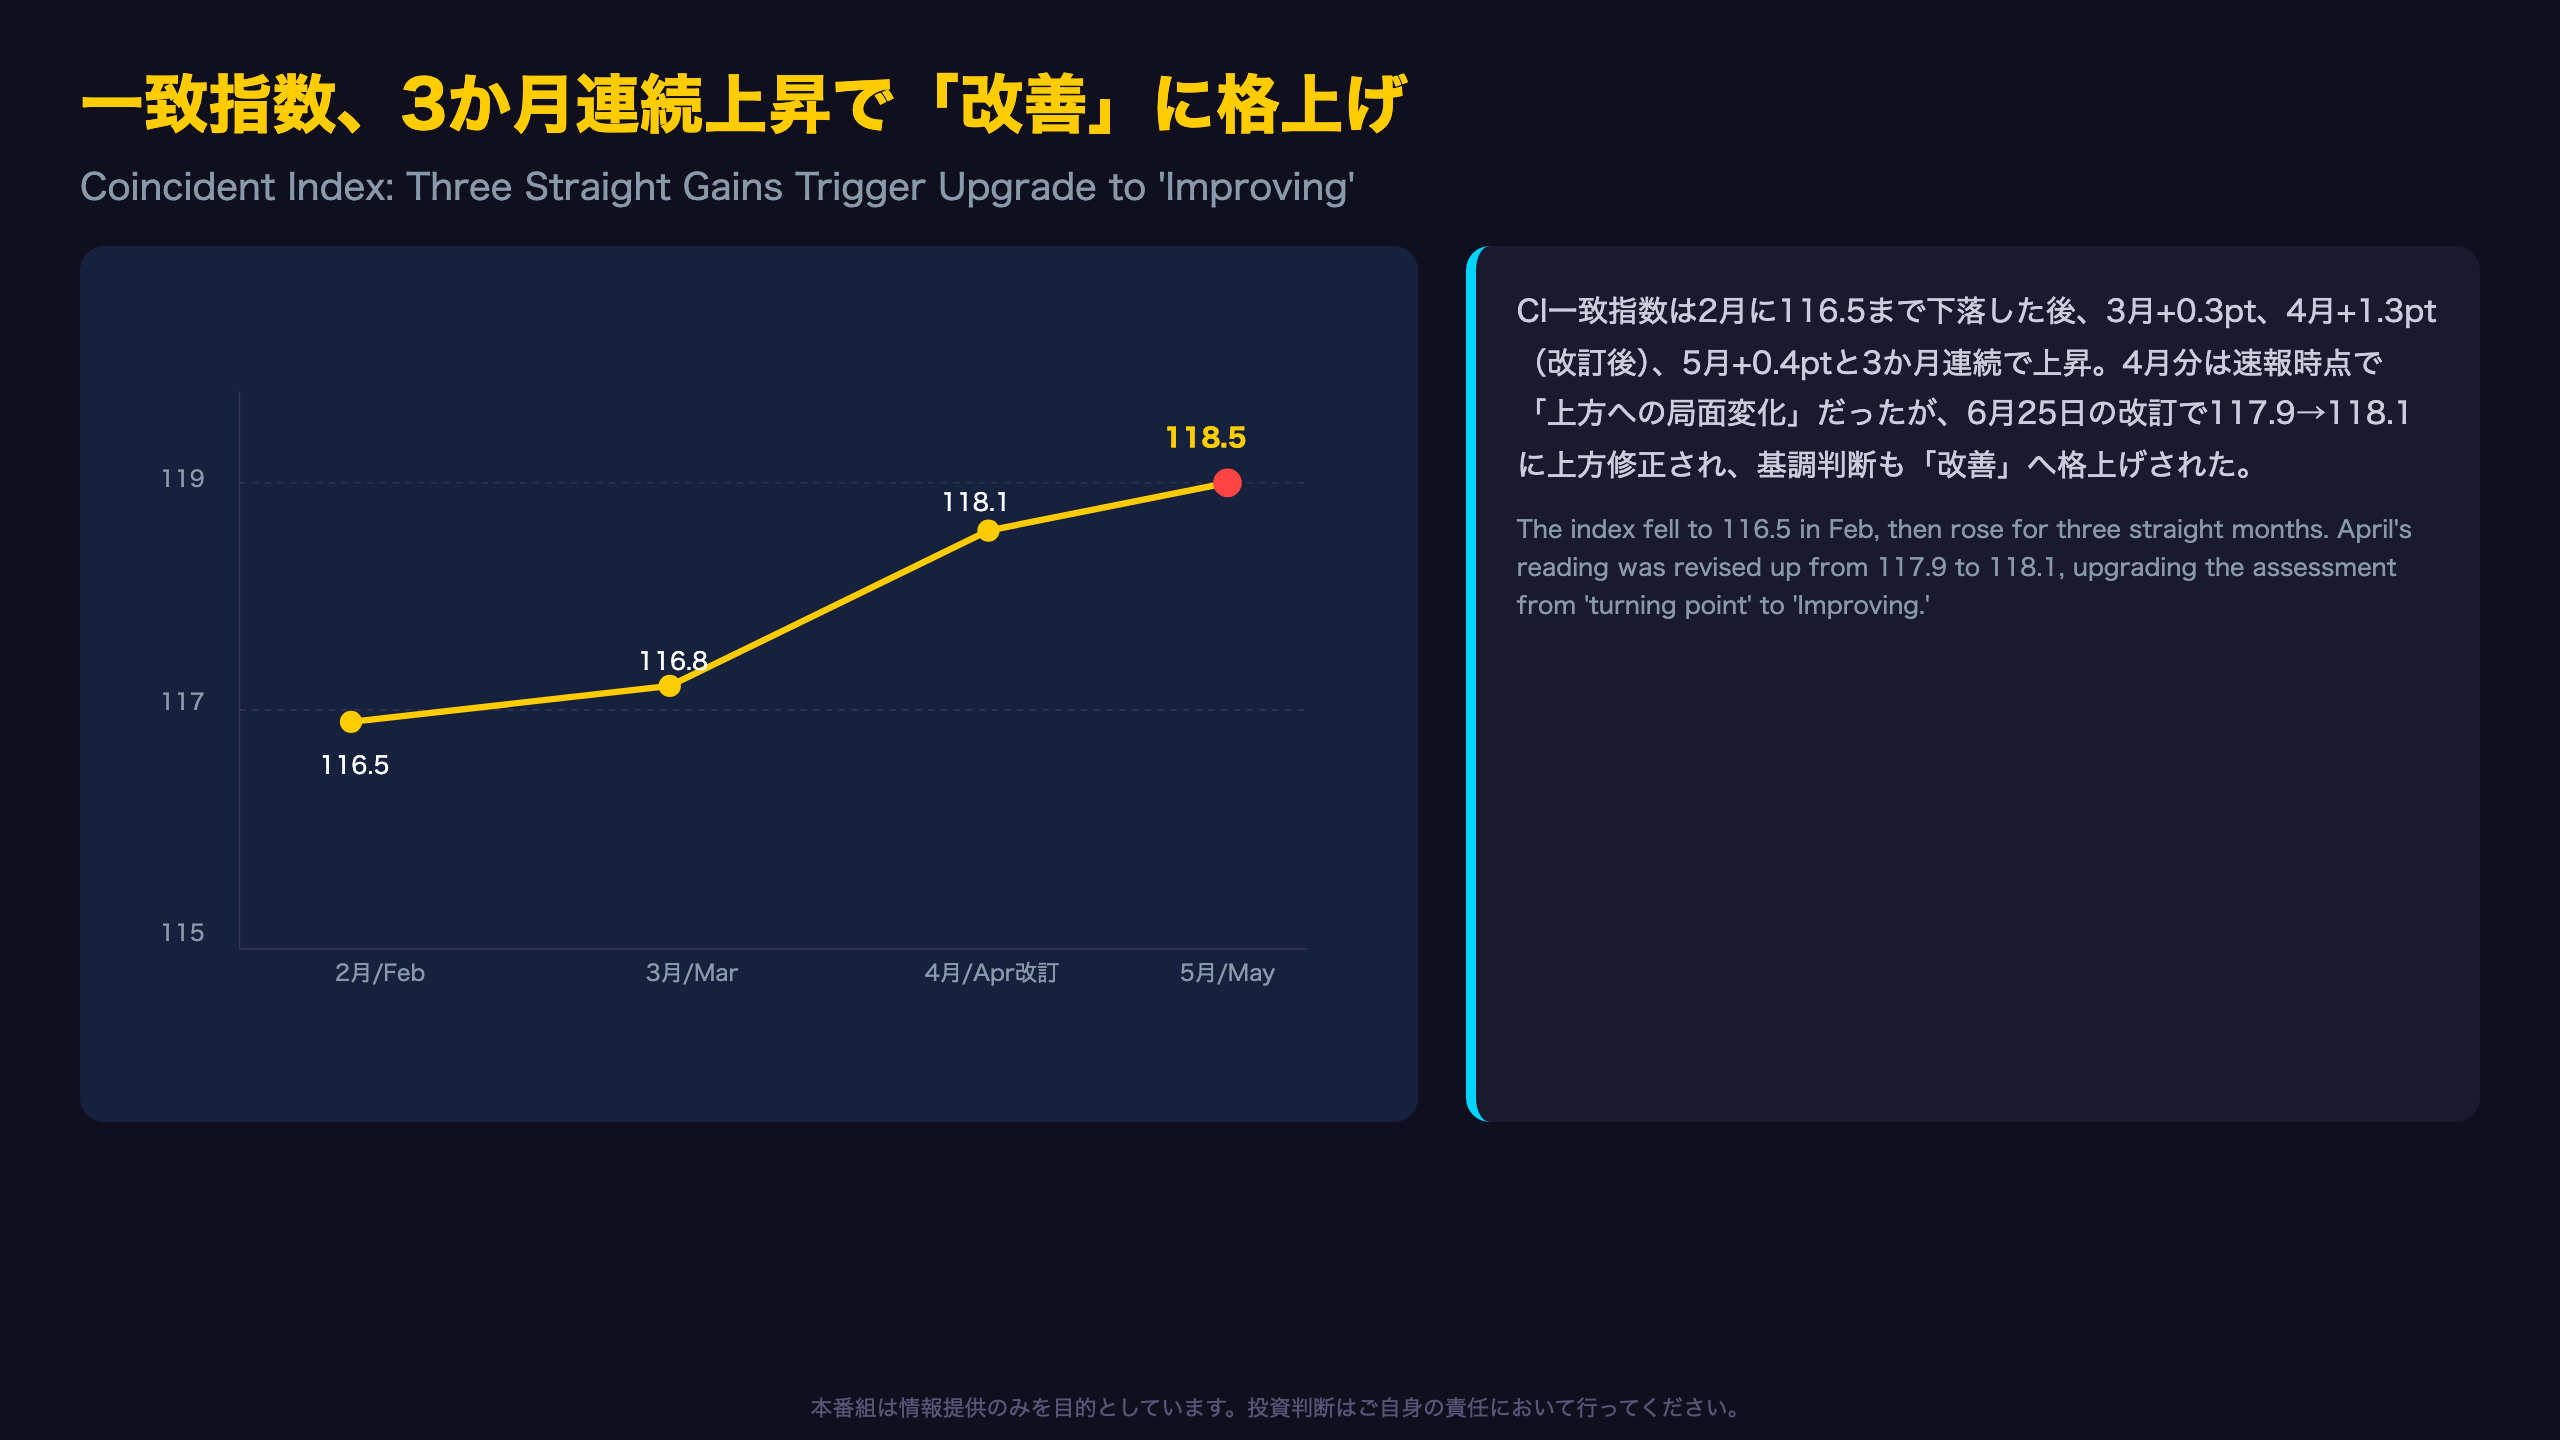
Japan’s CI assessment framework uses a five-tier classification based on 3-month and 7-month moving averages of the Coincident Index. In April, the preliminary reading only triggered a cautious ‘Upward Phase Change’ (上方への局面変化) — implying a trough may have occurred in prior months, but with lower confidence than ‘Improving.’
That changed on June 25, 2026, when the Cabinet Office issued its confirmed revision: April’s Coincident Index was revised up from 117.9 to 118.1, and the assessment was upgraded retroactively to ‘Improving.’
“Assessment: The Composite Index (CI Coincident Index) shows Improving. (Upgraded from the preliminary assessment of ‘Upward Phase Change’)” — ESRI Revision Report, June 25, 2026
Why Revisions Matter for International Investors
Japan frequently revises preliminary indicators as underlying component series (e.g., tertiary industry activity, real machinery orders) are finalized — analogous to how U.S. GDP ‘advance’ estimates are revised in later releases. Traders reacting to Japan macro headlines should treat preliminary CI prints with a wider confidence band than final data.
Statistical Context
The standard deviation of the 3-month moving average change (1985-2025) is 1.08 points. May’s +0.67 reading sits comfortably within one standard deviation, suggesting a steady, not extraordinary, improvement — an important caveat against over-interpreting a single data point as a structural inflection.
先行指数は12か月連続上昇、景気の先行きに明るさ
Leading Index: Twelve Months of Uninterrupted Gains
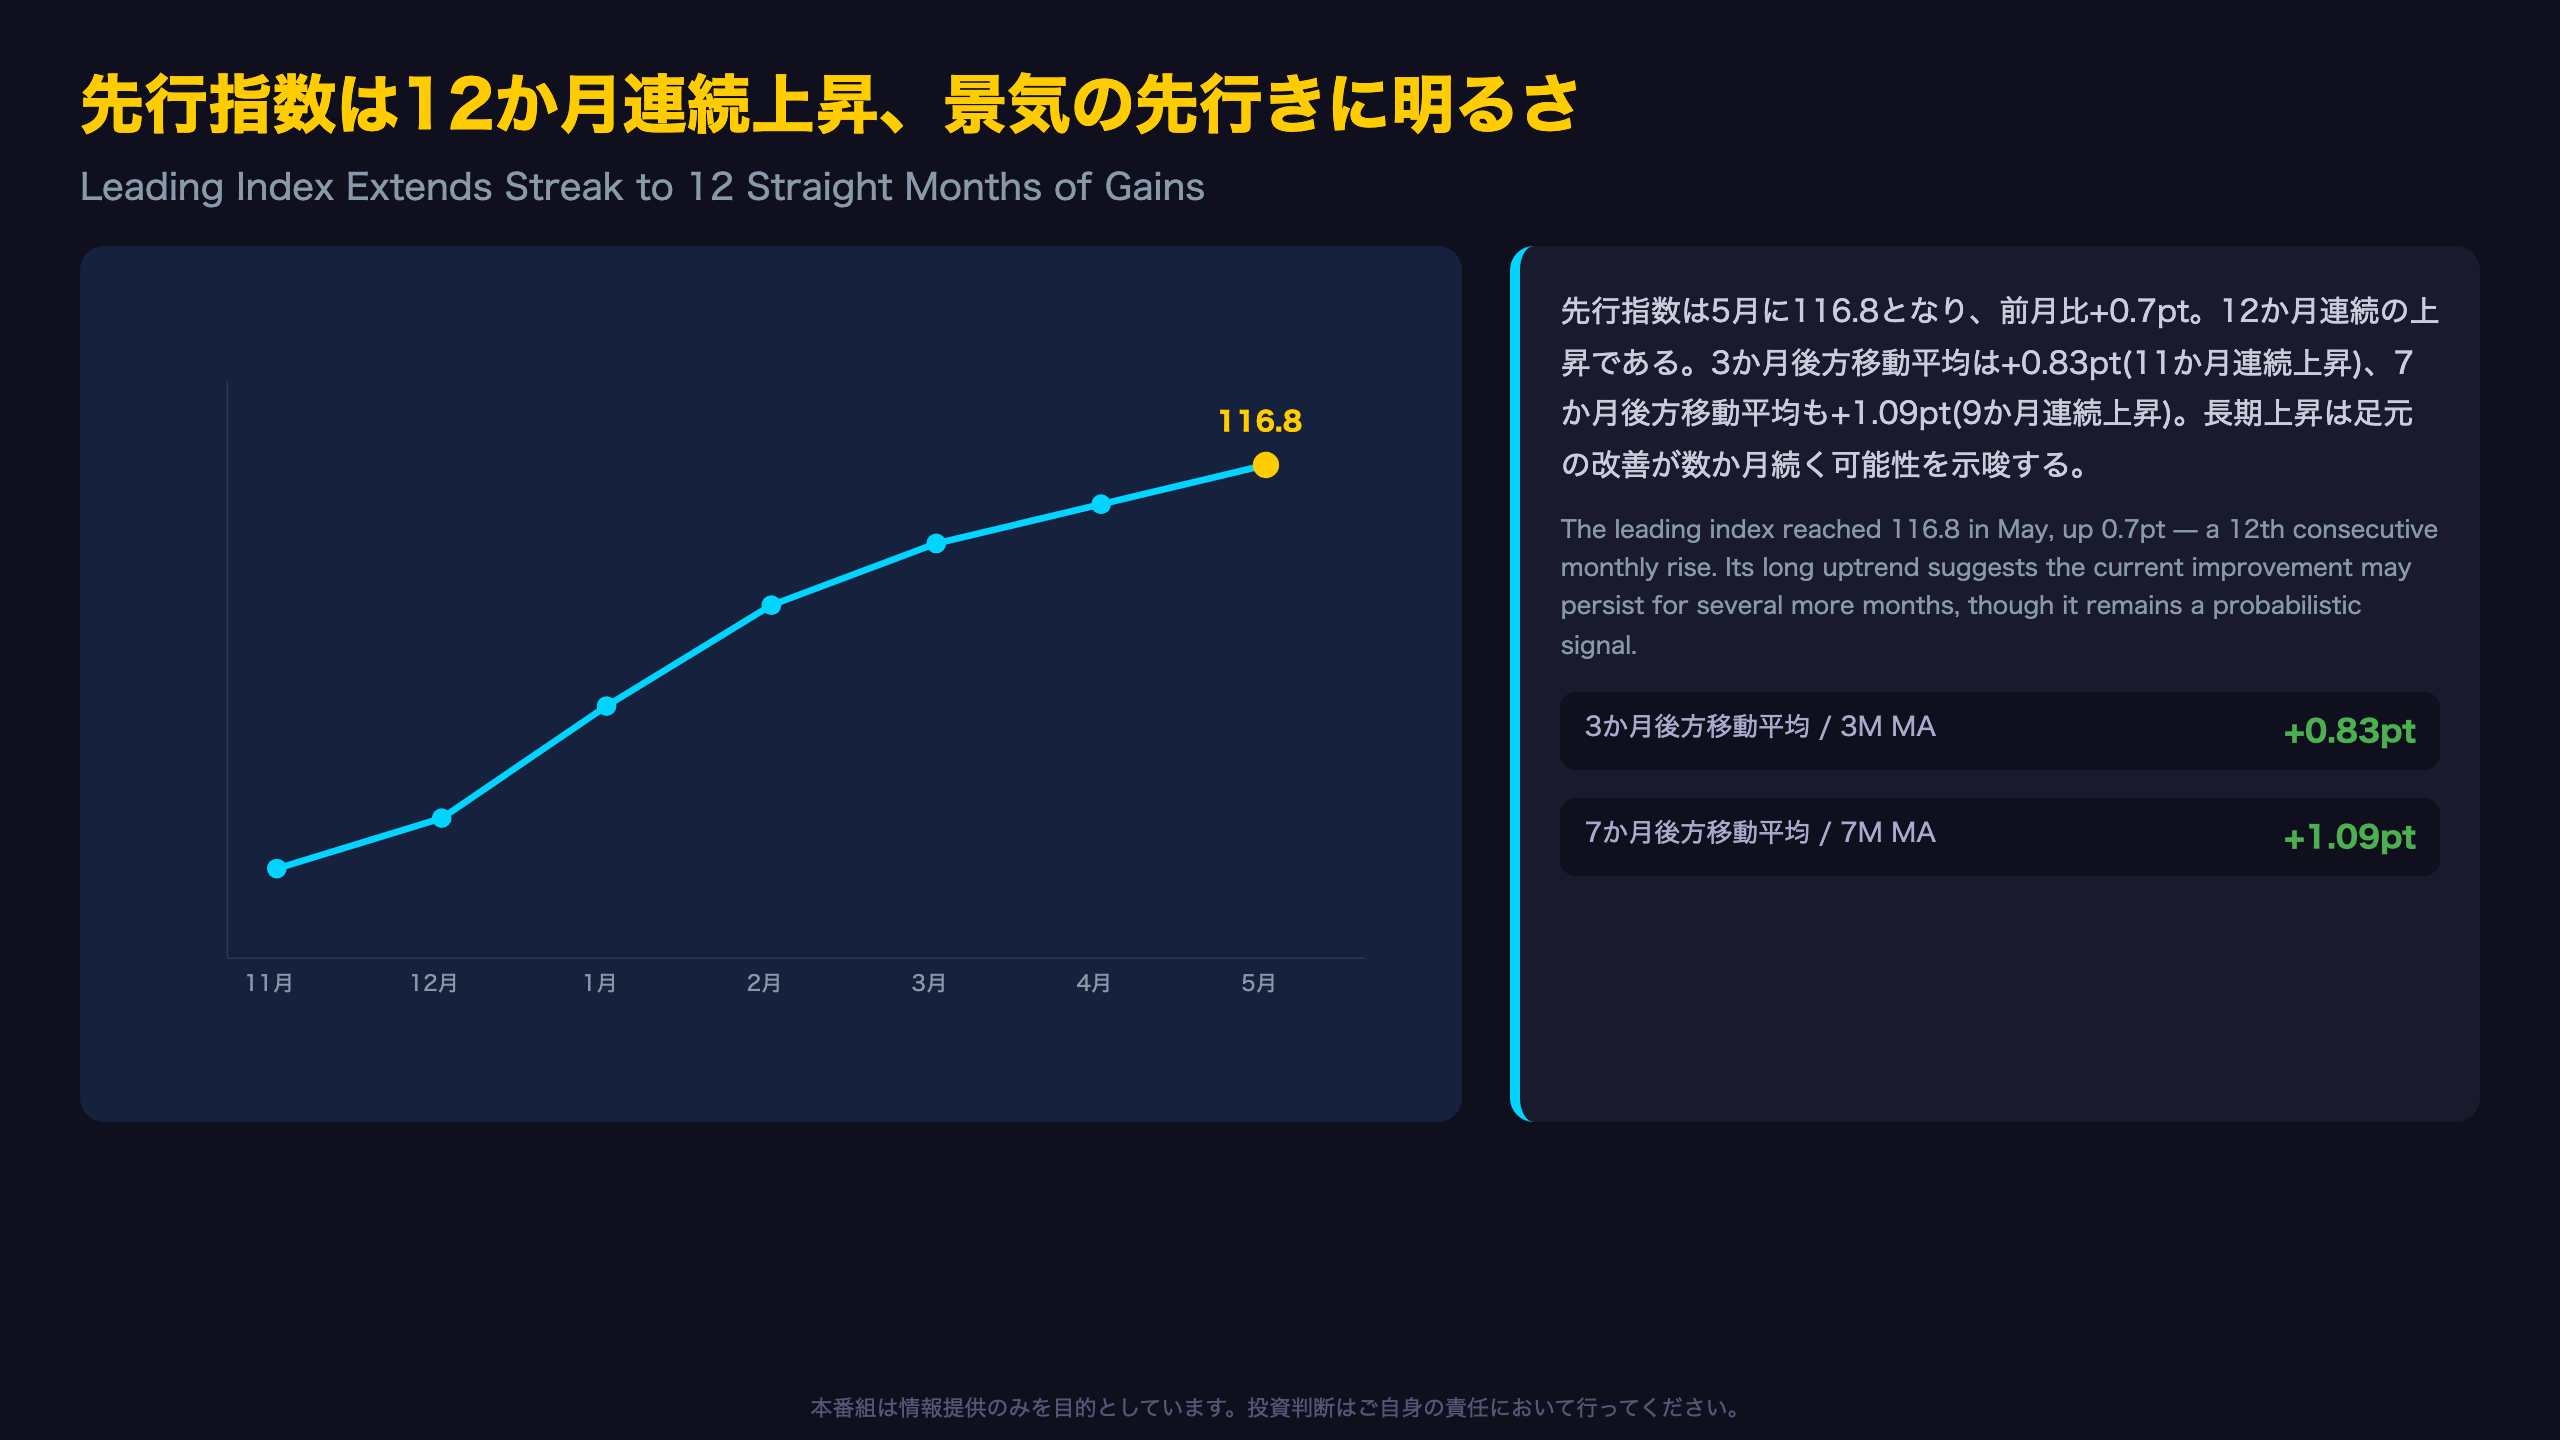
Japan’s Leading Index — composed of 11 sub-series including inventory ratios, new job openings, real machinery orders, the Nikkei Stock Average, and money supply (M2) — rose to 116.8 in May, up 0.7 points and marking its 12th consecutive monthly increase.
This is a meaningfully long streak. The 3-month moving average has risen for 11 straight months (+0.83pt), and the 7-month moving average for 9 straight months (+1.09pt) — both timeframes confirming a durable, broad-based upward trend rather than a one-off bounce.
Sub-Index Detail Not Covered in the Main Narrative
Within the April data, the Commodity Price Index (L7, +0.64 contribution) and the Manufacturing Investment Environment Index (L10, +0.66) were the largest positive drivers, while the Consumer Confidence Index (L6, -0.42) and new housing starts floor area (L5, -0.52) detracted. This illustrates that even within a rising leading index, sentiment components can diverge from hard-data components.
What This Means Internationally
Leading indicators in most economies (OECD CLI, U.S. Conference Board LEI) are watched for early recession/expansion signals. Japan’s Leading Index serves a similar function but is explicitly designed to feed the Cabinet Office’s rules-based assessment rather than a market-facing probability model. A 12-month uptrend is a constructive signal for the growth outlook, though currency markets typically react more to BOJ rate-path expectations than to CI prints directly.
押し上げの主役:耐久消費財と小売販売
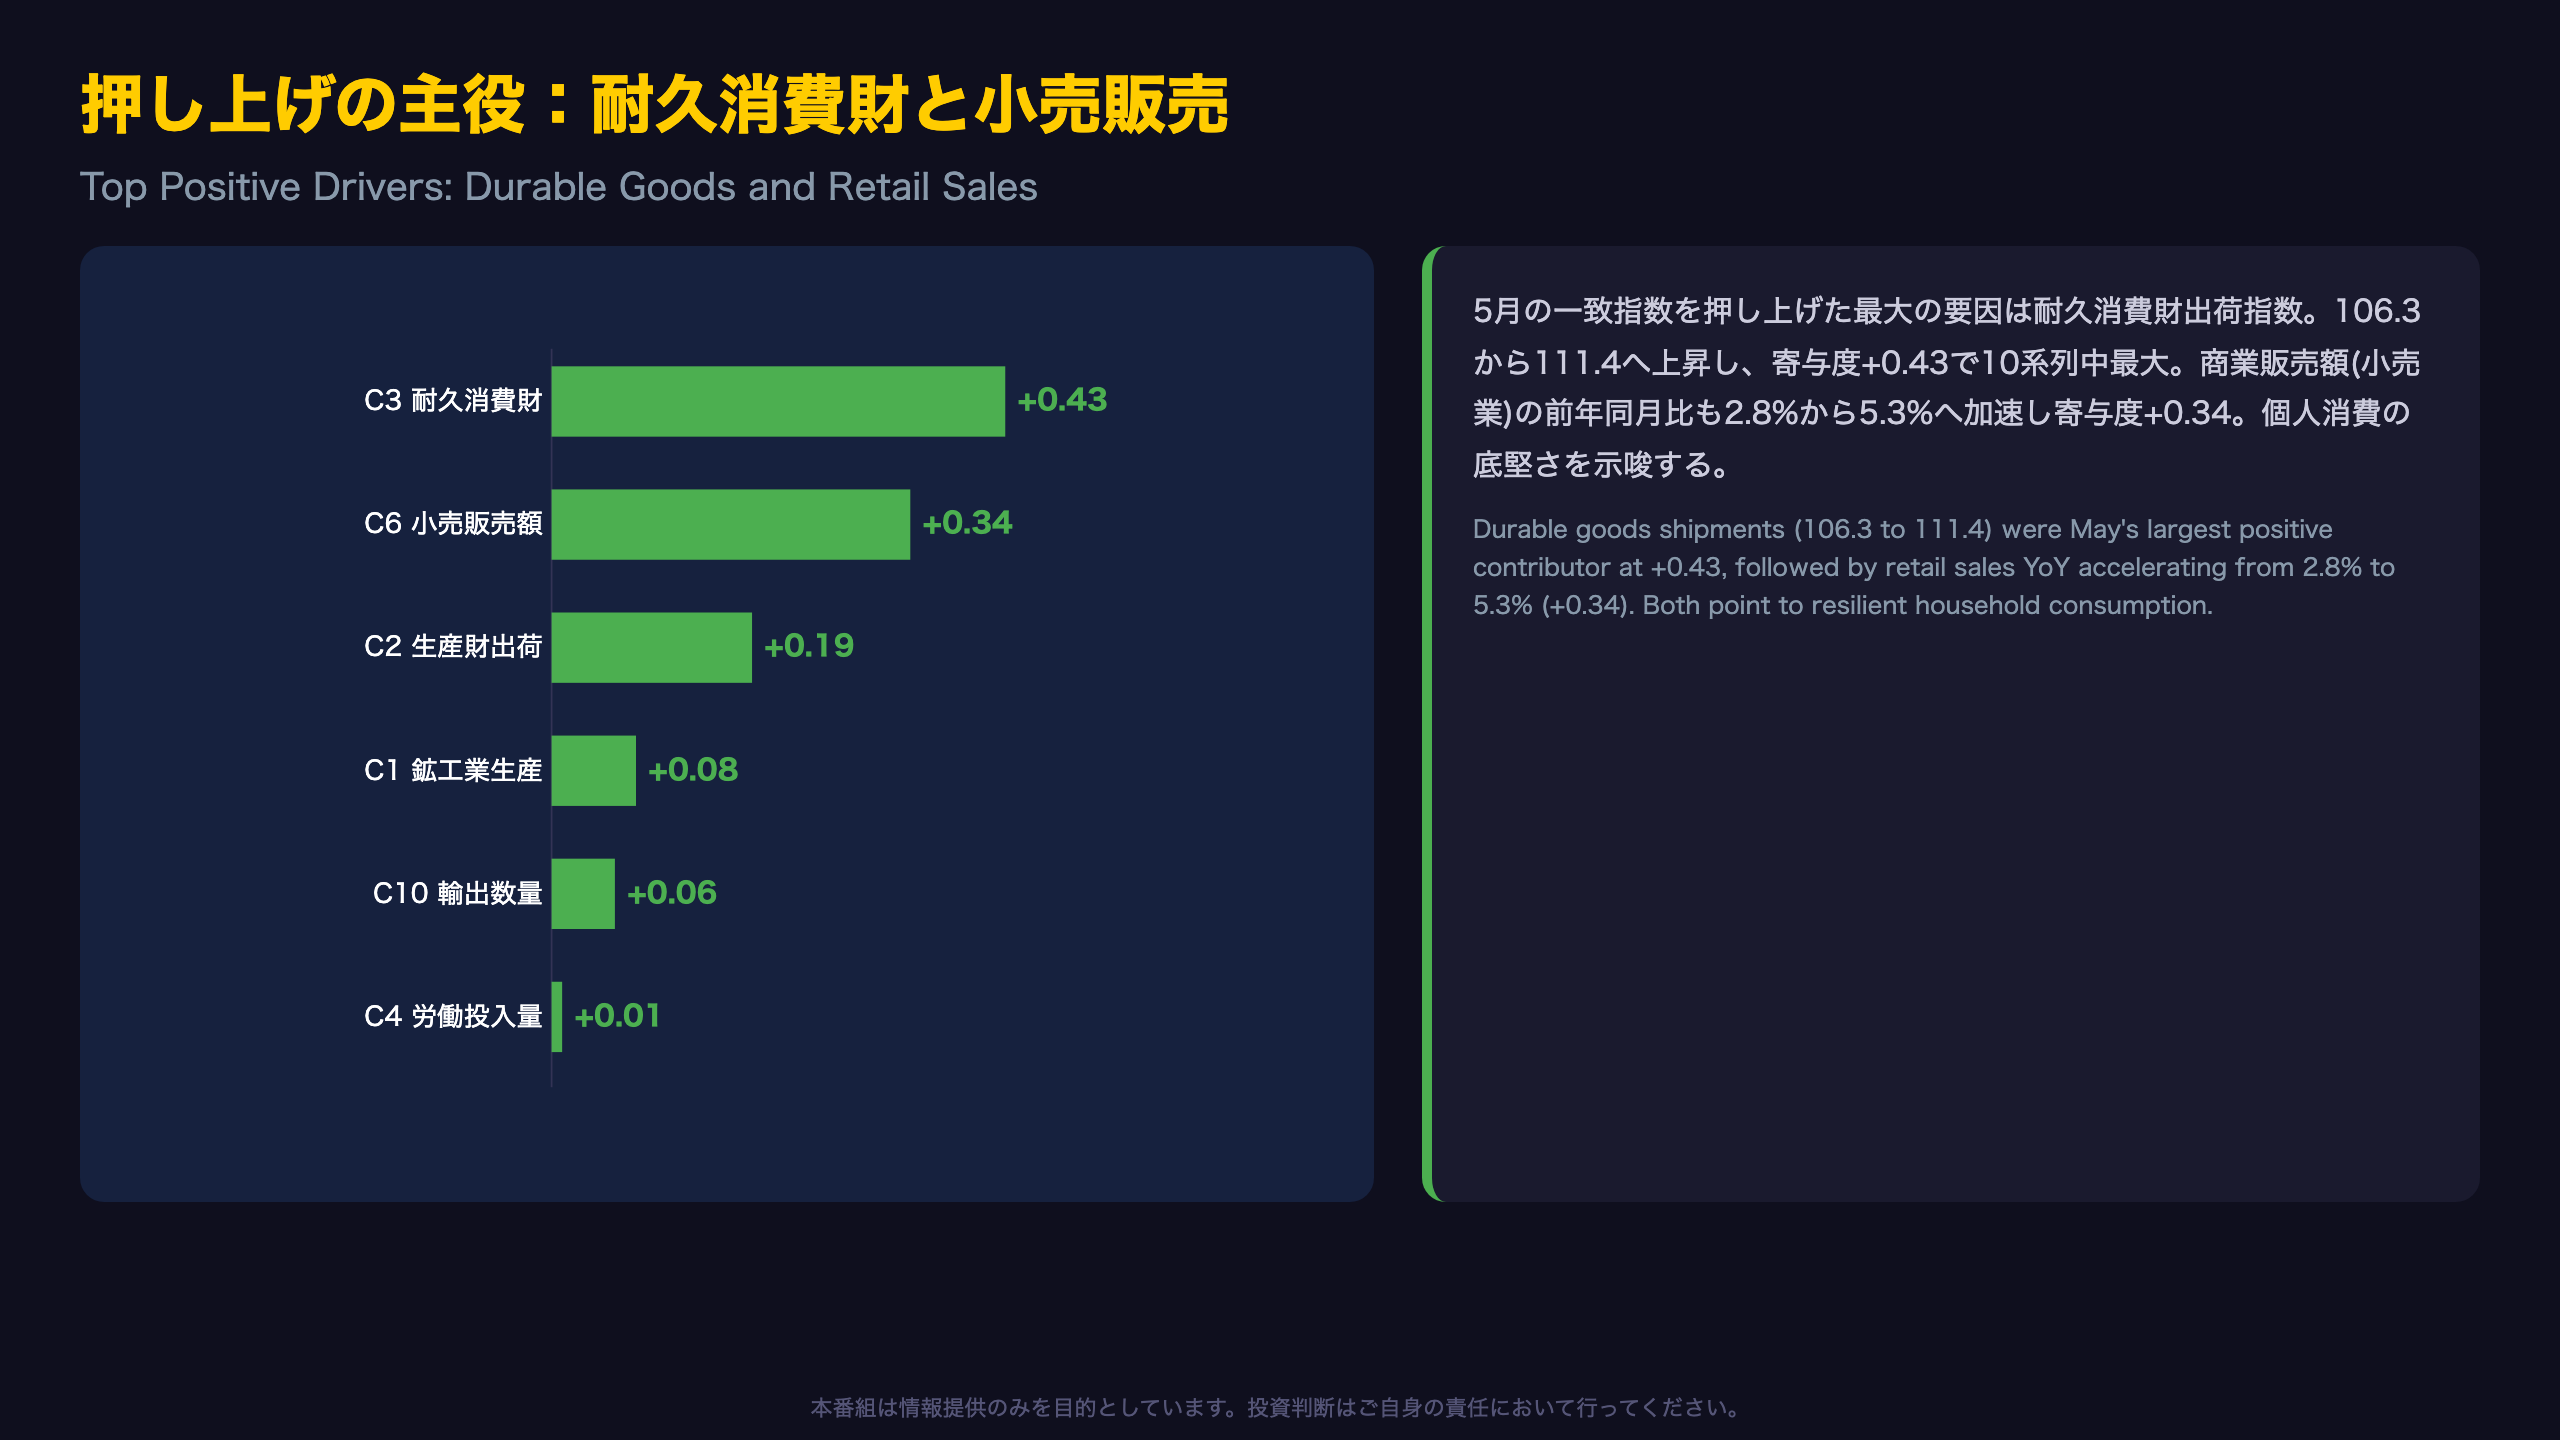
Consumption Strength: Durable Goods and Retail Sales
The single largest positive contributor to May’s Coincident Index was the Durable Consumer Goods Shipment Index (C3), which jumped from 106.3 to 111.4, contributing +0.43 points — by far the largest positive driver among the 10 coincident series.
Retail sales (C6, year-over-year) accelerated sharply from +2.8% to +5.3%, contributing +0.34 points. Looking at the trailing six-month trend (Feb: -0.1% → Mar: +1.4% → Apr: +2.8% → May: +5.3%), the acceleration has been building consistently, not a one-time spike.
A Caveat on Nominal Figures
Retail sales here are measured in nominal year-over-year terms, meaning some portion of the gain could reflect price inflation passthrough rather than real volume growth. Cross-referencing with Japan’s Household Survey (real consumption) would be needed to fully isolate volume effects — data not available in this release.
Manufacturing Holding Up
Supporting series C2 (mining and manufacturing shipment index, +0.19) and C1 (industrial production index, +0.08) also posted modest positive contributions, while the Export Quantity Index (C10) improved slightly from 105.5 to 106.0 (+0.06), suggesting external demand has not deteriorated materially.
押し下げの主役:投資財出荷と雇用指標
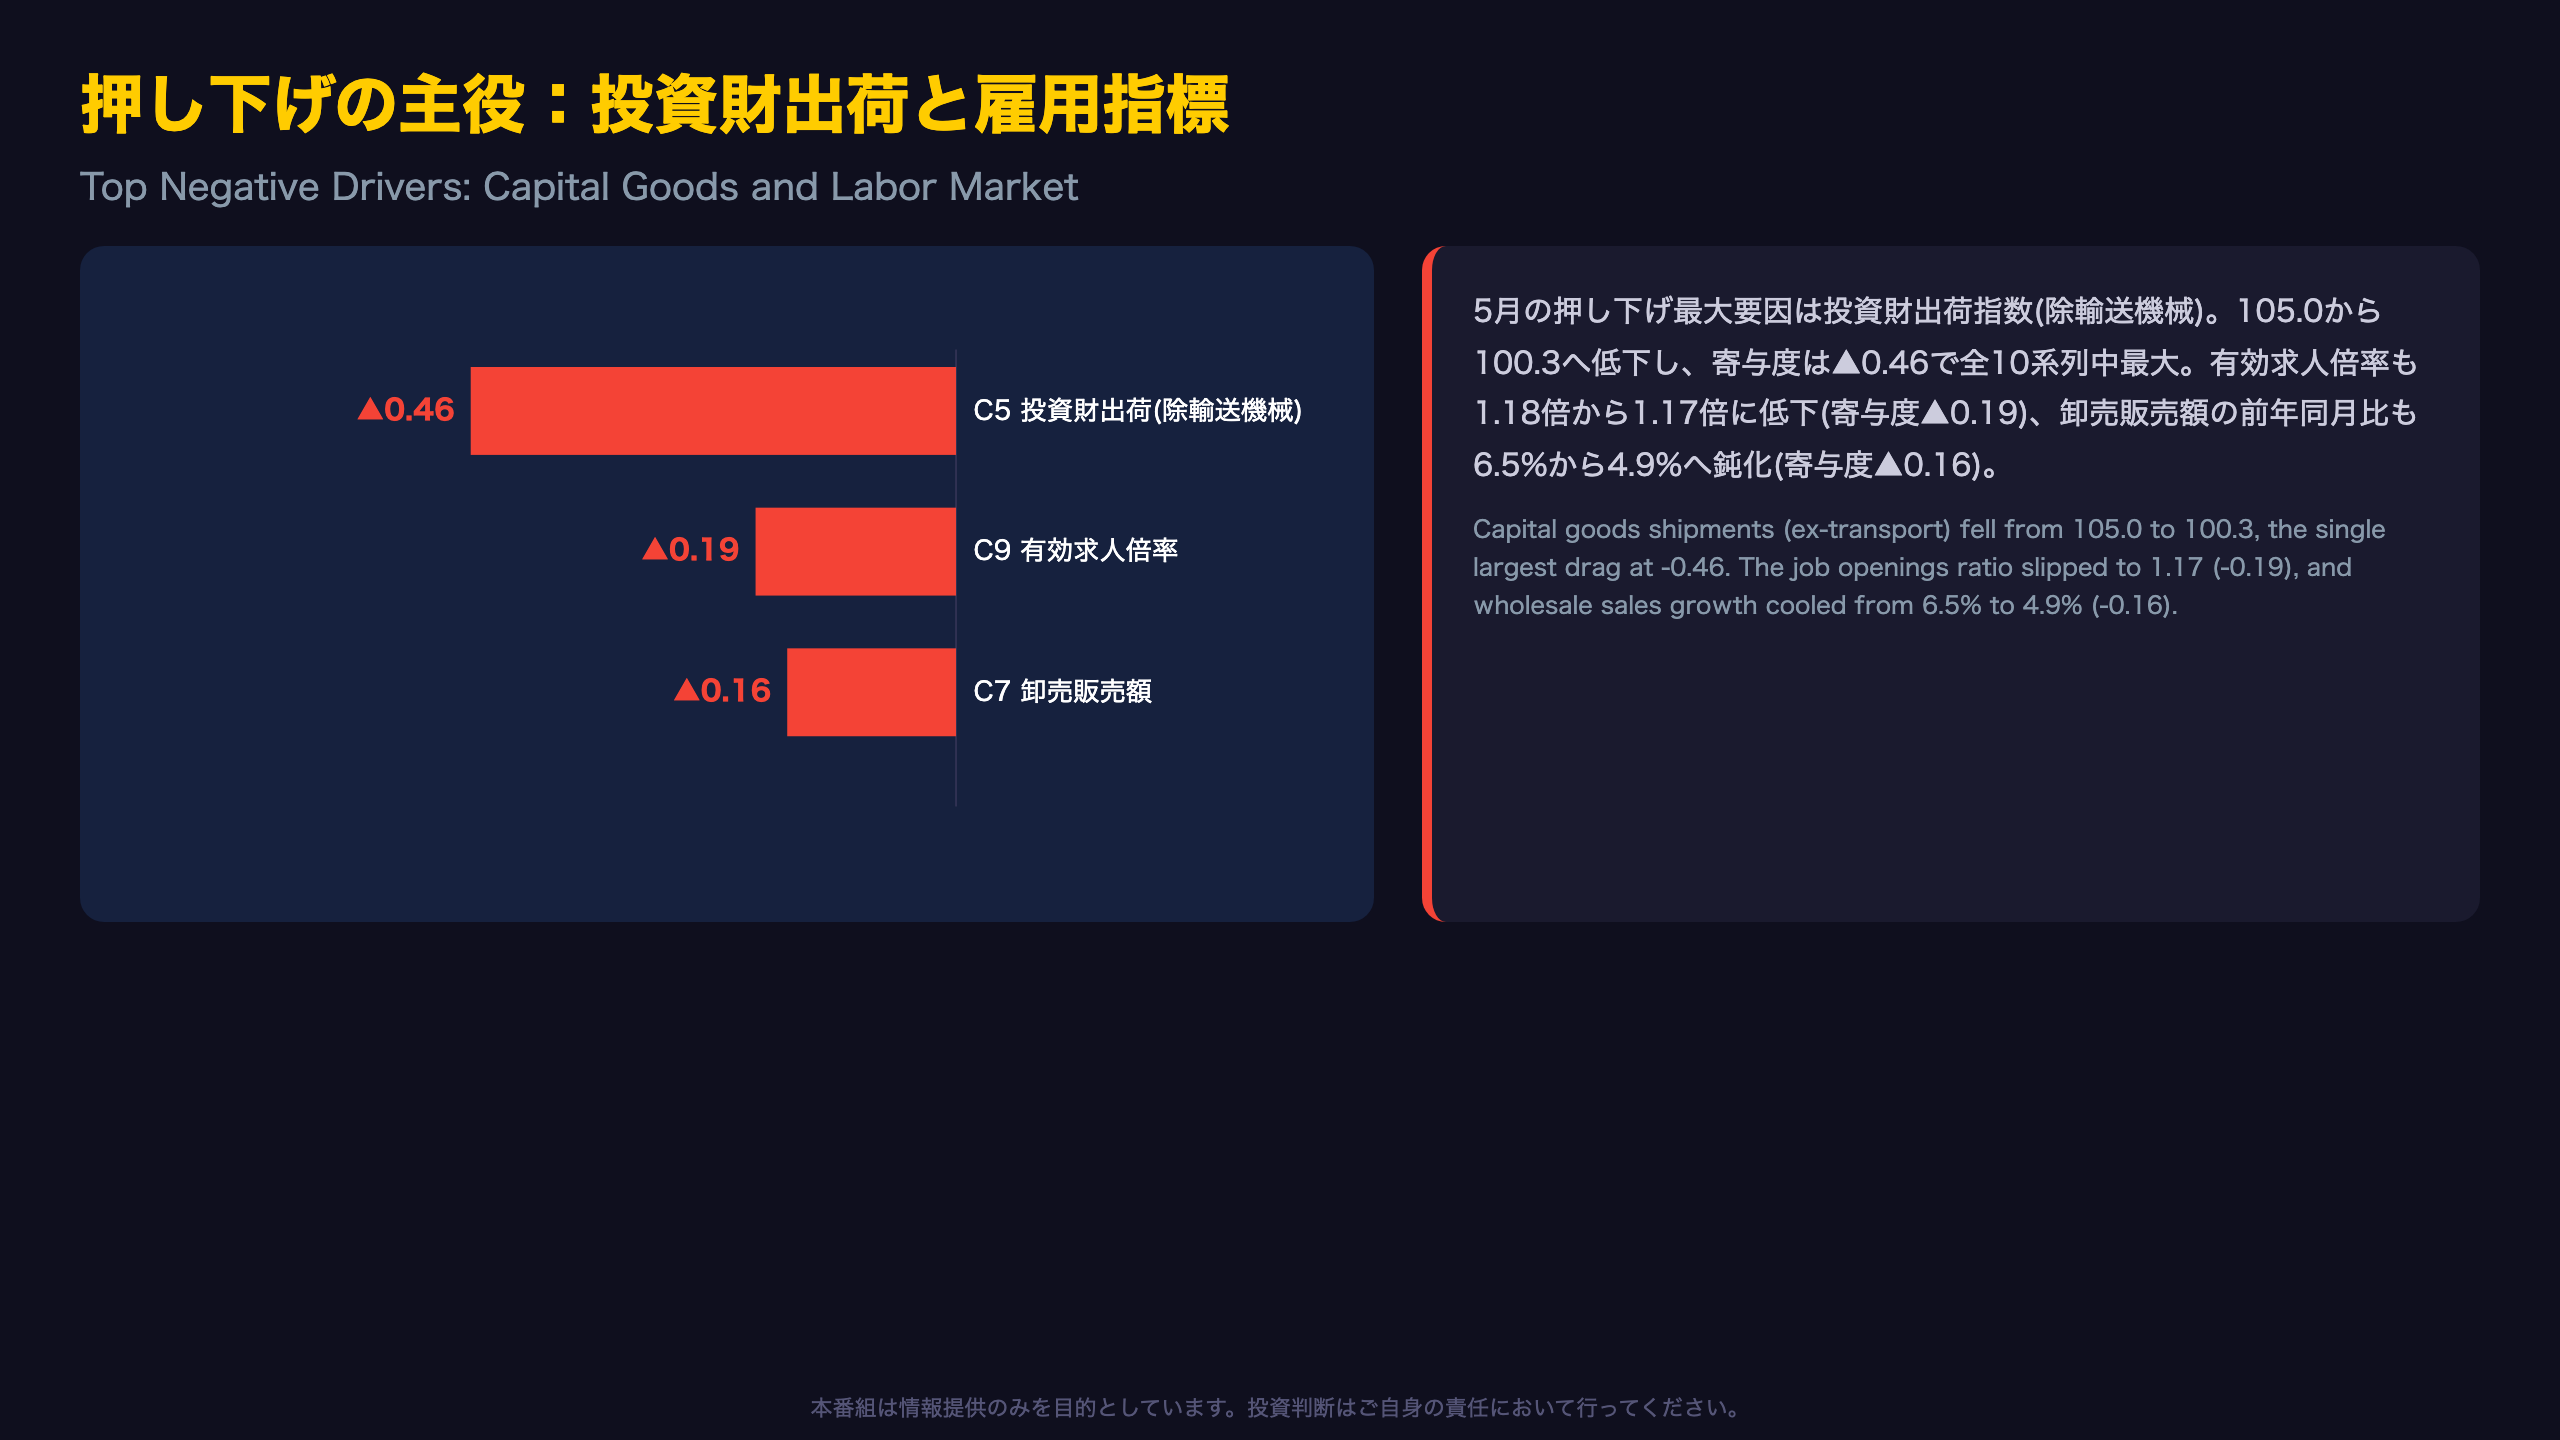
Where the Cracks Are: Capital Goods and Labor Market
The Capital Goods Shipment Index excluding transport equipment (C5) — a proxy for corporate capex appetite — fell sharply from 105.0 to 100.3, contributing -0.46 points, the single largest drag on the entire index.
Looking at the recent trend (Feb: 101.1 → Mar: 100.4 → Apr: 105.0 → May: 100.3), this appears to partly reflect a reversal of April’s spike rather than a clean new downtrend — underscoring the volatility inherent in single-month capex data.
The Job Openings Ratio: A Small Move, Outsized Contribution
The effective job openings ratio (C9) slipped only marginally from 1.18 to 1.17, yet contributed -0.19 to the index — disproportionate to the raw change, reflecting the CI methodology’s amplitude adjustment for this series. Investors should not read a 0.01 decline as an abrupt labor market deterioration.
That said, the ratio has been on a gradual multi-month downtrend from its peak, a pattern worth monitoring as one input into Japan’s wage-negotiation (Shunto) outlook — though this single series is insufficient to confirm a structural labor market turn.
Wholesale Sales Growth Cooling
Wholesale sales (C7, YoY) decelerated from +6.5% to +4.9% (-0.16 contribution) — still robust in absolute terms, but suggesting inter-business trade momentum may be past its peak.
遅行指数は2か月ぶり下降、物価鈍化の裏返しか
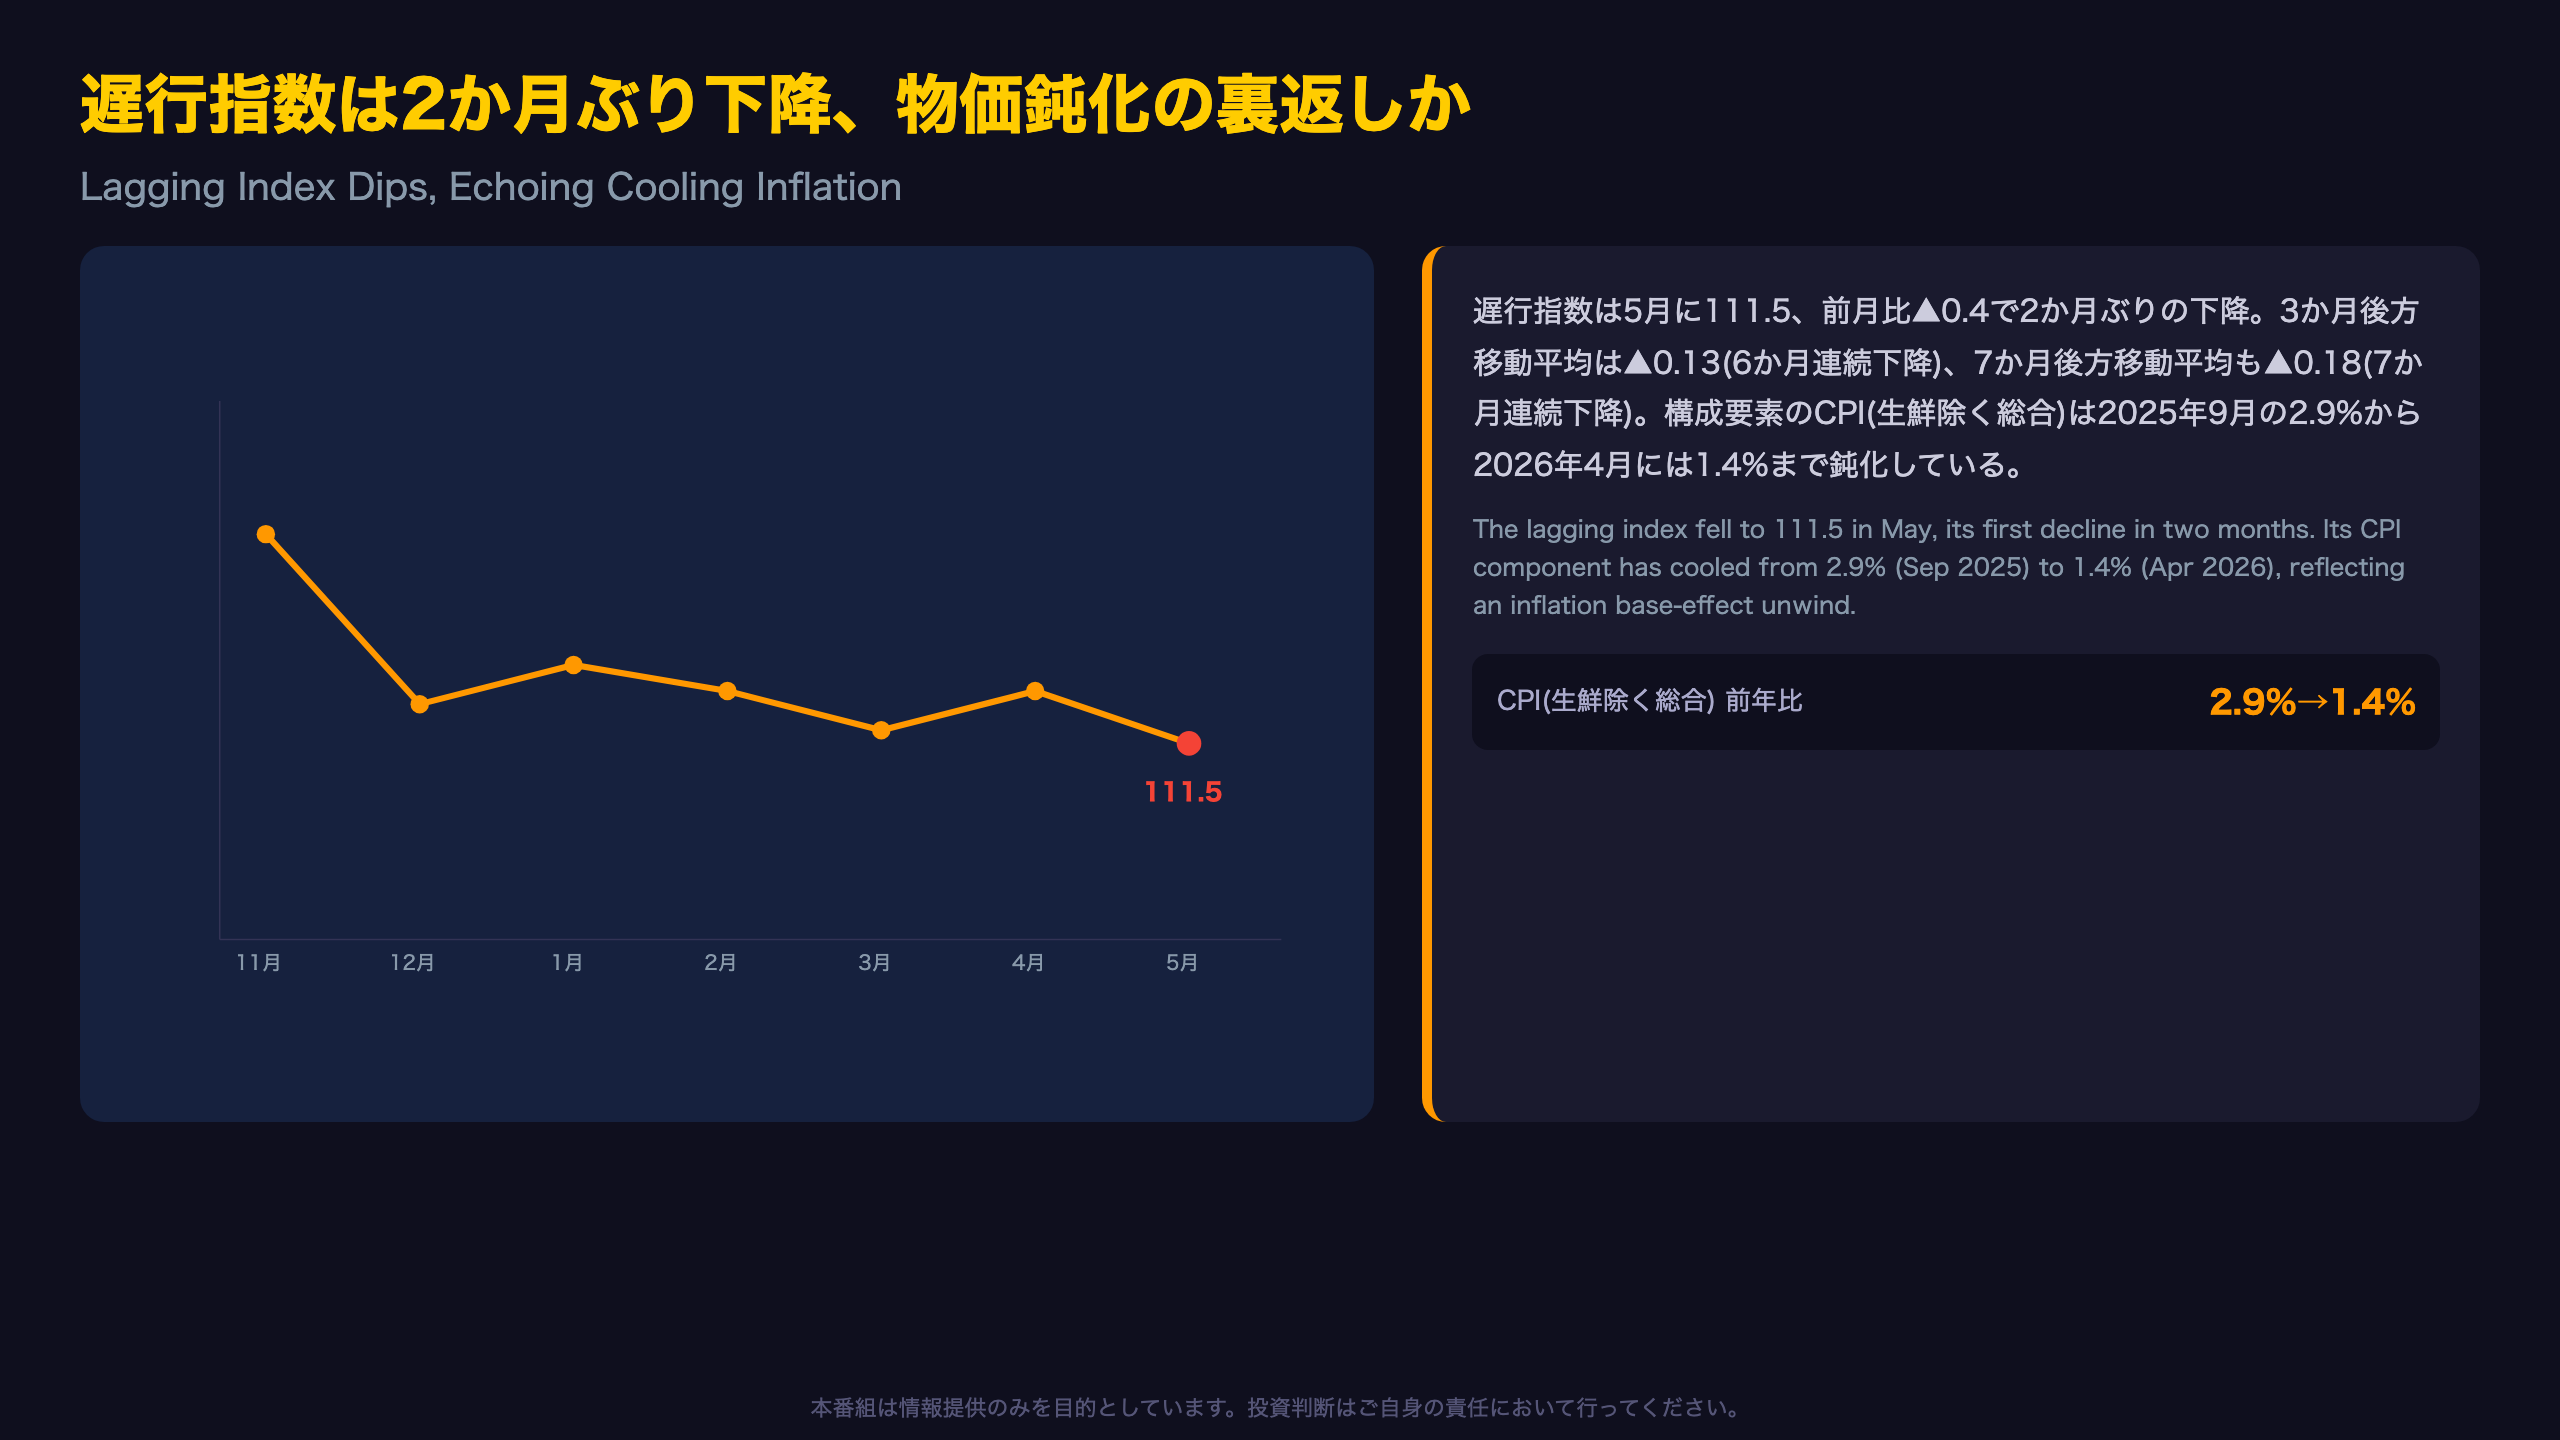
The Lagging Index and Cooling Inflation
The Lagging Index fell to 111.5 in May (-0.4pt), its first decline in two months. The 3-month moving average has now declined for 6 consecutive months (-0.13pt), and the 7-month average for 7 consecutive months (-0.18pt) — a persistent downtrend since late 2025.
One of the lagging series’ key components, Japan’s Core CPI excluding fresh food (year-over-year), has cooled from 2.9% in September 2025 to just 1.4% in April 2026. For context: this remains within the BOJ’s 2% target framework, unlike the U.S. Fed’s post-2021 CPI overshoot, which peaked above 9%. Japan’s inflation cycle has generally been shallower and shorter than U.S. or Eurozone equivalents.
Wages Are Not Necessarily Weakening
Importantly, another lagging component — scheduled cash earnings in manufacturing (Lg7) — rose to 116.1 in April (+1.0% MoM), suggesting the lagging index’s decline is driven primarily by disinflation, not wage-side deterioration. This distinction matters for BOJ watchers assessing the wage-price virtuous cycle.
Why a Lagging Index Decline Isn’t Necessarily Bad News
By construction, lagging indices reflect conditions from months prior. A decline here, even as coincident and leading indices improve, is not necessarily contradictory — it may simply reflect the tail-end of an earlier soft patch working through the data with a delay.
市場への含意:改善のなかの温度差をどう読むか
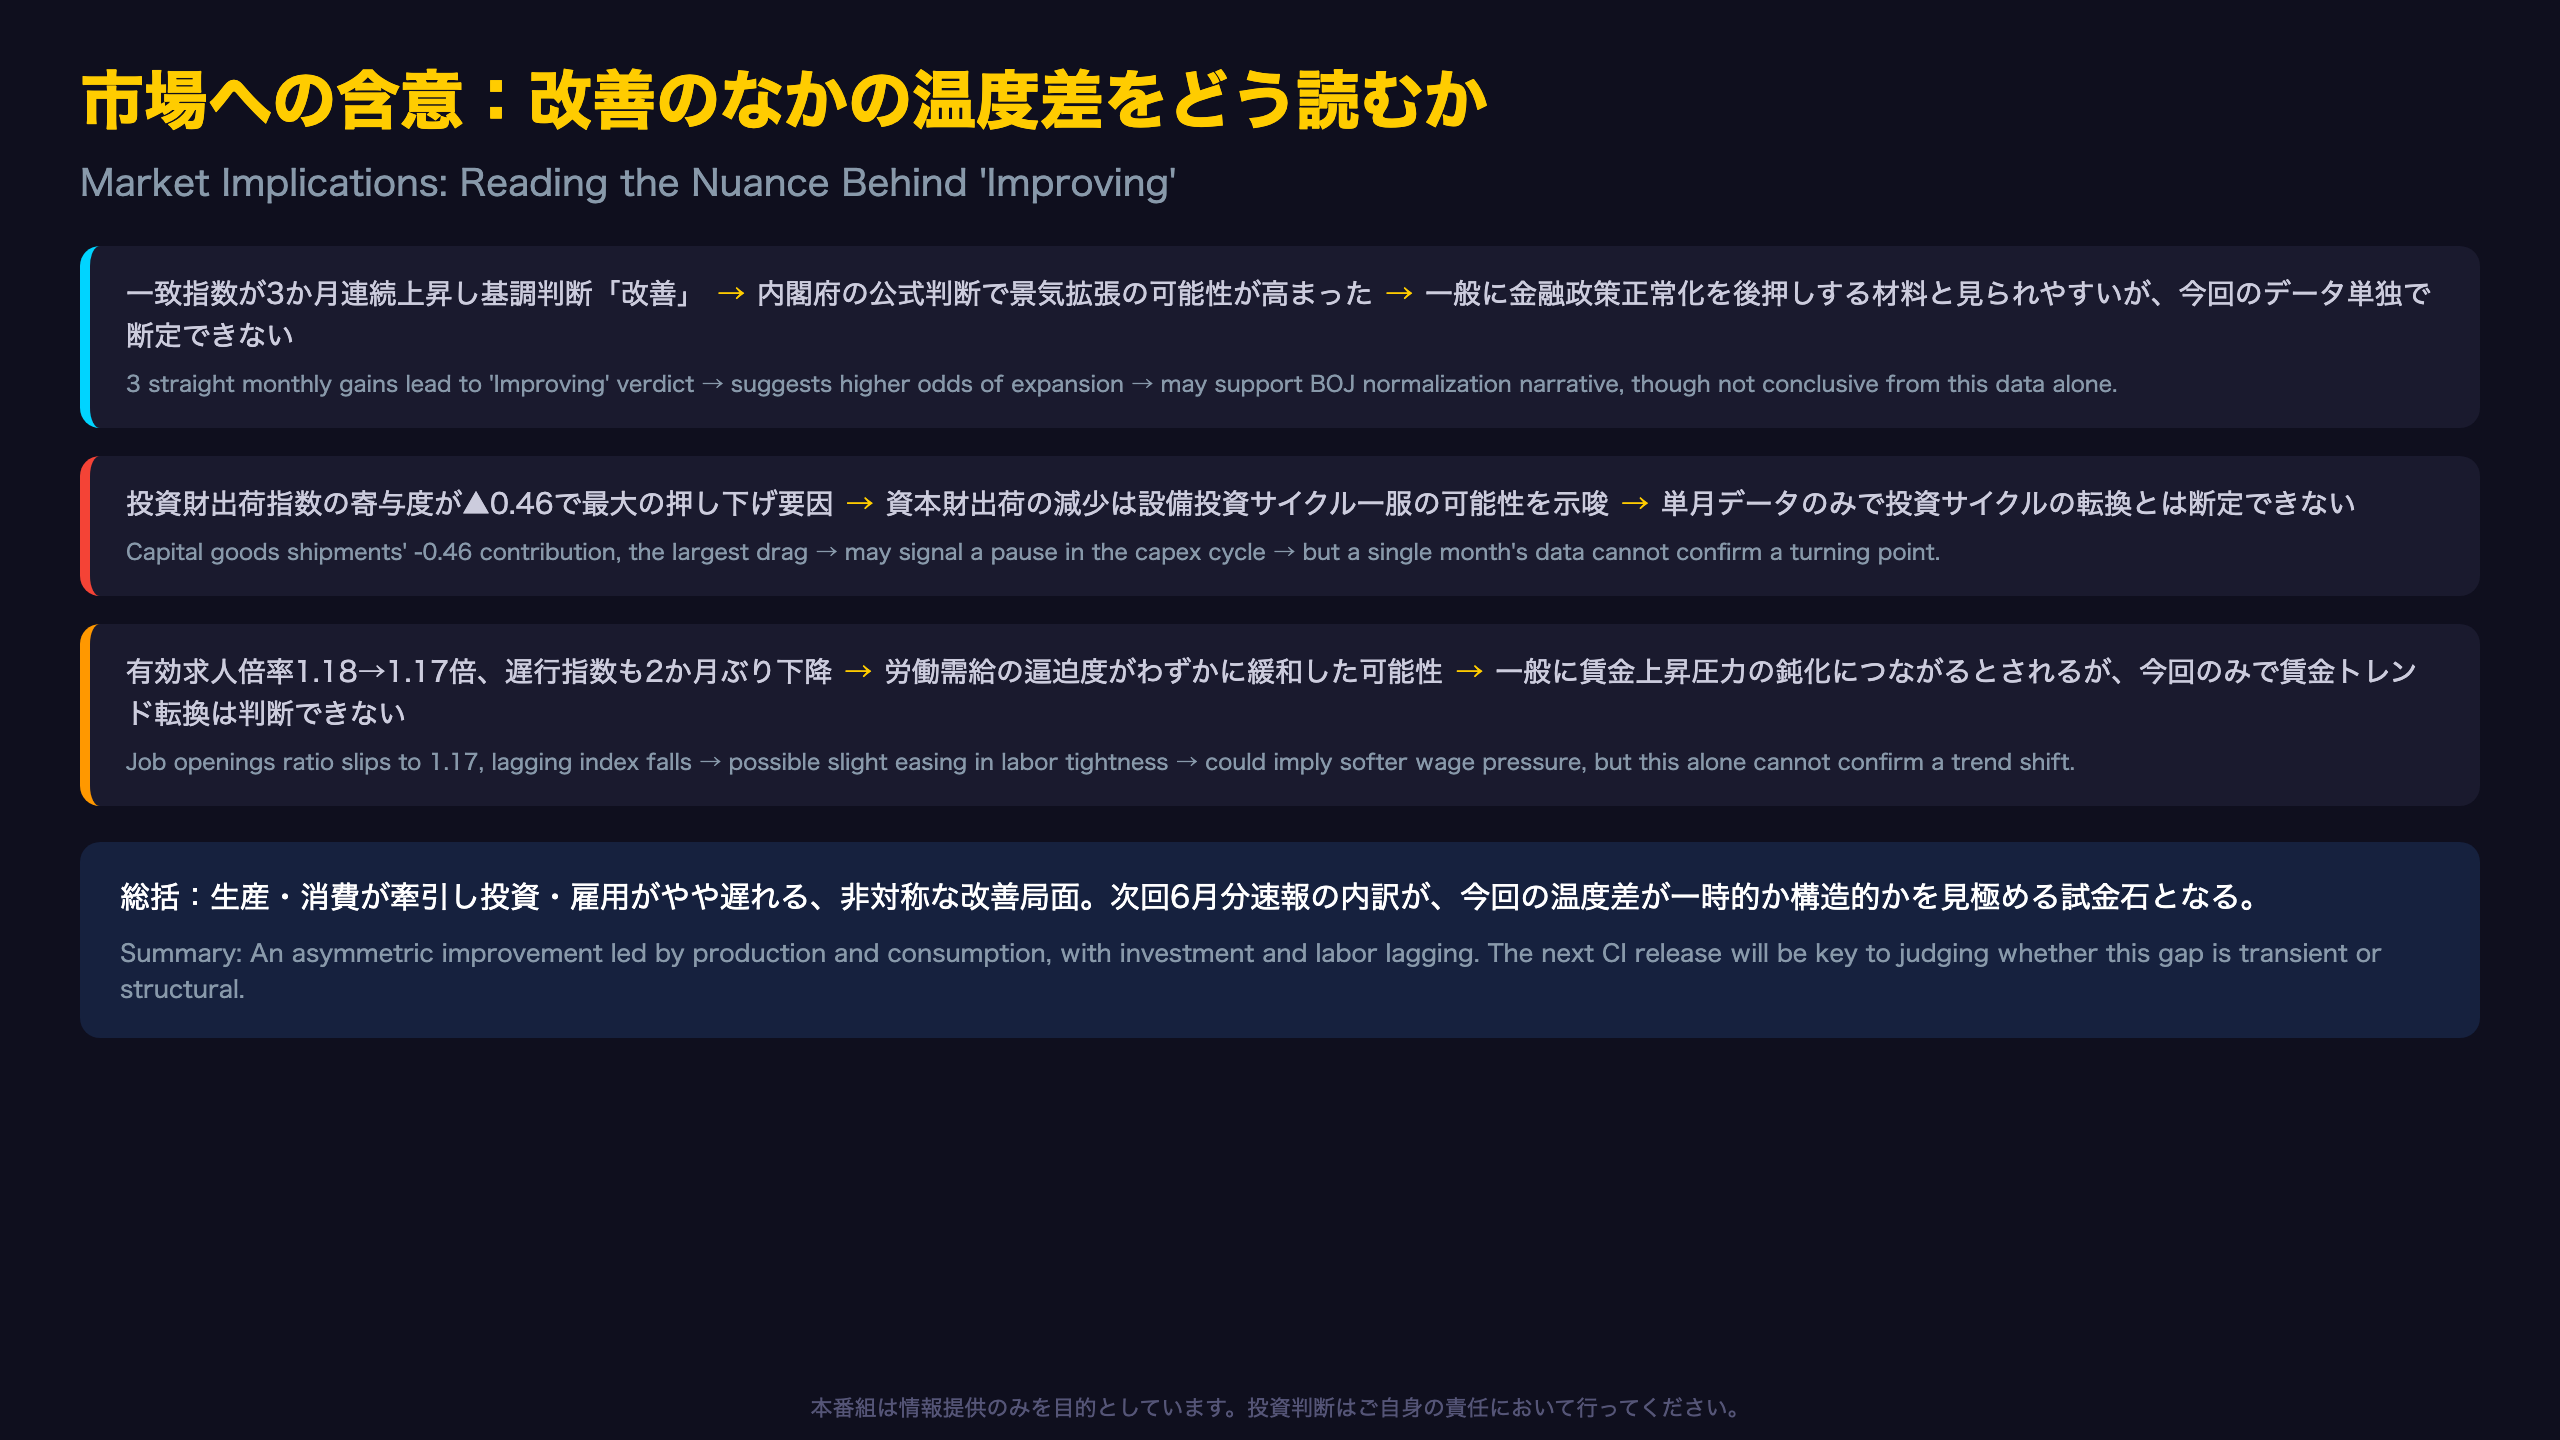
Policy and Market Implications
Today’s CI improvement adds one data point supporting the BOJ’s case that Japan’s economy remains on a gradual expansion path — relevant to the central bank’s policy normalization deliberations. However, the CI is a mechanical, rules-based classification, not a policy trigger; the BOJ weighs it alongside the Tankan survey, wage negotiation outcomes (Shunto), and its own Outlook Report projections.
General Market Framework (Not Data-Specific Predictions)
In general, sustained CI improvement phases have historically coincided with modest outperformance in domestic-demand-sensitive sectors (retail, services) relative to export-heavy sectors, which are more exposed to FX and global demand swings. This is a general historical pattern, not a forecast derived from today’s release specifically.
Looking Ahead
The next CI preliminary release will cover June 2026 data (exact publication date not specified in this report). Key questions for that release:
– Does the capital goods shipment index rebound from its May dip, or extend its decline?
– Does the job openings ratio stabilize or continue drifting lower?
– Does the leading index extend its streak to a 13th consecutive month of gains?
The answers will determine whether today’s ‘Improving’ designation proves durable or gives way to a ‘Pausing’ reassessment.
Disclaimer: This article is for informational purposes only. All investment decisions are made solely at your own risk.