📺 Watch the Full Video Analysis
This article was automatically generated by the NFC Market Live AI analysis system. (Updated: 2026-07-05 08:39 JST)
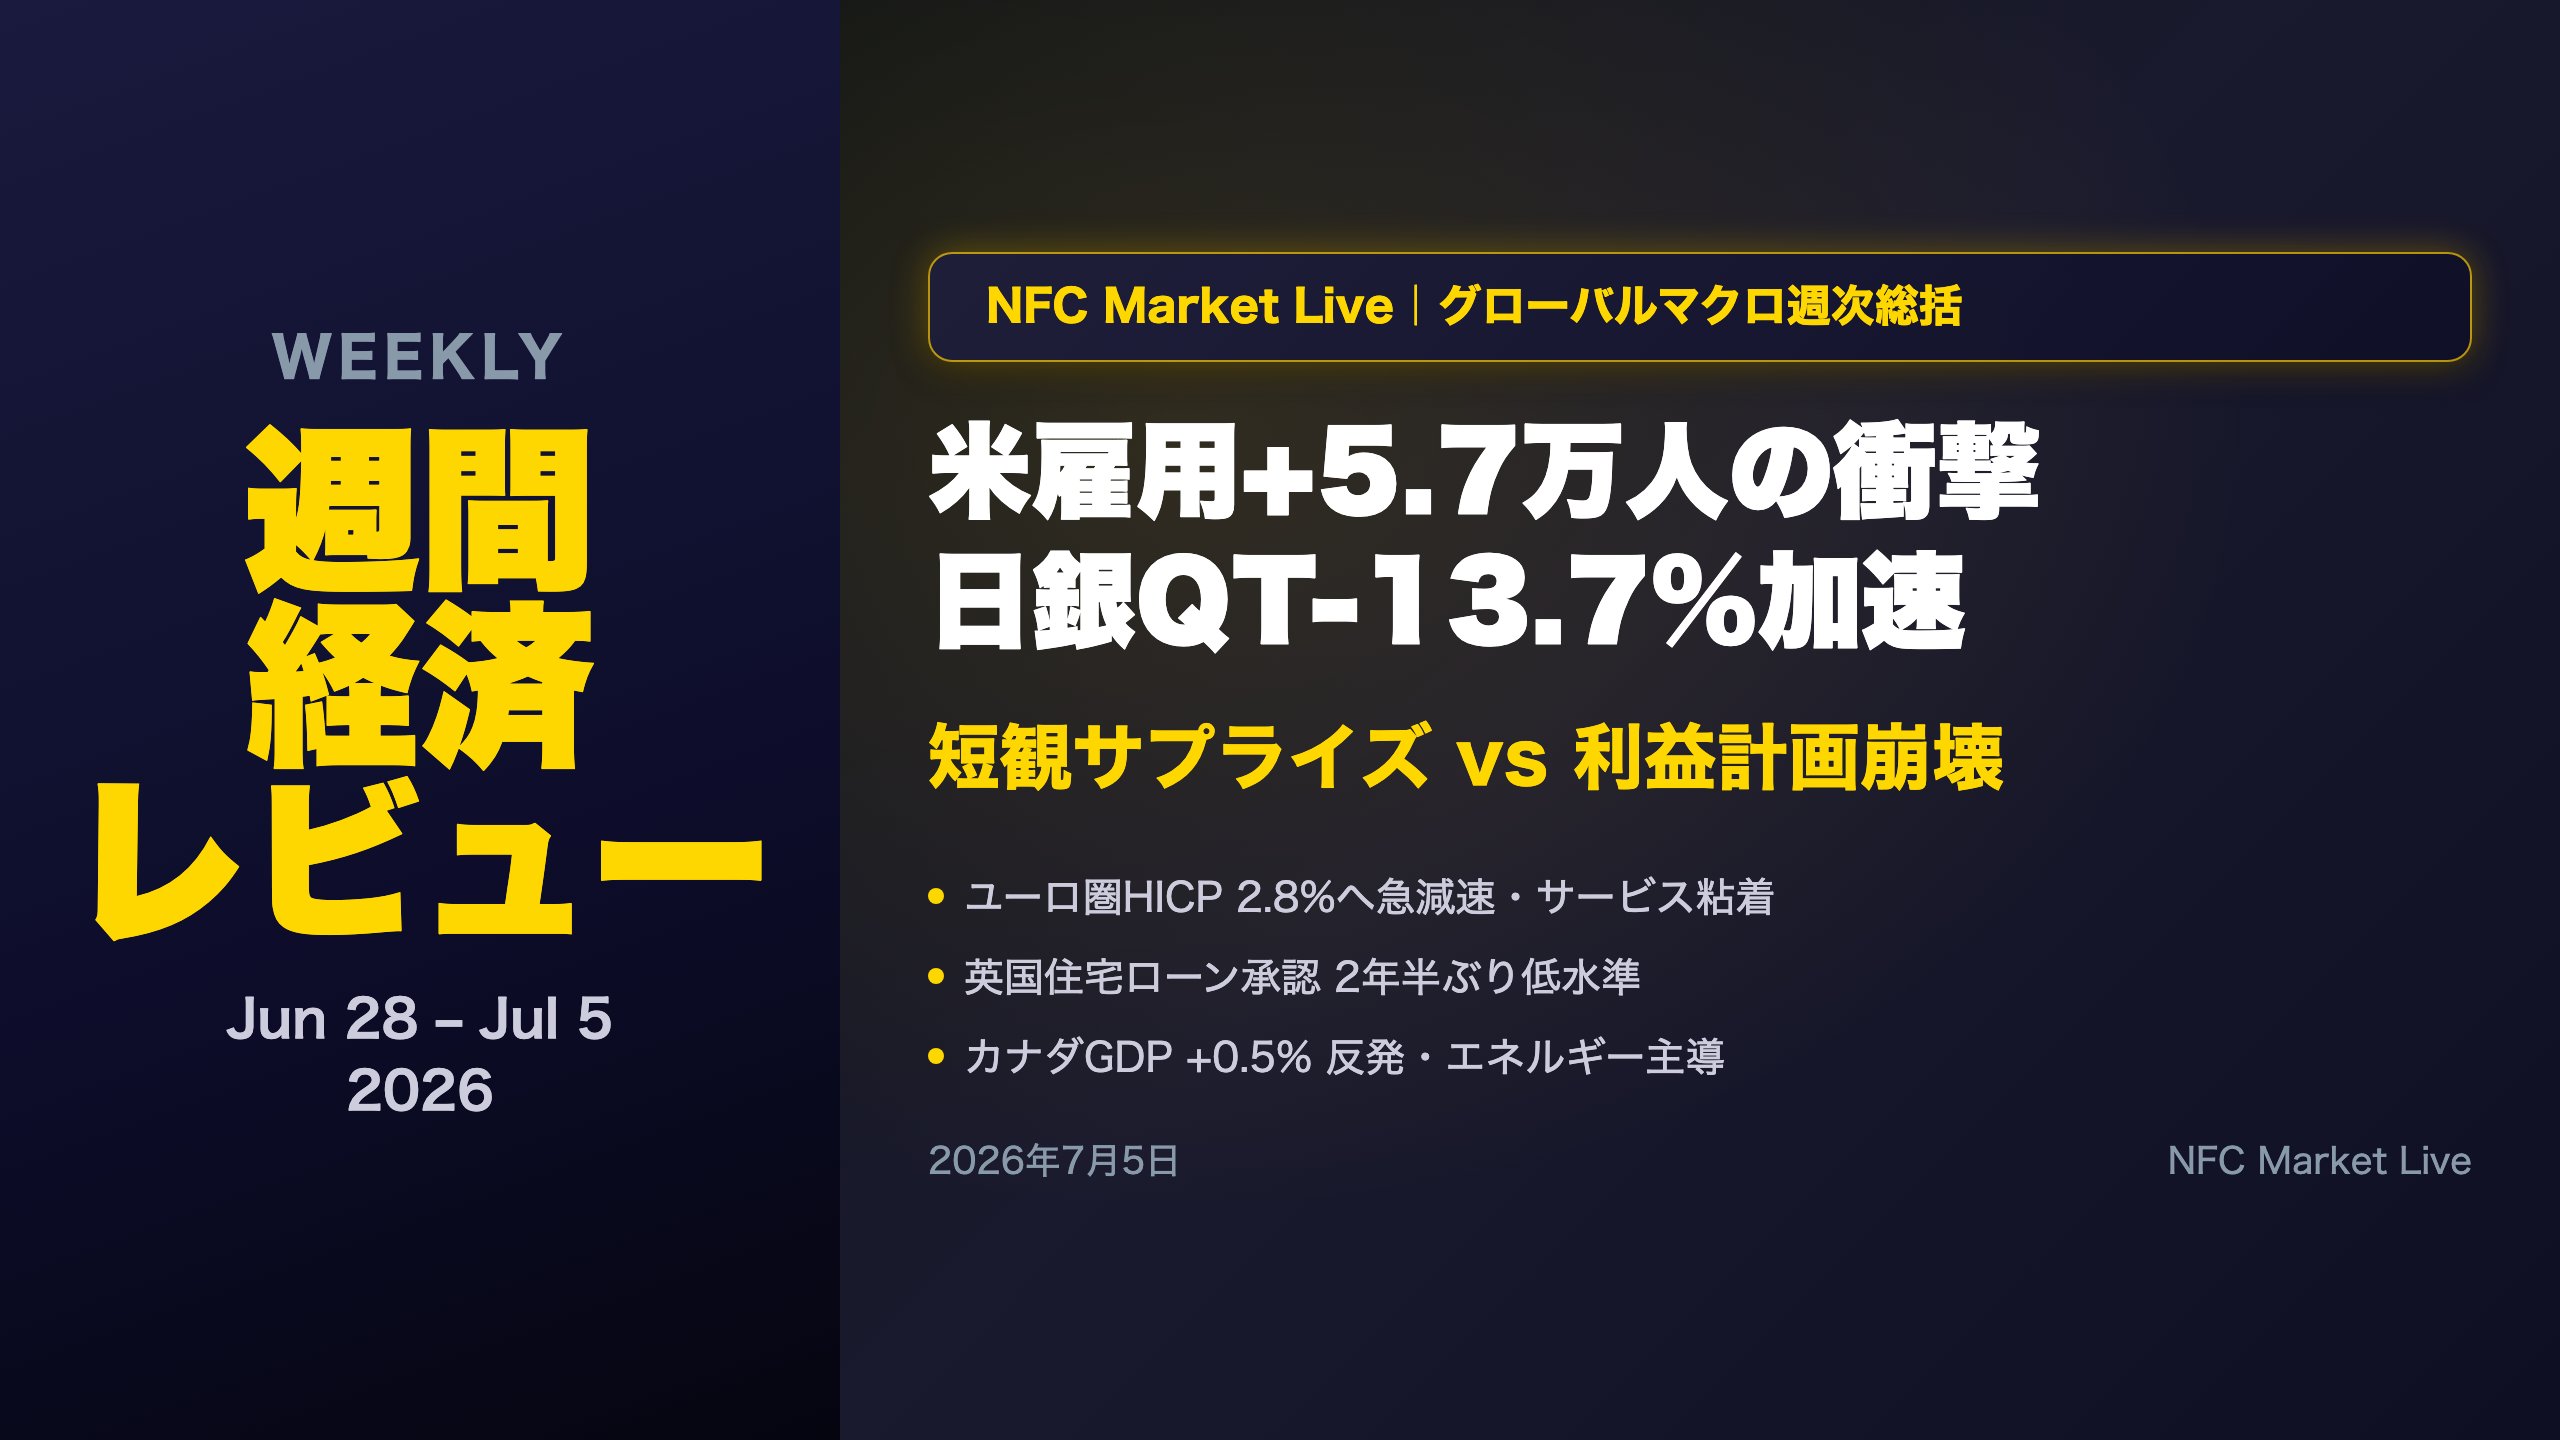
Weekly macro digest covering Jun 28–Jul 5, 2026. Key highlights: US nonfarm payrolls +57K miss, BOJ monetary base -13.7% QT acceleration, Japan Tankan business sentiment surprise vs. profit plan collapse, Eurozone HICP flash 2.8%, UK mortgage approvals at 2.5-year low, Canada GDP +0.5% rebound. Full analysis with next week’s event calendar.
オープニング:週間経済レビュー 2026年6月28日〜7月5日
Weekly Macro Digest: June 28 – July 5, 2026
Welcome to NFC Market Live’s weekly roundup. This was a week of sharply conflicting signals across global economies, with major data releases spanning the US, Japan, Europe, the UK, Canada, and Australia.
Key Topics This Week
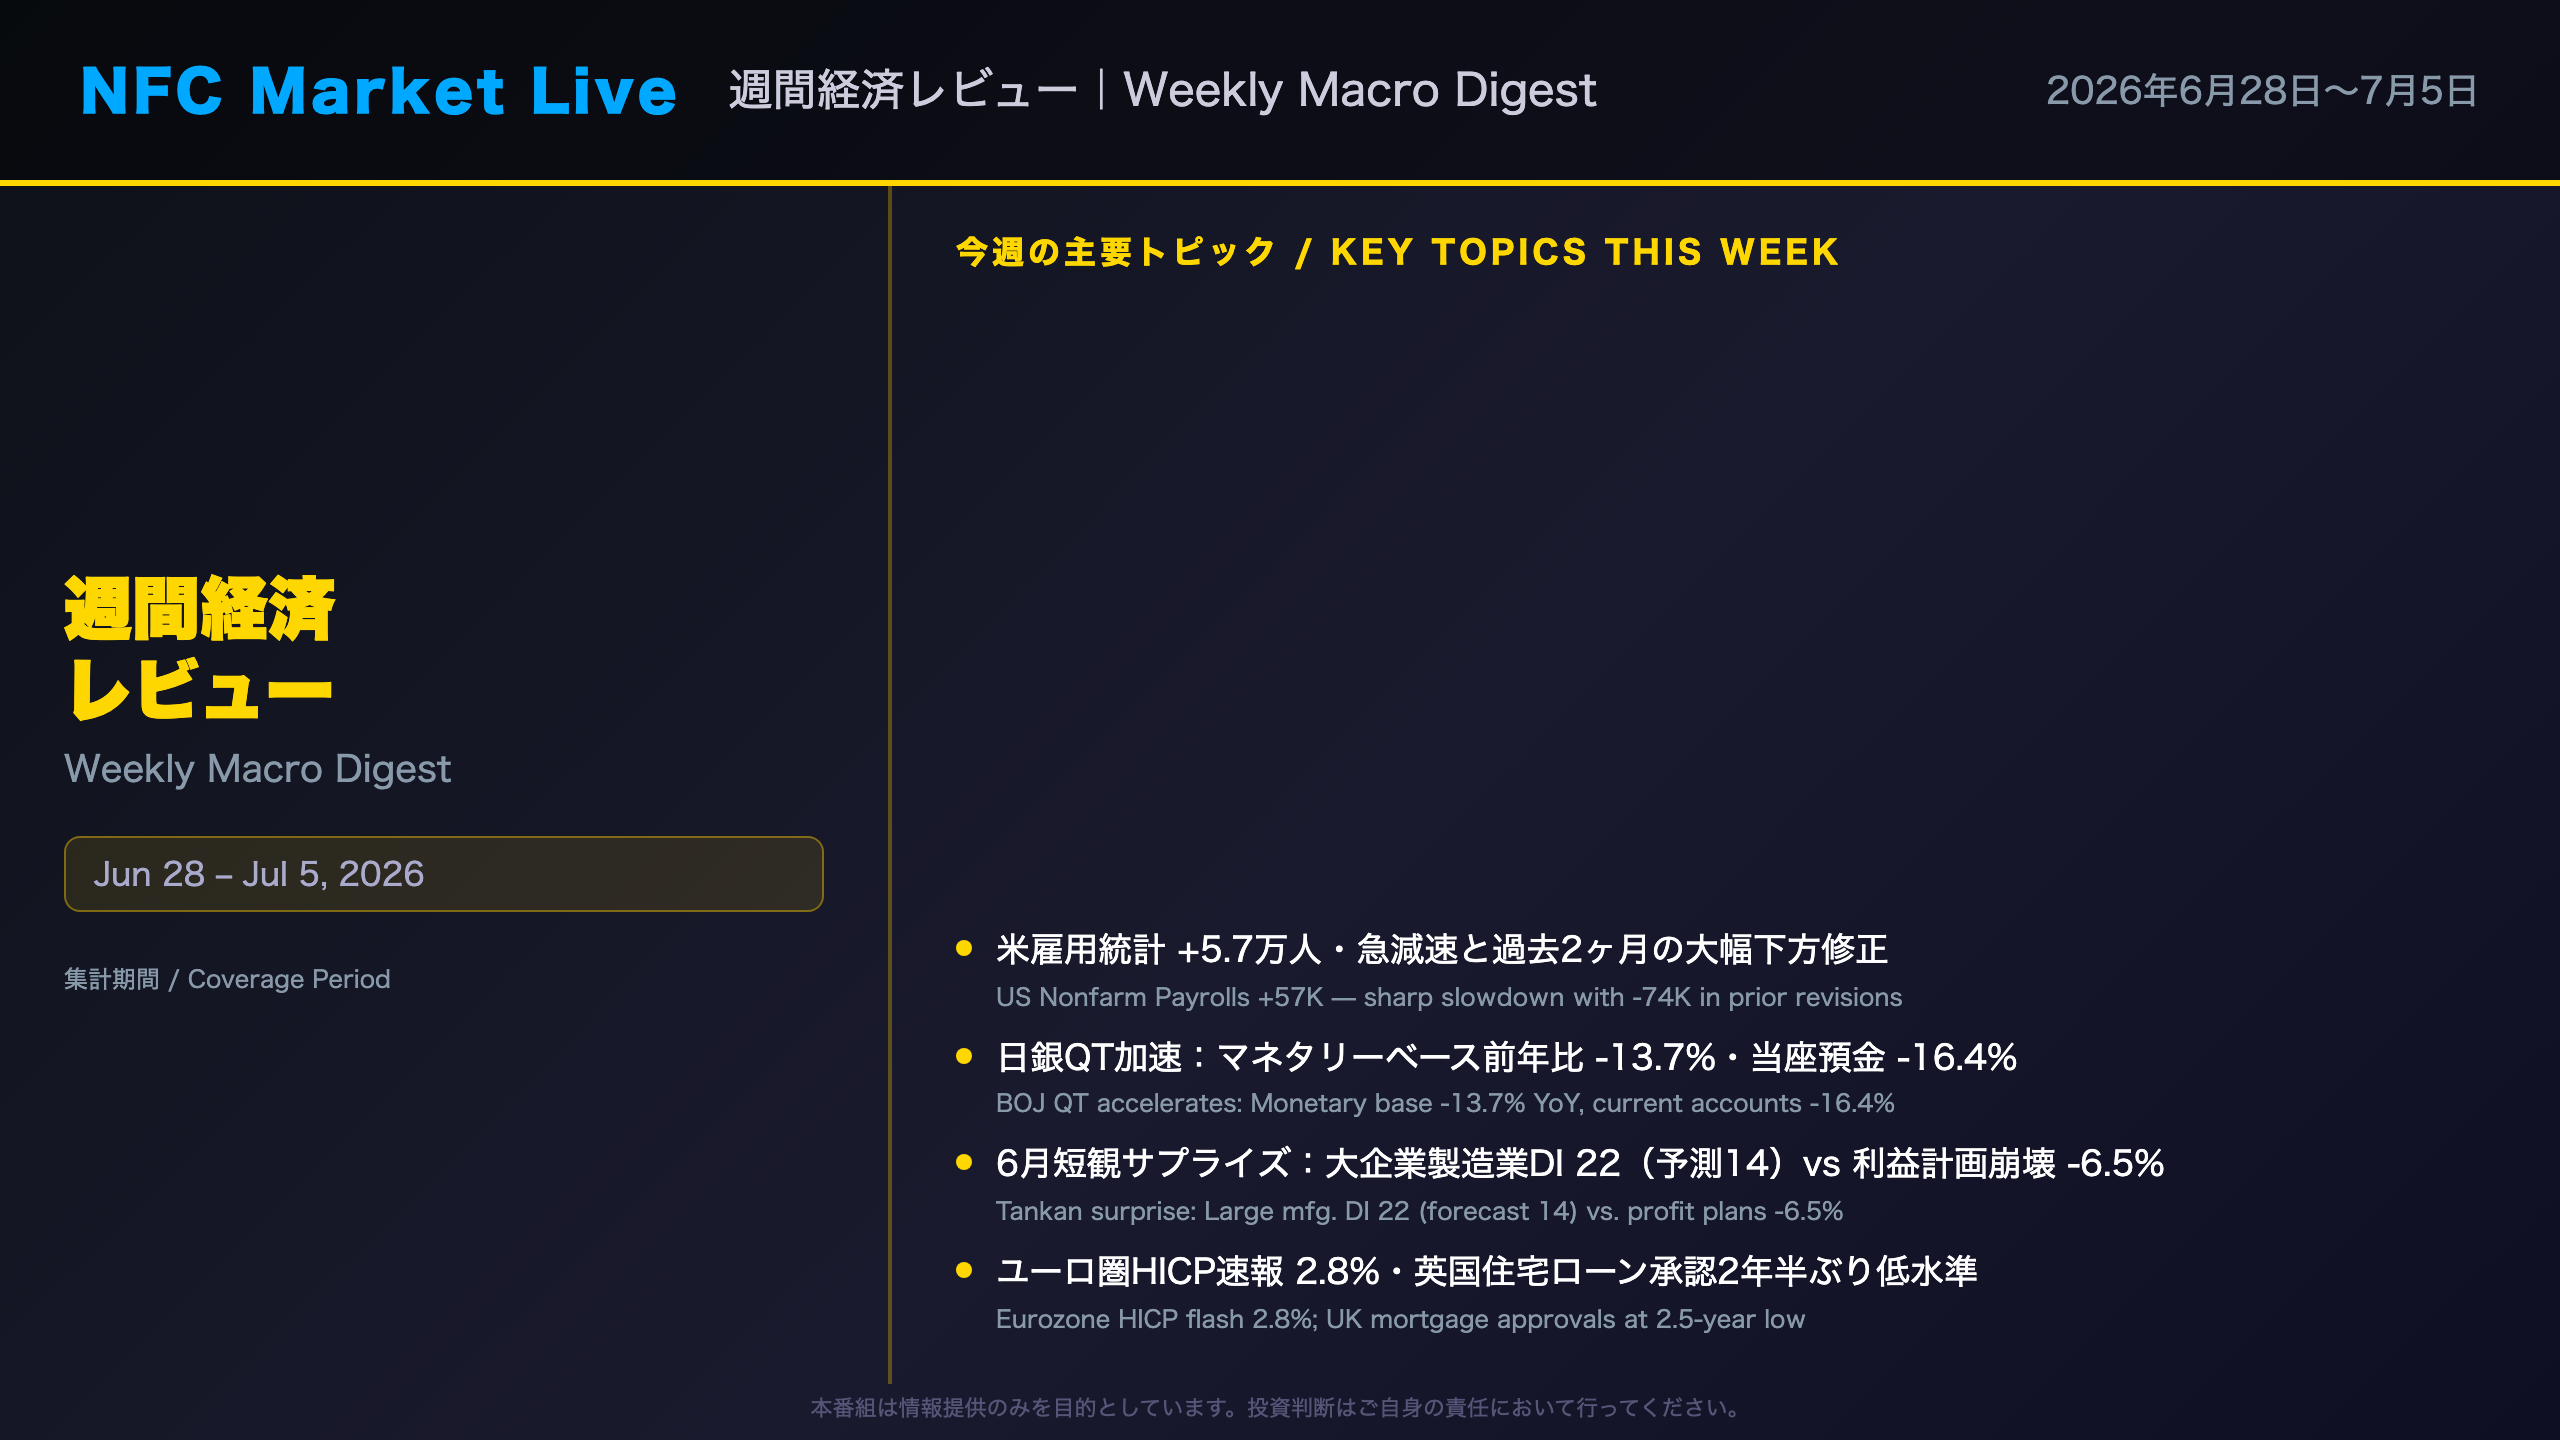
- US June Nonfarm Payrolls: +57,000 — a sharp deceleration from May’s revised +129,000, with prior months revised down by a combined 74,000
- BOJ Monetary Base (June): -13.7% YoY, with current account balances at -16.4% — QT entering a new, more aggressive phase
- Japan Tankan (June): Large manufacturer DI hit 22, beating the March forecast of 14 by 8 points. However, profit plans collapsed to -6.5%
- Eurozone HICP Flash (June): Dropped to 2.8% from 3.2%, driven by energy. Services inflation remained sticky at 3.2%
- UK Money & Credit (May): Mortgage approvals fell to their lowest since December 2023
- Canada Monthly GDP (April): Rebounded +0.5% after March’s contraction
This episode provides a balanced assessment of each release, highlighting both resilience and risk, before previewing next week’s critical events.
今週の総括:「雇用軟化とインフレ残存の綱引き」
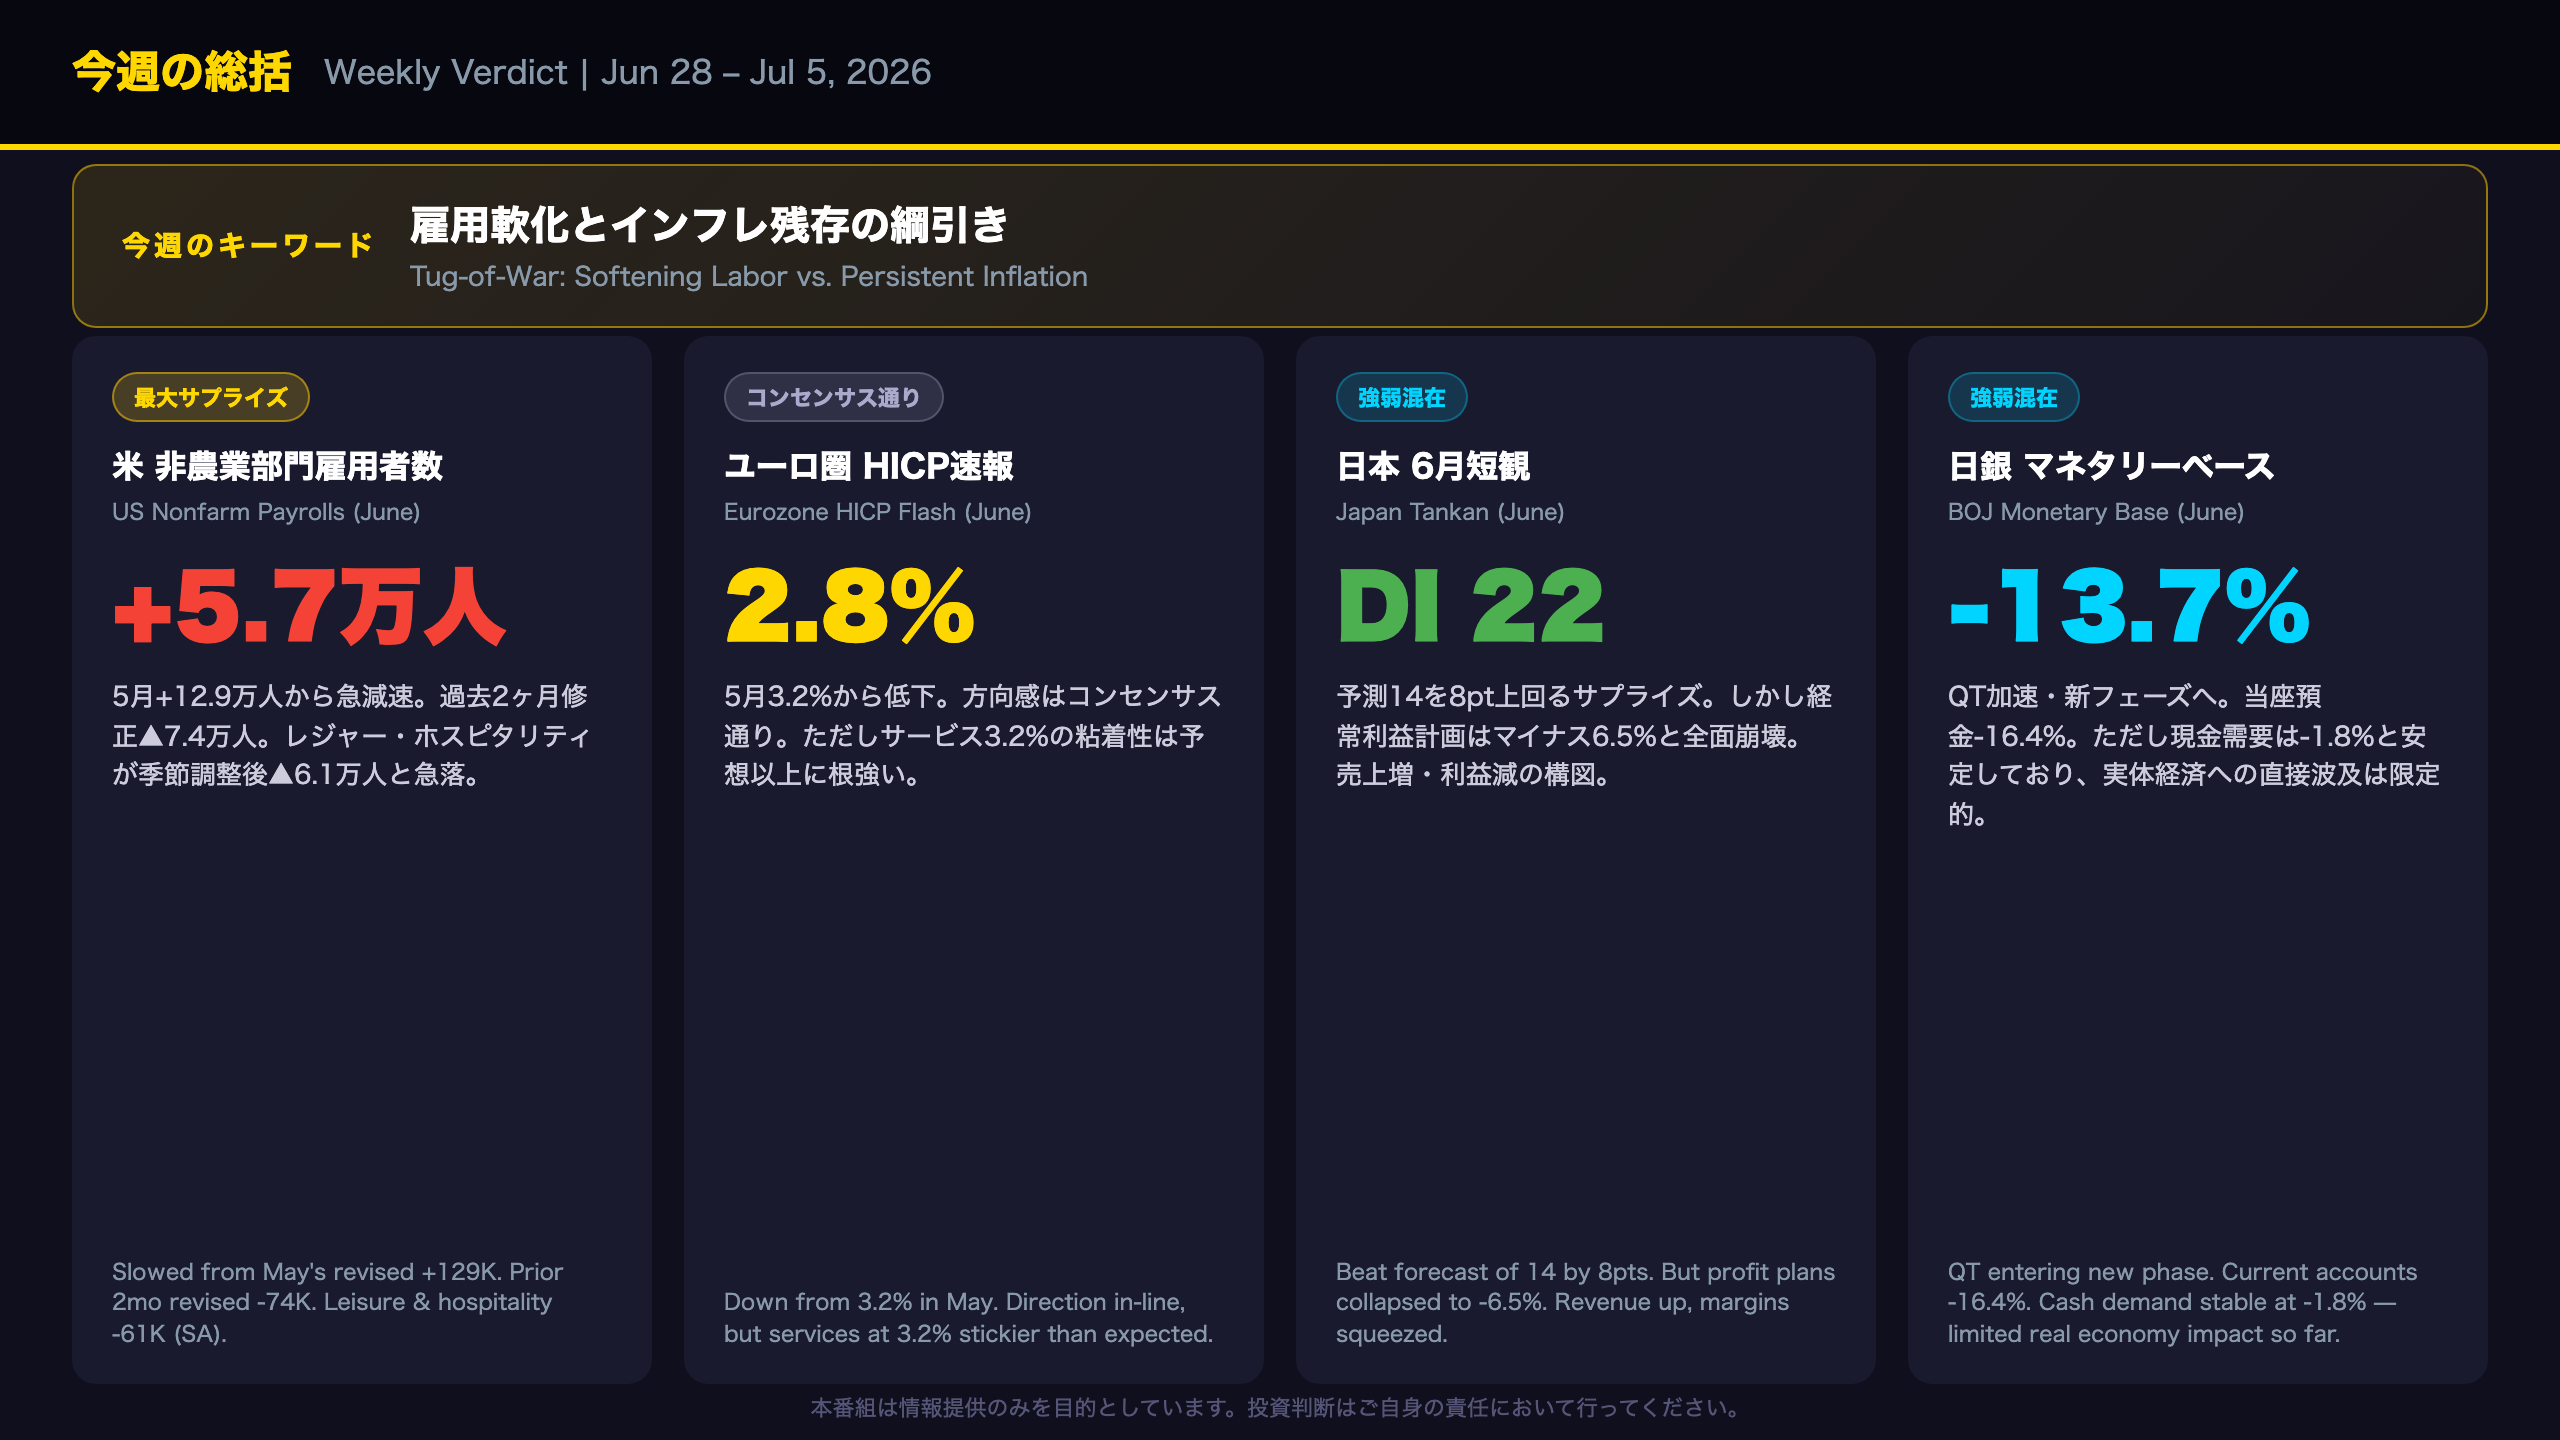
Weekly Verdict: A Week of Coexisting Strength and Weakness
The Biggest Surprise: US Jobs Miss
The standout data point of the week was the US June employment report. Nonfarm payrolls rose just 57,000 — less than half of May’s revised 129,000. The Bureau of Labor Statistics explicitly cited “weaker than usual seasonal hiring,” with leisure and hospitality shedding 61,000 on a seasonally adjusted basis.
Critically, prior months were revised down by a combined 74,000 (April -31K, May -43K), bringing the 3-month average to +111,000. This suggests the labor market has been softer than initially reported.
In Line with Consensus: Eurozone Disinflation Direction
Eurozone HICP flash came in at 2.8%, down from 3.2% in May. The direction was expected, but services inflation at 3.2% proved stickier than anticipated. Energy deceleration (from 10.8% to 8.7%) drove most of the headline improvement — raising questions about durability.
Japan’s Tankan: A Tale of Two Numbers
Japan’s quarterly Tankan survey delivered a genuine positive surprise on sentiment — large manufacturer DI at 22 versus a March forecast of 14. However, fiscal year 2026 profit plans collapsed to -6.5% (from -2.4% in March), as cost pressures from tariffs and yen weakness overwhelmed revenue gains.
This “strong sentiment, weak profits” combination is the defining paradox of Japan’s current macro environment.
The Week’s Defining Theme
Across all major releases this week, the common thread was coexistence of surface-level strength and underlying pressure. US payrolls missed but private sector diffusion held above 50. Japan’s Tankan beat but profits collapsed. Eurozone inflation fell but services remained sticky. This complexity makes simple “risk-on” or “risk-off” characterizations inadequate.
主要指標ハイライト①:米雇用統計と日本短観の深層
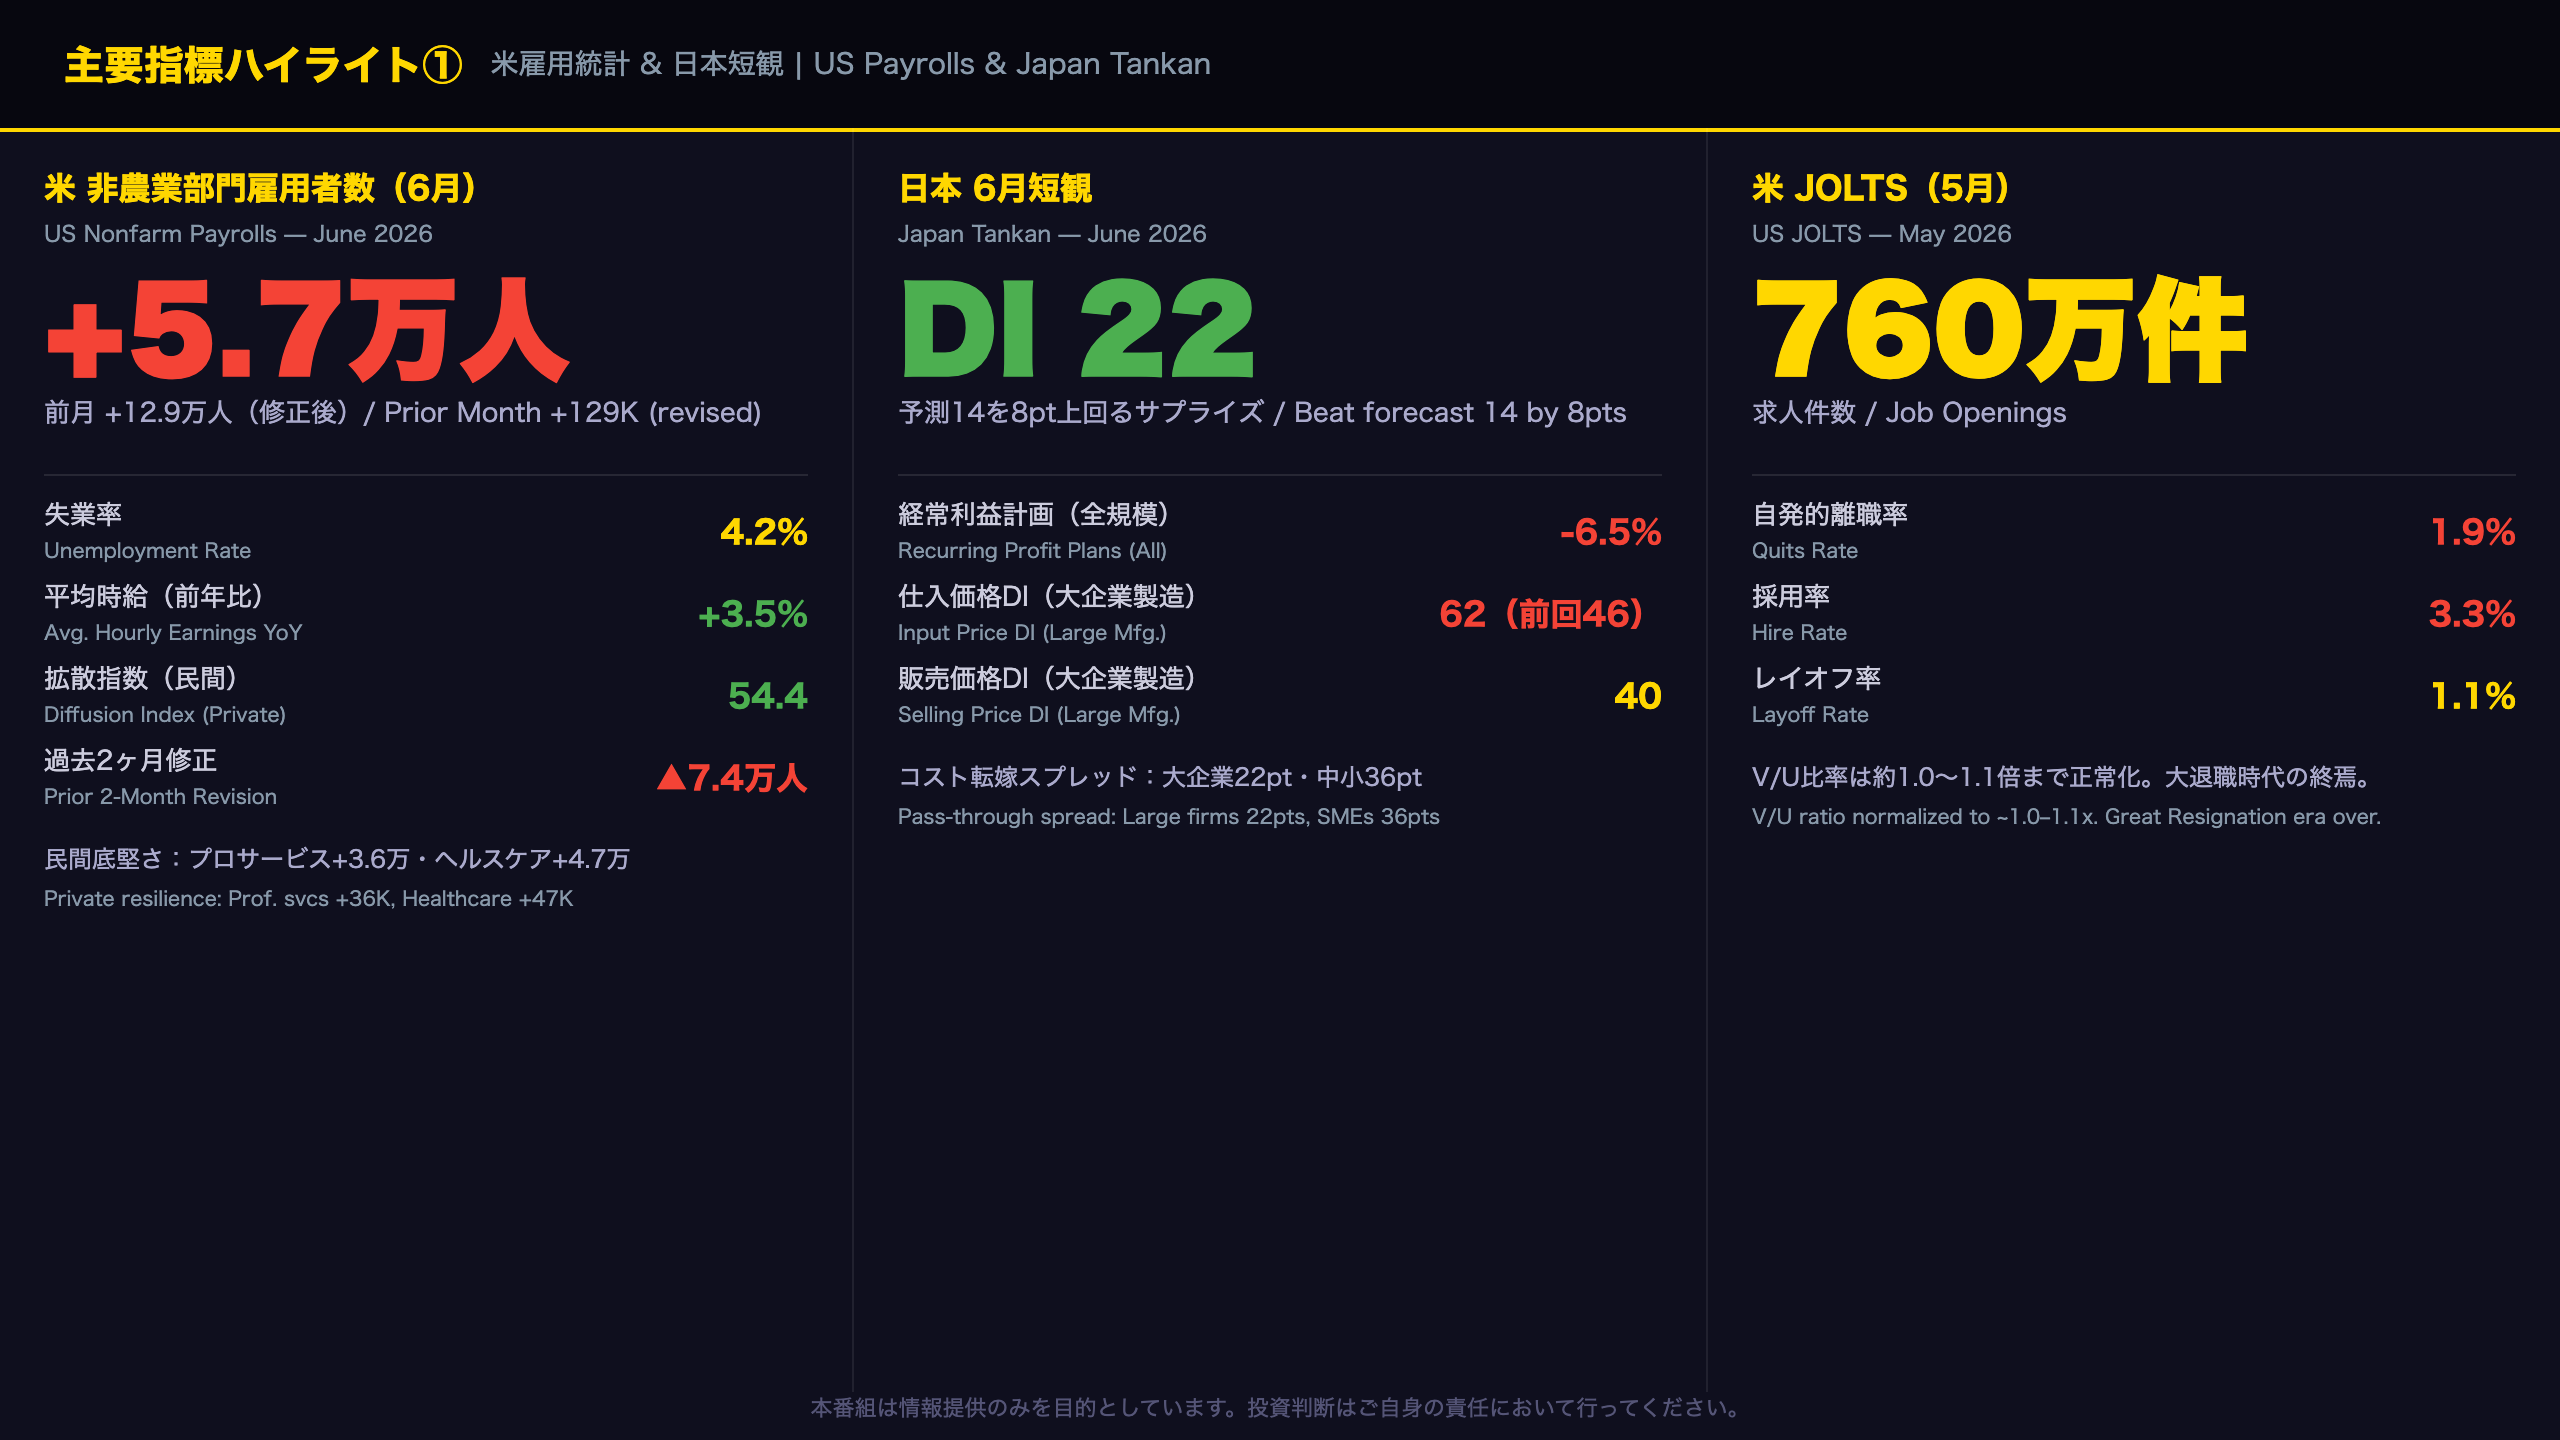
US Jobs & Japan Tankan: Deep Dive into the Week’s Two Centerpieces
US Employment: Seasonal Noise or Structural Shift?
The June nonfarm payrolls report requires careful interpretation. The BLS explicitly flagged “weaker than usual seasonal hiring” in leisure and hospitality — meaning the seasonal adjustment model expected a larger summer hiring surge than actually materialized. This is a statistical artifact, not necessarily a sign of structural deterioration.
What the JOLTS data adds: May job openings held at 7.6 million, with the V/U ratio (vacancies per unemployed worker) estimated at approximately 1.0–1.1x — down sharply from the 2022 peak of ~2.0x but still above pre-pandemic norms. The labor market is normalizing, not collapsing.
The quits rate signal: At 1.9%, the voluntary quit rate has fallen sharply from the 2022 “Great Resignation” peak above 3.0%. This typically signals reduced worker bargaining power, which should gradually ease wage inflation pressure — a positive for the Fed’s inflation fight, though the transmission takes time.
Japan Tankan: The Cost Squeeze in Numbers
The Tankan is Japan’s most comprehensive quarterly business survey, conducted by the Bank of Japan across approximately 10,000 companies. The June 2026 survey revealed a striking paradox:
- Large manufacturer DI: 22 (beat forecast of 14 by 8 points)
- FY2026 profit plans: -6.5% (worsened from -2.4% in March)
The input price DI surge from 46 to 62 (+16 points) reflects tariff impacts and yen weakness hitting import costs harder than initially anticipated. The cost pass-through spread — input price DI minus selling price DI — stands at 22 points for large firms and 36 points for small firms, confirming that smaller companies are absorbing more cost pressure than they can pass on to customers.
Long-term inflation expectations are also drifting higher: 5-year price outlook at 6.1% (up 0.5pts from March), suggesting businesses are pricing in a structurally higher inflation environment.
主要指標ハイライト②:欧州・日本・カナダの構造的変化
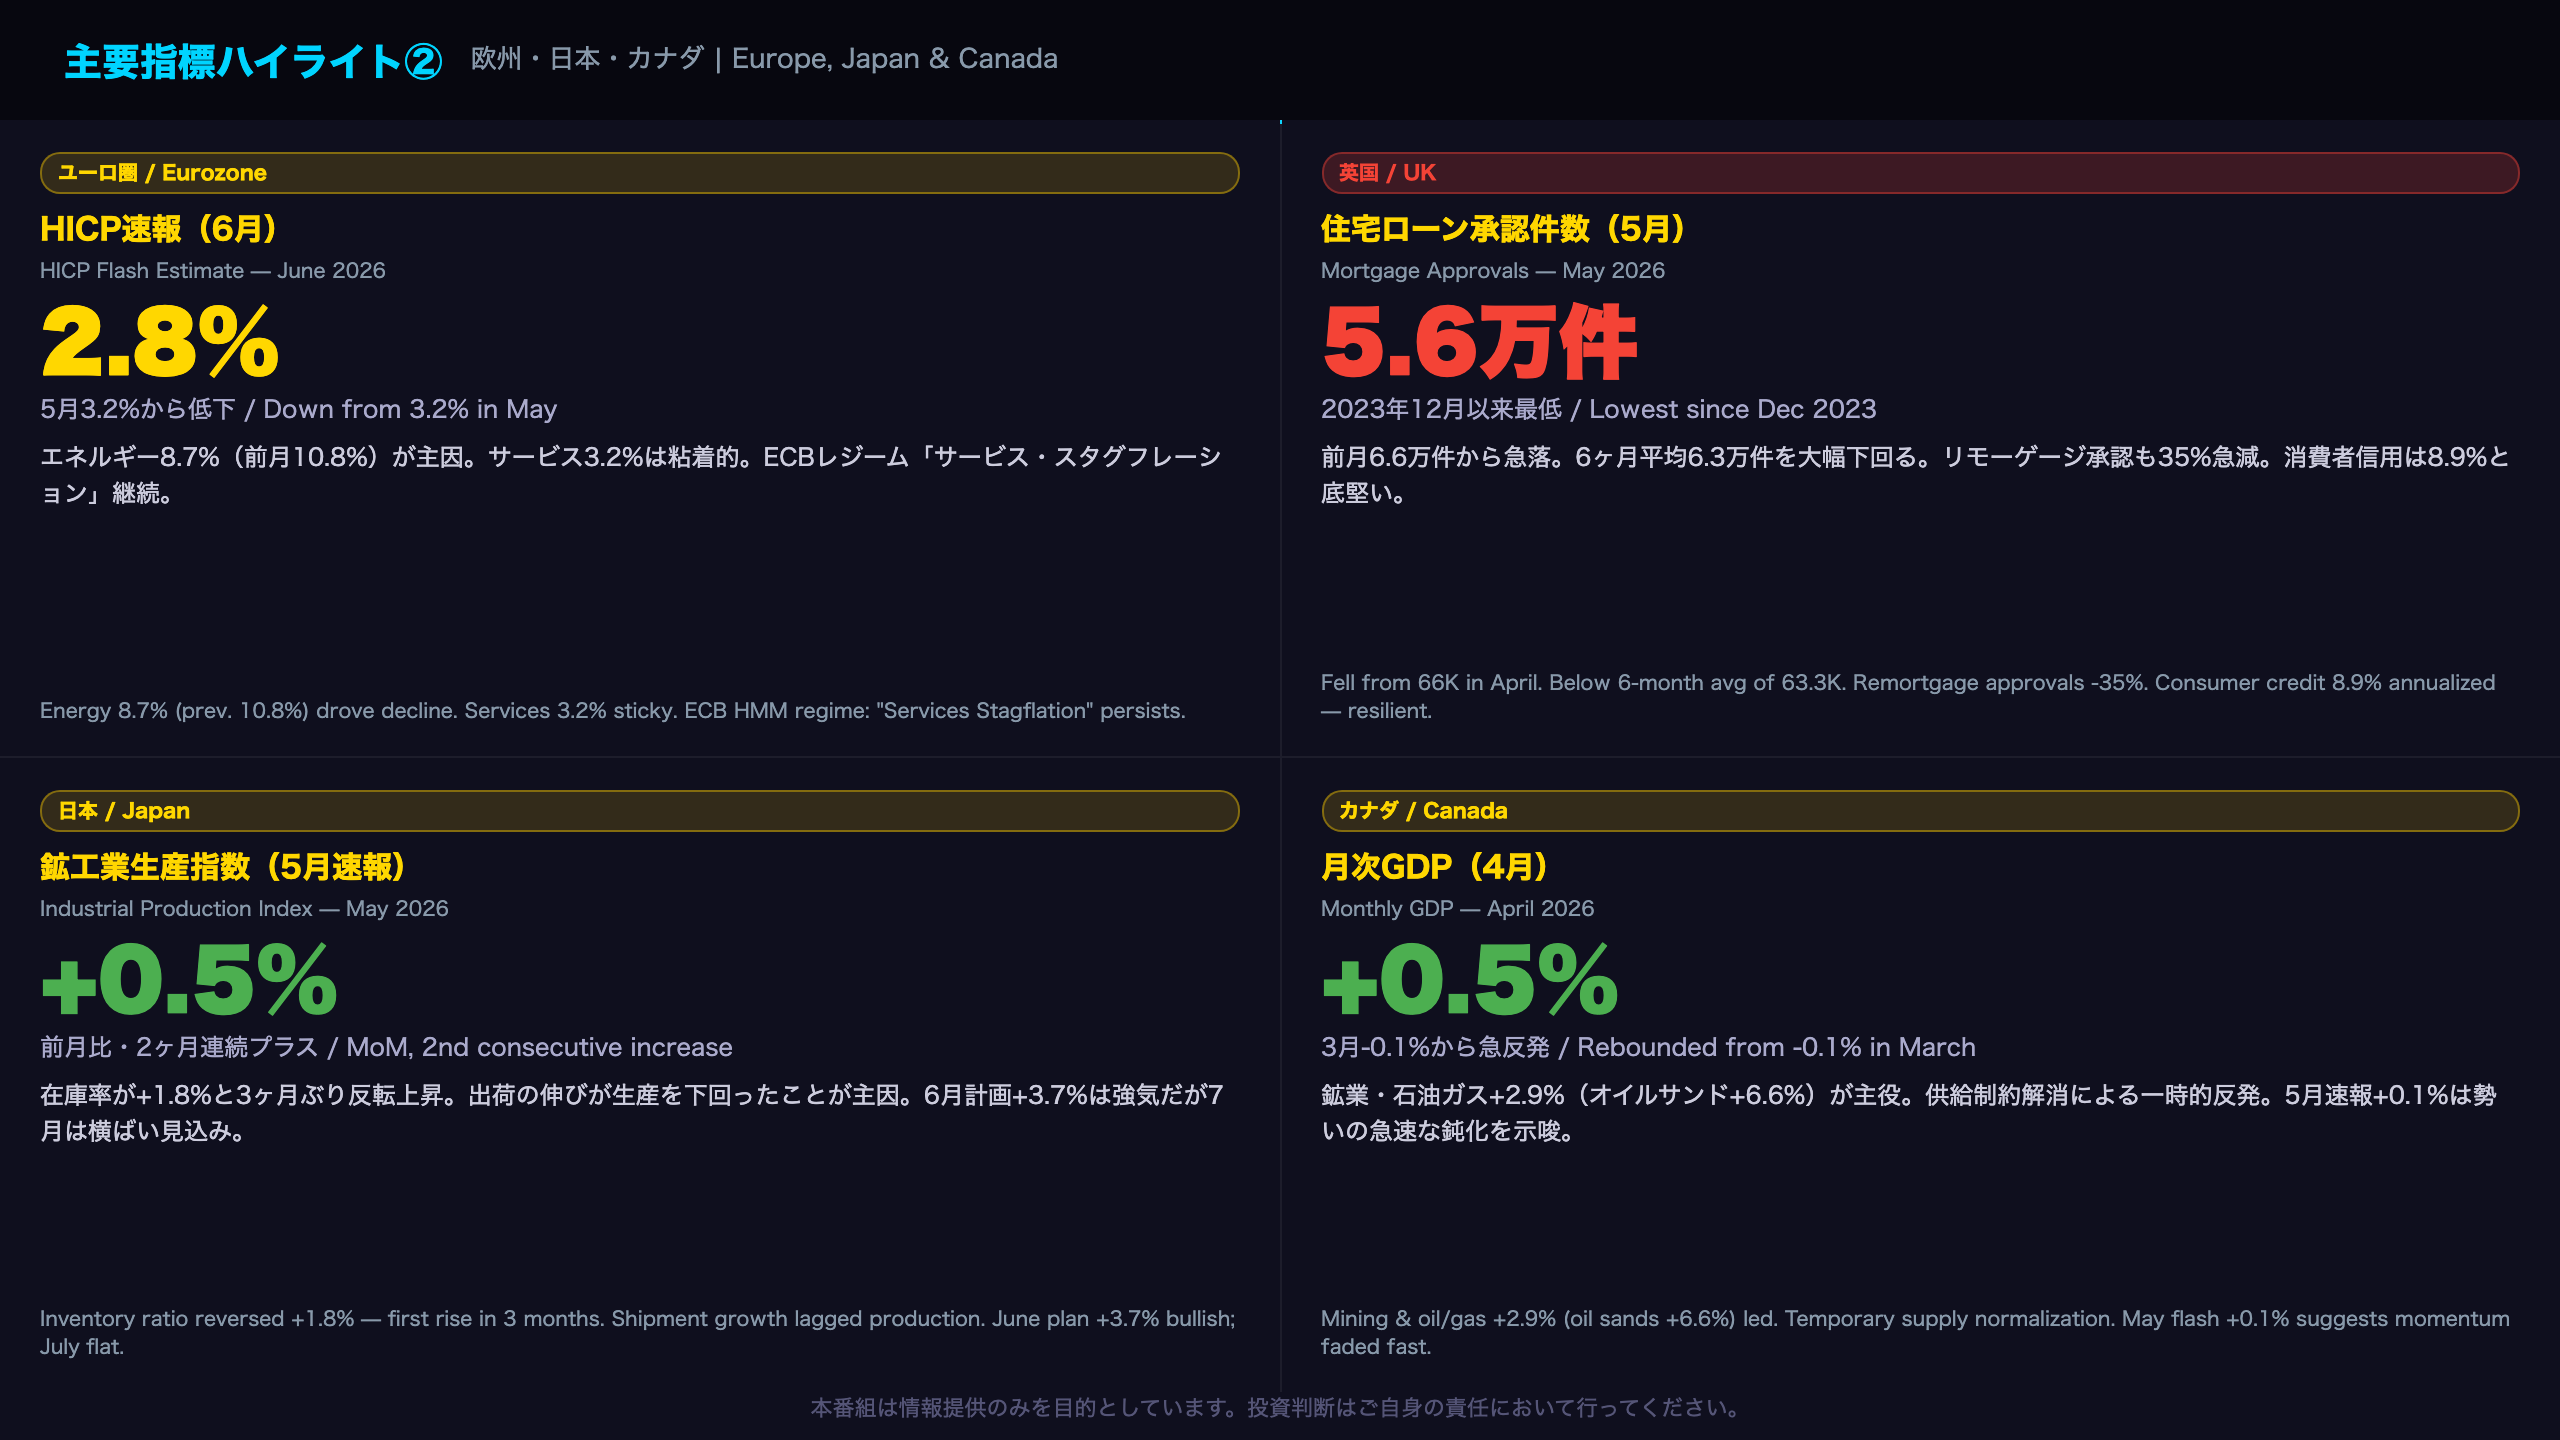
Europe, Japan & Canada: Structural Shifts in Focus
Eurozone: Energy-Led Disinflation — How Durable?
The Eurozone HICP flash estimate of 2.8% for June masks important compositional differences. Energy decelerated from 10.8% to 8.7%, contributing approximately -0.19 percentage points to the headline decline. Services, however, only eased from 3.5% to 3.2% — remaining well above the ECB’s implicit comfort zone.
The ECB’s HMM regime classification of “Services Stagflation” captures this tension precisely: rate cuts are continuing, yet underlying service price pressures persist. This creates a policy dilemma — cut too fast and risk re-igniting inflation; cut too slowly and risk unnecessary economic damage.
UK: Housing Market Freeze vs. Consumer Credit Resilience
The Bank of England’s May Money and Credit statistics revealed a striking divergence. Mortgage approvals collapsed to 56,200 — the lowest since December 2023 — with remortgage approvals down 35% month-on-month. This suggests the cumulative effect of BOE rate hikes is now feeding through to housing market activity with a lag.
Yet consumer credit growth held at 8.9% annualized, and M4ex (broad money) accelerated to 4.8% YoY. The UK economy appears to be experiencing a two-speed dynamic: housing cooling sharply while consumer spending remains supported.
Japan: Inventory Cycle at an Inflection Point
May industrial production rose 0.5% MoM for a second consecutive month, but the inventory ratio reversed higher (+1.8%) for the first time in three months. This occurred because shipment growth lagged production growth — a potential early signal of inventory accumulation. The June production plan of +3.7% suggests manufacturers remain optimistic, but the July plan of flat (0.0%) introduces uncertainty about whether the June rebound will be sustained.
Canada: Energy Rebound — Structural or Temporary?
Canada’s April GDP +0.5% was driven primarily by mining and oil & gas extraction (+2.9%), with oil sands production rebounding +6.6% after “longer than anticipated unscheduled maintenance.” This is a supply-side normalization story, not demand-driven growth. The May flash estimate of just +0.1% supports the view that April’s strength was largely temporary.
中央銀行・政策スタンスの現在地
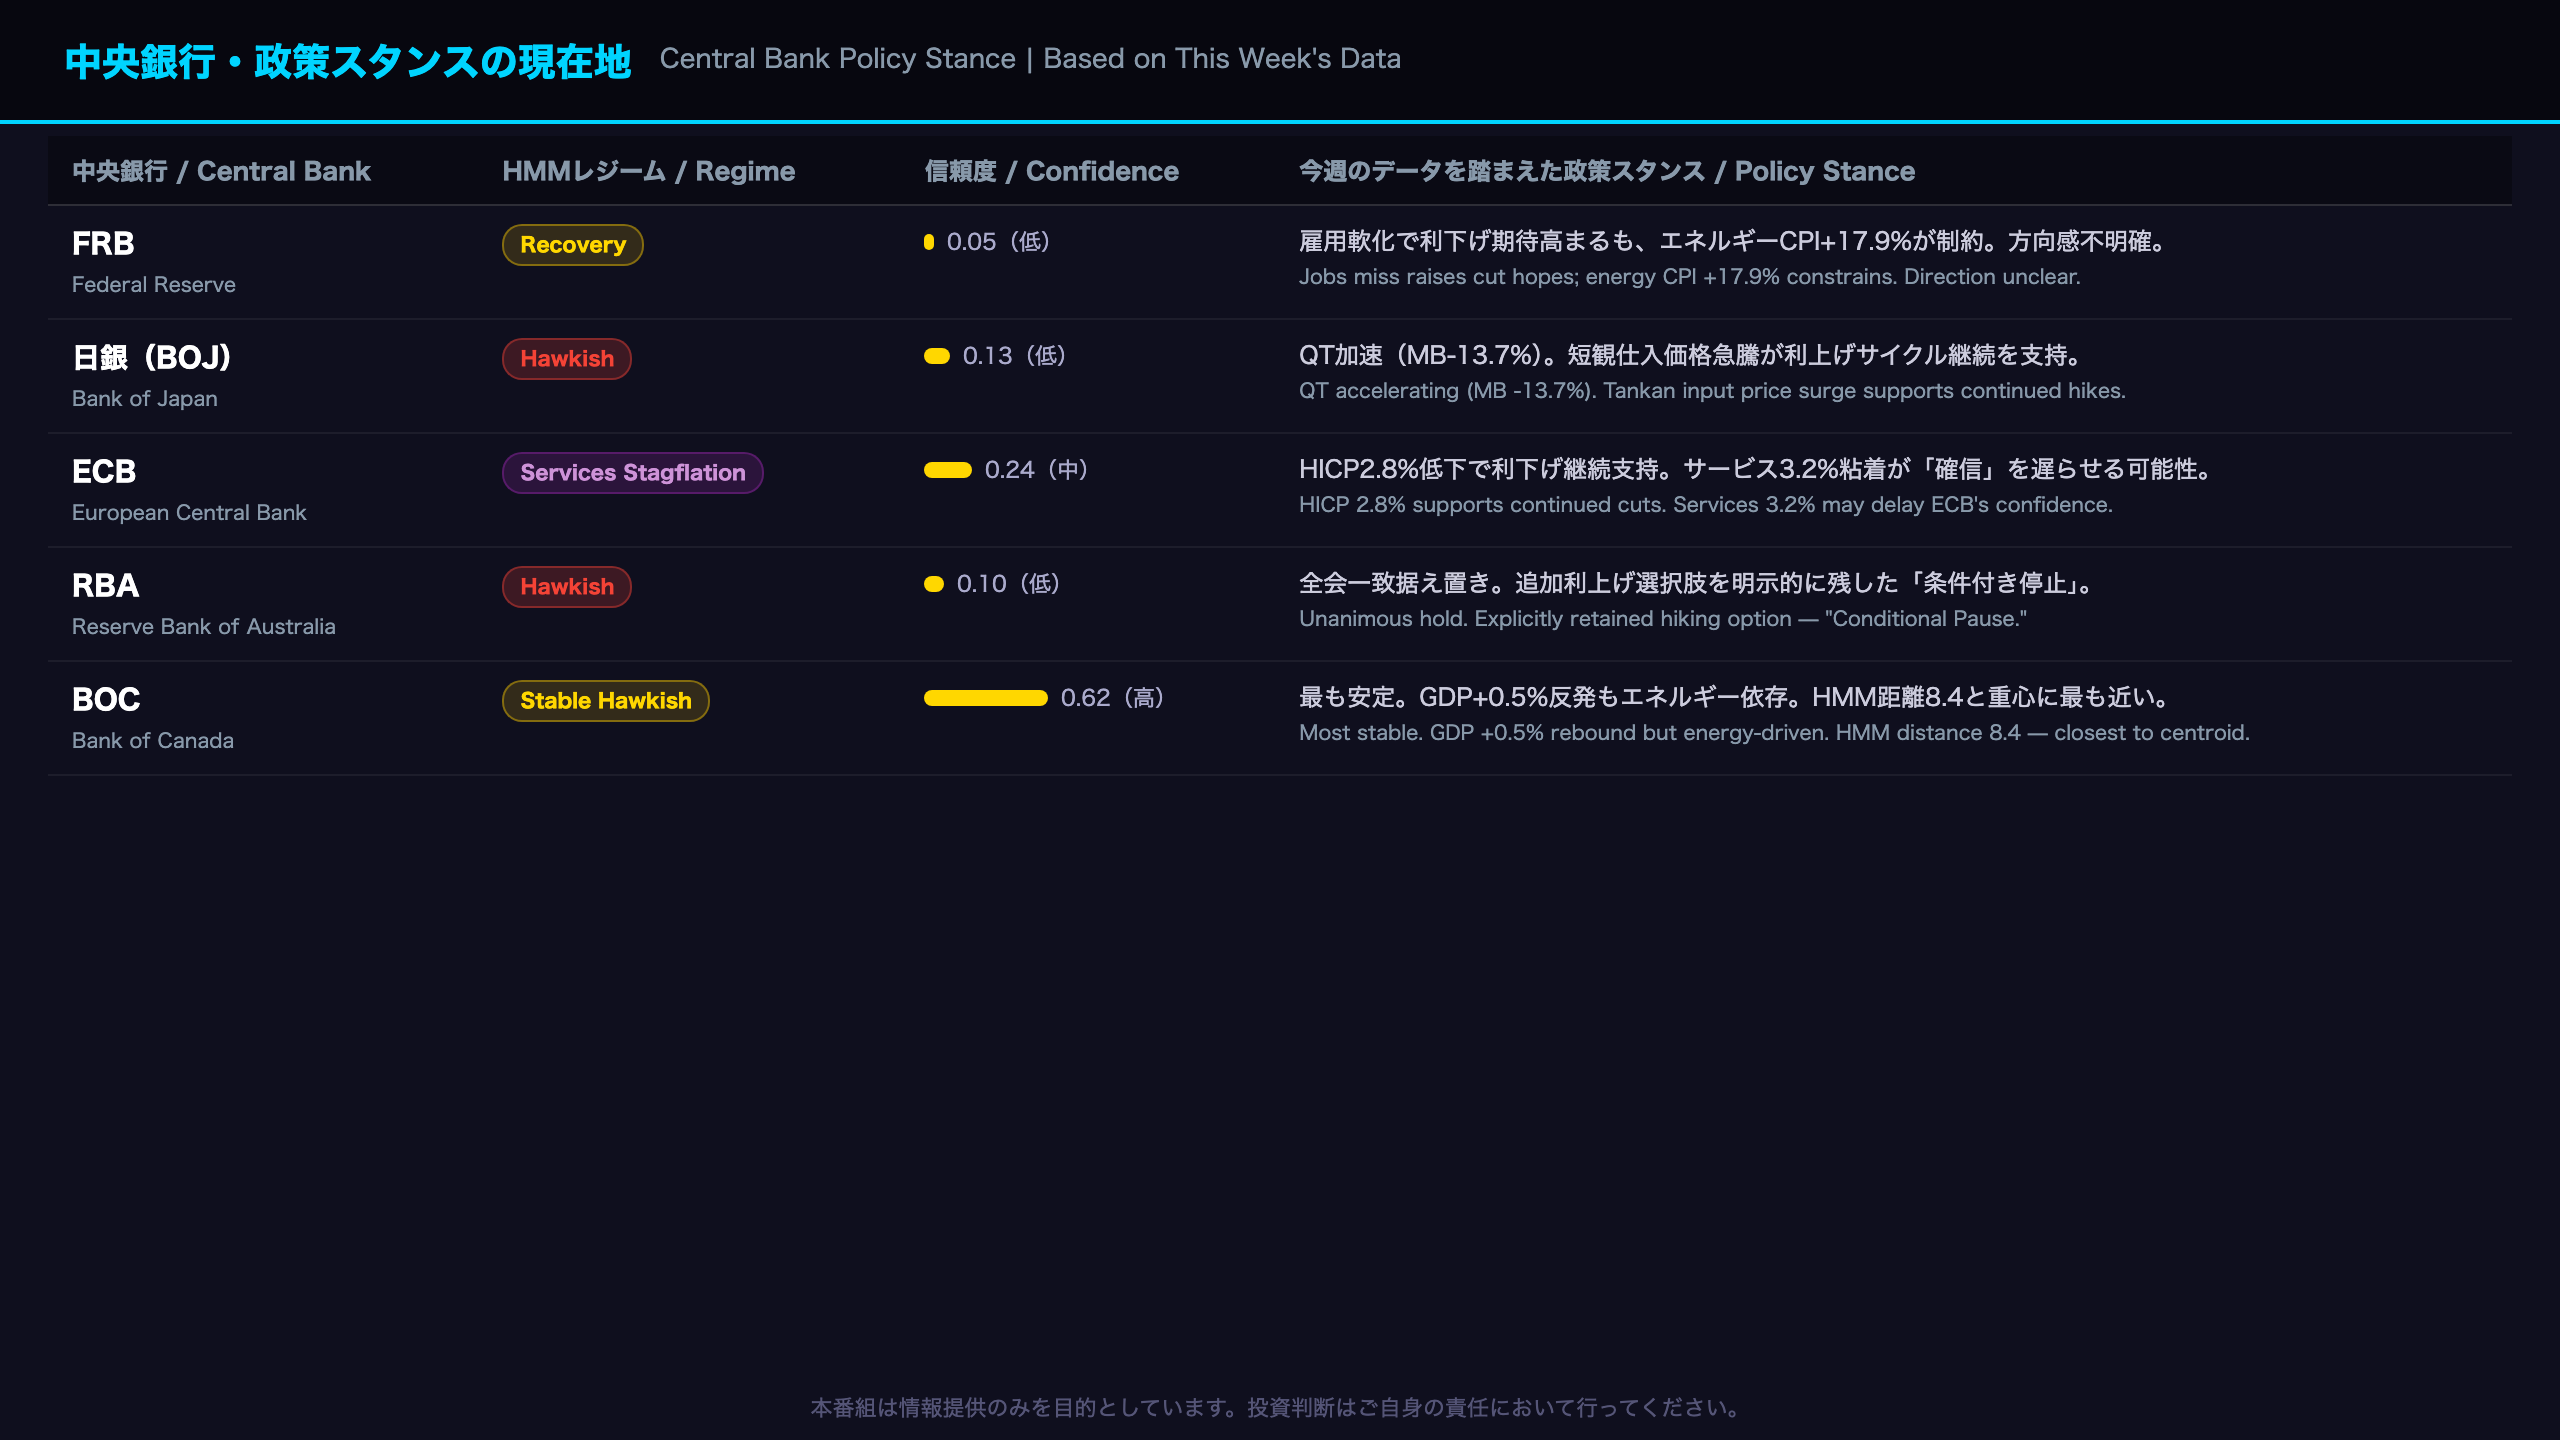
Major Central Banks: What This Week’s Data Changed — and What It Didn’t
Federal Reserve: Rate Cut Hopes vs. Inflation Persistence
The June payrolls miss of 57,000 is unambiguously a dovish data point for the Fed. However, the HMM anomaly signals complicate the picture significantly. Energy CPI at +17.9% YoY (Z-score +2.40) and gasoline CPI at +28.4% YoY (Z-score +2.52) represent statistically significant deviations from the current regime’s typical pattern. These are not minor fluctuations — they suggest inflation pressure is building in energy-sensitive components even as the labor market softens.
The US HMM regime is classified as “Recovery (R2)” but with extremely low confidence (0.05) and a Mahalanobis distance of 34.6 — far from the regime centroid. This means the current economic state doesn’t fit neatly into any historical pattern, making policy guidance particularly uncertain.
Bank of Japan: QT Acceleration Confirms Hawkish Trajectory
The BOJ’s monetary base contraction of -13.7% YoY, with current account balances at -16.4%, is fully consistent with its “Hawkish (R2)” HMM regime. The Tankan’s input price DI surge (46→62) and upward shift in long-term inflation expectations (5-year outlook at 6.1%) provide the BOJ with justification for continued policy normalization.
ECB: Cutting Rates While Navigating “Services Stagflation”
The ECB’s HMM regime of “Services Stagflation” captures the central bank’s dilemma precisely. The HICP flash at 2.8% supports continued rate cuts, but services inflation at 3.2% — which has been range-bound between 3.0–3.5% for over a year — prevents the ECB from declaring victory on inflation.
RBA: “Conditional Pause” — The Most Nuanced Stance
The RBA’s unanimous hold in June, combined with the explicit retention of a hiking option (“including increasing the cash rate target if necessary”), represents the most carefully calibrated stance among major central banks this week. The HMM regime is “Hawkish (R1)” with low confidence (0.10), reflecting genuine uncertainty about the next move.
Bank of Canada: The Stability Anchor
With an HMM confidence score of 0.62 — the highest among all 10 central bank models — and a Mahalanobis distance of just 8.4 (closest to the regime centroid), the BOC’s “Stable Hawkish (R0)” classification is the most reliable signal in this week’s analysis.
今週の番組制作費コーナー
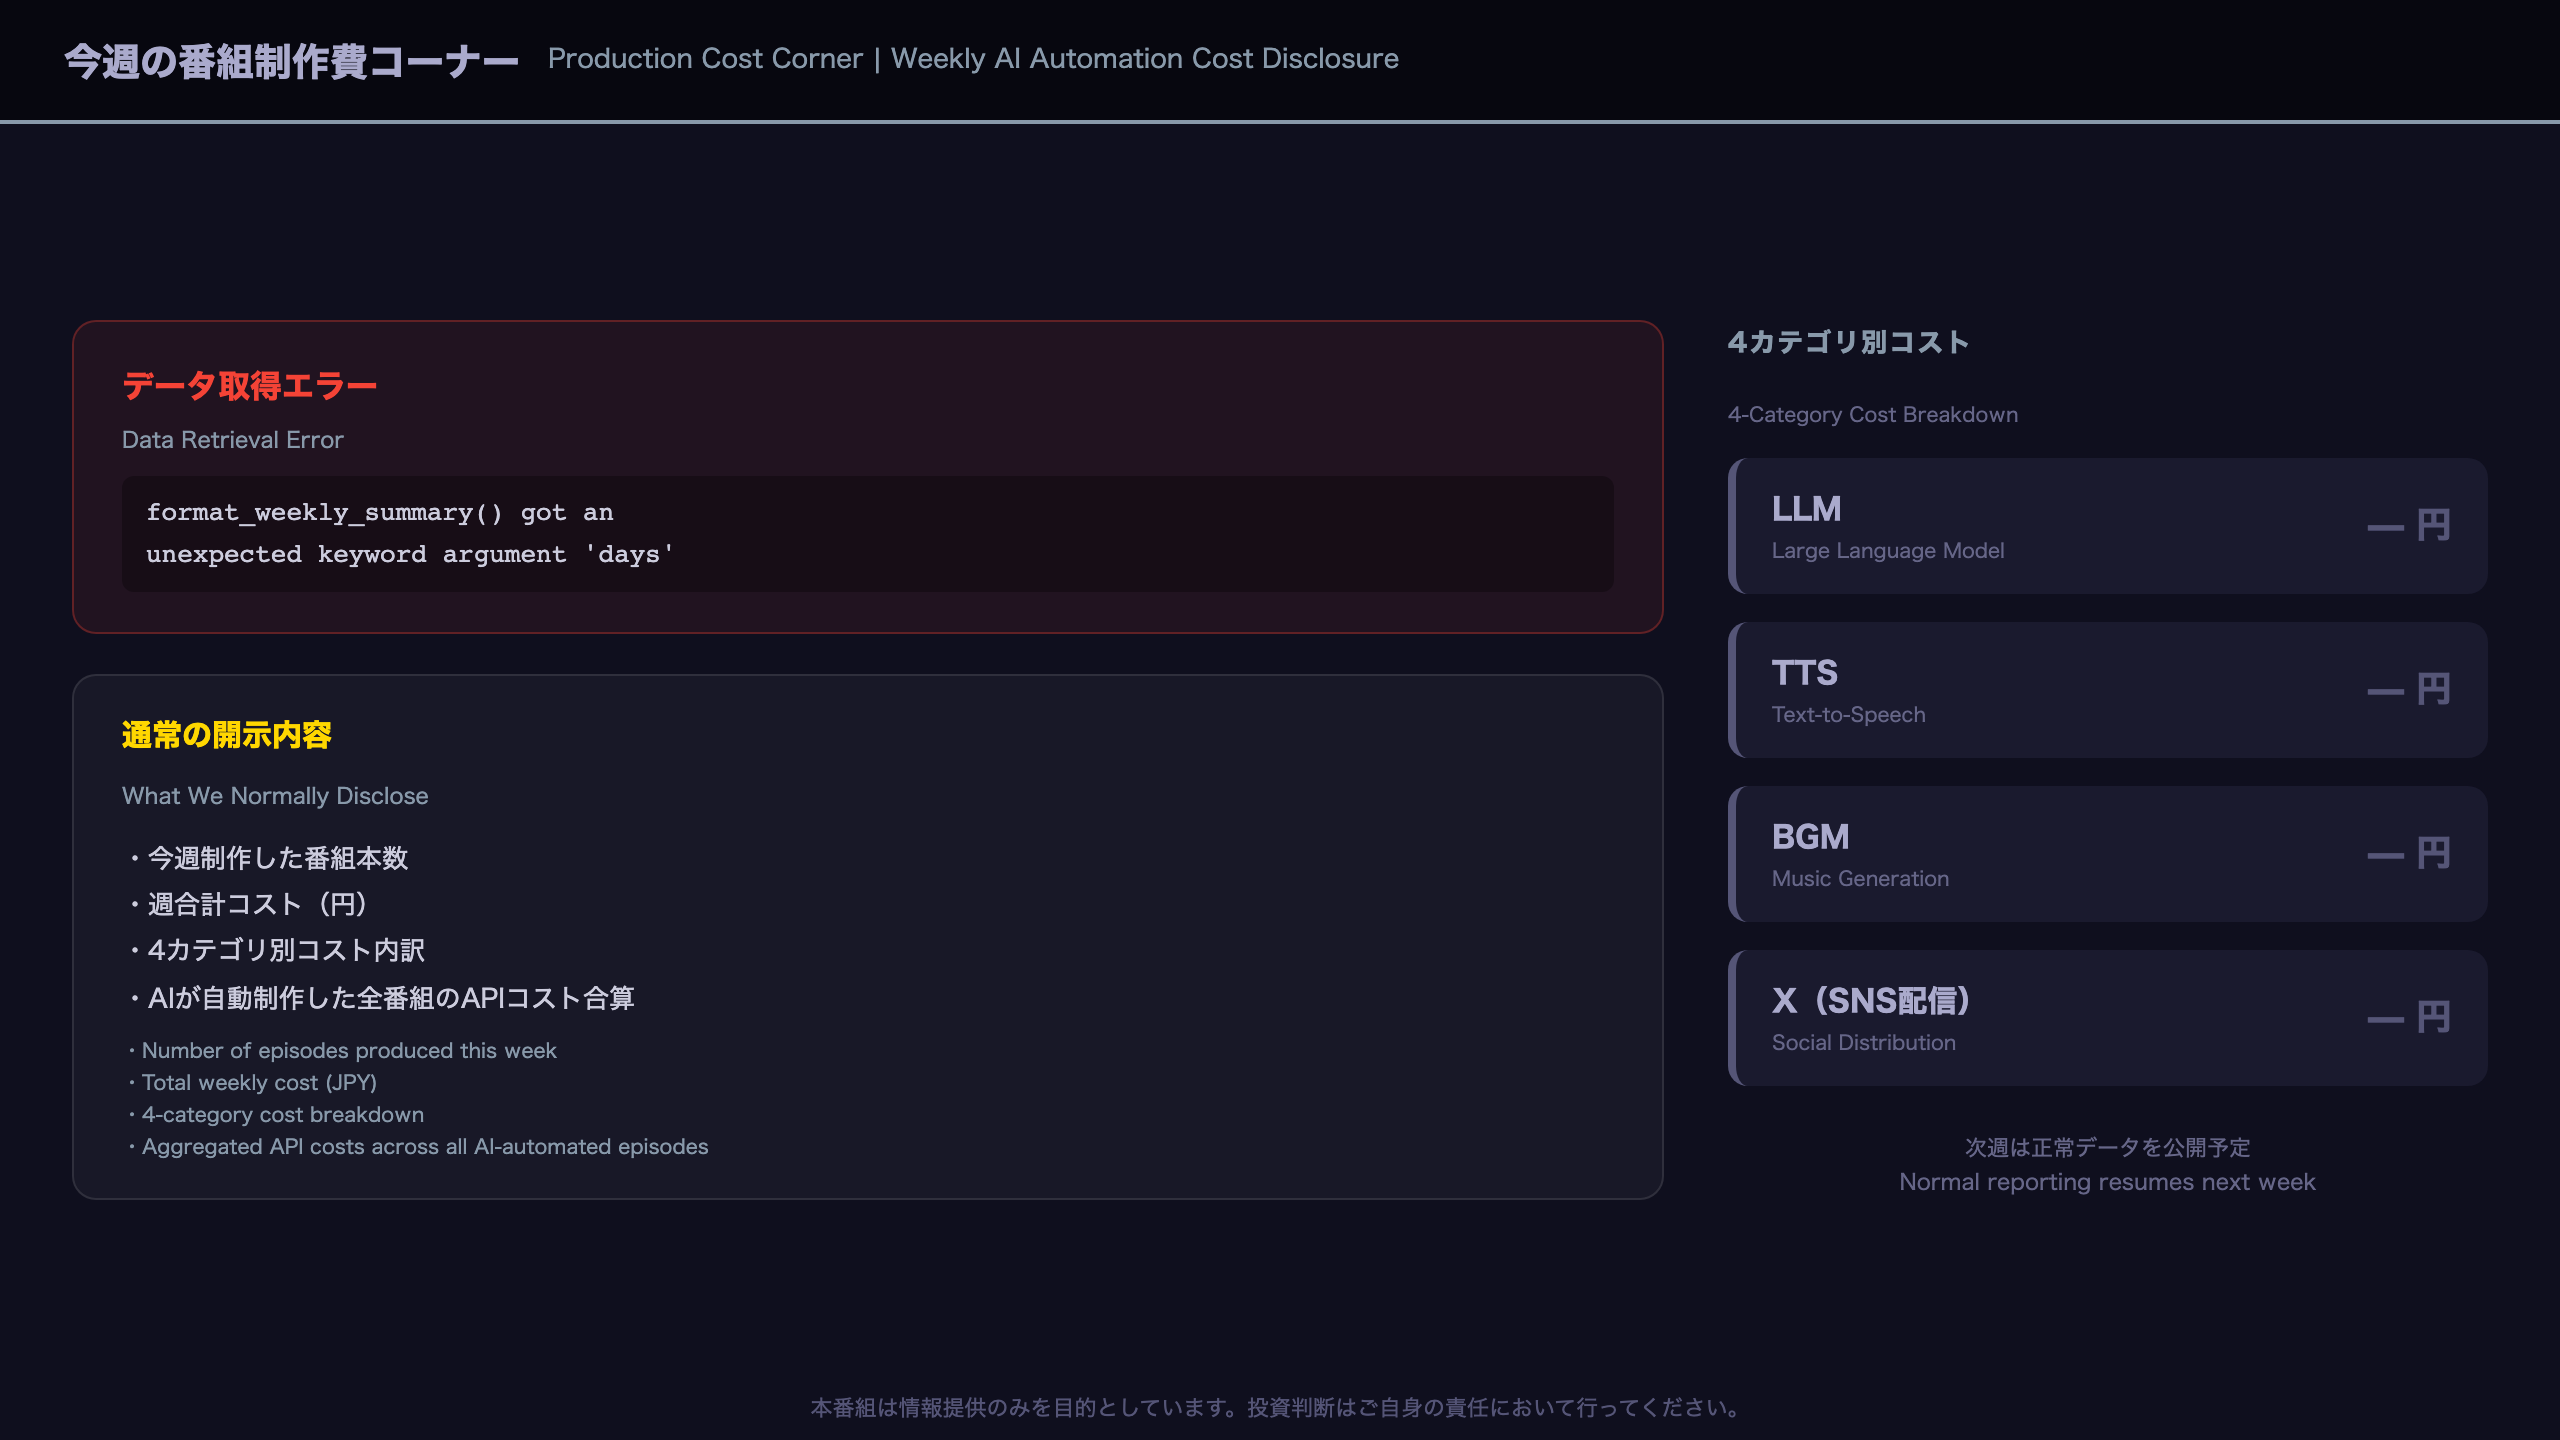
Weekly Production Cost Corner
Data Retrieval Error This Week
This week’s production cost data was unavailable due to a system error (format_weekly_summary() got an unexpected keyword argument 'days'). We apologize for the gap in our usual transparency reporting.
What We Normally Disclose
NFC Market Live publishes weekly production cost data across four categories:
| Category | Description |
|---|---|
| LLM | Large language model API costs (script generation, analysis) |
| TTS | Text-to-speech synthesis API costs (narration generation) |
| BGM | Music generation API costs (Lyria and similar) |
| X (Twitter) | Social media distribution API costs |
Why We Publish This Data
NFC Market Live is fully AI-automated — from script generation and slide creation to voice synthesis, BGM composition, video editing, and social media distribution. By publishing the actual API costs each week, we aim to provide transparency into the economics of AI-driven media production.
This kind of cost transparency is rare in the media industry, and we believe it helps viewers understand both the capabilities and the real-world costs of AI content production at scale. Normal reporting will resume next week.
来週の注目イベントカレンダー
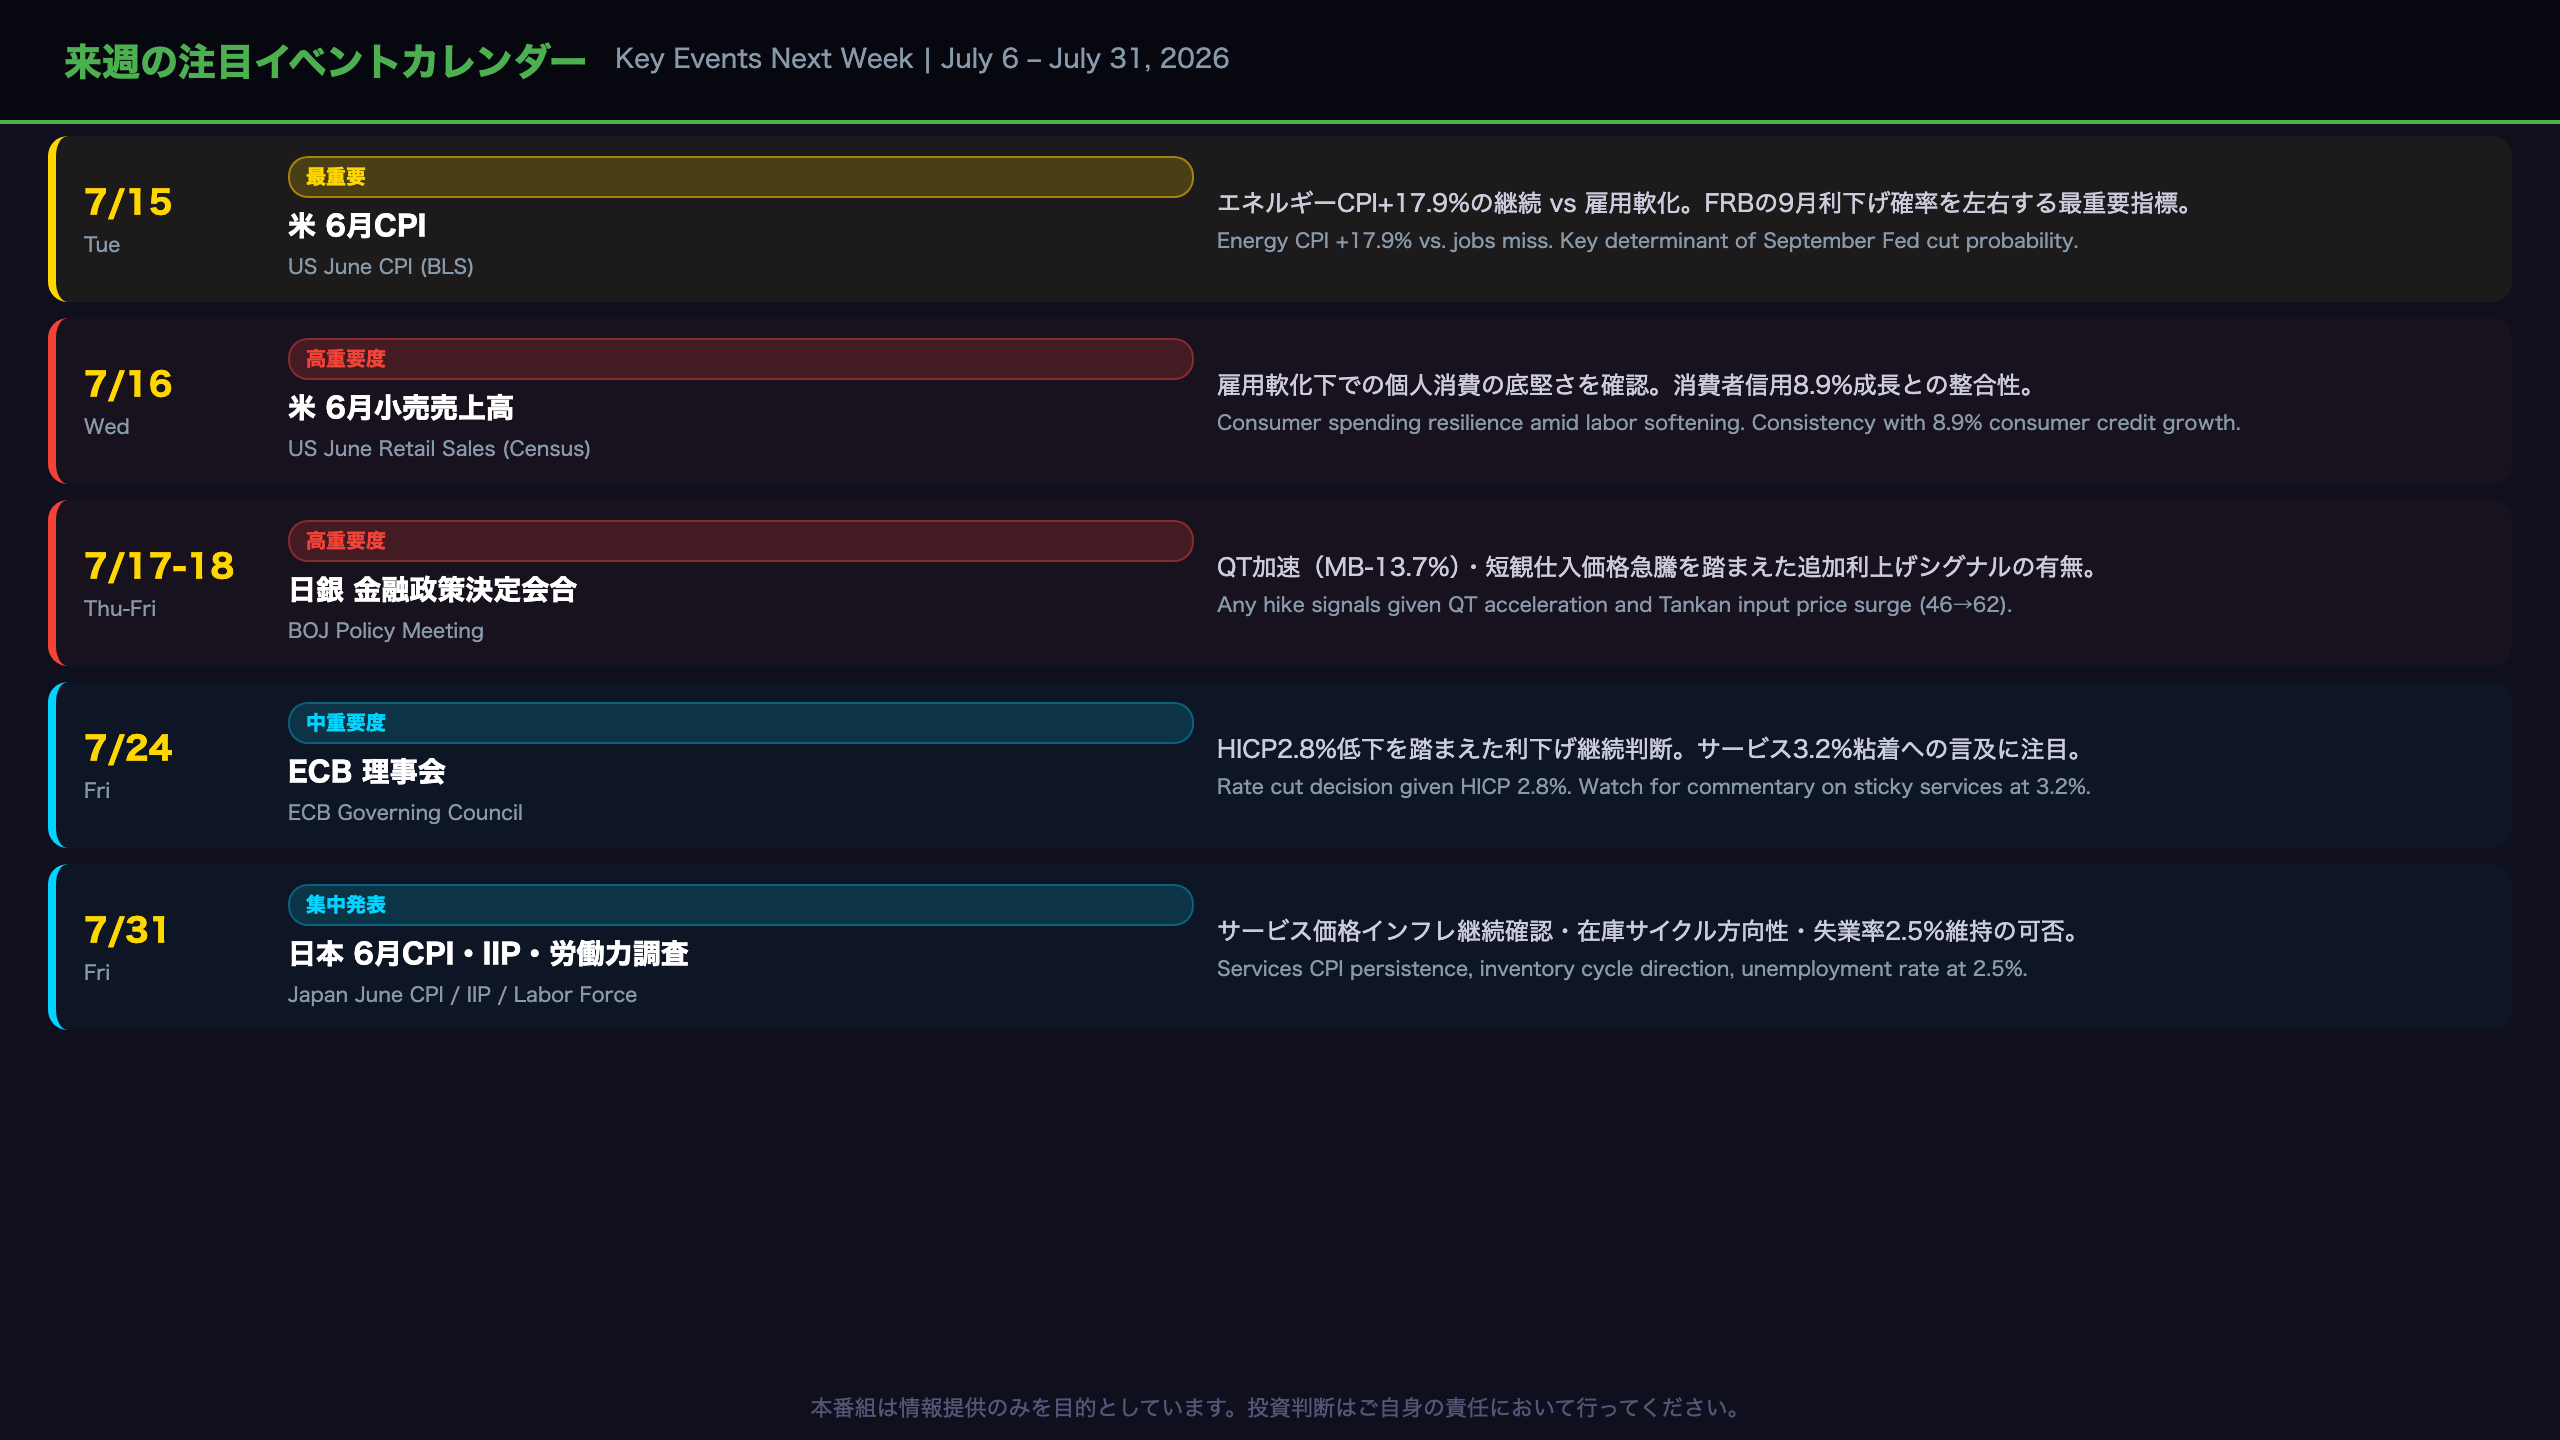
Next Week’s Key Event Calendar (Week of July 6–12, 2026)
Top Priority: US June CPI (July 15)
Why it matters: This week’s payrolls miss of 57,000 has elevated Fed rate cut expectations. June CPI will either confirm or challenge this narrative. The HMM anomaly signals — energy CPI at +17.9% YoY and gasoline CPI at +28.4% YoY — suggest upside inflation risk remains.
The evidence chain:
– If CPI prints above 3.5% YoY → Fed cut expectations for September likely fade → USD strengthens, Treasuries sell off
– If CPI prints below 3.2% YoY → September cut probability rises → USD weakens, yield curve steepens
– Services CPI (shelter MoM +0.6% in the HMM data) remains the key sticky component to watch
US June Retail Sales (July 16)
Why it matters: With the quits rate at 1.9% and consumer credit growing at 8.9% annualized (UK data as proxy), the question is whether US consumers are still spending despite labor market softening. A miss here would reinforce the “soft landing” narrative; a beat would complicate the Fed’s calculus.
BOJ Policy Meeting (July 17–18)
Why it matters: The BOJ’s monetary base is contracting at -13.7% YoY, and the Tankan showed input price DI surging from 46 to 62. The meeting will be watched for any signals on the pace of further rate hikes or QT acceleration.
Evidence chain: Tankan input price surge → inflation upside risk → supports continued BOJ normalization → upward pressure on JGB yields → potential USD/JPY downside
Japan June CPI, IIP & Labor Force Survey (July 31)
Why it matters: Services CPI will confirm whether the labor market tightness in accommodation/food services (employment +5.8% YoY) is translating into price pressures. Industrial production will clarify whether the inventory ratio reversal is a temporary blip or the start of a new accumulation cycle.
Other Key Events
| Date | Event | Key Focus |
|---|---|---|
| Jul 8 | RBA Minutes (detailed) | Details of “Conditional Pause” debate |
| Jul 10 | UK GDP (May) | Housing market spillover to real economy |
| Jul 14 | Eurozone Industrial Production (May) | Consistency with 3-month ICI deterioration |
| Jul 24 | ECB Governing Council | Rate cut decision given HICP 2.8% |
Disclaimer: This article is for informational purposes only. All investment decisions are made solely at your own risk.