📺 Watch the Full Video Analysis
This article was automatically generated by the NFC Market Live AI analysis system. (Updated: 2026-07-02 13:14 JST)
📄 Primary Source
日本銀行
https://www.boj.or.jp/statistics/boj/other/mb/base2606.pdf
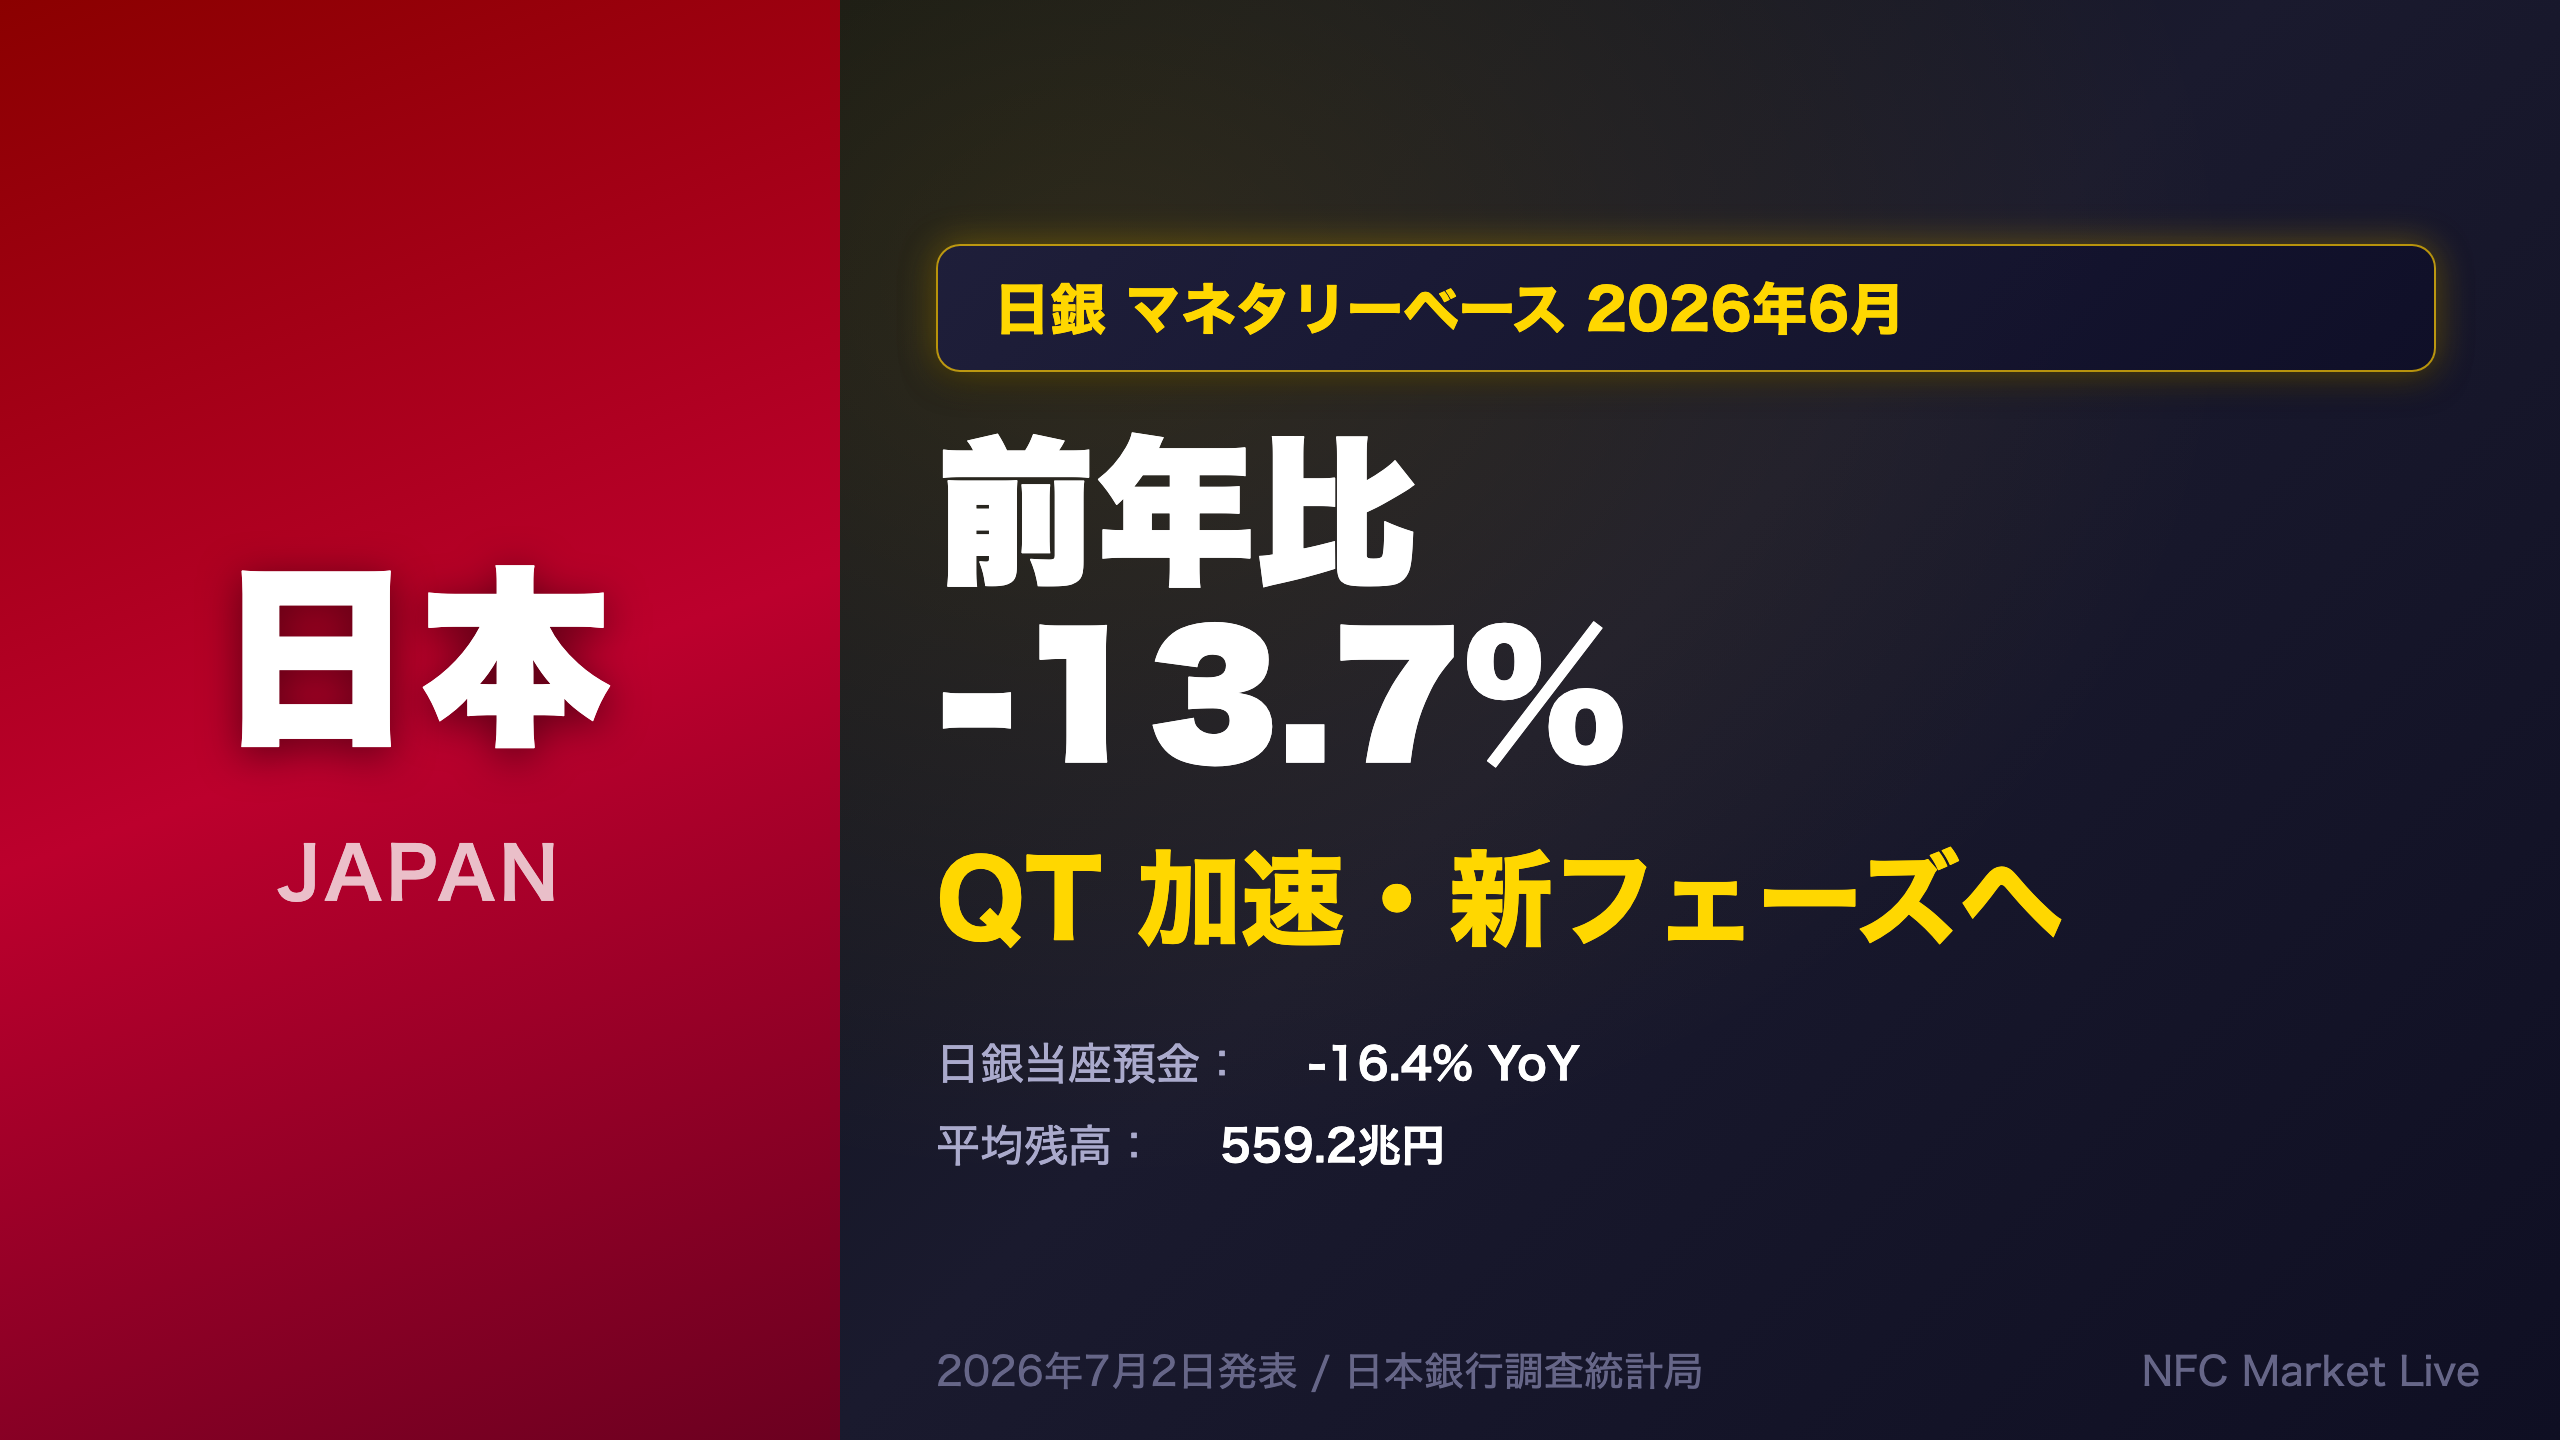
Deep dive into the Bank of Japan’s Monetary Base data for June 2026, released July 2. The headline YoY change accelerated to -13.7% from -12.2% in May. BOJ current account balances contracted -16.4% YoY — the steepest decline in this tightening cycle. We analyze what this means for JGB yields, the yen, and the pace of BOJ balance sheet normalization.
The Ultimate Summary:日銀QTは新フェーズへ — 強弱両面の総合評価
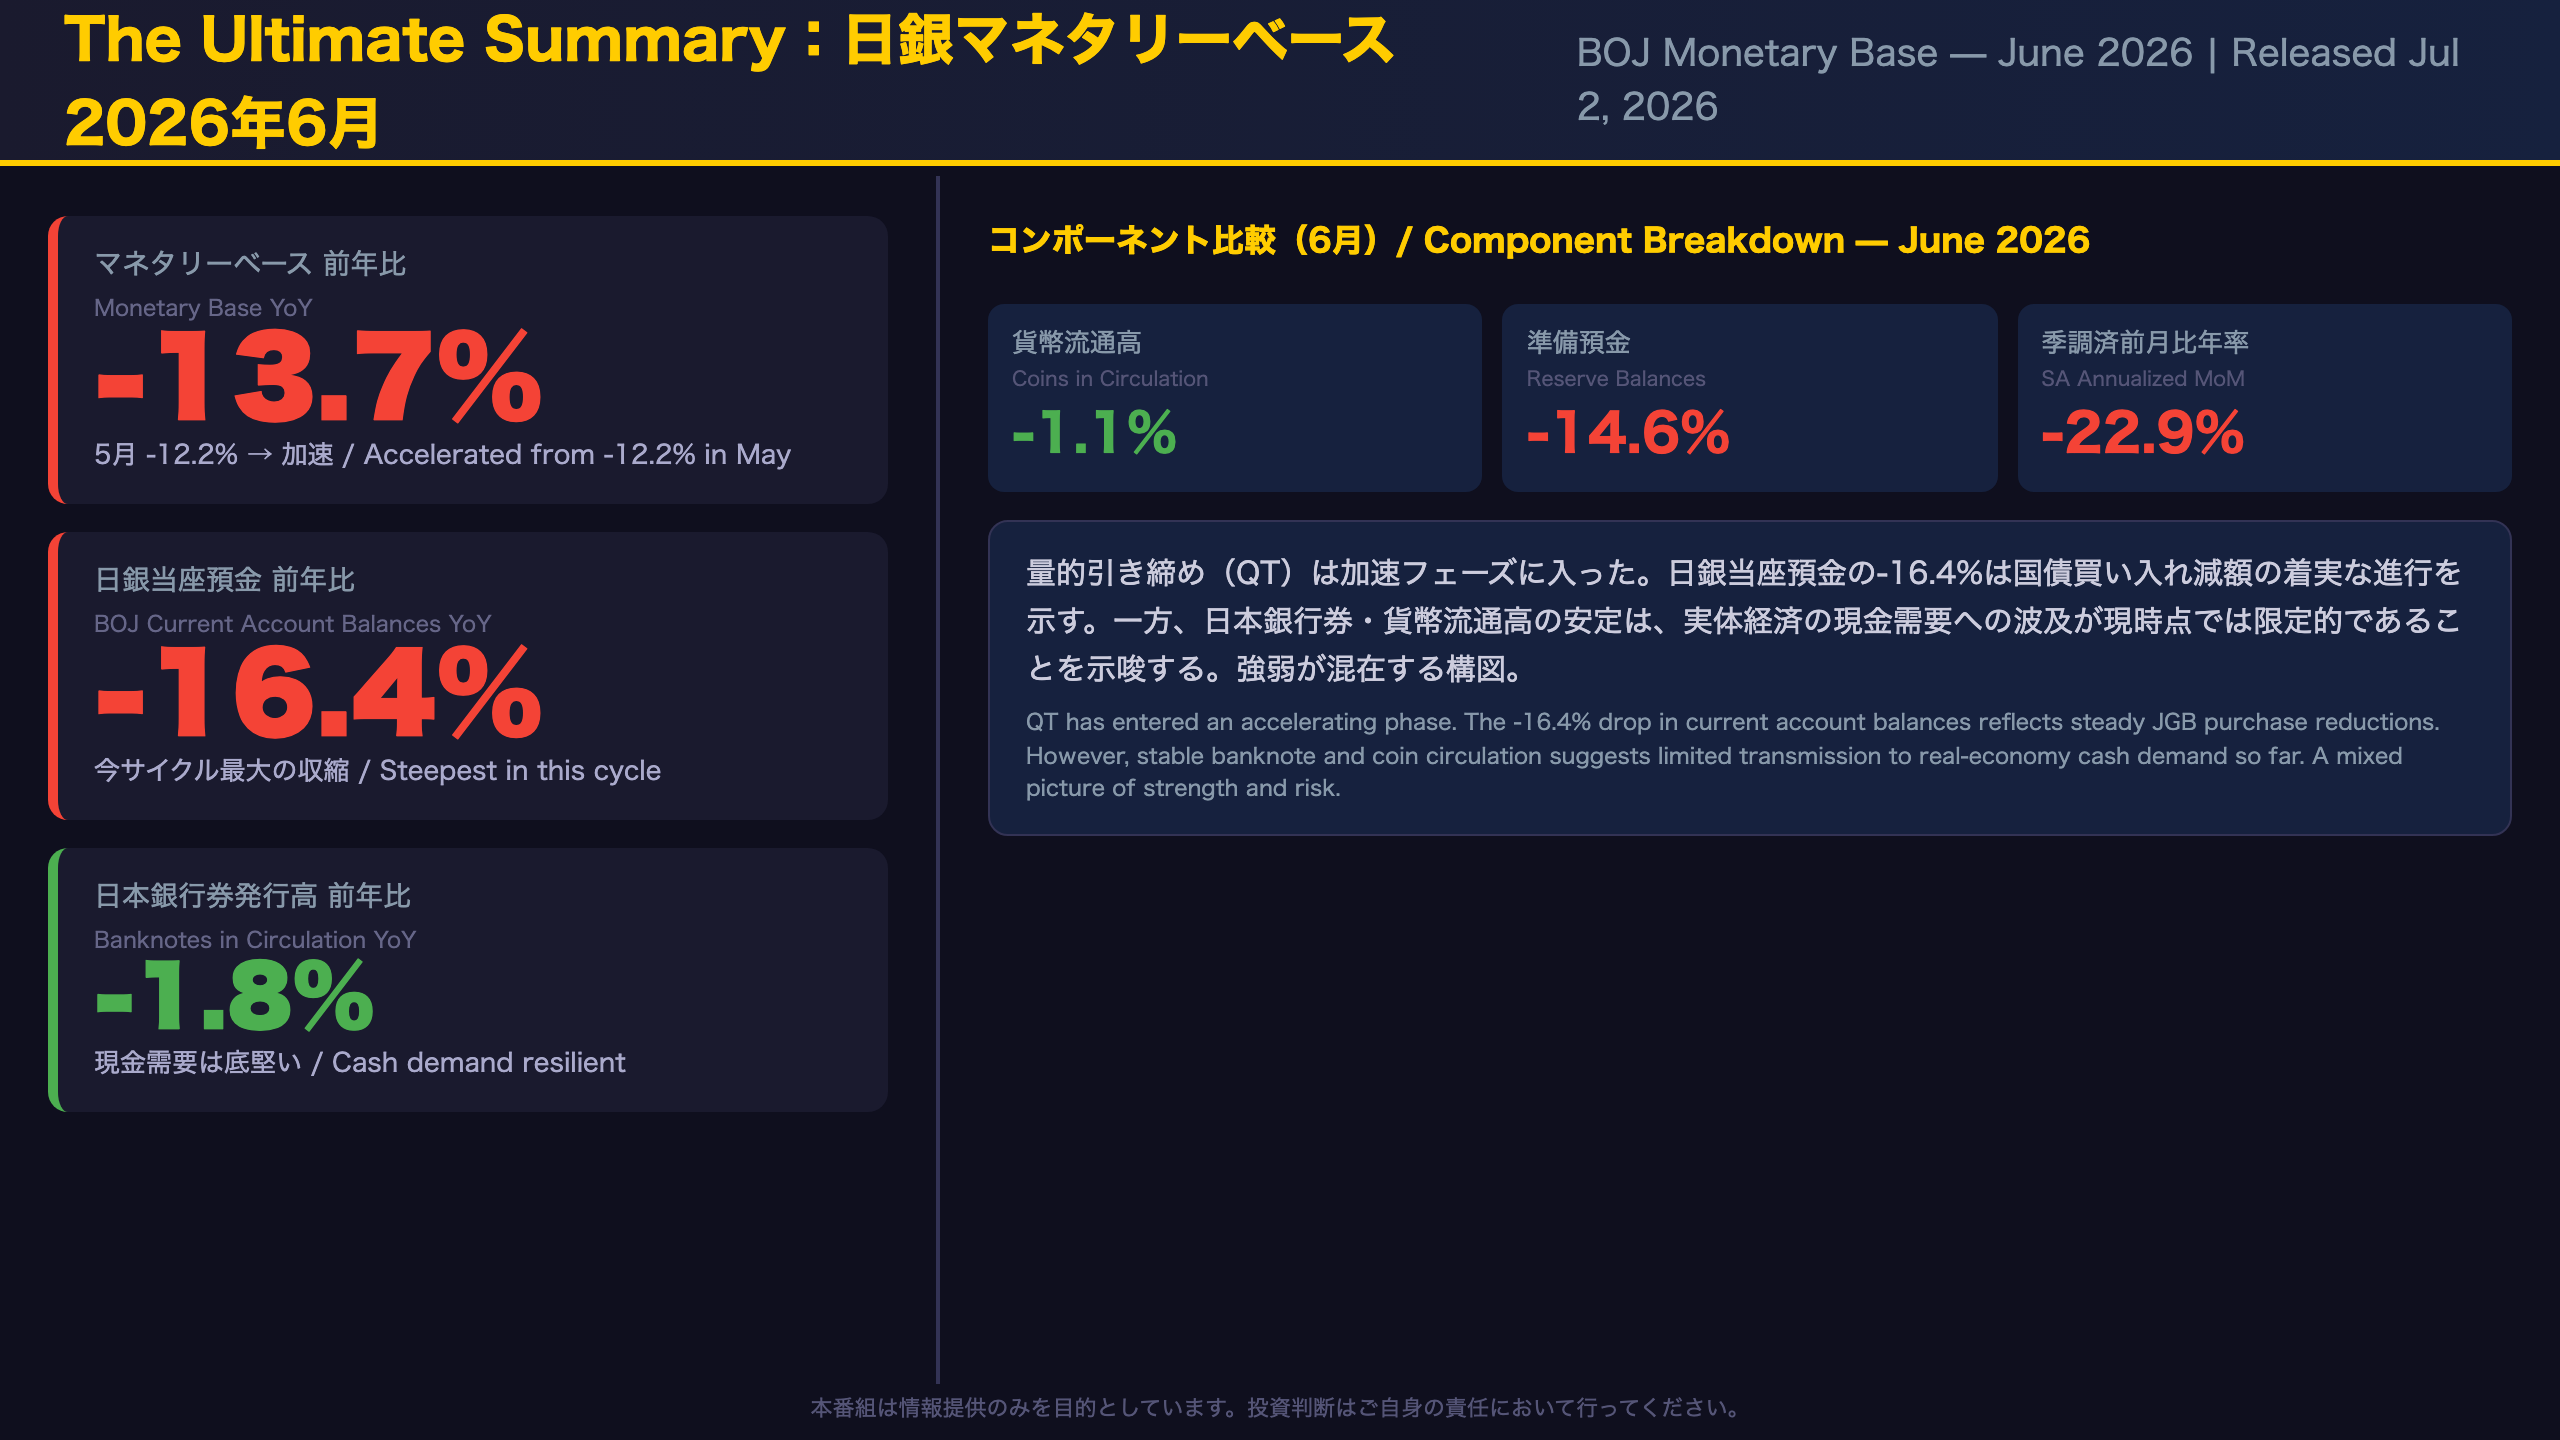
Overall Assessment: QT Accelerates, Real-Economy Impact Remains Contained
What Is the Monetary Base?
The Bank of Japan’s Monetary Base (also called “reserve money”) consists of three components: banknotes in circulation, coins in circulation, and current account balances held by financial institutions at the BOJ. The current account balances component is the most policy-sensitive, as it directly reflects the BOJ’s bond purchase operations and excess reserve management.
The Headline Number
June 2026 monetary base: -13.7% year-over-year, accelerating from -12.2% in May. For context, the full-year 2025 figure was -4.9% — meaning the contraction pace has nearly tripled in roughly 18 months.
Resilience: What’s Holding Up
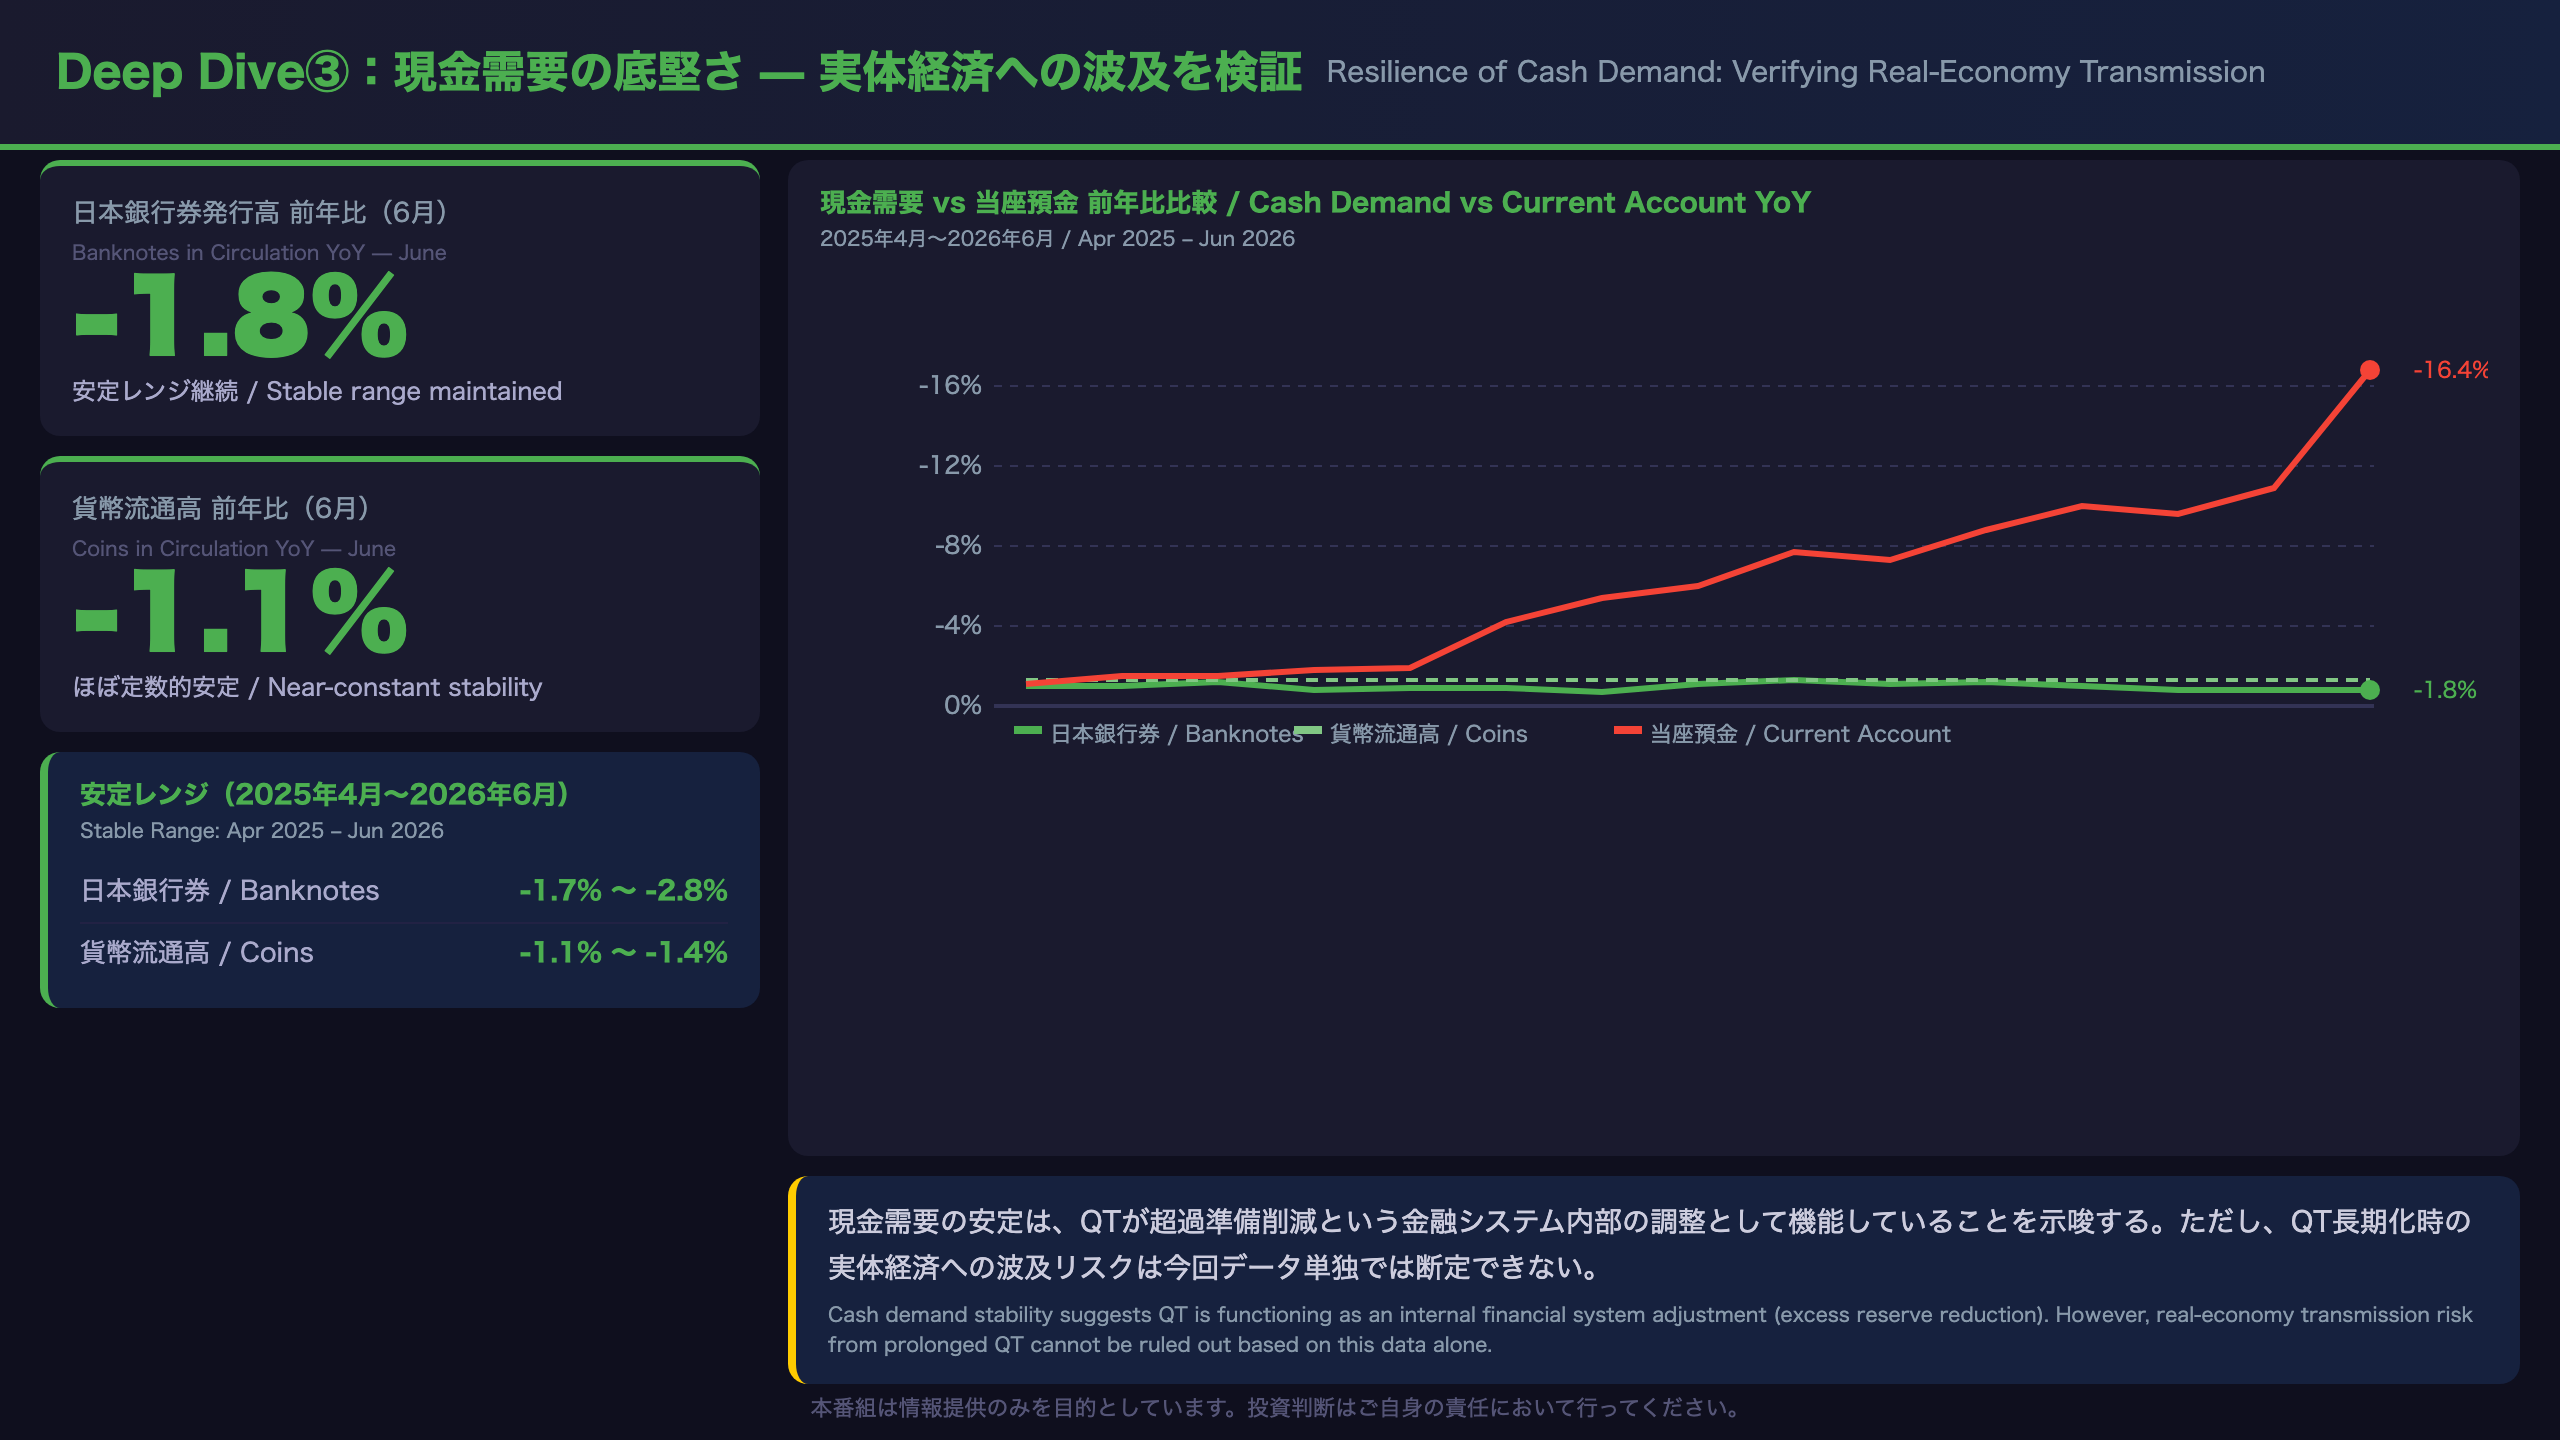
- Banknotes in circulation: -1.8% YoY in June. Has remained in a narrow -1.7% to -2.8% band since early 2025, indicating stable real-economy cash demand
- Coins in circulation: -1.1% YoY, similarly stable
- The stability of physical cash demand suggests household and corporate economic activity has not materially deteriorated
Risk: What’s Deteriorating
- Current account balances: -16.4% YoY in June, accelerating sharply from -14.7% in May
- Reserve balances: -14.6% YoY in June vs. -12.7% in May
- Seasonally adjusted annualized MoM rate: -22.9% in June vs. -13.3% in May — a dramatic single-month acceleration
International Context
For comparison, the US Federal Reserve’s balance sheet normalization (QT) peaked at roughly -15% to -20% annualized pace during 2022-2023. The BOJ’s current pace, while accelerating, is still operating from a much larger base relative to GDP (BOJ balance sheet was approximately 120% of GDP at peak vs. Fed’s ~35%). The absolute level of excess reserves remains historically elevated.
Deep Dive①:マネタリーベースの収縮トレンド — 加速の構造
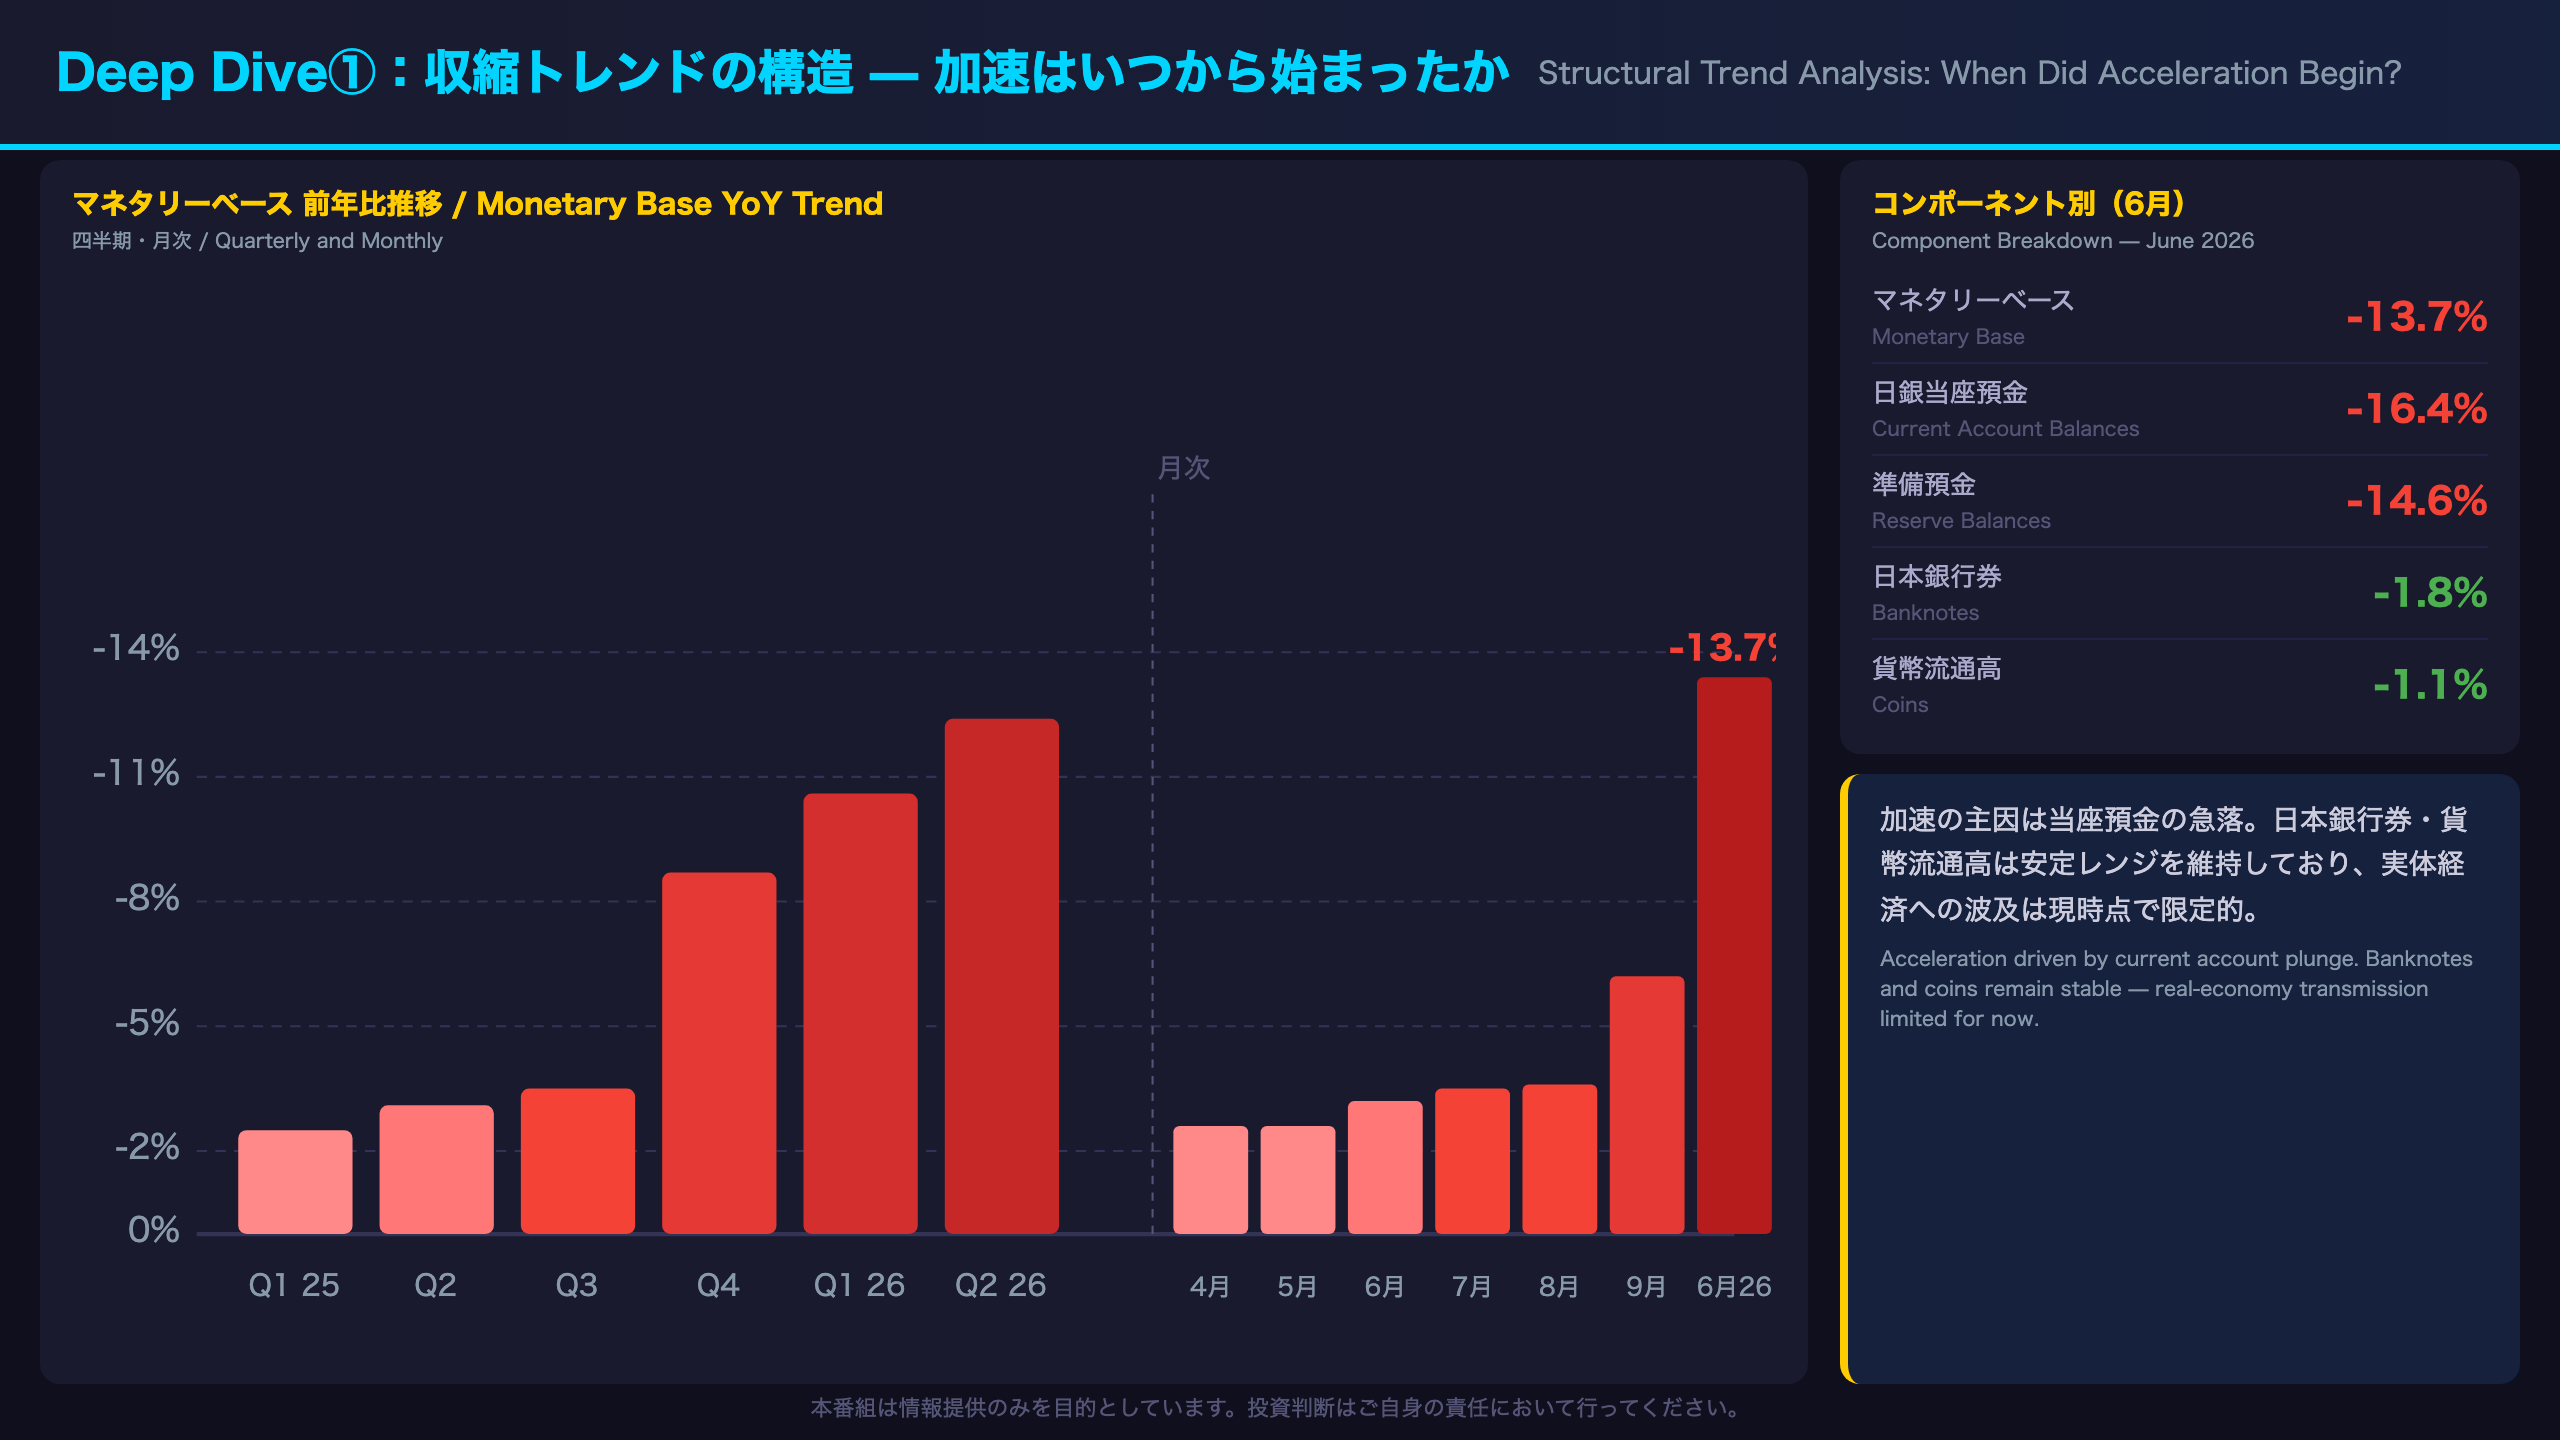
Structural Analysis of the Contraction Trend: When Did Acceleration Begin?
Identifying the Inflection Point
A careful reading of the data reveals that the first major acceleration occurred between Q3 2025 (-4.7%) and Q4 2025 (-8.7%) — nearly doubling in a single quarter. This coincided with the BOJ’s more aggressive phase of JGB purchase reductions, during which current account balances fell from -5.3% to -10.1% YoY.
Quarterly Progression
| Period | MB YoY | Current Acct YoY |
|---|---|---|
| 2025 Q1 | -2.5% | -2.7% |
| 2025 Q2 | -3.9% | -4.3% |
| 2025 Q3 | -4.7% | -5.3% |
| 2025 Q4 | -8.7% | -10.1% |
| 2026 Q1 | -10.6% | -12.5% |
| 2026 Q2 | -12.4% | -14.8% |
The Key Structural Insight
The divergence between components is the most important structural feature of this dataset. Banknotes in circulation have remained in a narrow -1.7% to -2.8% band throughout the entire period, and coins in circulation have been even more stable at -1.1% to -1.4%. Only current account balances are driving the headline contraction. This is a textbook example of policy-driven balance sheet normalization rather than demand-driven monetary contraction.
Caveat on the Seasonally Adjusted Series
The seasonally adjusted annualized month-over-month rate (column a) shows extreme volatility: -22.8% in February 2026, -5.6% in March, -13.3% in April, -22.9% in June. Reading structural signals from individual monthly prints of this series is unreliable; a 3-to-6-month moving average is more appropriate for trend identification.
Deep Dive②:日銀当座預金の急収縮 — QTの実態と残高水準
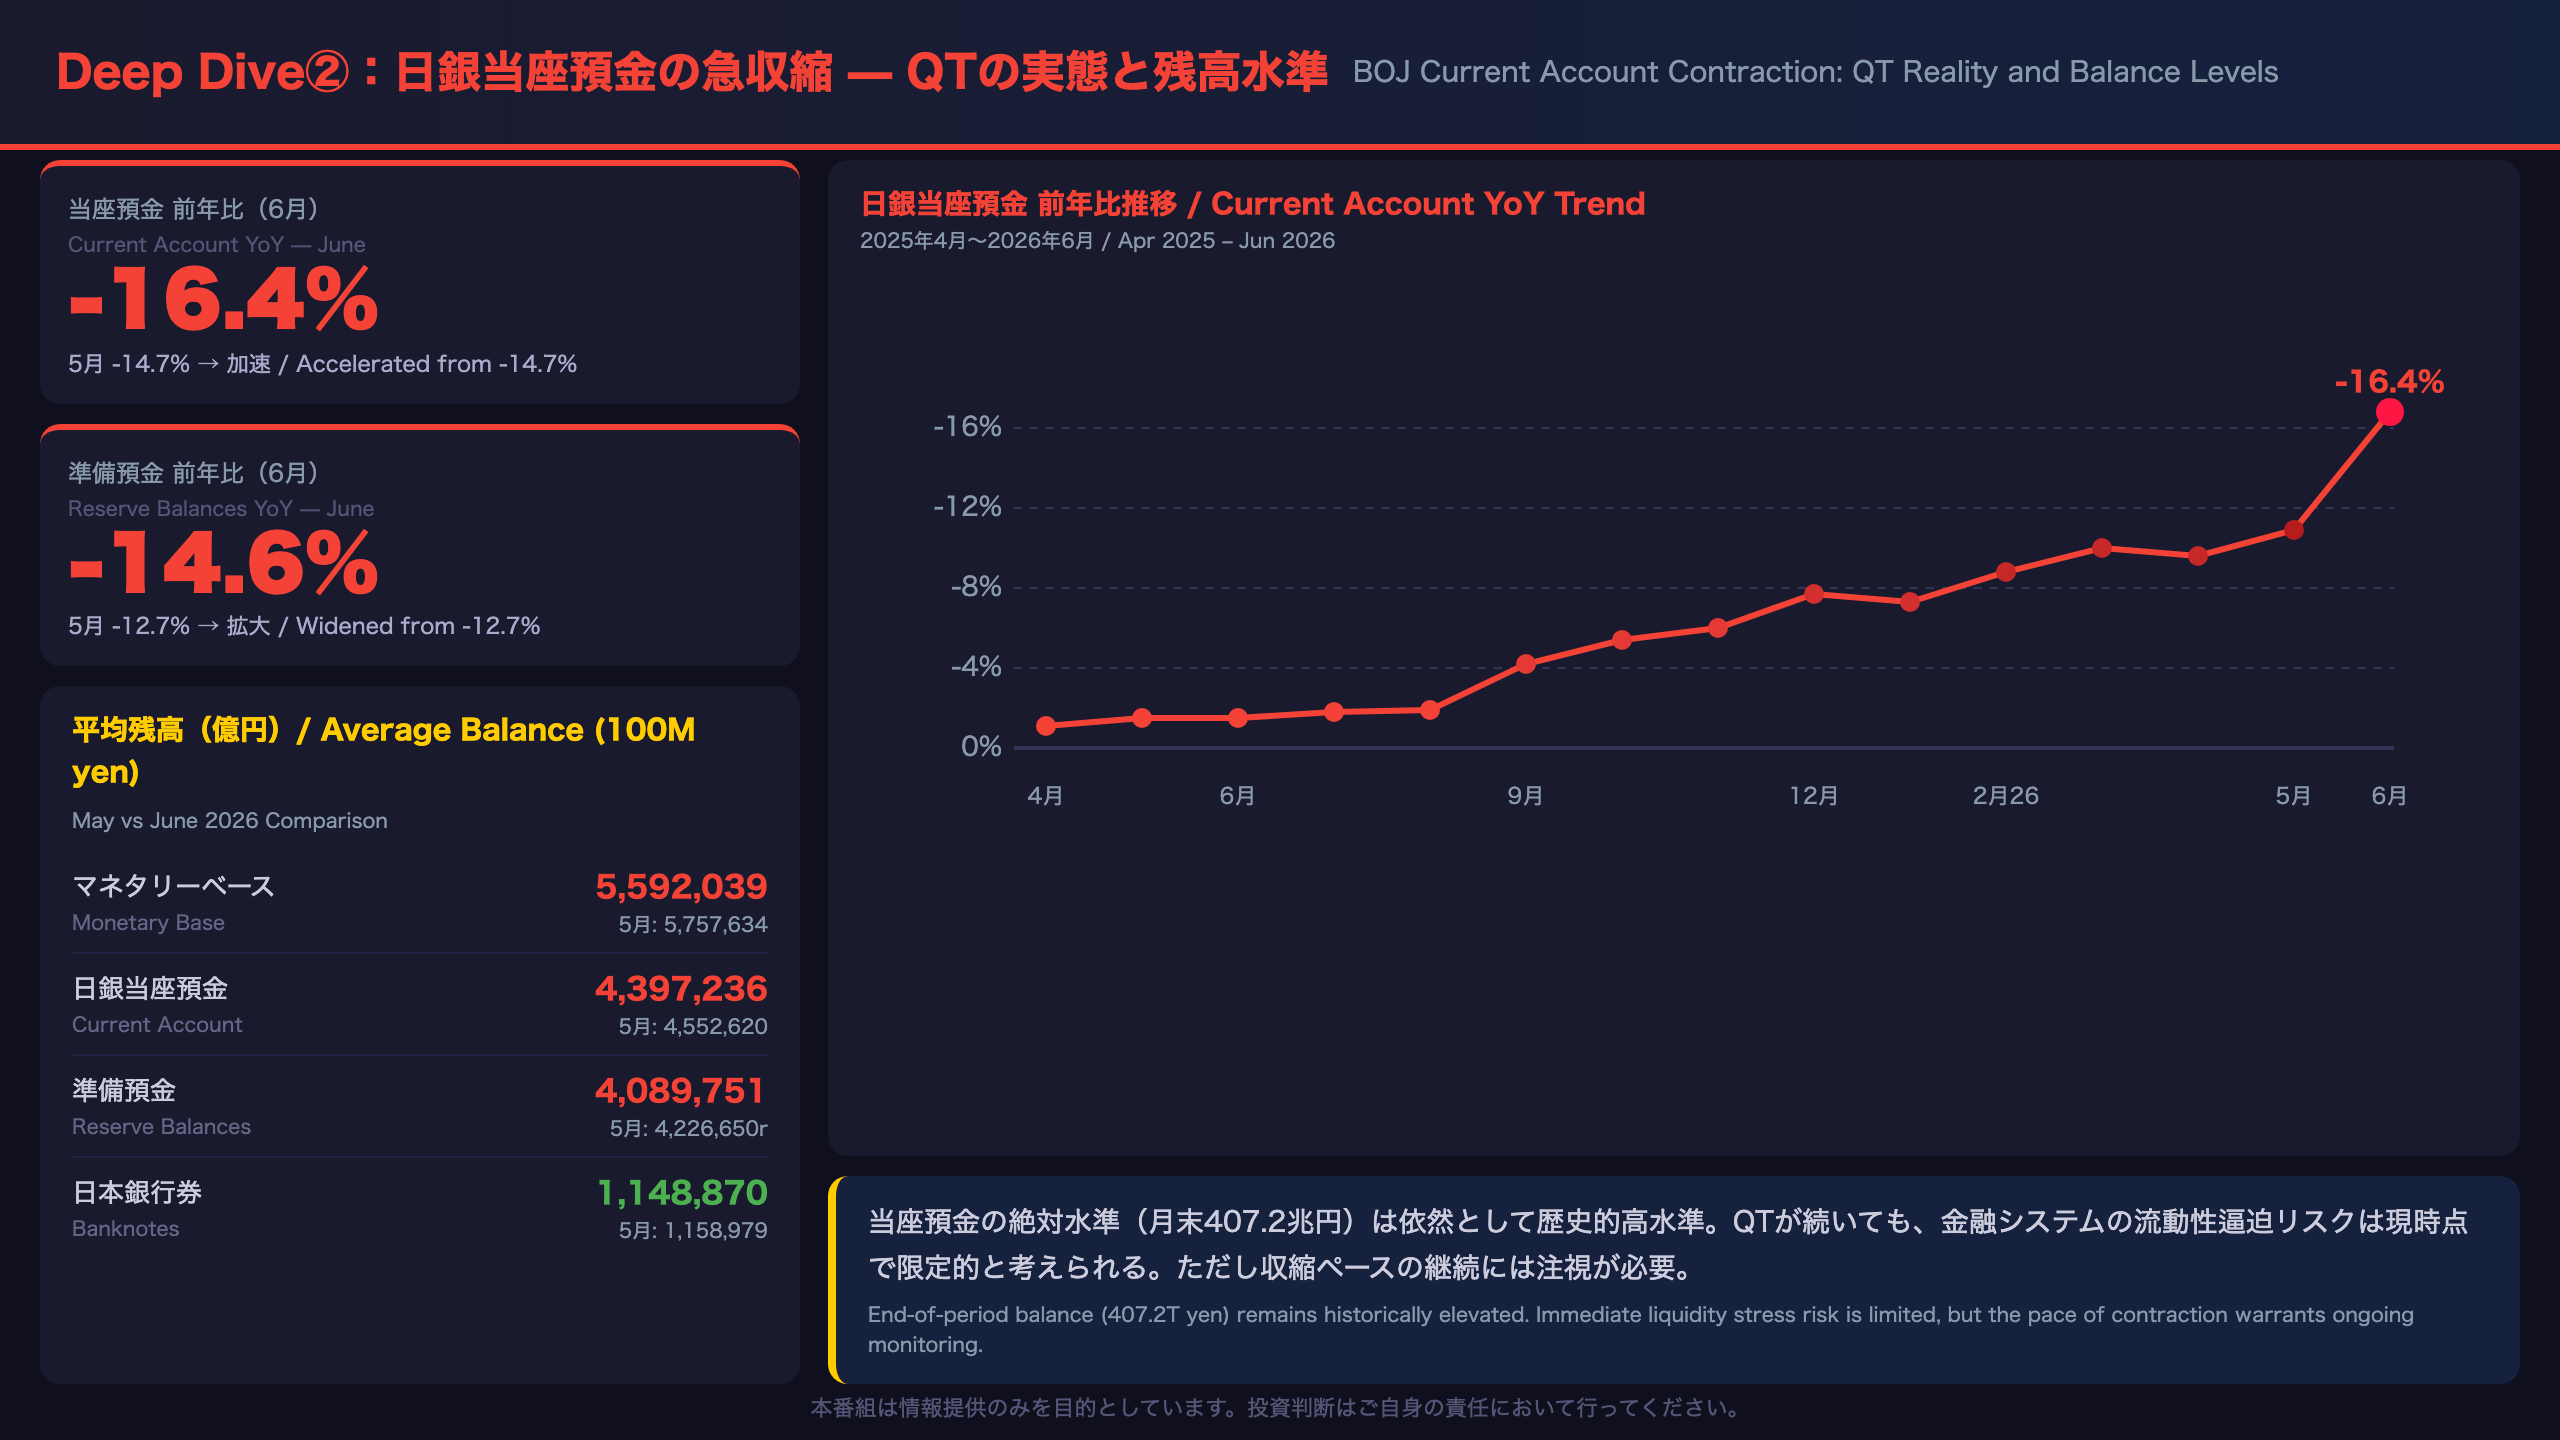
BOJ Current Account Contraction: Reading the QT Reality in Numbers
Balance Level Summary (June 2026)
| Item | May (Avg) | June (Avg) | Monthly Change |
|---|---|---|---|
| Monetary Base | 575.8T yen | 559.2T yen | -16.6T yen |
| Current Account | 455.3T yen | 439.7T yen | -15.6T yen |
| Reserve Balances | 422.7T yen | 408.9T yen | -13.8T yen |
| Banknotes | 115.9T yen | 114.9T yen | -1.0T yen |
Monthly Contraction Pace
From May to June, the monetary base contracted by approximately 16.6 trillion yen, and current account balances fell by roughly 15.6 trillion yen. This is a substantial monthly reduction by any measure.
The Revised Figure (“r”)
The June report includes a revised figure (marked “r”) for May’s average reserve balances: 422,665 hundred million yen vs. the previously reported 422,661. The revision is negligible and does not affect trend interpretation.
Absolute Level Context
End-of-period current account balances stand at 407.2 trillion yen as of June. While this represents a significant decline from the peak, it remains astronomically high compared to pre-Abenomics levels (single-digit trillions pre-2013). Even at the current pace of contraction (-16% YoY), the BOJ’s balance sheet normalization has years to run before reaching any level that could be considered “neutral.” Immediate liquidity stress risk is limited, but the trajectory warrants monitoring over a 2-3 year horizon.
Deep Dive③:現金需要の底堅さ — 実体経済への波及を検証
Resilience of Cash Demand: Verifying Real-Economy Transmission
Banknotes in Circulation: A Stable Trend
Monthly data shows remarkable stability in banknotes in circulation:
| Month | YoY Change |
|---|---|
| Apr 2025 | -2.0% |
| Jun 2025 | -1.7% |
| Sep 2025 | -2.1% |
| Dec 2025 | -2.8% |
| Mar 2026 | -1.8% |
| Jun 2026 | -1.8% |
The range from peak to trough is just 1.1 percentage points — extraordinarily stable given the dramatic changes in the broader monetary base.
Coins in Circulation: Near-Constant
Coins in circulation have remained in an even tighter -1.1% to -1.4% band from April 2025 through June 2026. This is essentially a structural constant, likely reflecting the secular trend of cashless payment adoption in Japan rather than any cyclical monetary policy effect.
Economic Interpretation
The stability of physical cash components carries two important implications. First, the BOJ’s QT is operating primarily as a financial system internal adjustment — specifically the drawdown of excess reserves — rather than as a credit contraction that would directly affect household and business spending. Second, the mild secular decline in cash demand (-1% to -2% range) appears to be an independent structural trend driven by cashless payment adoption, not a monetary policy transmission effect.
Important Caveat
This stability is an observation based on current data. If QT deepens to the point where it constrains bank lending capacity, transmission channels to the real economy could open. This scenario cannot be ruled out based on today’s data alone, and warrants monitoring over the medium term.
インプリケーション:金利・円相場・金融政策への示唆
Market and Policy Implications: Reading the Evidence Chain
Long-Term Yield Implications
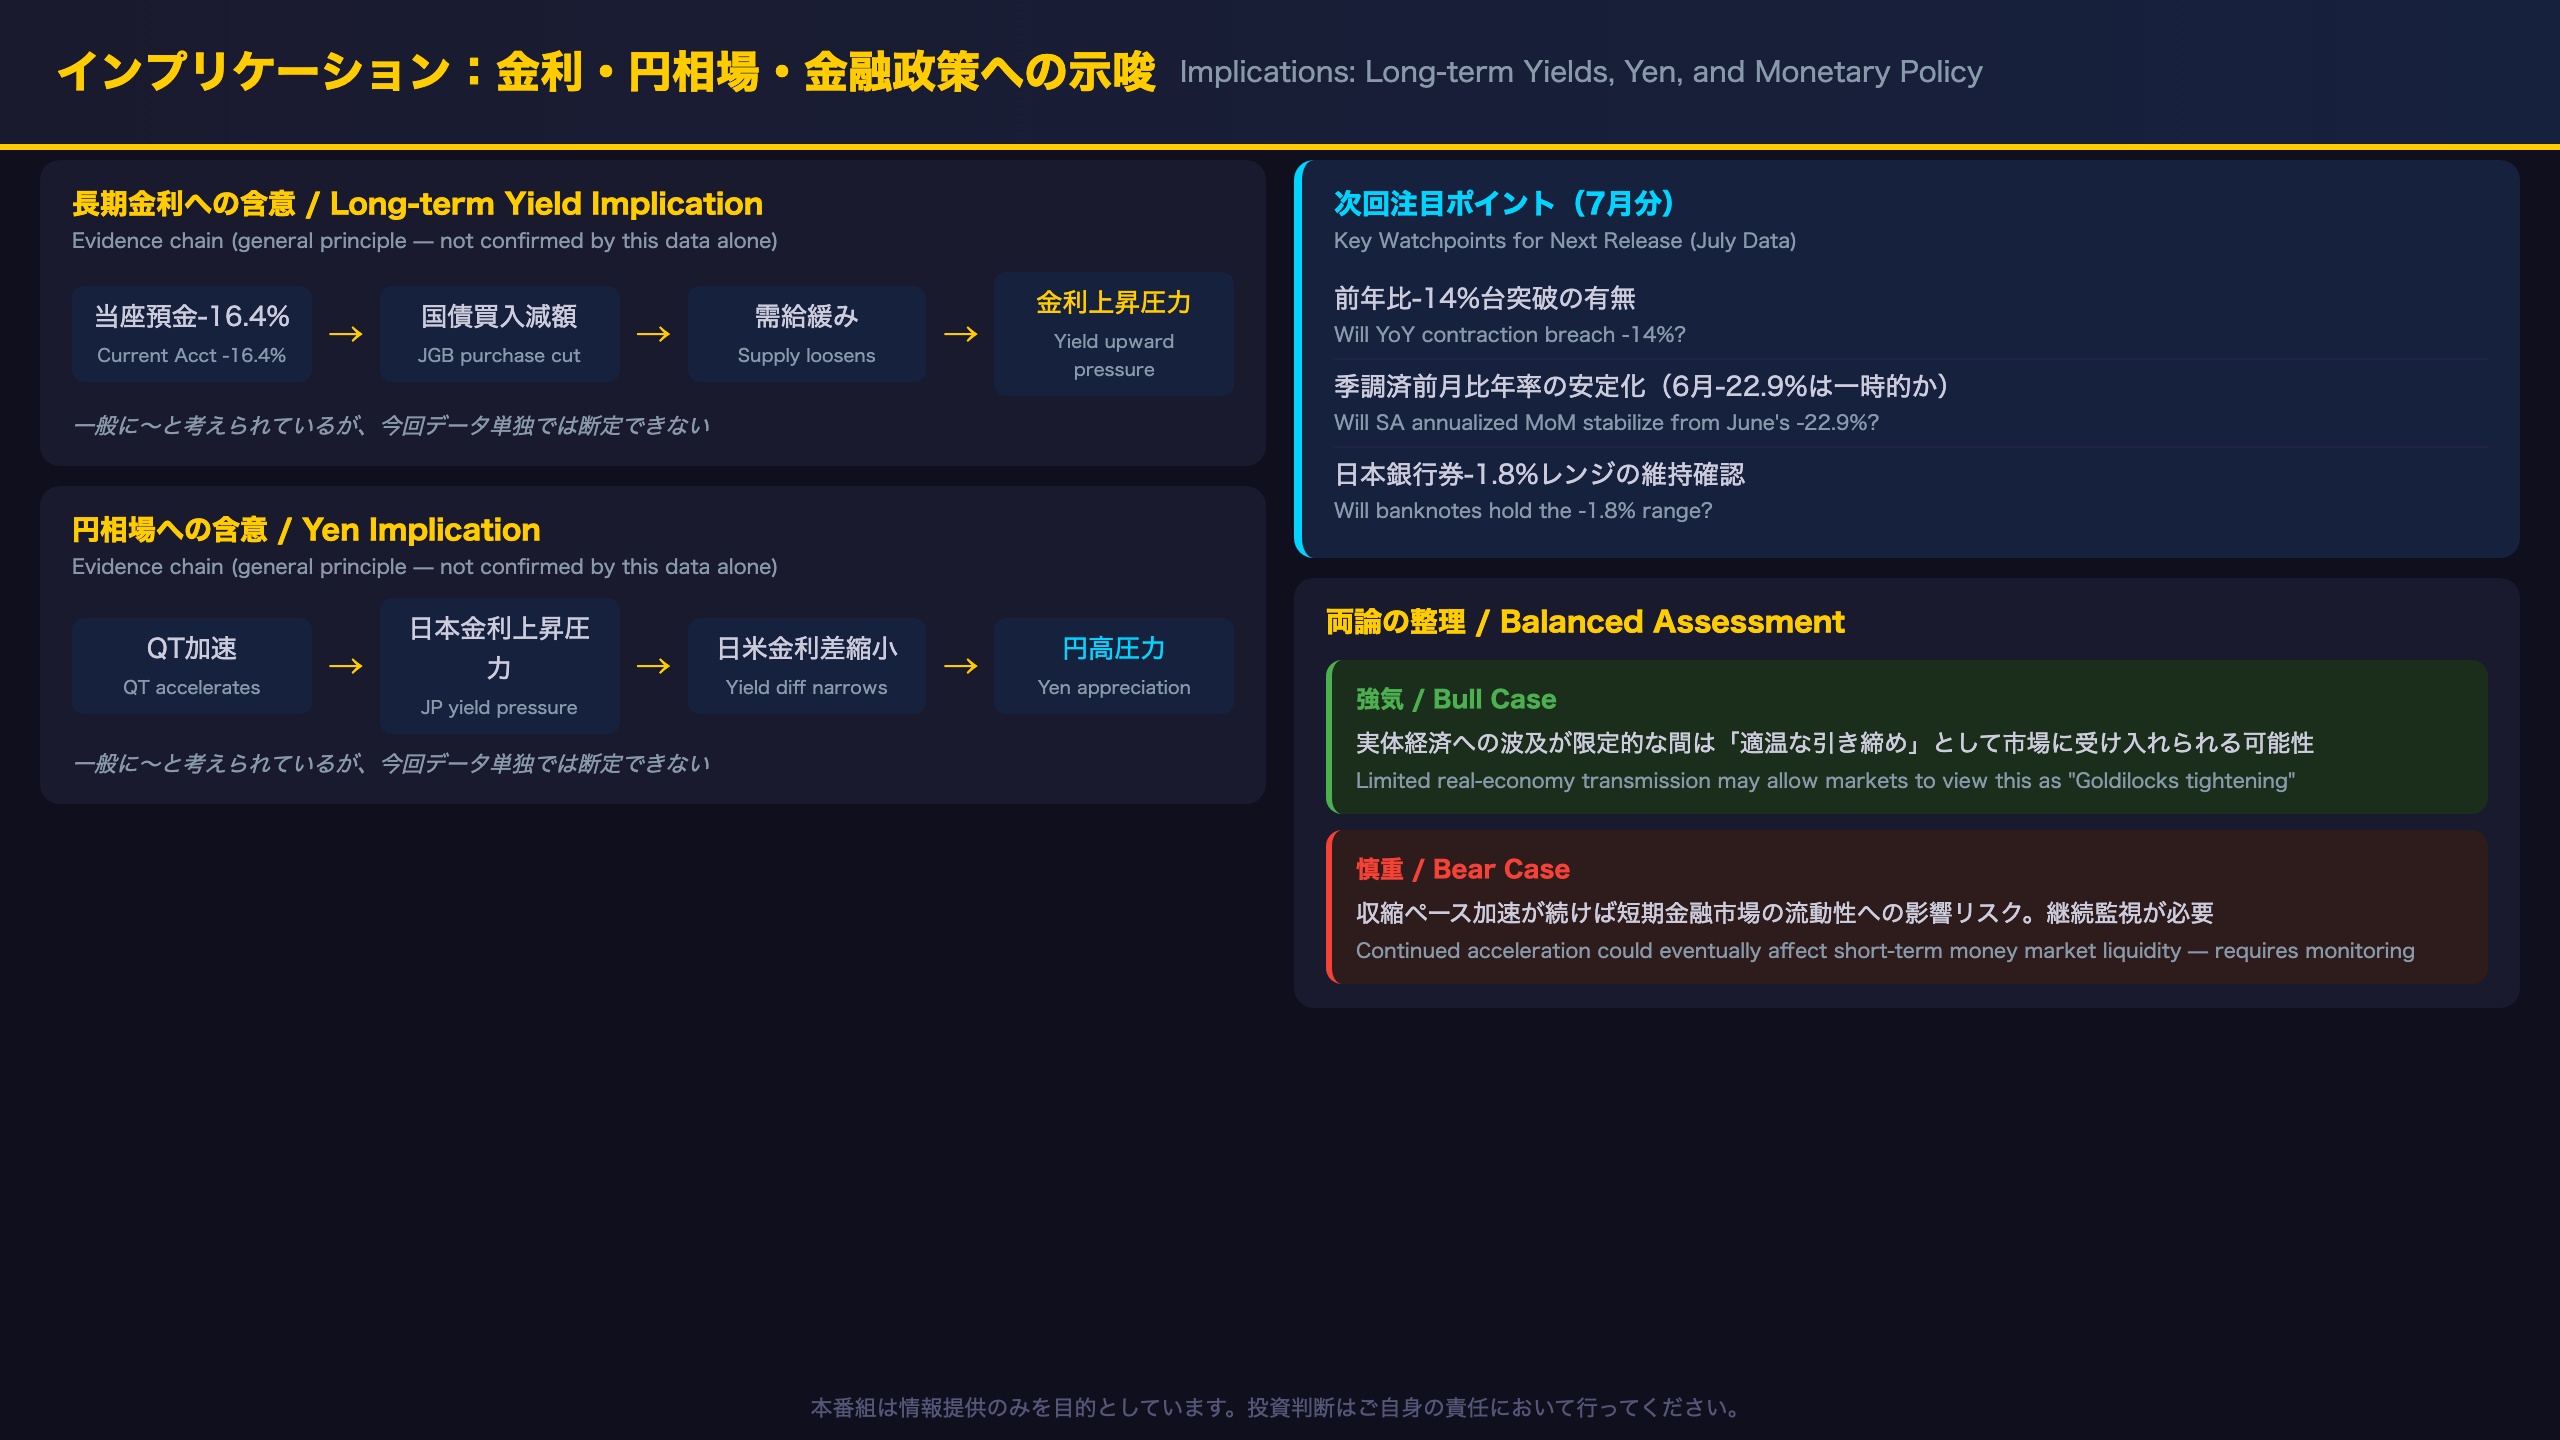
Evidence chain: BOJ current account balances -16.4% (fact) → steady reduction of JGB purchases (mechanism) → looser JGB supply-demand balance → upward pressure on long-term yields (market implication)
However, the latter half of this chain (supply-demand loosening → yield rise) relies on general principles and cannot be confirmed from today’s data alone. Overseas rate trends, risk appetite, and BOJ rate hike expectations all interact in complex ways.
Yen Implications
Evidence chain: Accelerating QT (fact) → upward pressure on Japanese long-term yields (mechanism) → narrowing US-Japan yield differential → yen appreciation pressure (market implication)
This is generally considered plausible, but today’s data alone is insufficient for a definitive call.
Monetary Policy Normalization Pace
The Q2 2026 monetary base YoY of -12.4% confirms the BOJ is steadily advancing its normalization path. Key watchpoints for the next release (July data, expected early August):
- Pace confirmation: Will YoY contraction breach the -14% threshold?
- SA annualized MoM stabilization: Was June’s -22.9% a one-off or structural?
- Banknotes trend: Will the -1.8% range hold?
Balanced Assessment
Bull case: Accelerating QT reflects BOJ confidence in normalization. As long as real-economy transmission remains limited, markets may interpret this as a “Goldilocks tightening” — removing excess liquidity without choking growth.
Bear case: If the contraction pace continues to accelerate beyond -16%, short-term money market liquidity could eventually be affected. This requires ongoing monitoring through future data releases.
Disclaimer: This article is for informational purposes only. All investment decisions are made solely at your own risk.







