📺 Watch the Full Video Analysis
This article was automatically generated by the NFC Market Live AI analysis system. (Updated: 2026-07-01 18:38 JST)
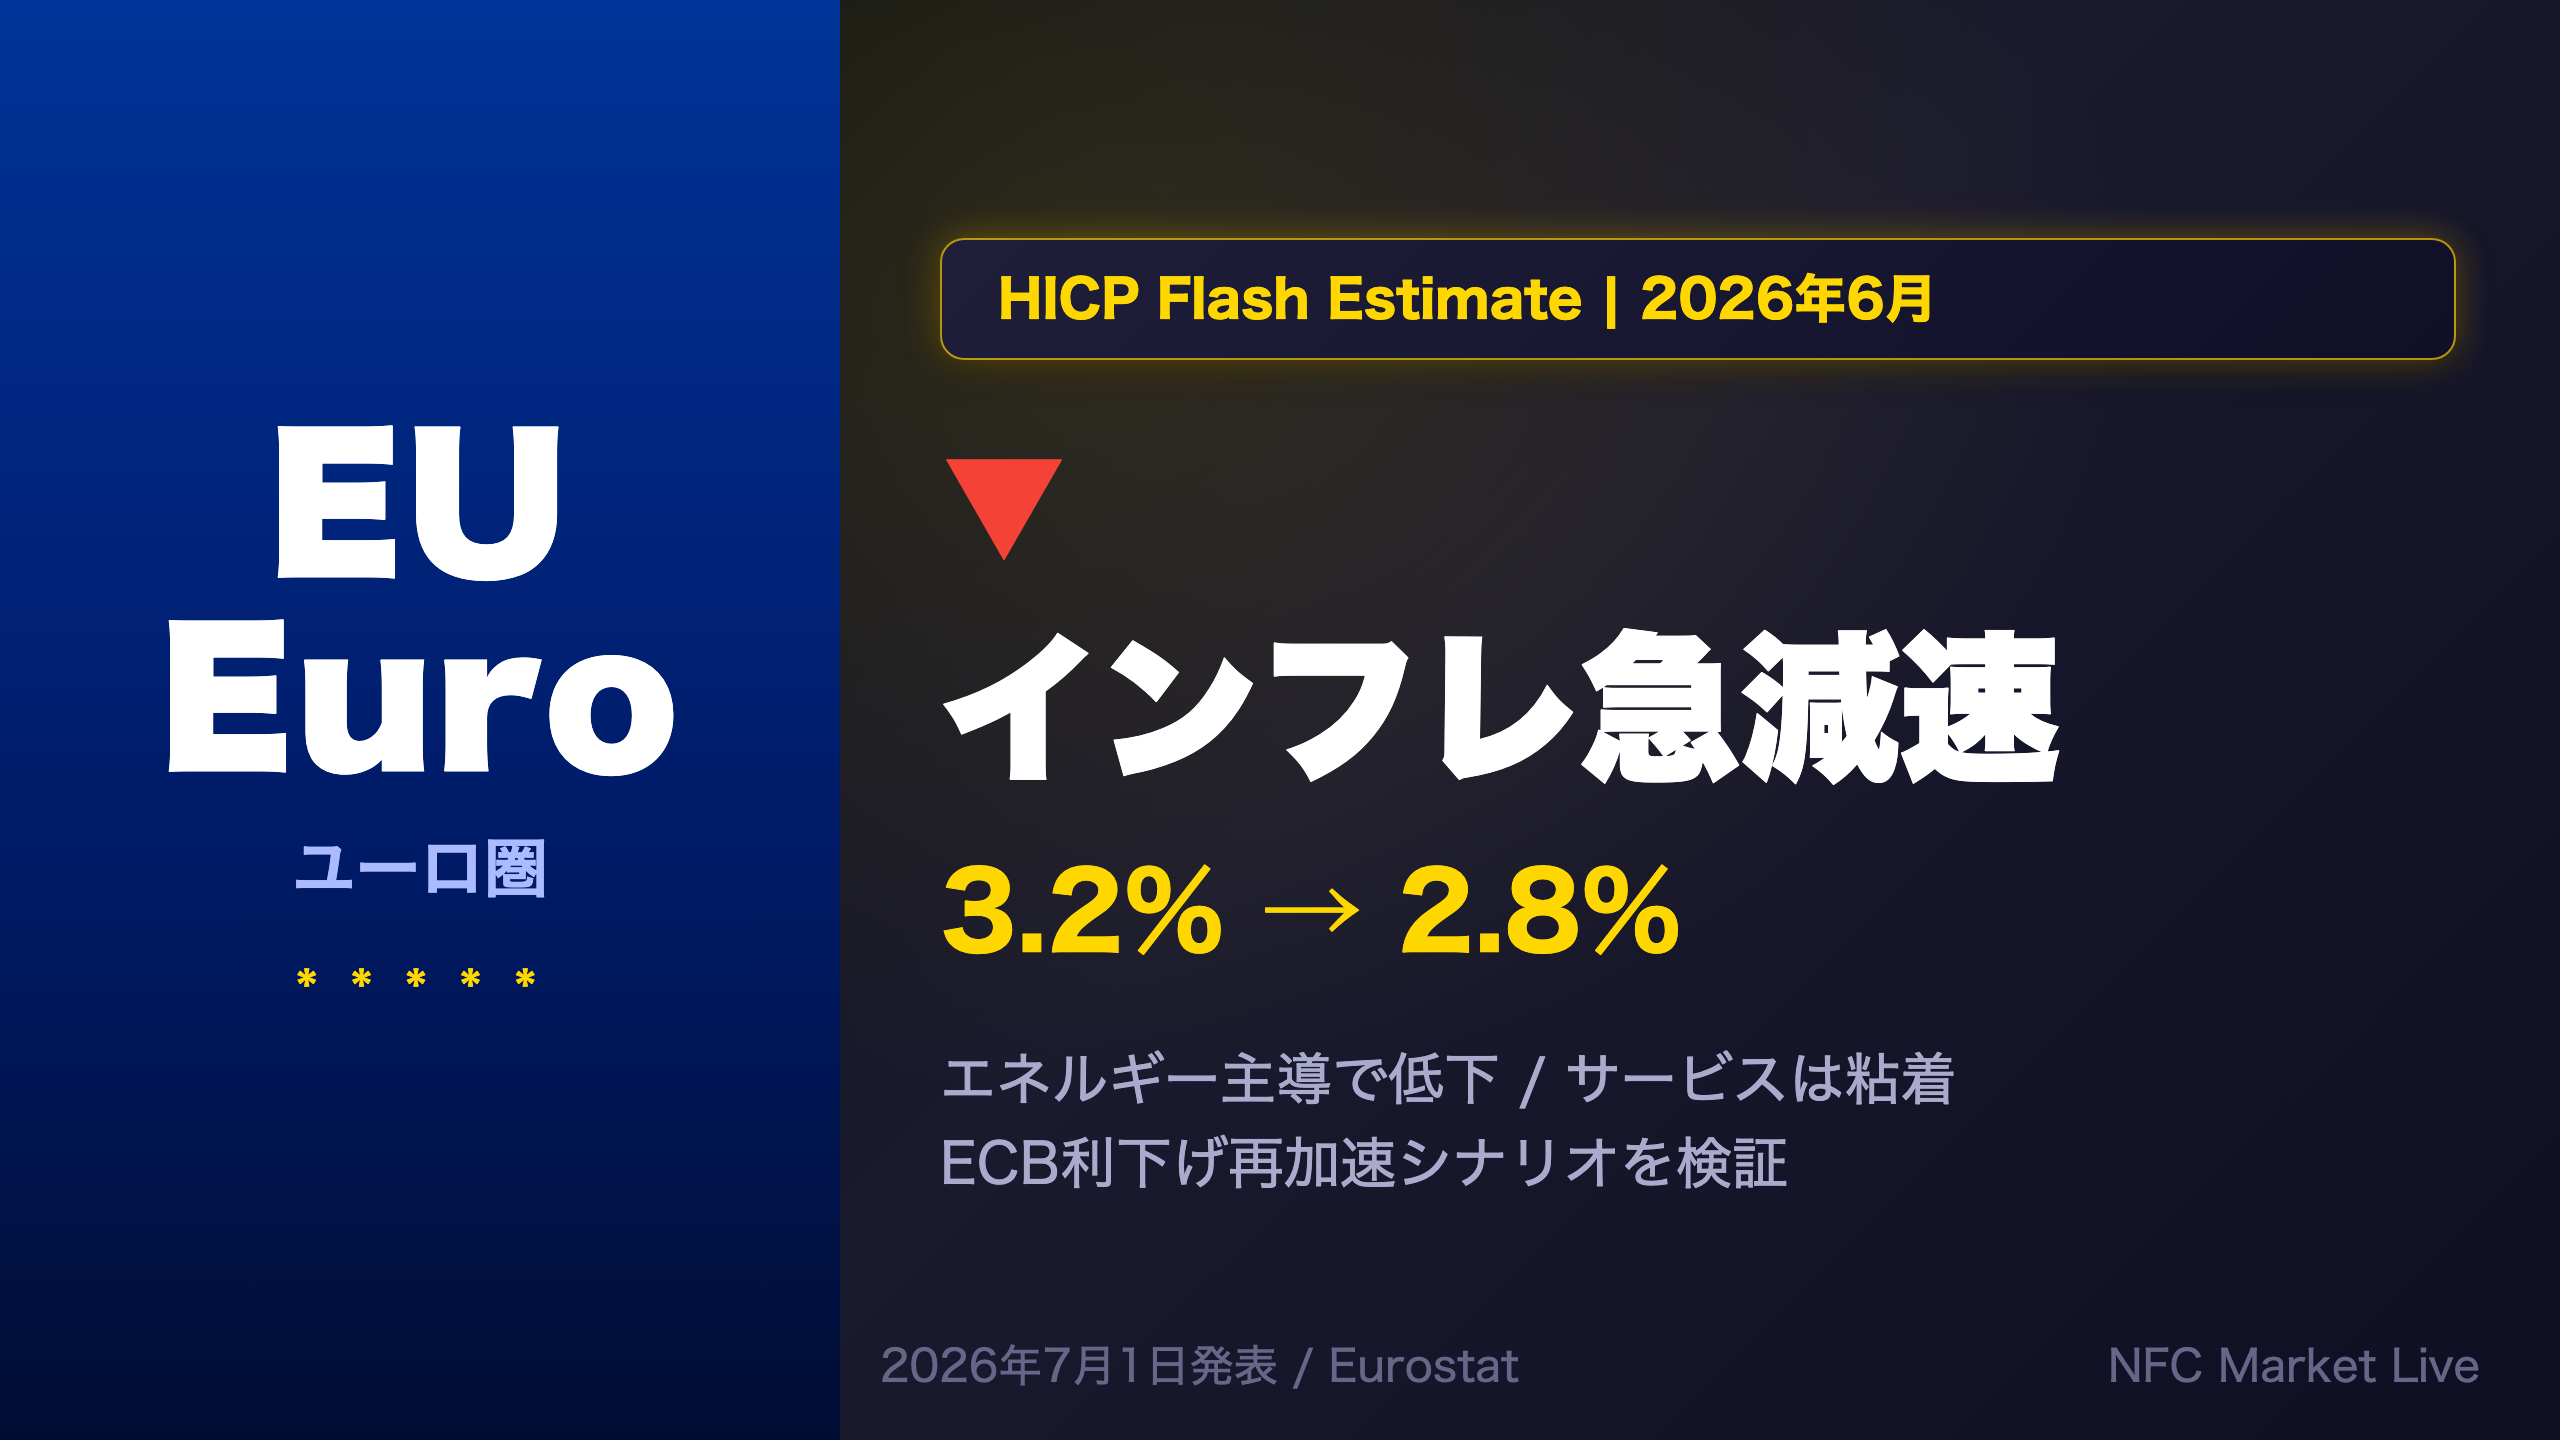
Euro area HICP flash estimate for June 2026 came in at 2.8% YoY, down sharply from 3.2% in May. The drop was largely driven by energy deceleration, but services inflation remains sticky at 3.2%. We break down all four components, analyze core inflation trends, and assess what this means for ECB rate decisions and EUR/JPY, EUR/USD.
The Ultimate Summary — ユーロ圏インフレ6月速報:急落の実態
Overall Assessment: A Headline Drop with Structural Caveats
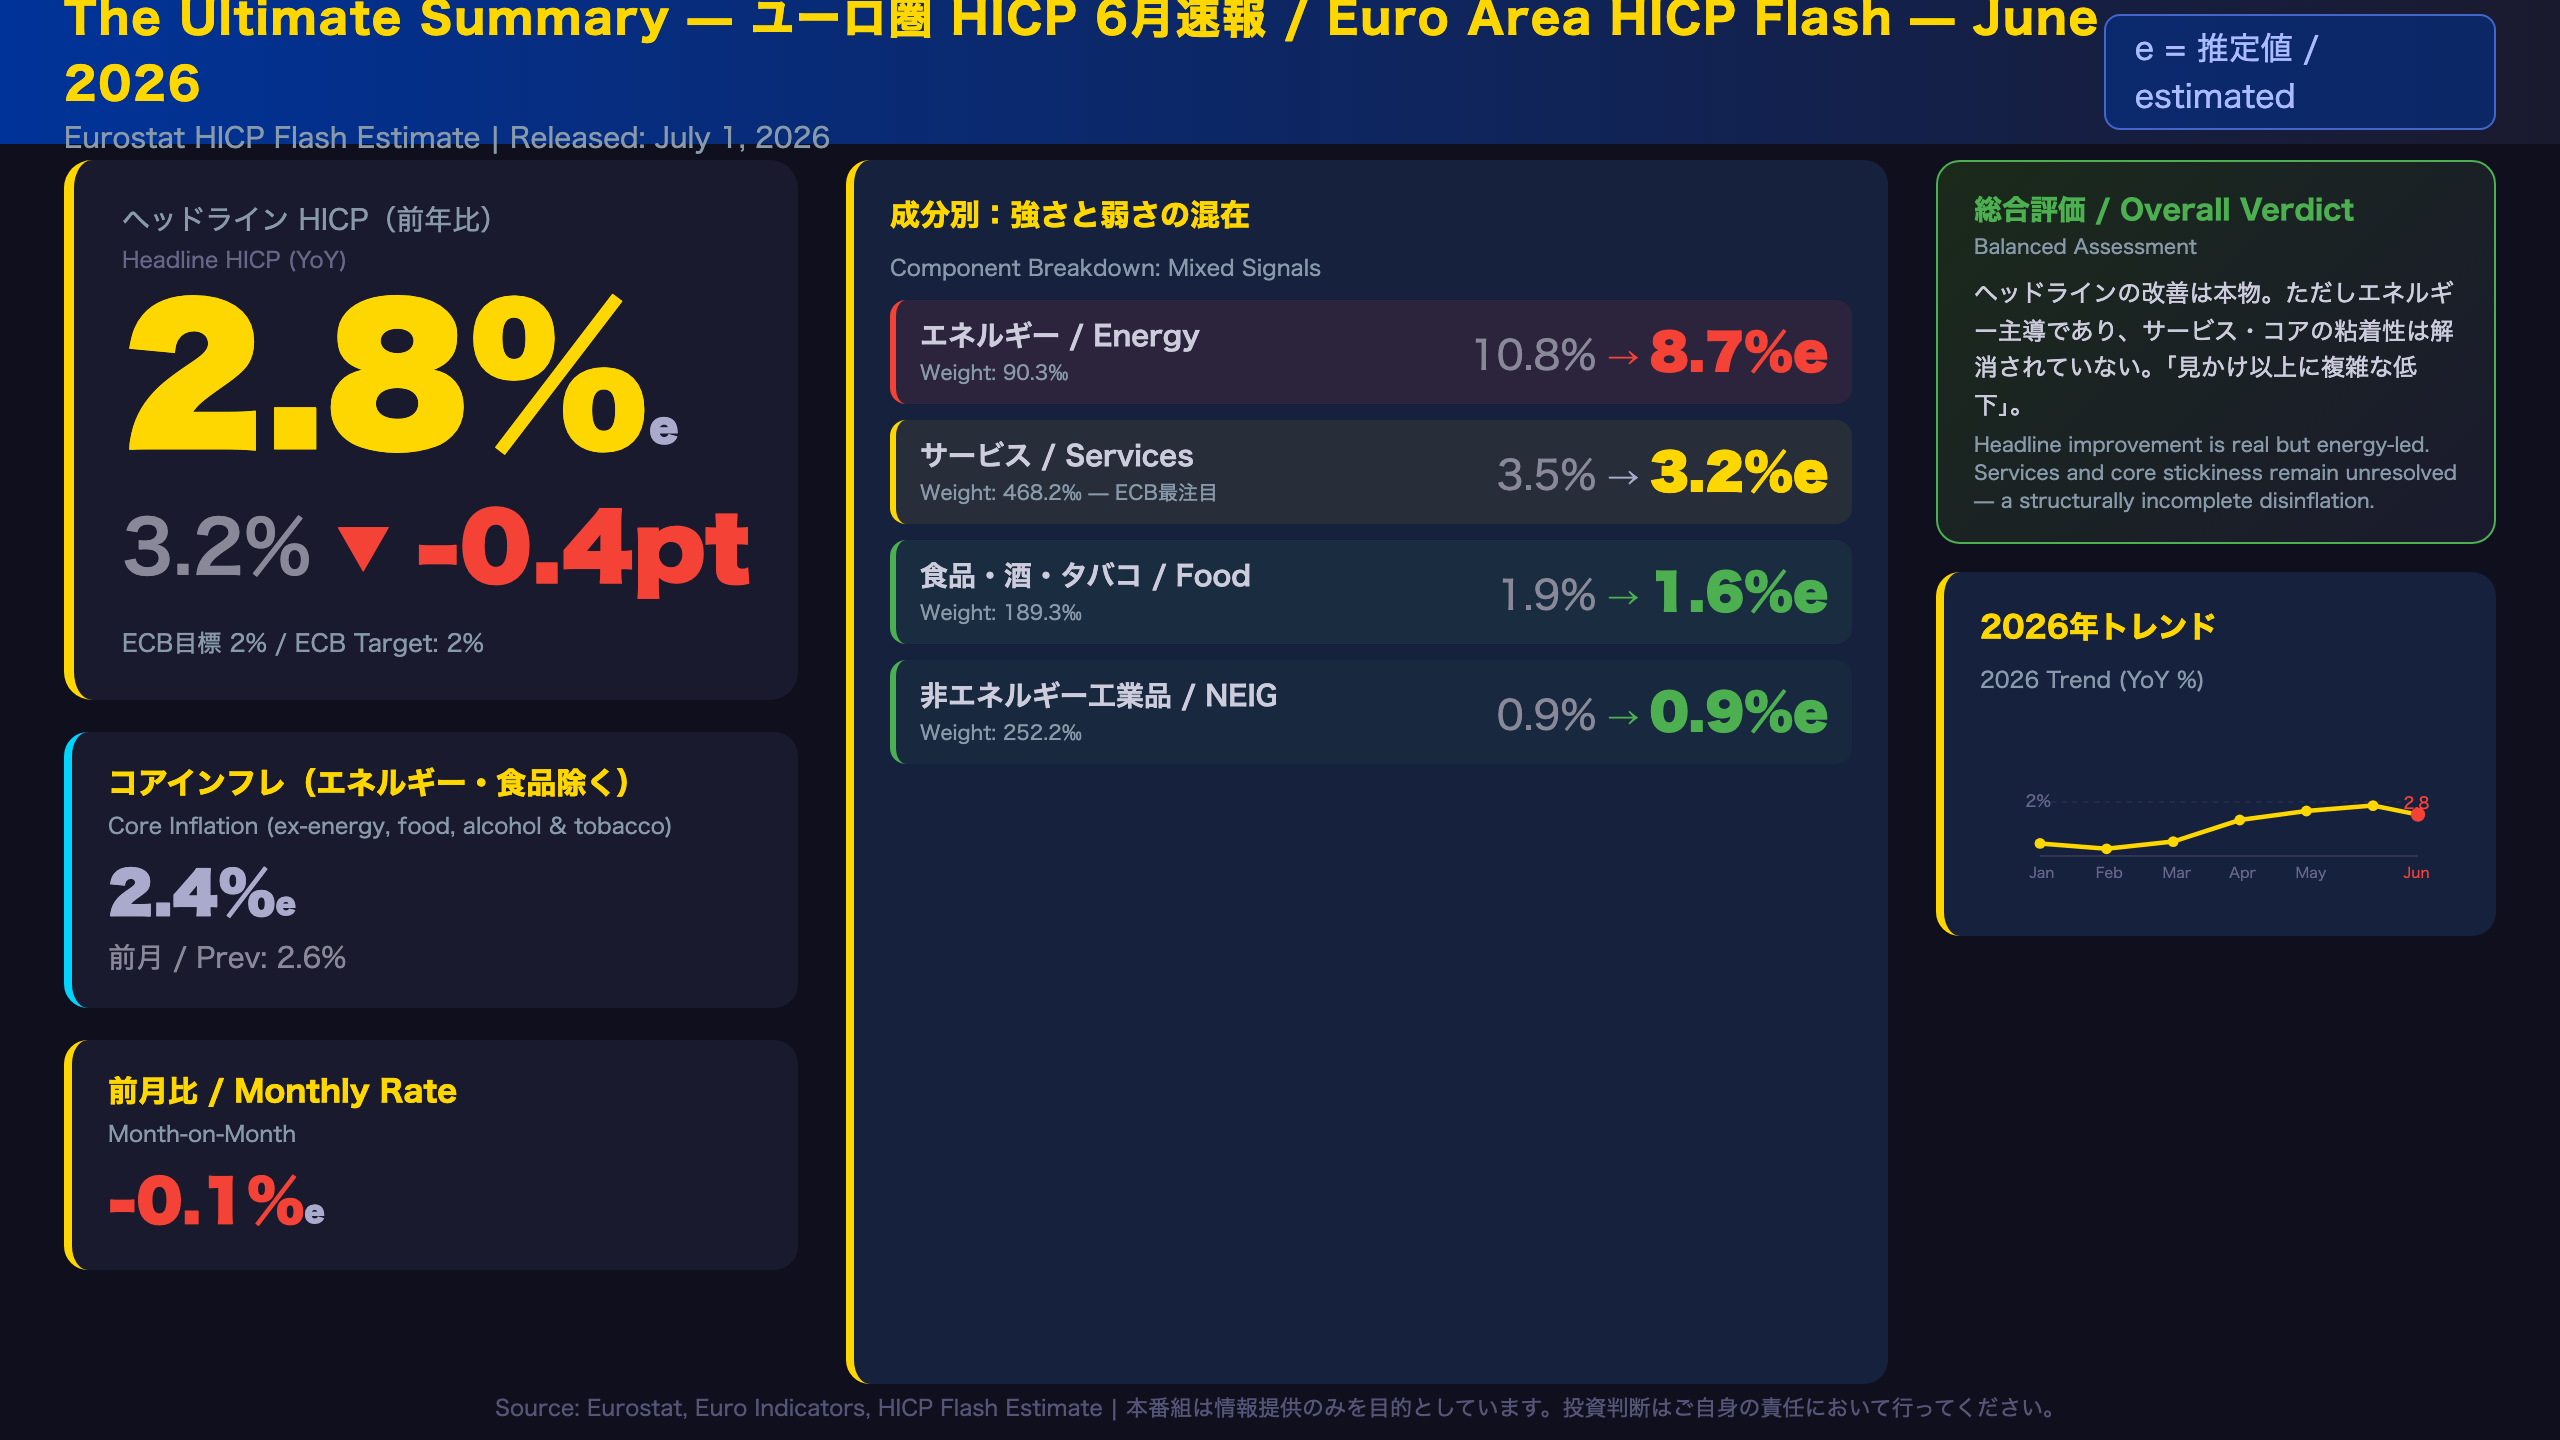
The Eurostat HICP flash estimate for June 2026 came in at 2.8% year-on-year (estimated), down from 3.2% in May. This marks the first clear reversal after a five-month acceleration that ran from January’s 1.7% through May’s 3.2%.
What Is the HICP Flash Estimate?
The Harmonised Index of Consumer Prices (HICP) is the EU’s standardized inflation measure, used by the European Central Bank (ECB) as its primary inflation gauge. The “flash estimate” is a preliminary release published at the end of each reference month, based on partial national data. It provides only euro area aggregates — country-level breakdowns follow in the full release approximately two weeks later.
The Driving Force: Energy Deceleration
Energy inflation dropped sharply from 10.8% to 8.7% year-on-year. With energy carrying a weight of 90.3 per mille in the HICP basket (~9% of total), this single component contributed roughly -0.19 percentage points to the headline decline.
The Sticky Core: Services Remain Elevated
Services inflation — the ECB’s most-watched component due to its sensitivity to domestic wage dynamics — eased only modestly from 3.5% to 3.2%. Services account for 468.2 per mille (~47%) of the HICP basket, making this the single largest component. Core inflation (excluding energy, food, alcohol, and tobacco) fell from 2.6% to 2.4%, a marginal improvement.
International Context
For comparison, the US Fed targets PCE inflation at 2%, while the ECB targets HICP at 2%. At 2.8%, euro area headline is closer to target than it was in May, but the ECB’s preferred core measure at 2.4% remains above the 2% threshold. The US has faced similar “last mile” disinflation challenges, suggesting this is a global structural phenomenon rather than a euro-area-specific problem.
Bull vs. Bear Reads
Bull case: Headline breaking below 3% supports continued ECB easing. Food inflation at 1.6% eases household cost pressures.
Bear case: Energy-driven declines are inherently reversible. If oil or gas prices rebound, headline could quickly return to 3%+. Services stickiness limits the ECB’s confidence in declaring victory over inflation.
What to Watch Next
The full June HICP data release is scheduled for mid-July 2026. The next ECB Governing Council meeting will be a key event — watch for any shift in language around core inflation and the pace of rate normalization.
Deep Dive ① — エネルギー主導の低下:構造か、一時か
Energy Inflation’s Surge and Retreat: Dissecting the Base Effect
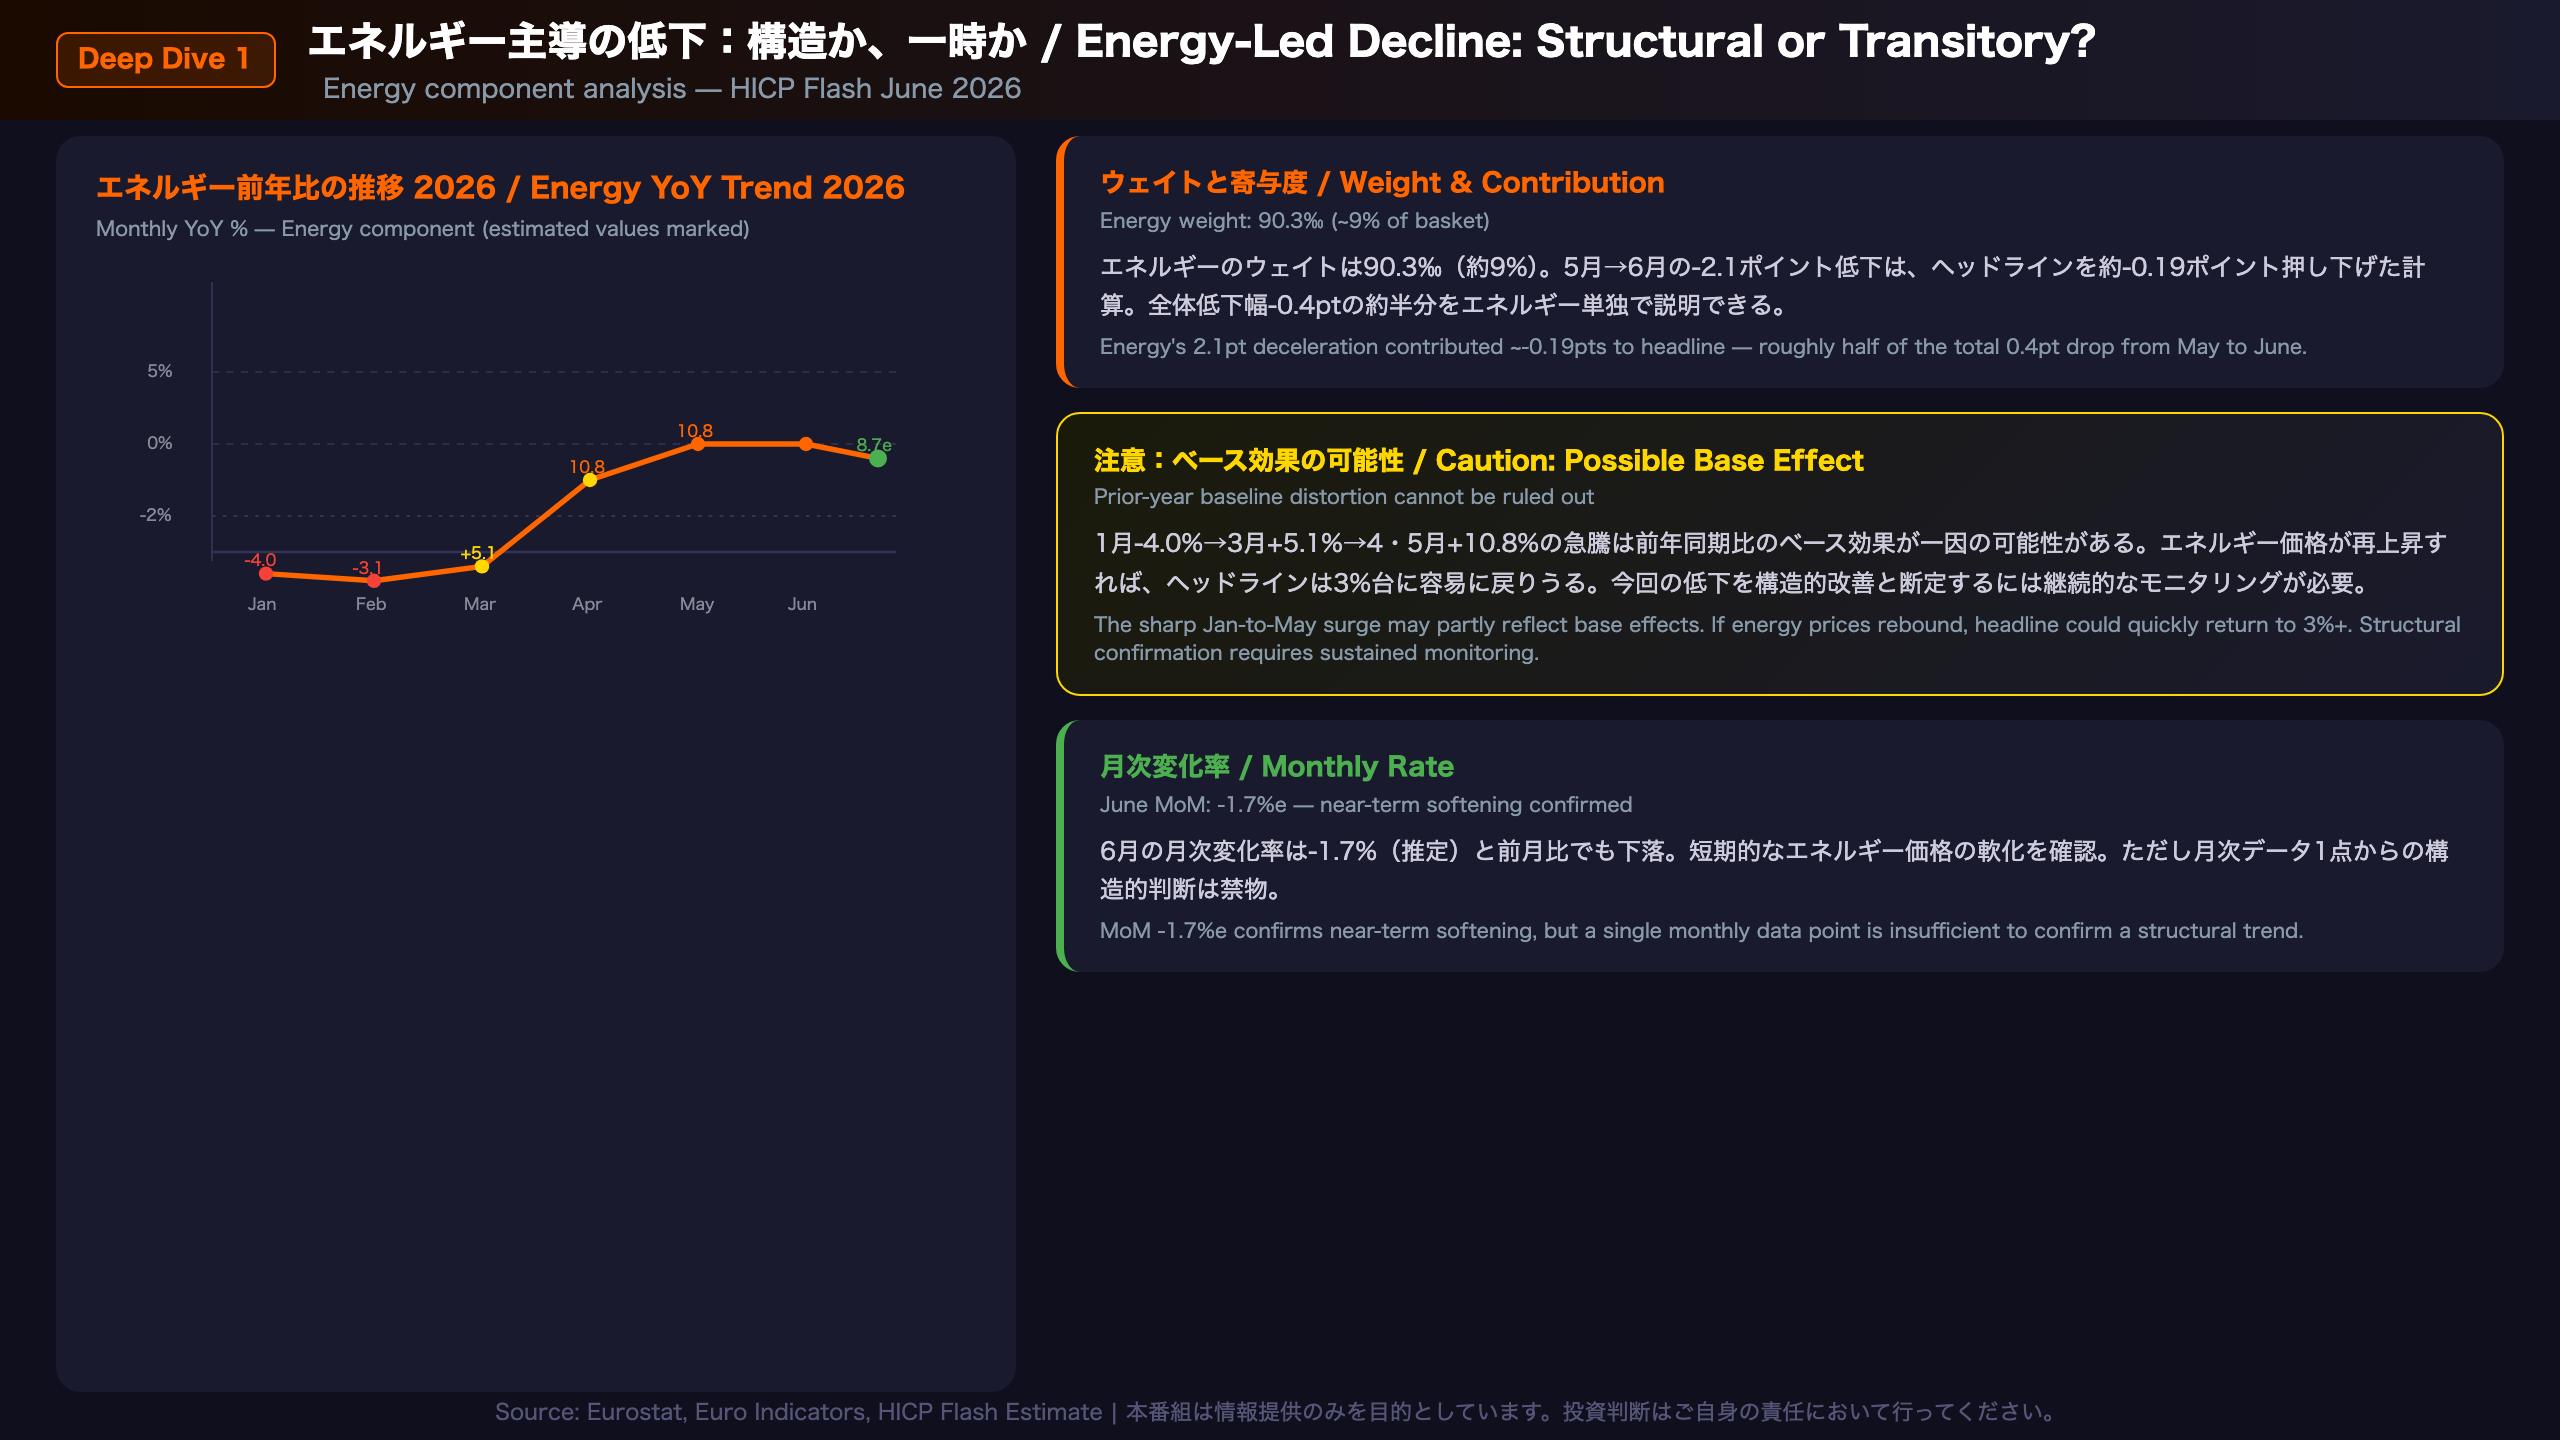
Energy YoY Trajectory in 2026
| Month | Energy YoY |
|---|---|
| Jun 2025 | -2.6% |
| Jan 2026 | -4.0% |
| Feb 2026 | -3.1% |
| Mar 2026 | +5.1% |
| Apr 2026 | +10.8% |
| May 2026 | +10.8% |
| Jun 2026 | +8.7%e |
The pattern is striking: energy went from deeply negative territory in early 2026 to double-digit gains by April, then began easing in June. This trajectory is highly consistent with base effects — the mathematical artifact of comparing current prices against an unusually low or high prior-year baseline.
Weight and Contribution Arithmetic
Energy carries a weight of 90.3 per mille (~9.03% of the basket). The 2.1 percentage point deceleration in energy (10.8% → 8.7%) translates to approximately -0.19 percentage points of contribution change to headline HICP. This alone accounts for roughly half of the total 0.4-point headline decline from May to June.
Monthly Rate Signal
The month-on-month energy rate for June was -1.7% (estimated), confirming near-term price softening. However, monthly energy data is highly volatile, and a single month’s reading should not be extrapolated into a structural trend.
Structural vs. Transitory Debate
Bull case for structural improvement: Europe’s ongoing diversification of energy supply (LNG imports, renewables expansion) could provide a more durable dampening of energy inflation.
Bear case — transitory: Geopolitical risks (Middle East, Russia-Ukraine) and seasonal demand patterns can rapidly reverse energy prices. If this June decline is primarily base-effect-driven, a partial rebound in July-August is plausible.
Key Metrics to Watch
Monitor Brent crude and European natural gas (TTF hub) prices as leading indicators for the July HICP energy component. A sustained move above prior-year levels would signal renewed upside risk to euro area headline inflation.
Deep Dive ② — サービスインフレの粘着性:ECBが最も注視する成分
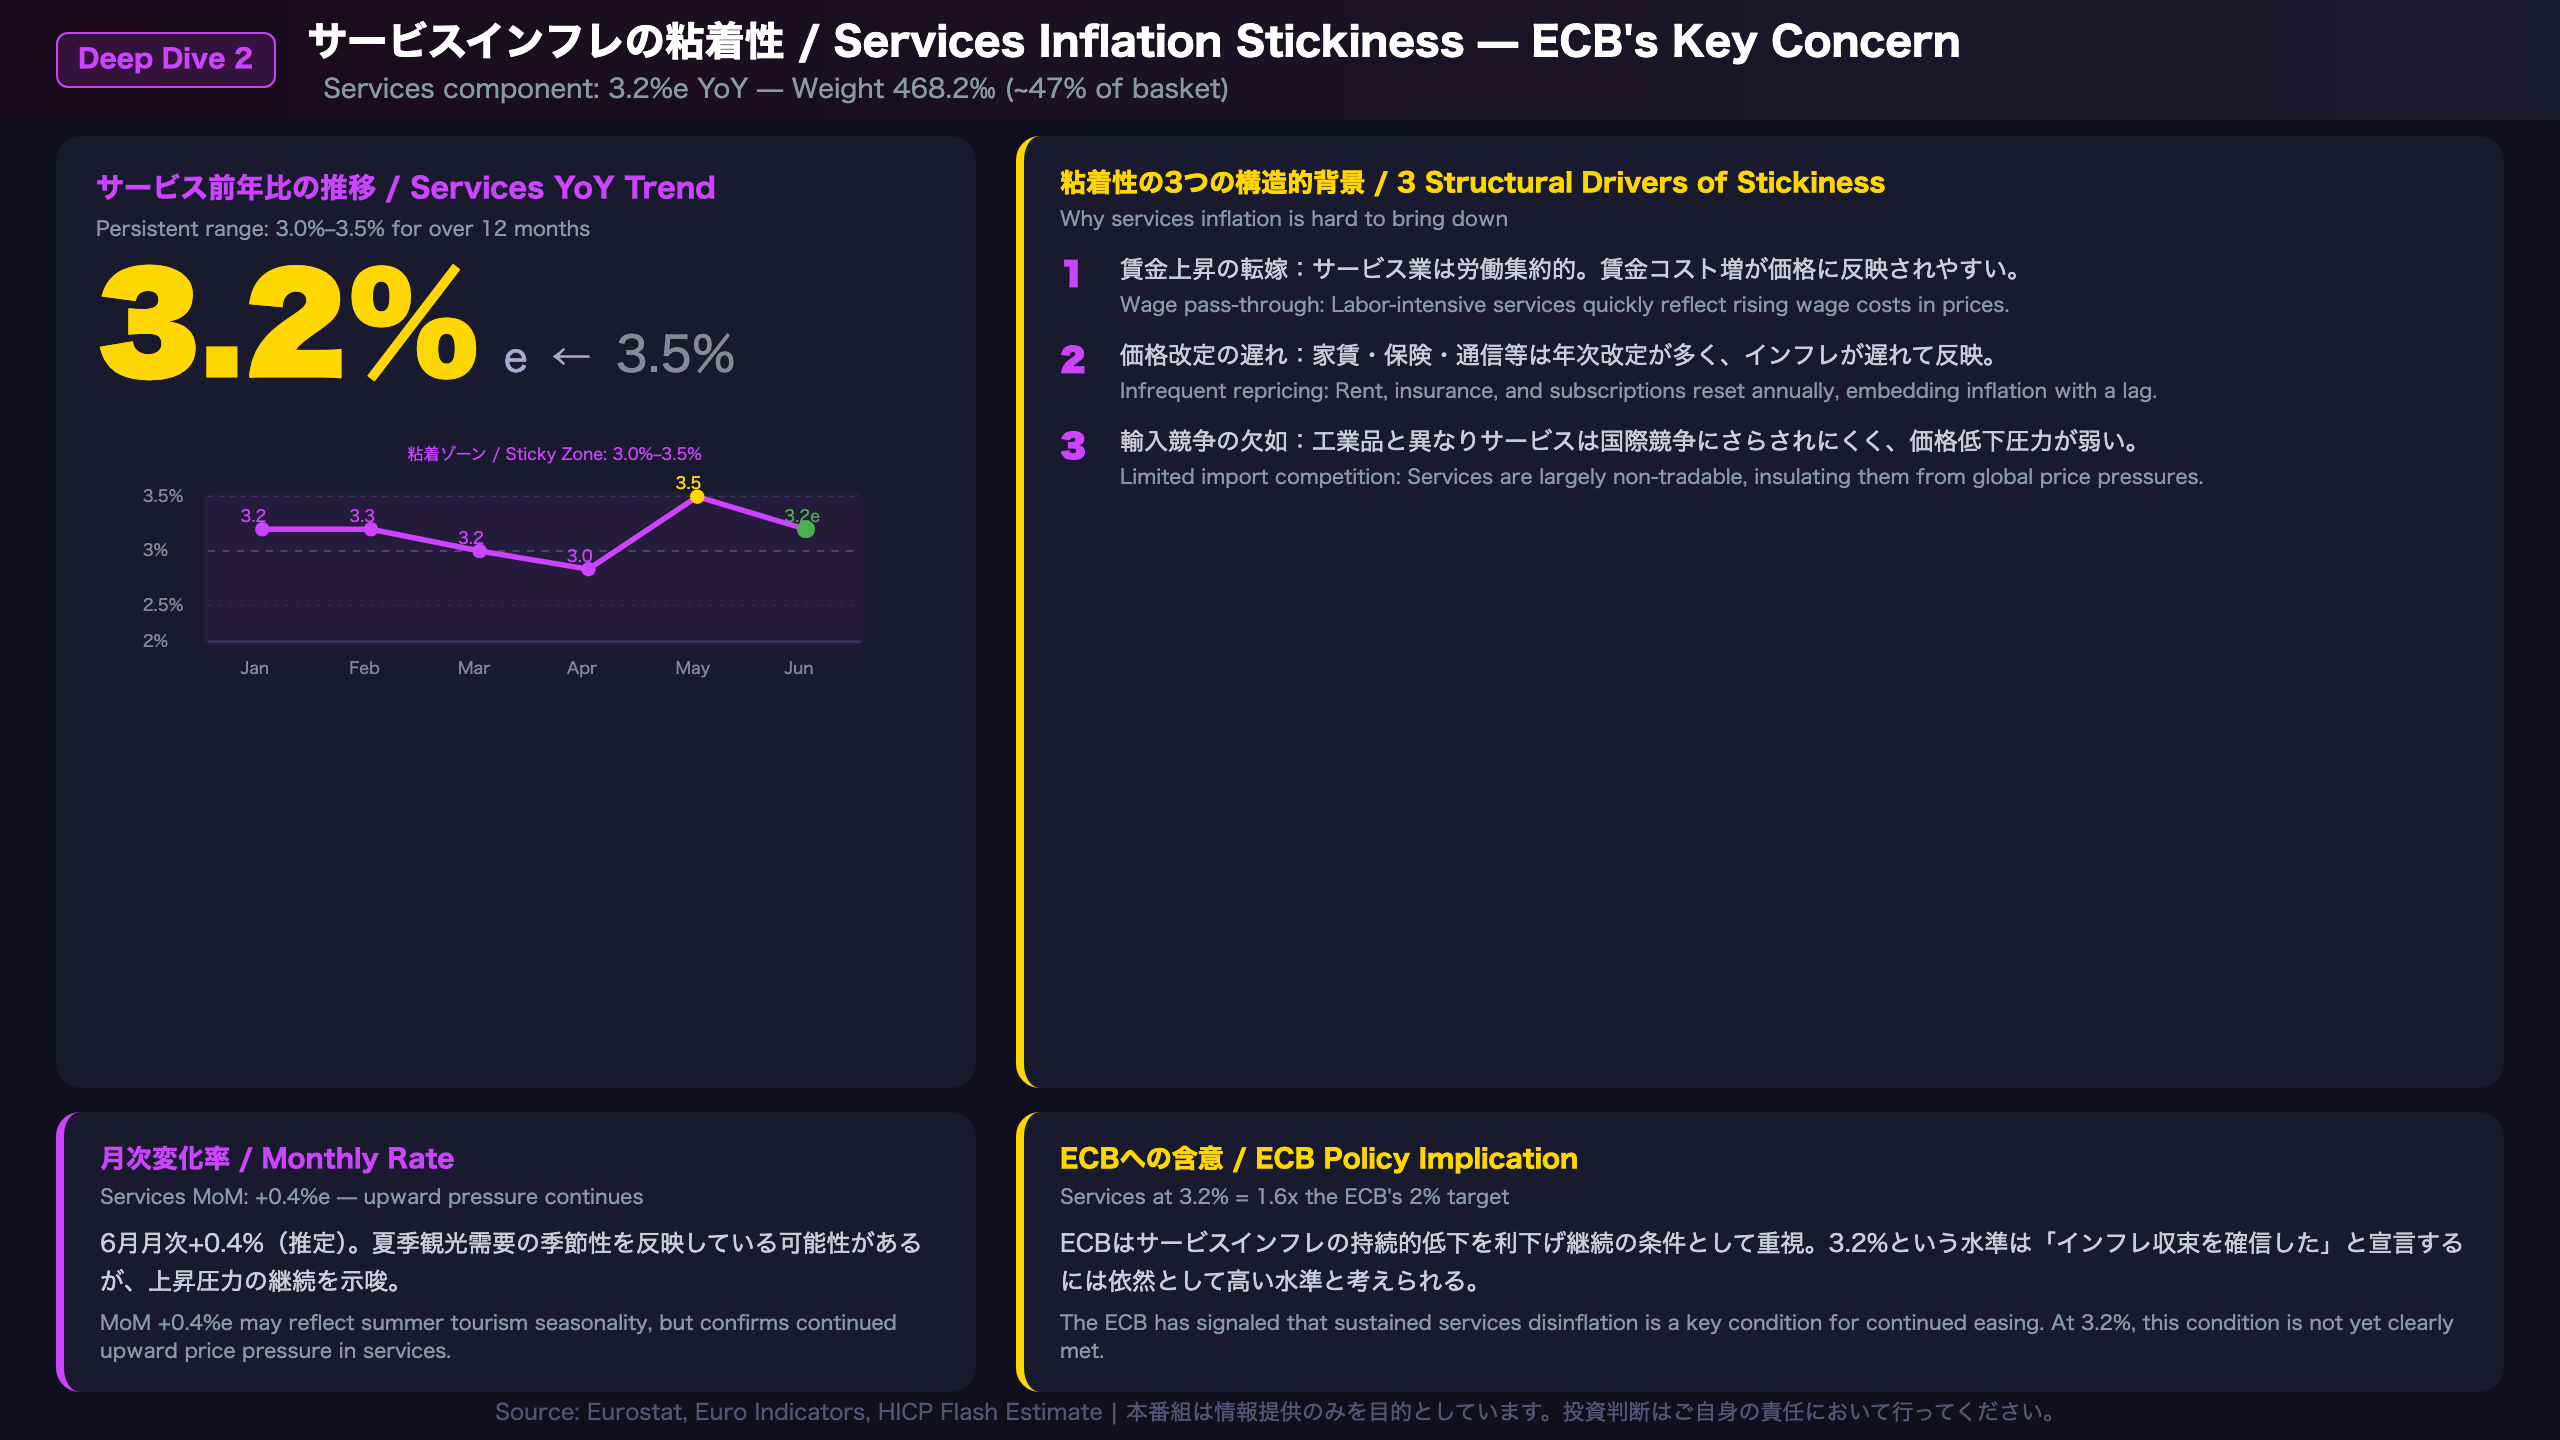
Services Inflation at 3.2%: The Structural Stickiness Problem
Services YoY Trend in 2026
| Month | Services YoY |
|---|---|
| Jun 2025 | 3.3% |
| Jan 2026 | 3.2% |
| Feb 2026 | 3.3% |
| Mar 2026 | 3.2% |
| Apr 2026 | 3.0% |
| May 2026 | 3.5% |
| Jun 2026 | 3.2%e |
The most striking feature of services inflation is its persistence. Unlike energy, which swung from -4.0% to +10.8% and back, services has remained in a tight 3.0%–3.5% band for over a year. This is the textbook definition of sticky inflation.
Why Services Inflation Is Structurally Sticky
- Wage pass-through: Services industries are labor-intensive. As long as euro area wage growth remains elevated, cost pressures will continue to feed into service prices.
- Infrequent price resetting: Many service contracts (rent, insurance, utilities, subscriptions) are revised annually, meaning inflation is embedded with a lag.
- Limited import competition: Unlike manufactured goods, services are largely non-tradable, insulating them from international price competition.
ECB Policy Implications
The ECB has historically signaled that a sustained decline in services inflation is a prerequisite for confidence in the disinflation process. At 3.2%, services remains 1.6x the 2% target. This is the key reason why, despite the headline improvement, the ECB is unlikely to dramatically accelerate its easing pace based on this single data point.
The +0.4% Monthly Rate
The month-on-month services rate of +0.4% (estimated) likely reflects seasonal factors — summer travel and tourism demand typically boost services prices in June-July. However, without seasonal adjustment data, it is difficult to isolate the underlying trend from seasonal noise.
International Comparison
The US has faced a similar “super-core” services inflation problem, with shelter and services ex-housing remaining elevated well after headline CPI peaked. The euro area’s experience mirrors this global pattern, suggesting that the “last mile” of disinflation — getting services from 3%+ to 2% — is the hardest part of the journey for central banks worldwide.
Deep Dive ③ — 国別HICP格差:ECB単一金利政策の構造的課題
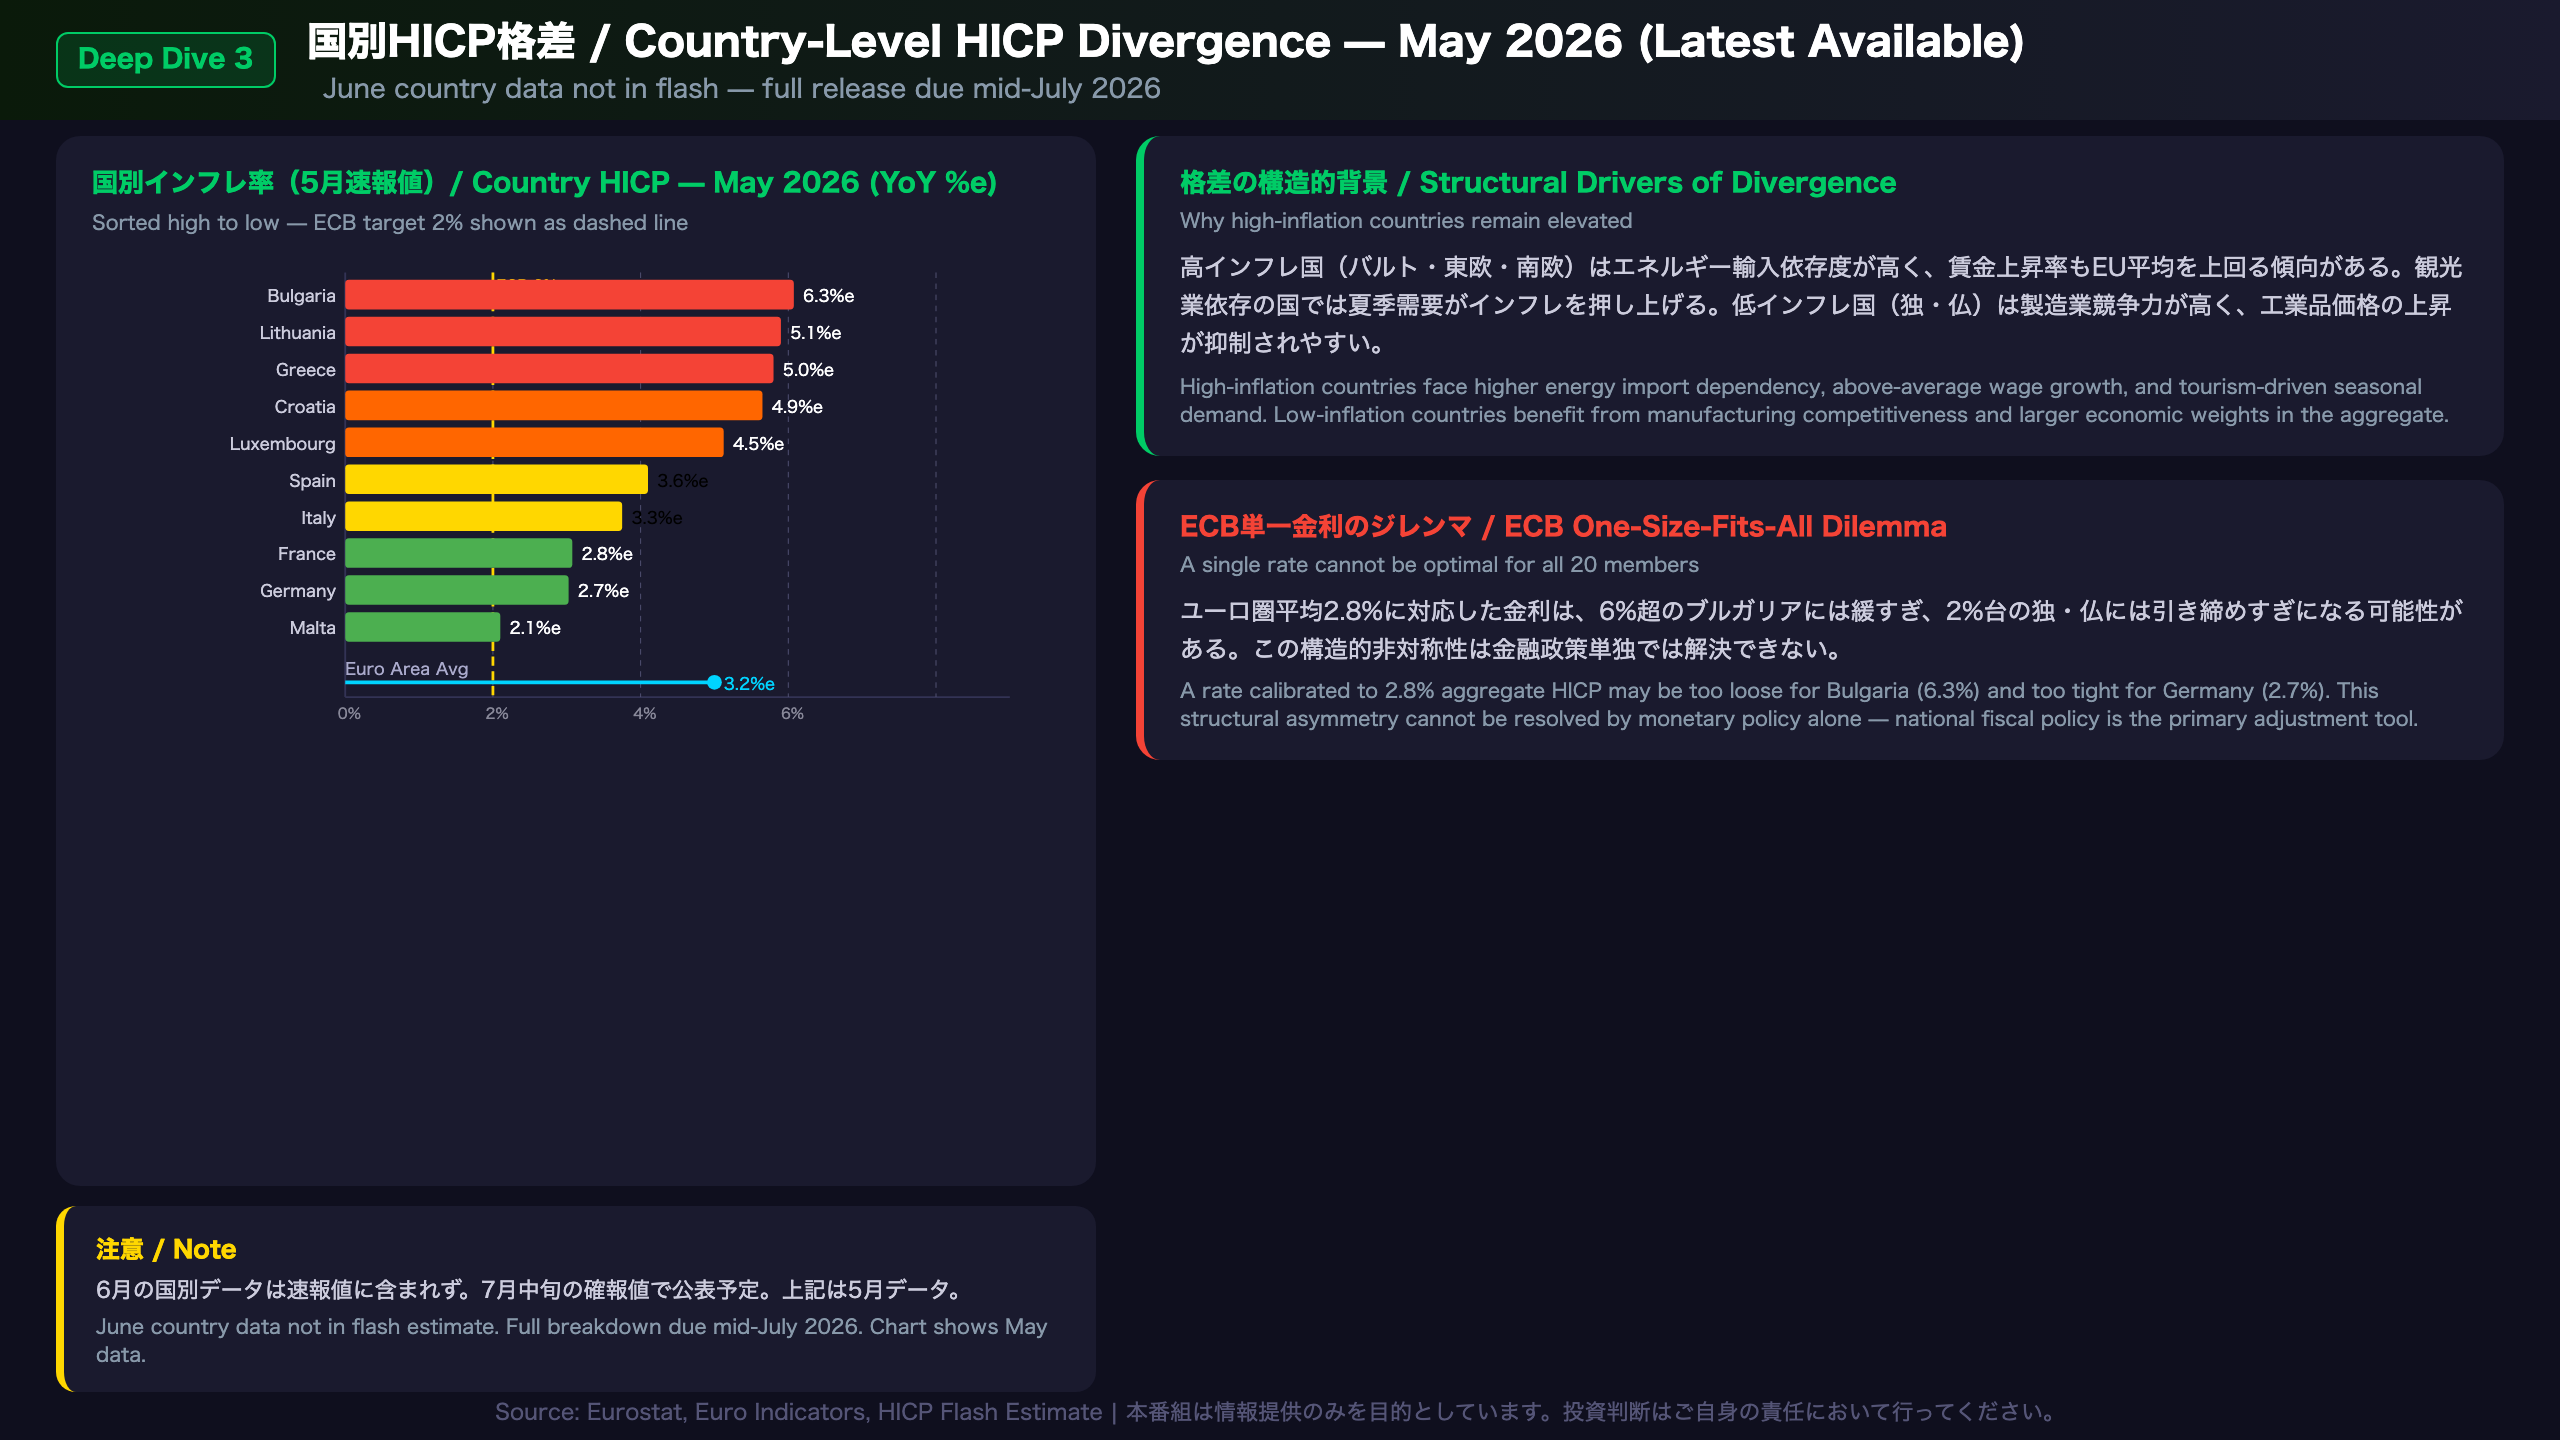
Country-Level HICP Divergence: The Structural Dilemma of One-Size-Fits-All Monetary Policy
May 2026 Country HICP Snapshot (Most Recent Available)
| Country | May YoY | Note |
|---|---|---|
| Bulgaria | 6.3%e | Highest in euro area |
| Lithuania | 5.1%e | Baltic high-inflation cluster |
| Greece | 5.0%e | Southern Europe elevated |
| Croatia | 4.9%e | Persistently high |
| Luxembourg | 4.5%e | Elevated |
| Spain | 3.6%e | Moderate |
| Italy | 3.3%e | Moderate |
| Germany | 2.7%e | Near target |
| France | 2.8%e | Near target |
| Malta | 2.1%e | Lowest in sample |
Note: June country-level data is not included in the flash estimate. Full country breakdown will be published in the mid-July HICP release.
Why the Divergence Persists
High-inflation countries (Baltics, Eastern Europe, Southern Europe):
– Higher energy import dependency amplifies energy price shocks
– Wage growth running above EU average, feeding services inflation
– Tourism-dependent economies face seasonal demand surges
– Catch-up dynamics: lower-income EU members tend to have structurally higher inflation as living standards converge toward Western European levels
Low-inflation countries (Germany, France):
– Larger, more diversified economies with stronger manufacturing competitiveness
– Carry the largest weights in the euro area HICP aggregate, anchoring the headline
The One-Size-Fits-All Problem
The ECB sets a single policy rate for all 20 euro area members. At 2.8% aggregate HICP, the ECB’s rate may be:
– Too loose for Bulgaria (6.3%), Lithuania (5.1%), Greece (5.0%) — real interest rates are negative in these countries
– Appropriately calibrated or slightly tight for Germany (2.7%) and France (2.8%)
This structural asymmetry is a permanent feature of the euro area architecture and cannot be resolved by monetary policy alone. Fiscal policy at the national level is the primary tool for addressing country-specific inflation differentials.
What to Watch
The June country-level HICP data, due in mid-July, will reveal whether high-inflation member states are beginning to converge toward the euro area average — a key input for ECB risk assessment.
インプリケーション — ECBと市場(EUR/JPY・EUR/USD)への含意
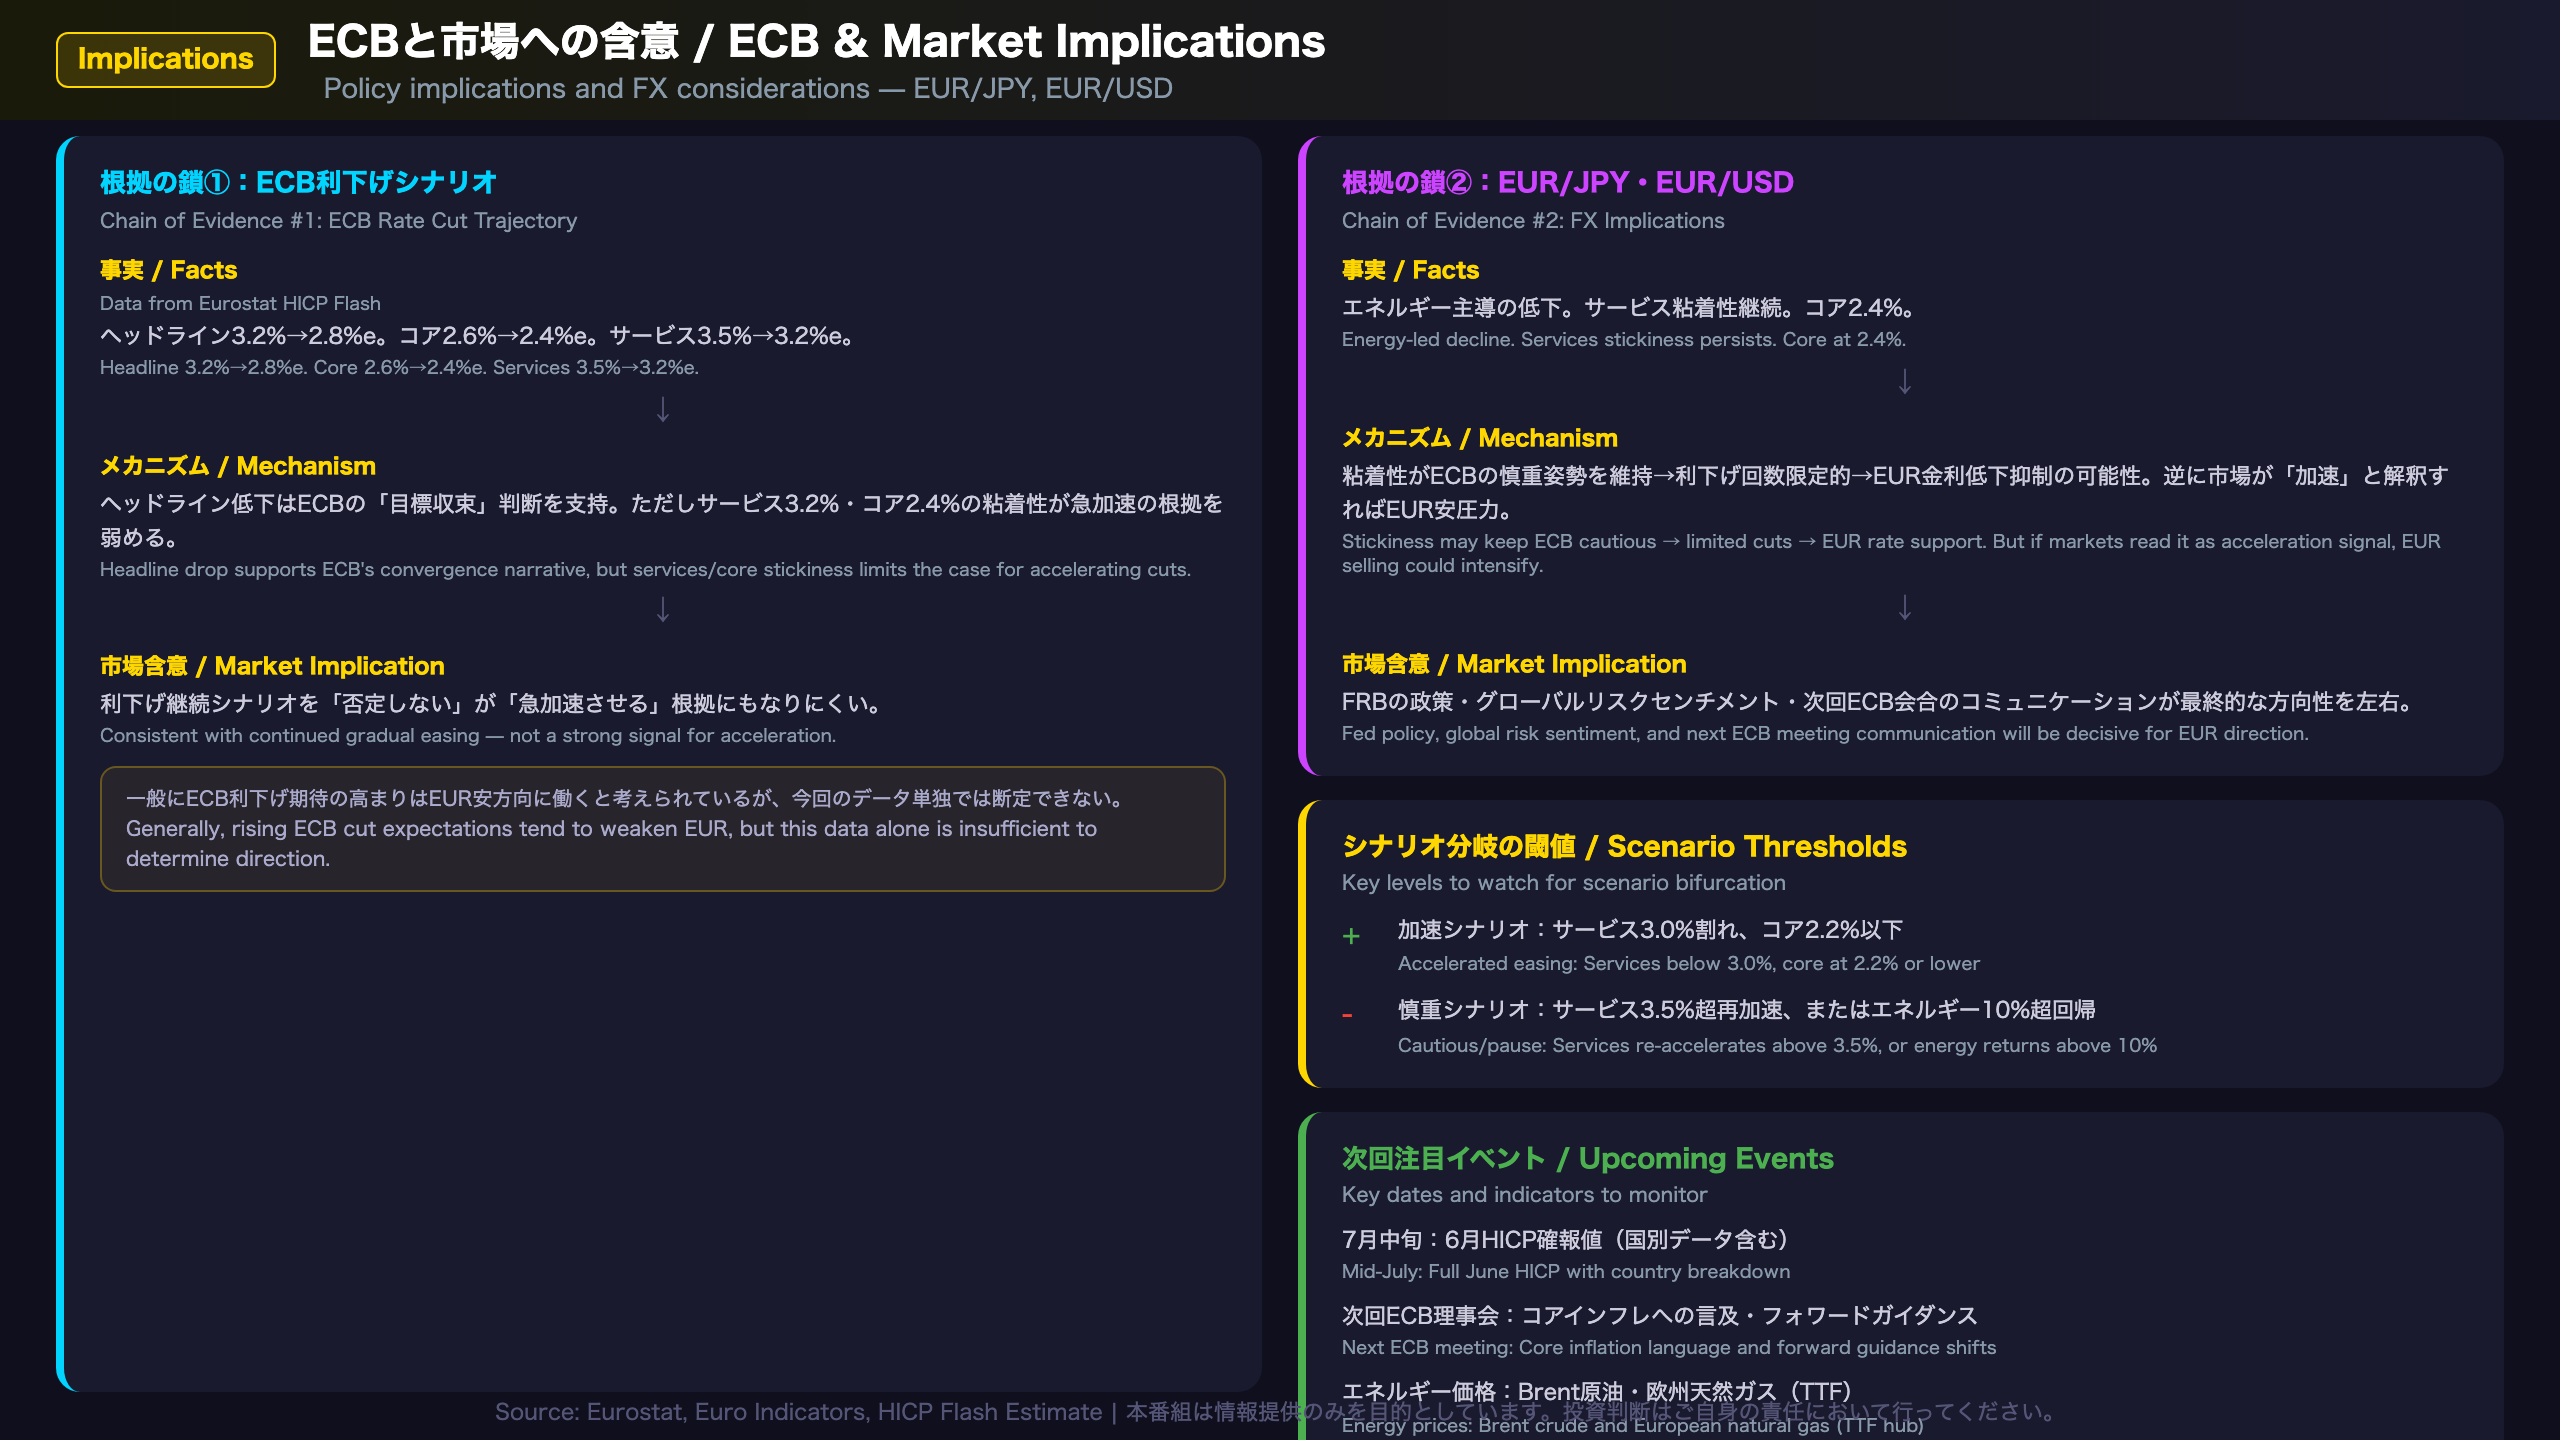
ECB and Market Implications: Following the Chain of Evidence
Chain of Evidence #1: ECB Rate Cut Trajectory
[Data Facts] Headline HICP: 3.2% → 2.8%e. Core (ex-energy, food): 2.6% → 2.4%e. Services: 3.5% → 3.2%e.
[Economic Mechanism] The headline decline provides supportive evidence for the ECB’s narrative that inflation is converging toward target. However, the ECB’s most-watched metric — services inflation — remains at 3.2%, and core at 2.4% is still 0.4 percentage points above the 2% target. The ECB has historically conditioned continued easing on “sustained” progress in services disinflation.
[Market Implication] This data is consistent with continued gradual ECB easing, but does not provide a strong basis for accelerating the cutting pace. It is generally understood that rising ECB rate-cut expectations tend to weaken EUR through lower expected short-term rates, but this data point alone is insufficient to determine the direction with confidence.
Chain of Evidence #2: EUR/JPY and EUR/USD
[Data Facts] Energy-led headline decline. Services stickiness persists. Core at 2.4%.
[Economic Mechanism] If services stickiness keeps the ECB cautious, the market’s priced-in number of cuts may remain limited, constraining EUR downside. Conversely, if markets interpret the headline drop as a signal for faster easing, EUR selling pressure could intensify.
[Market Implication] It is generally understood that ECB easing expectations tend to weaken EUR, but today’s data alone cannot determine the direction. Fed policy trajectory, global risk sentiment, and ECB communication at the next meeting will be decisive factors.
Key Scenario Thresholds
- Accelerated easing scenario: Services inflation falls below 3.0%, core drops to 2.2% or below
- Cautious/pause scenario: Services re-accelerates above 3.5%, or energy rebounds above 10%
Upcoming Events to Watch
- Mid-July 2026: Full June HICP release with country-level data
- Next ECB Governing Council meeting: Watch for language shifts on core inflation and forward guidance
- Energy prices: Brent crude and European natural gas (TTF) as leading indicators
Disclaimer: This article is for informational purposes only. All investment decisions are made solely at your own risk.