📺 Watch the Full Video Analysis
This article was automatically generated by the NFC Market Live AI analysis system. (Updated: 2026-06-24 23:08 JST)
📄 Primary Source
U.S. Census Bureau
https://www.census.gov/construction/nrs/pdf/newressales.pdf
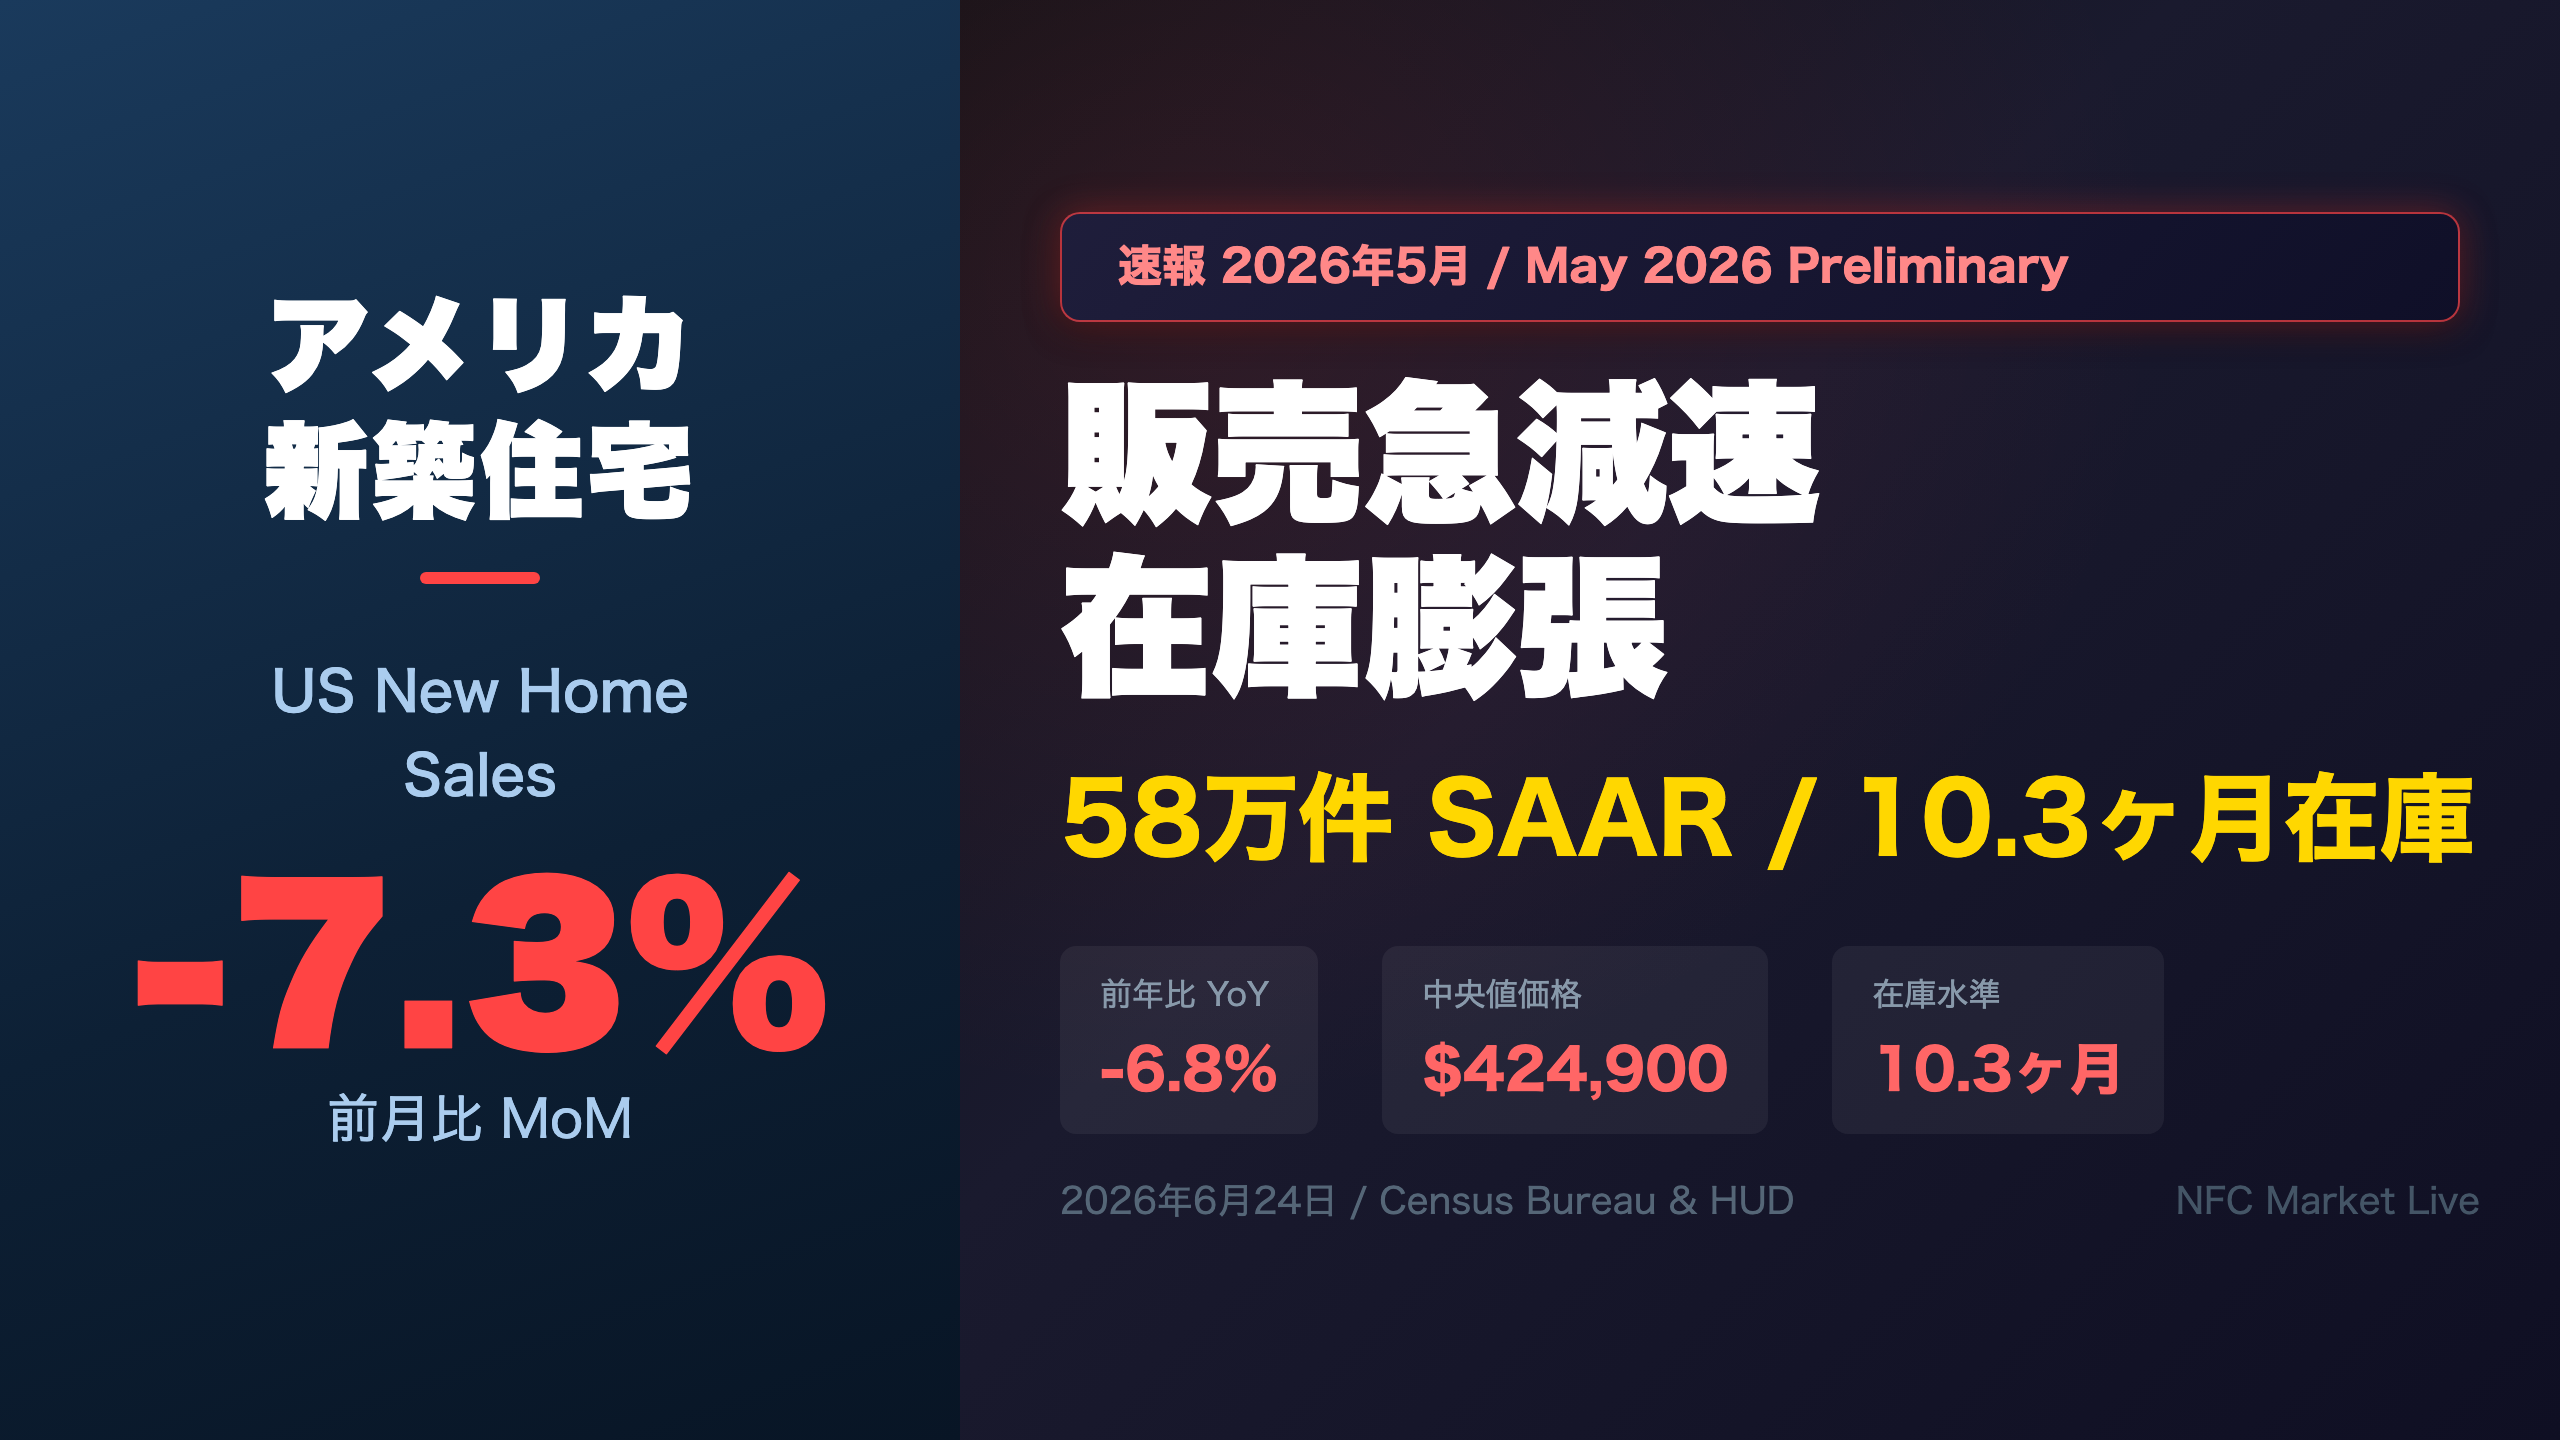
Deep dive into May 2026 US New Home Sales (preliminary). SAAR came in at 580,000 units — down 7.3% MoM and 6.8% YoY. Inventory surged to 10.3 months’ supply, the highest since early 2024. Median price held near flat YoY at $424,900 while average price jumped 5% YoY to $540,600. Regional breakdown shows the West collapsing 26.9% MoM. Full analysis of price tiers, construction stages, and market implications for investors.
The Ultimate Summary:5月新築住宅販売 — 販売急減速・在庫膨張の二重苦
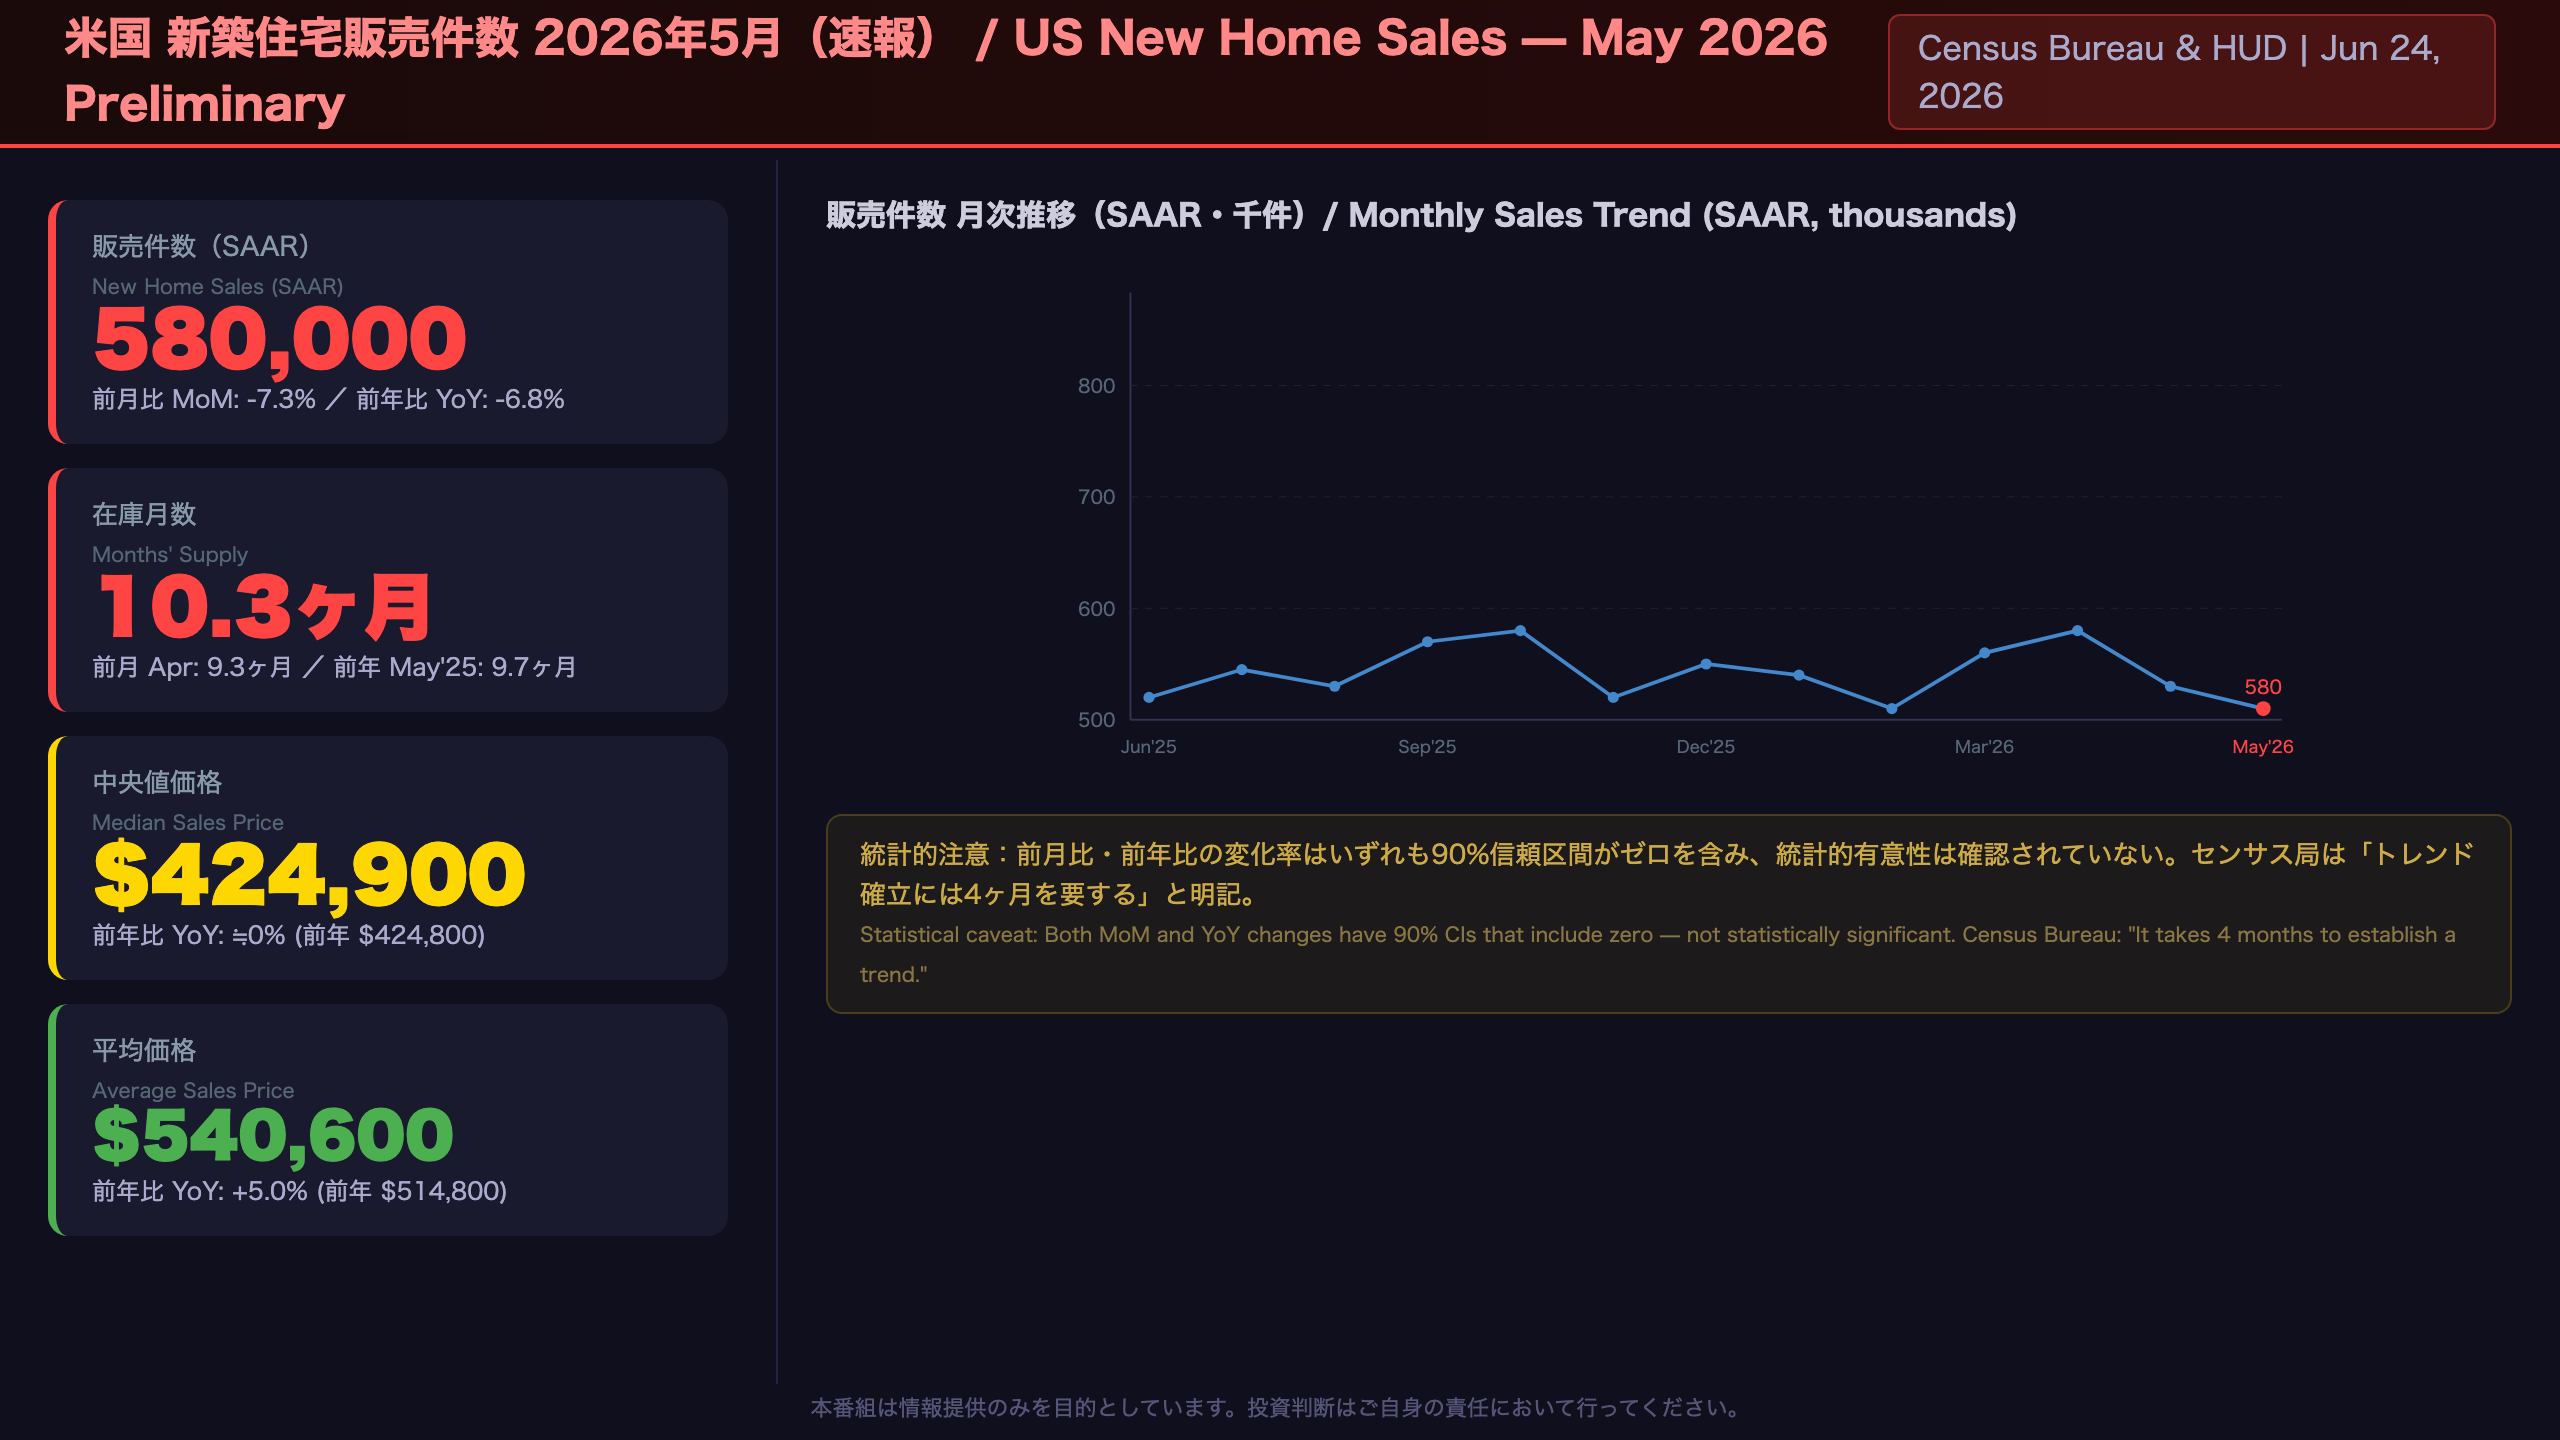
May 2026 US New Home Sales: The Complete Picture
Key Metrics at a Glance
| Metric | May 2026 (Prelim.) | April 2026 (Rev.) | MoM | May 2025 | YoY |
|---|---|---|---|---|---|
| Sales (SAAR) | 580,000 | 626,000 | -7.3% | 622,000 | -6.8% |
| For-Sale Inventory (SA) | 496,000 | 485,000 | +2.3% | 503,000 | -1.4% |
| Months’ Supply | 10.3 | 9.3 | +10.8% | 9.7 | +6.2% |
| Median Price | $424,900 | $416,500 | +2.0% | $424,800 | ≈0% |
| Average Price | $540,600 | $501,400 | +7.8% | $514,800 | +5.0% |
What Is the New Residential Sales Report?
Published jointly by the U.S. Census Bureau and the Department of Housing and Urban Development (HUD), this monthly report tracks sales of newly constructed single-family homes. A “sale” is defined as a deposit taken or a sales agreement signed — meaning it can occur before a building permit is issued. The data is primarily drawn from a sample of homes selected from building permits, and preliminary figures carry an average revision of about 5%.
The Statistical Caveat Every Investor Must Know
The Census Bureau explicitly states that the 90% confidence intervals for both the MoM and YoY changes include zero — meaning neither decline is statistically significant in isolation:
- MoM: -7.3% (±13.3%) → actual range: -20.6% to +6.0%
- YoY: -6.8% (±12.8%) → actual range: -19.6% to +6.0%
As the Bureau notes: “It takes 4 months to establish a trend for new houses sold.” This is a critical constraint for single-month interpretation.
Historical Context
Looking at the trailing 12 months, sales peaked at 757,000 in November 2025, then dropped sharply to 576,000 in January 2026. A recovery to the 626,000–664,000 range followed in February–April, making May’s pullback to 580,000 a notable reversal. The 10.3-month supply is among the highest readings since early 2024, approaching levels historically associated with buyer’s market conditions.
Next Release
June 2026 data is scheduled for release on July 24, 2026.
在庫の深掘り:10.3ヶ月の意味と建設段階別の構造
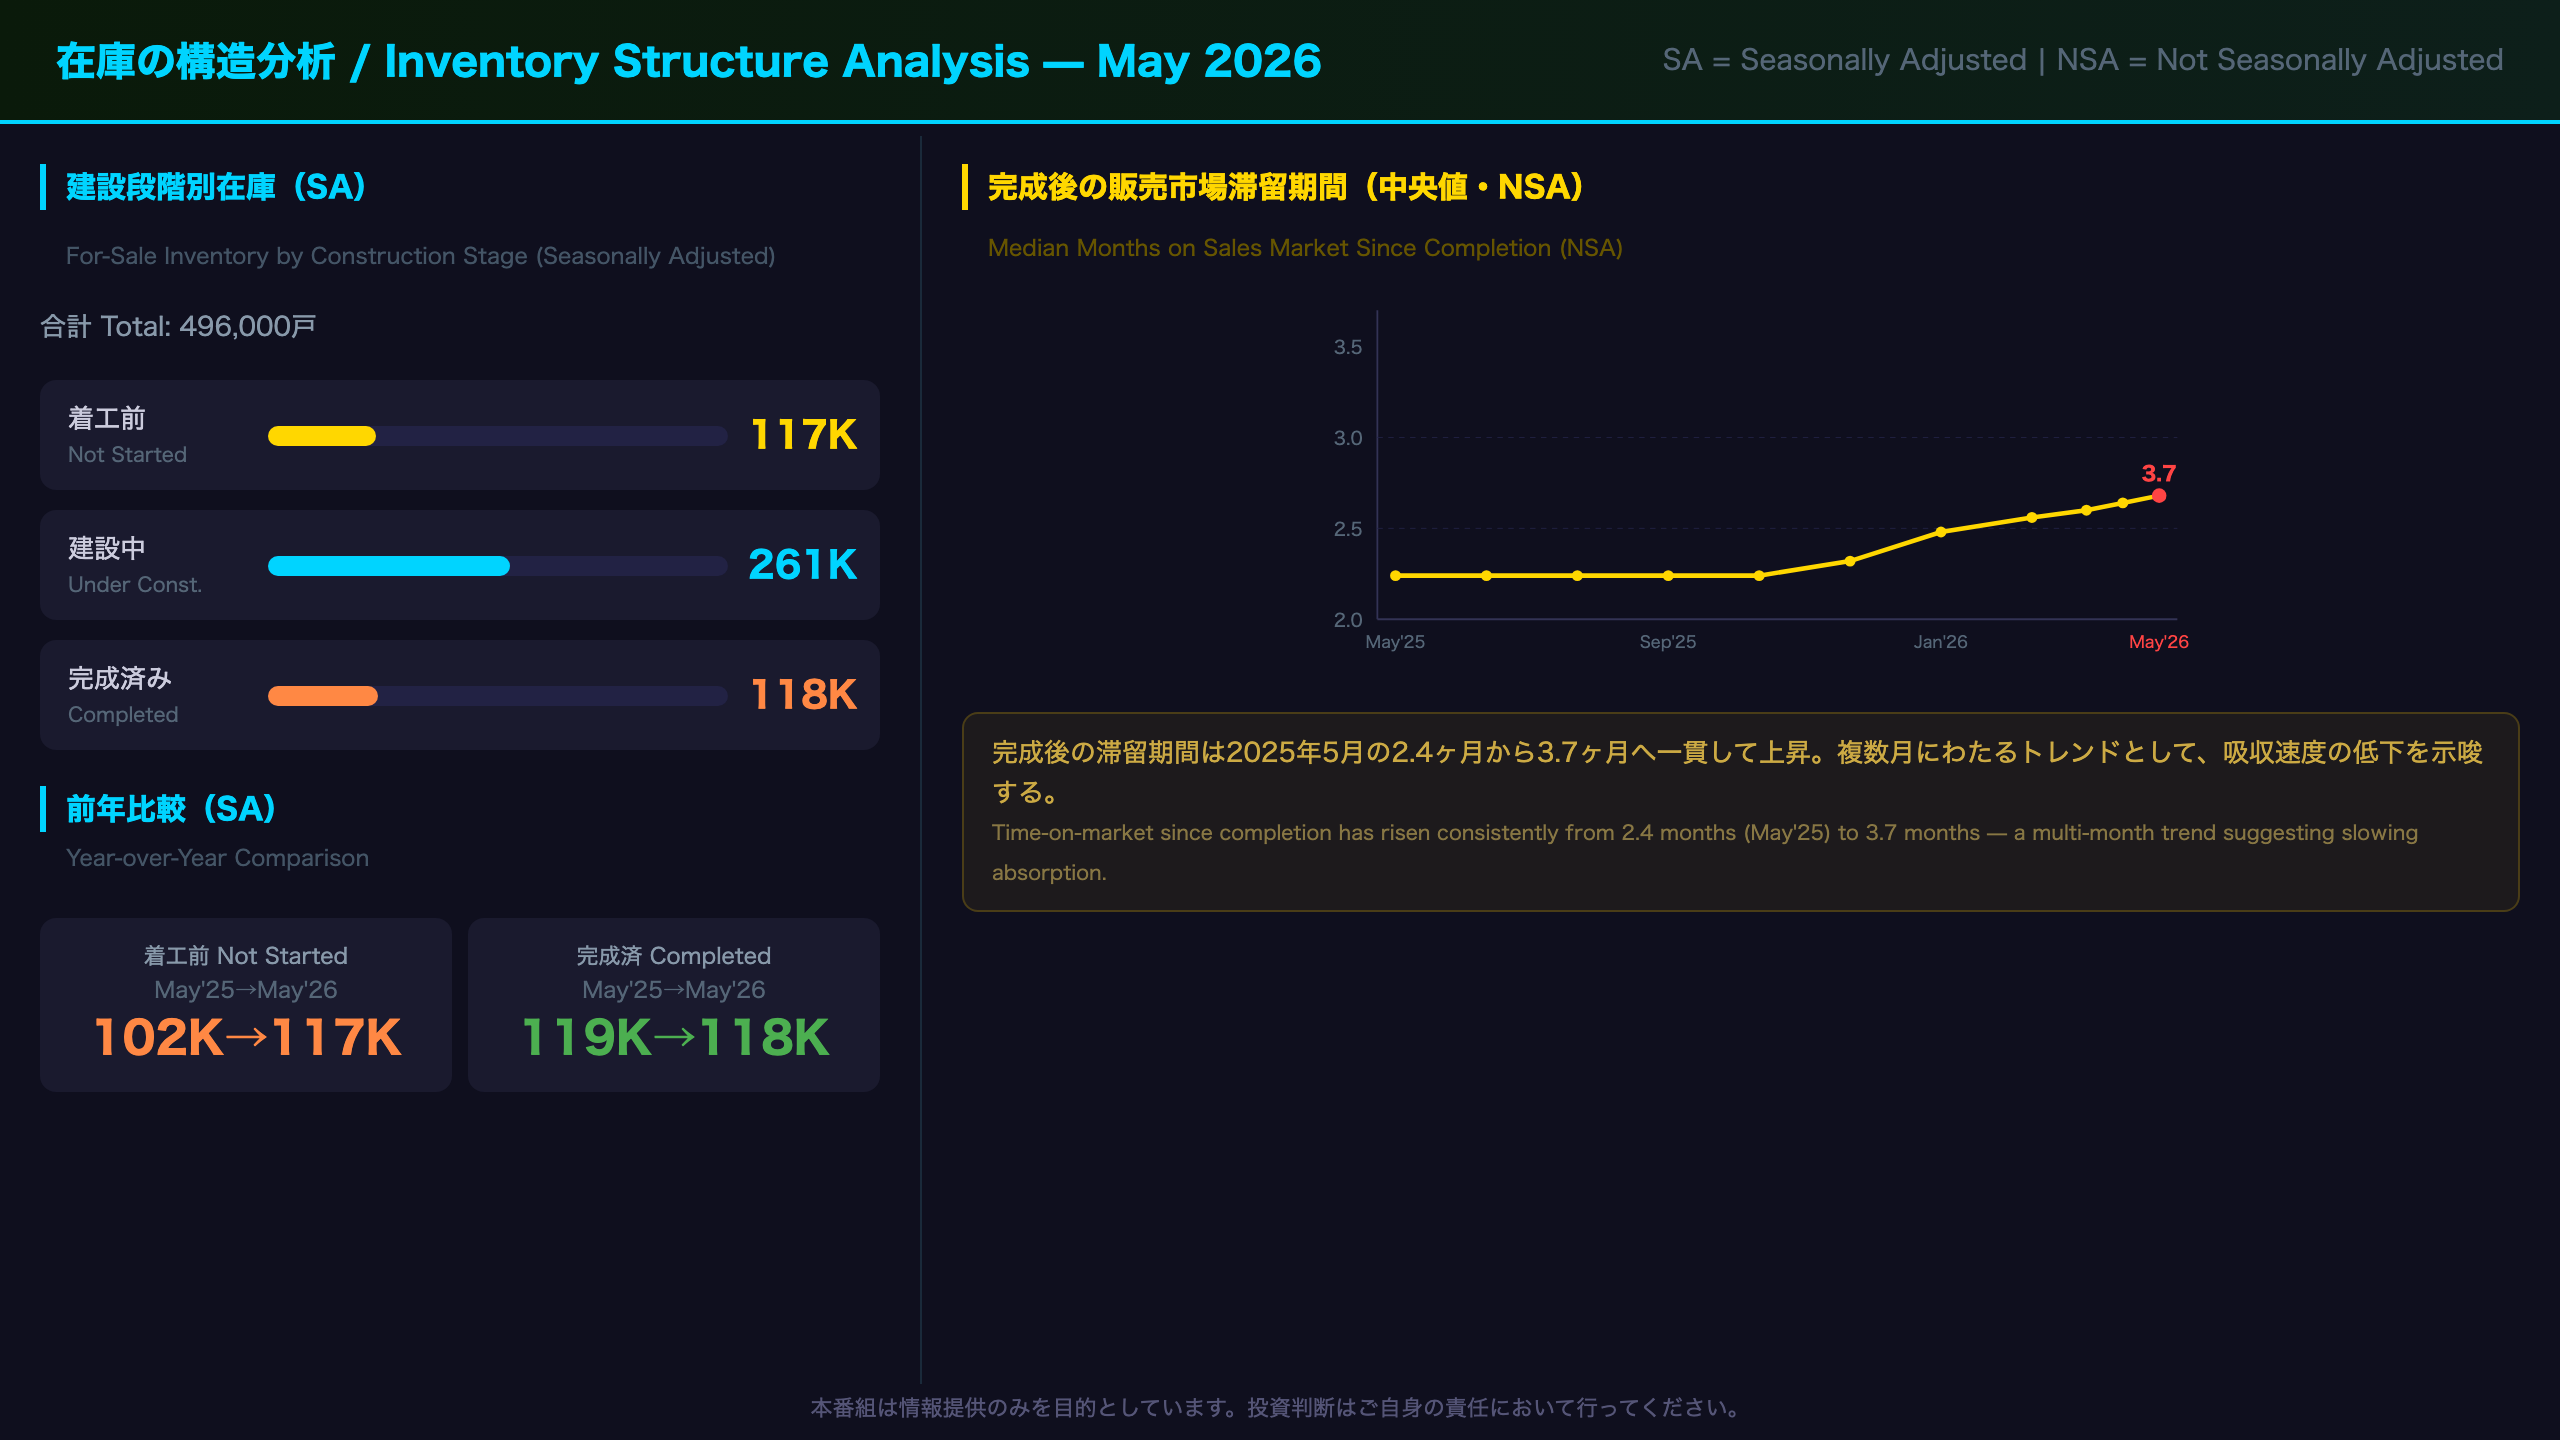
Inventory Deep Dive: Is 10.3 Months a Danger Zone?
Construction-Stage Breakdown (Seasonally Adjusted, thousands)
| Stage | May 2026 | April 2026 | May 2025 |
|---|---|---|---|
| Not Started | 117K | 108K | 102K |
| Under Construction | 261K | 259K | 282K |
| Completed | 118K | 118K | 119K |
| Total | 496K | 485K | 503K |
Contextualizing 10.3 Months
In housing market analysis, a 6-month supply is commonly cited as a “balanced” level. At 10.3 months, the new home market is well above that threshold. However, a critical distinction from the existing home market: the majority of new home inventory consists of homes not yet completed — 117K not started and 261K under construction versus only 118K completed. This means the headline inventory figure includes homes that are months away from being deliverable, which dampens the immediate price-pressure implications.
The Lengthening Time-on-Market Signal
The not-seasonally-adjusted median months on the sales market since completion has been rising consistently:
- May 2025: 2.4 months
- January 2026: 3.0 months
- March 2026: 3.5 months
- April 2026: 3.6 months
- May 2026: 3.7 months
Unlike the single-month sales figure (which carries wide confidence intervals), this multi-month upward trend in time-on-market is a more statistically robust signal of slowing absorption.
Bull vs. Bear Interpretation
Bull case: Completed inventory has not surged, suggesting builders retain some supply discipline. The pipeline build (not-started) could be scaled back quickly if demand weakens further.
Bear case: The rising not-started inventory (102K → 117K YoY) means the pipeline is expanding, which could translate into more completed inventory pressure in coming months if sales remain soft.
価格動向:中央値と平均値の乖離が示す市場の二極化
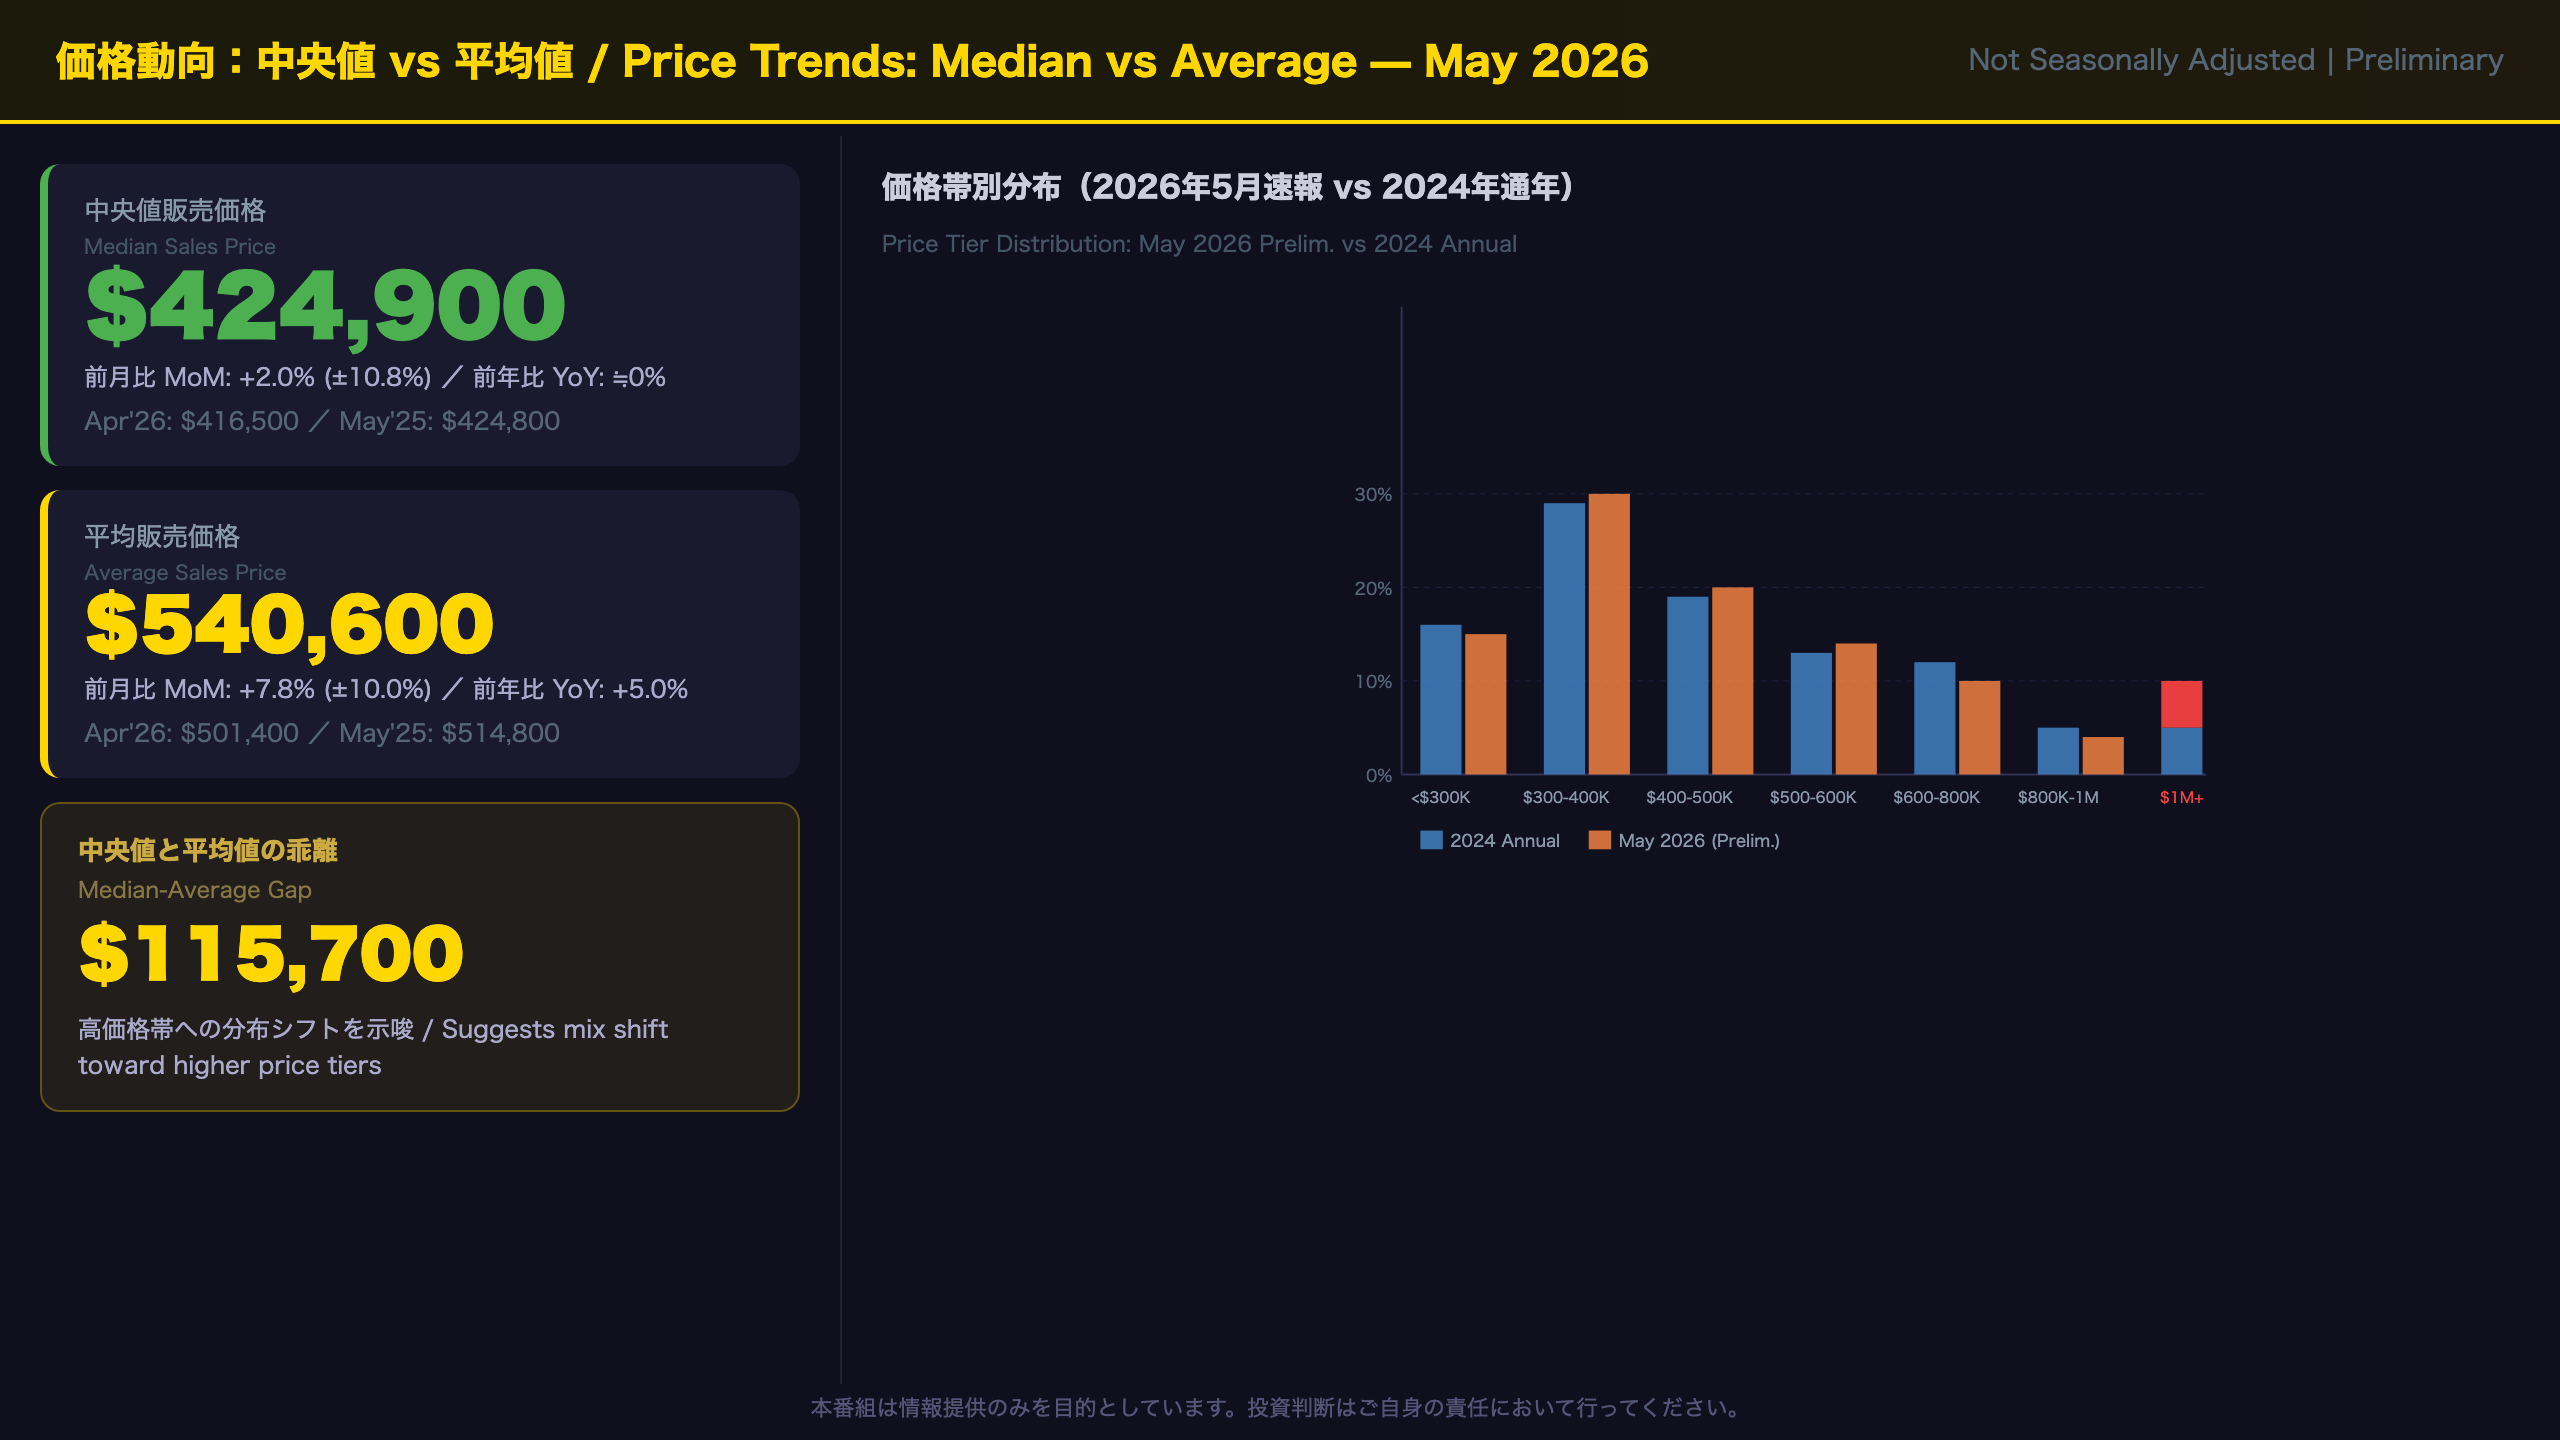
Price Divergence: What the Median-Average Gap Reveals
Price Tier Distribution Shift
| Price Range | 2024 Annual | 2025 Annual | May 2026 (Prelim.) |
|---|---|---|---|
| Under $300K | 16% | 18% | 15% |
| $300K–$400K | 29% | 28% | 30% |
| $400K–$500K | 19% | 18% | 20% |
| $500K–$600K | 13% | 12% | 14% |
| $600K–$800K | 12% | 13% | 10% |
| $800K–$1M | 5% | 4% | 4% |
| $1M+ | 5% | 6% | 7% |
Understanding the Median-Average Divergence
The median price ($424,900) represents the midpoint of the distribution and is resistant to outlier distortion. The average price ($540,600) is pulled upward by high-value transactions. The $115,700 gap between the two signals a right-skewed distribution — a thicker upper tail of luxury home sales. The $1M+ share rising from 5% (2024 annual) to 7% (May 2026) is a concrete data point supporting this interpretation.
The Shrinking Affordable Tier
Homes priced under $300,000 fell from 18% of sales in full-year 2025 to 15% in May 2026. In absolute terms, the not-seasonally-adjusted count of sub-$300K homes sold in May 2026 was 8,000 units — below the 2025 annual monthly average of approximately 9,900 units. In a high-mortgage-rate environment, entry-level demand appears to be under the most pressure.
Confidence Interval Reminder
The median price MoM change of +2.0% carries a ±10.8% confidence interval — statistically insignificant. The YoY change of approximately 0% (±9.9%) is similarly inconclusive. Price trend analysis requires multi-month observation.
International Context
For comparison, the US median new home price of ~$425K is substantially higher than pre-pandemic levels (~$320K in 2019), reflecting both construction cost inflation and land scarcity in high-demand metros. The Fed’s policy rate trajectory remains a key variable for affordability.
地域別格差:ウエストの急落とサウスの軟調
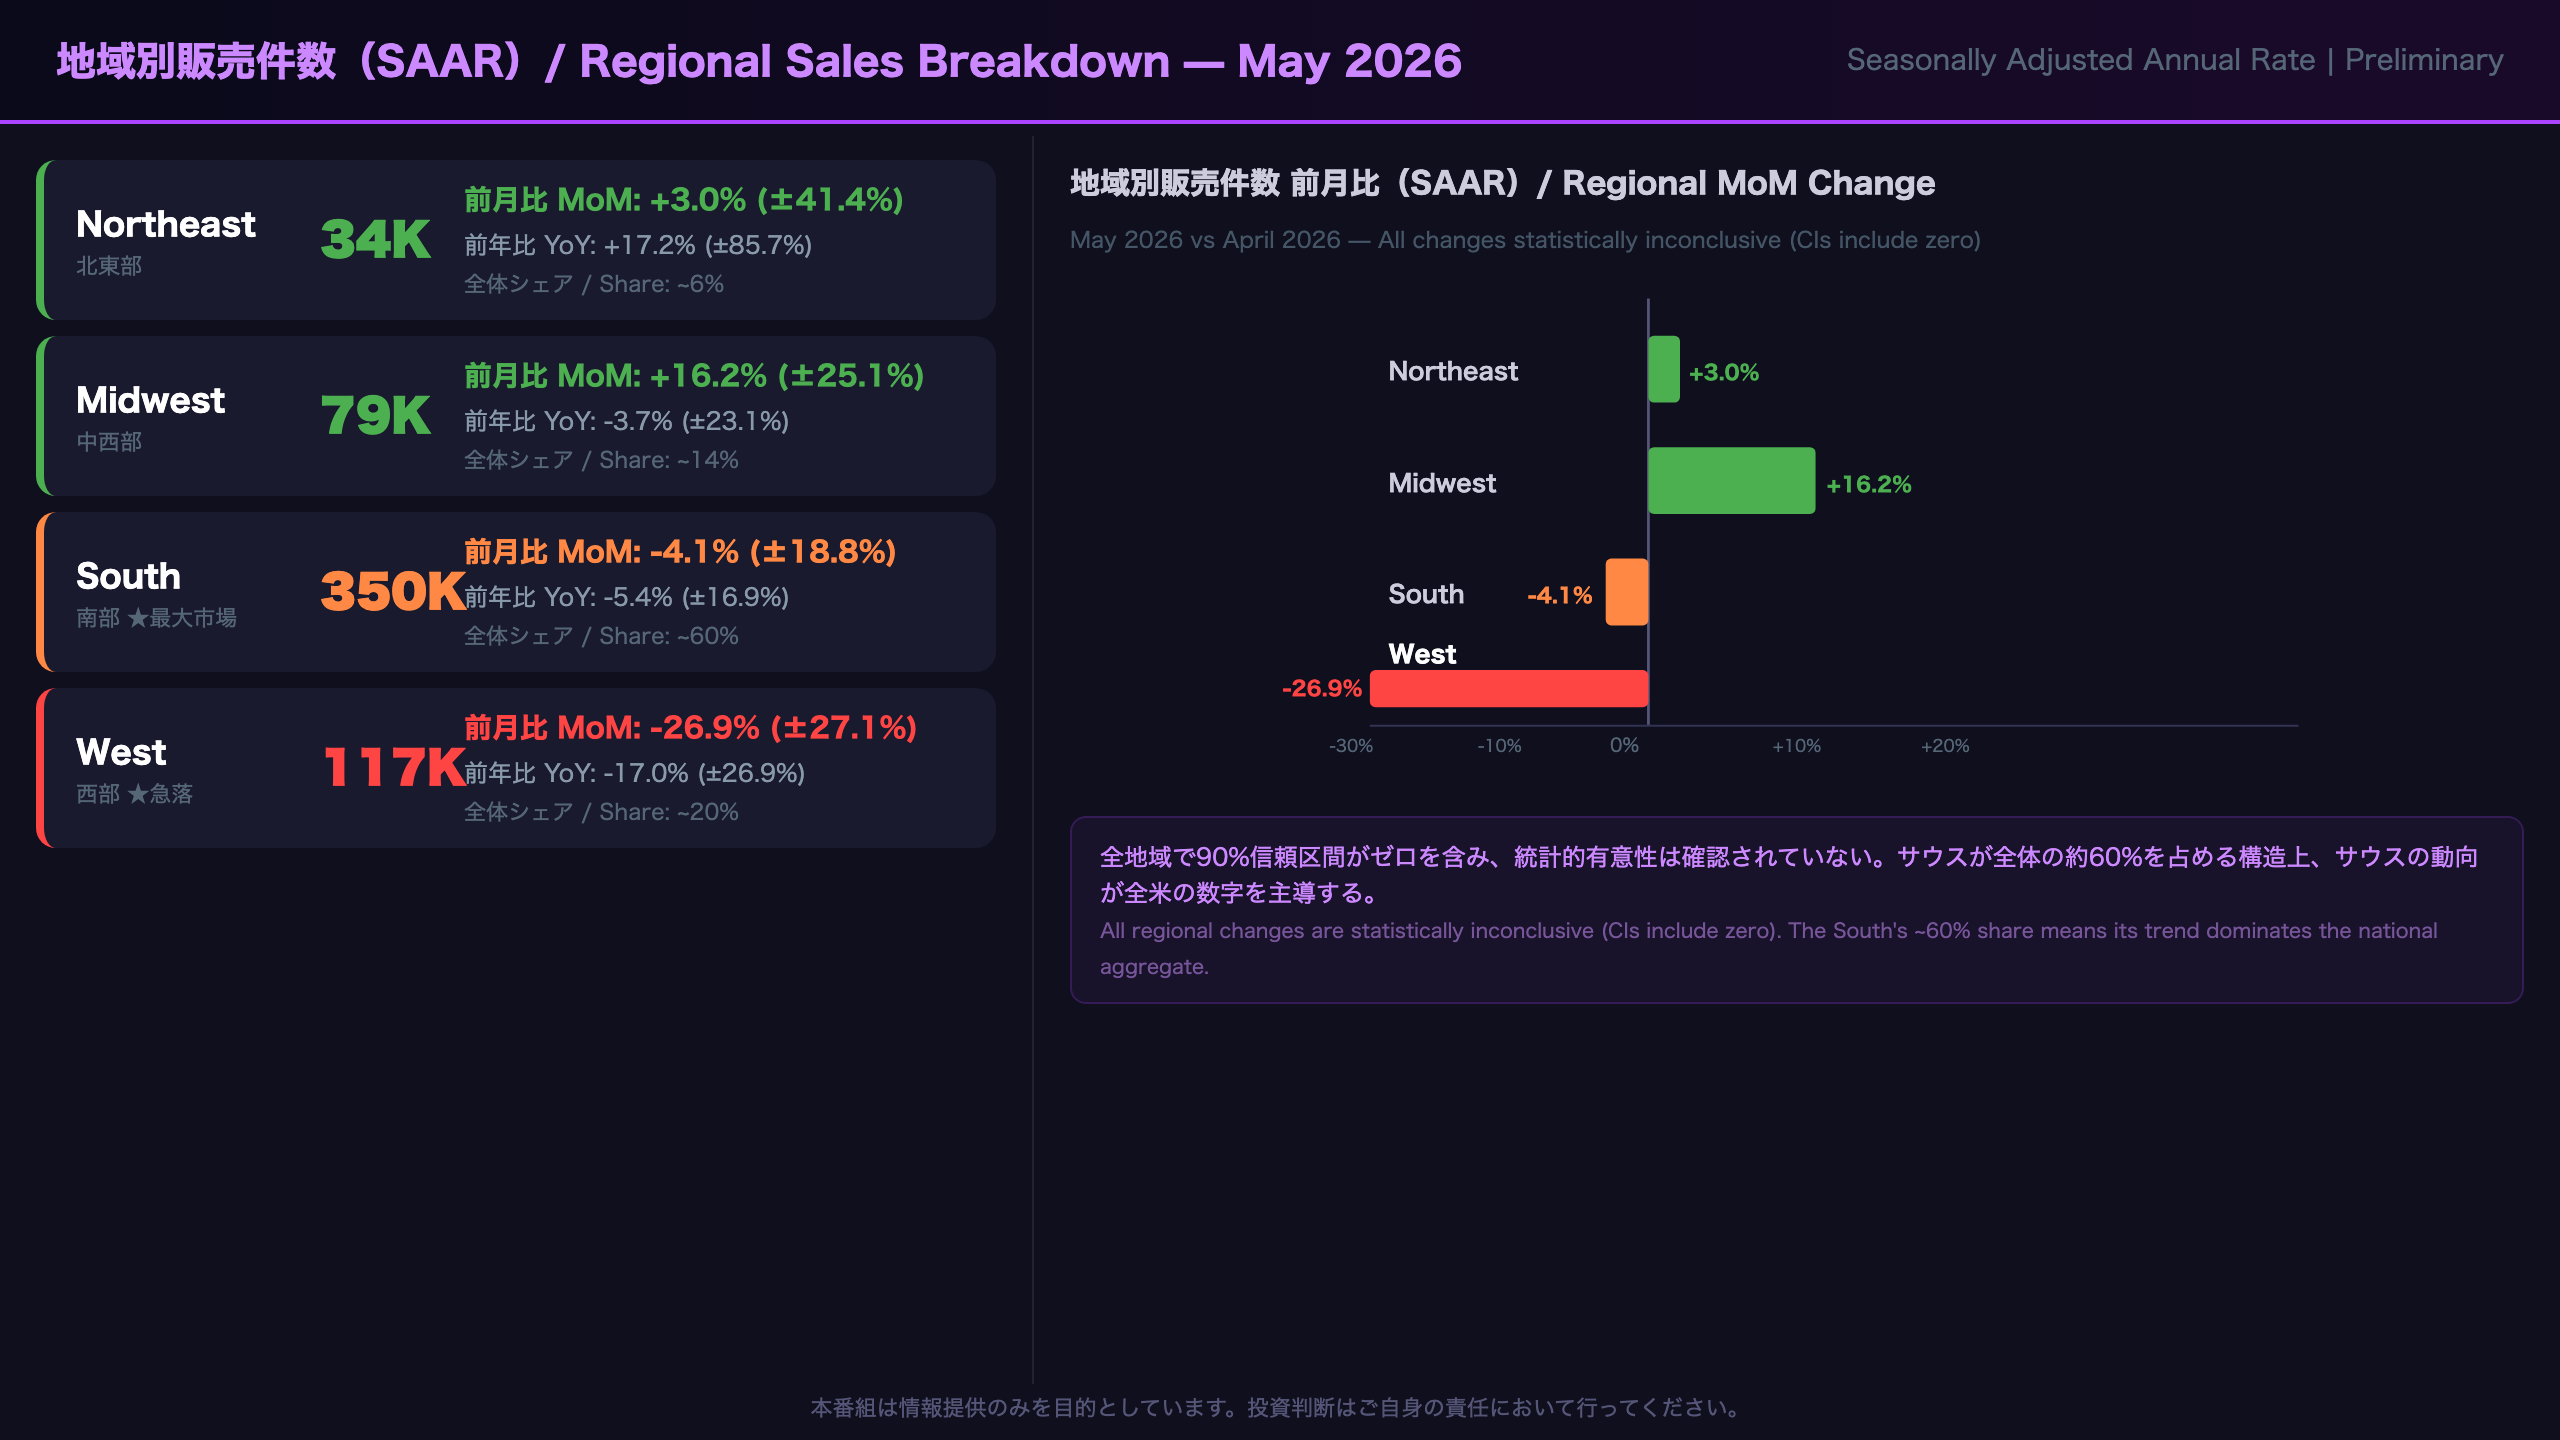
Regional Divergence: The West’s Collapse and the South’s Softness
Regional Sales Breakdown (SAAR, thousands)
| Region | May 2026 | April 2026 | MoM | May 2025 | YoY | National Share |
|---|---|---|---|---|---|---|
| Northeast | 34K | 33K | +3.0% | 29K | +17.2% | ~6% |
| Midwest | 79K | 68K | +16.2% | 82K | -3.7% | ~14% |
| South | 350K | 365K | -4.1% | 370K | -5.4% | ~60% |
| West | 117K | 160K | -26.9% | 141K | -17.0% | ~20% |
| Total | 580K | 626K | -7.3% | 622K | -6.8% | 100% |
Statistical Significance: All Regions Inconclusive
Every regional change carries a 90% confidence interval that includes zero:
– Northeast MoM: ±41.4% — not significant
– Midwest MoM: ±25.1% — not significant
– South MoM: ±18.8% — not significant
– West MoM: ±27.1% — not significant
This is a fundamental limitation of the new home sales survey’s regional sample sizes. Regional data should be interpreted as directional indicators only.
Why the South Matters Most
The South accounts for approximately 60% of all new single-family home sales in the US. States like Texas, Florida, and North Carolina are the primary battlegrounds for major homebuilders (D.R. Horton, Lennar, NVR). A sustained YoY decline in the South (-5.4%) is the most consequential regional signal in this report.
The West: High Rates, High Prices
The West’s 26.9% MoM plunge is dramatic but statistically inconclusive. The region concentrates high-cost markets (California, Washington, Colorado) where affordability is most stretched by elevated mortgage rates. The West’s YoY decline of -17.0% — if sustained — would represent a meaningful demand contraction in the nation’s most expensive new home market.
インプリケーション:住宅市場の先行きとFRBへの示唆
Synthesis and Market Implications
Resilience vs. Risk Scorecard
Resilience (Positive)
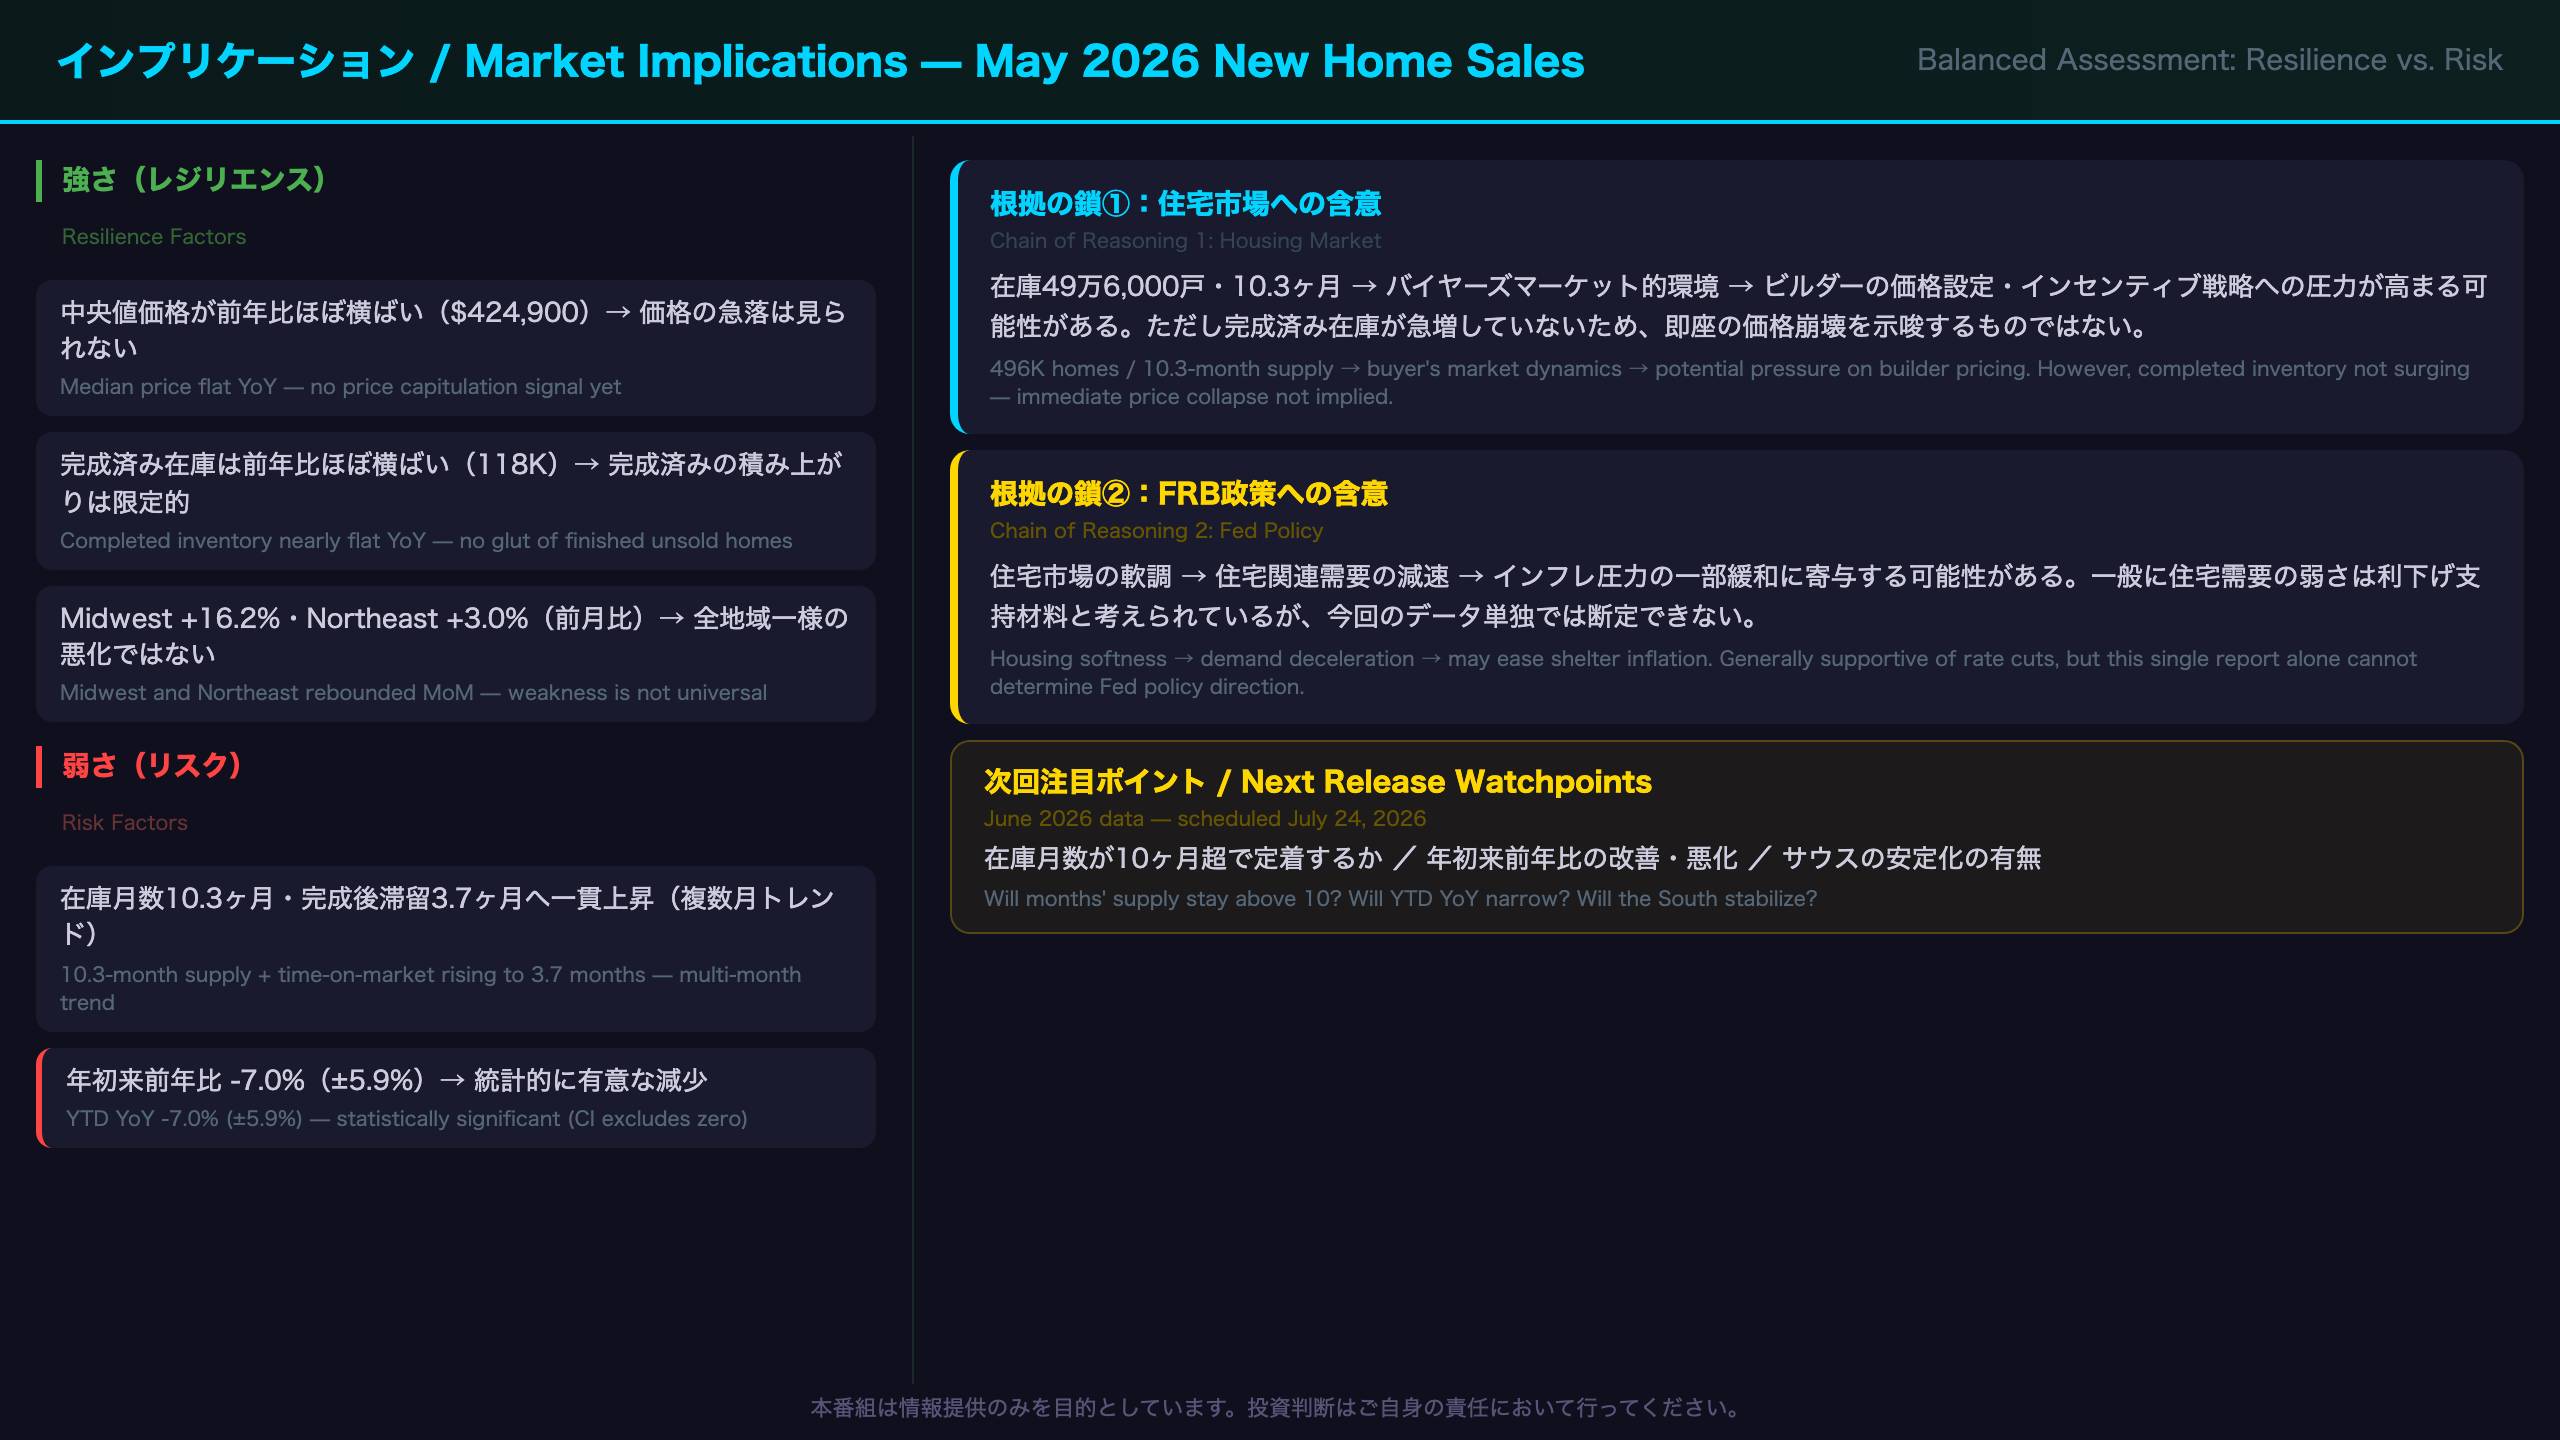
– Median price flat YoY ($424,900 vs $424,800) — no price capitulation yet
– Midwest (+16.2% MoM) and Northeast (+3.0% MoM) posted gains — weakness is not universal
– Completed inventory nearly flat YoY (118K vs 119K) — no glut of finished unsold homes
Risk (Negative)
– Sales directionally lower MoM and YoY (though statistically inconclusive on a single-month basis)
– 10.3-month supply is elevated — buyer’s market territory
– Median time-on-market since completion rising consistently to 3.7 months — a multi-month trend signal
– Year-to-date (Jan–May) NSA sales down 7.0% (±5.9%) YoY — this IS statistically significant (CI does not include zero)
– South YoY -5.4% persisting
The Chain of Reasoning for Market Implications
Implication 1 (Housing Market):
[496,000 homes for sale / 10.3-month supply] → [inventory elevated relative to sales pace, creating buyer’s market dynamics] → [builders may face pressure to increase incentives or reduce prices on completed homes, potentially weighing on residential construction activity]. However, since completed inventory has not surged, immediate price collapse is not implied by this data.
Implication 2 (Fed Policy):
[Soft new home sales + elevated inventory] → [housing-related demand deceleration] → [may contribute to easing shelter-related inflation pressures over time]. However, new home sales is one data point among many, and this report alone is insufficient to draw conclusions about Fed rate decisions. The general principle that housing weakness supports rate cuts is well-established, but the causal chain from this single report to policy action is long and uncertain.
Key Watchpoints for Next Release (July 24, 2026)
- Will months’ supply remain above 10 months or begin to decline?
- Will the YTD YoY decline of -7.0% narrow or widen?
- Will the South show signs of stabilization?
- Will the West’s apparent weakness persist or prove to be statistical noise?
Disclaimer: This article is for informational purposes only. All investment decisions are made solely at your own risk.







