📺 Watch the Full Video Analysis
This article was automatically generated by the NFC Market Live AI analysis system. (Updated: 2026-11-04 23:43 JST)
📄 Primary Source
U.S. Census Bureau
https://www.census.gov/foreign-trade/Press-Release/current_press_release/ft900.pdf
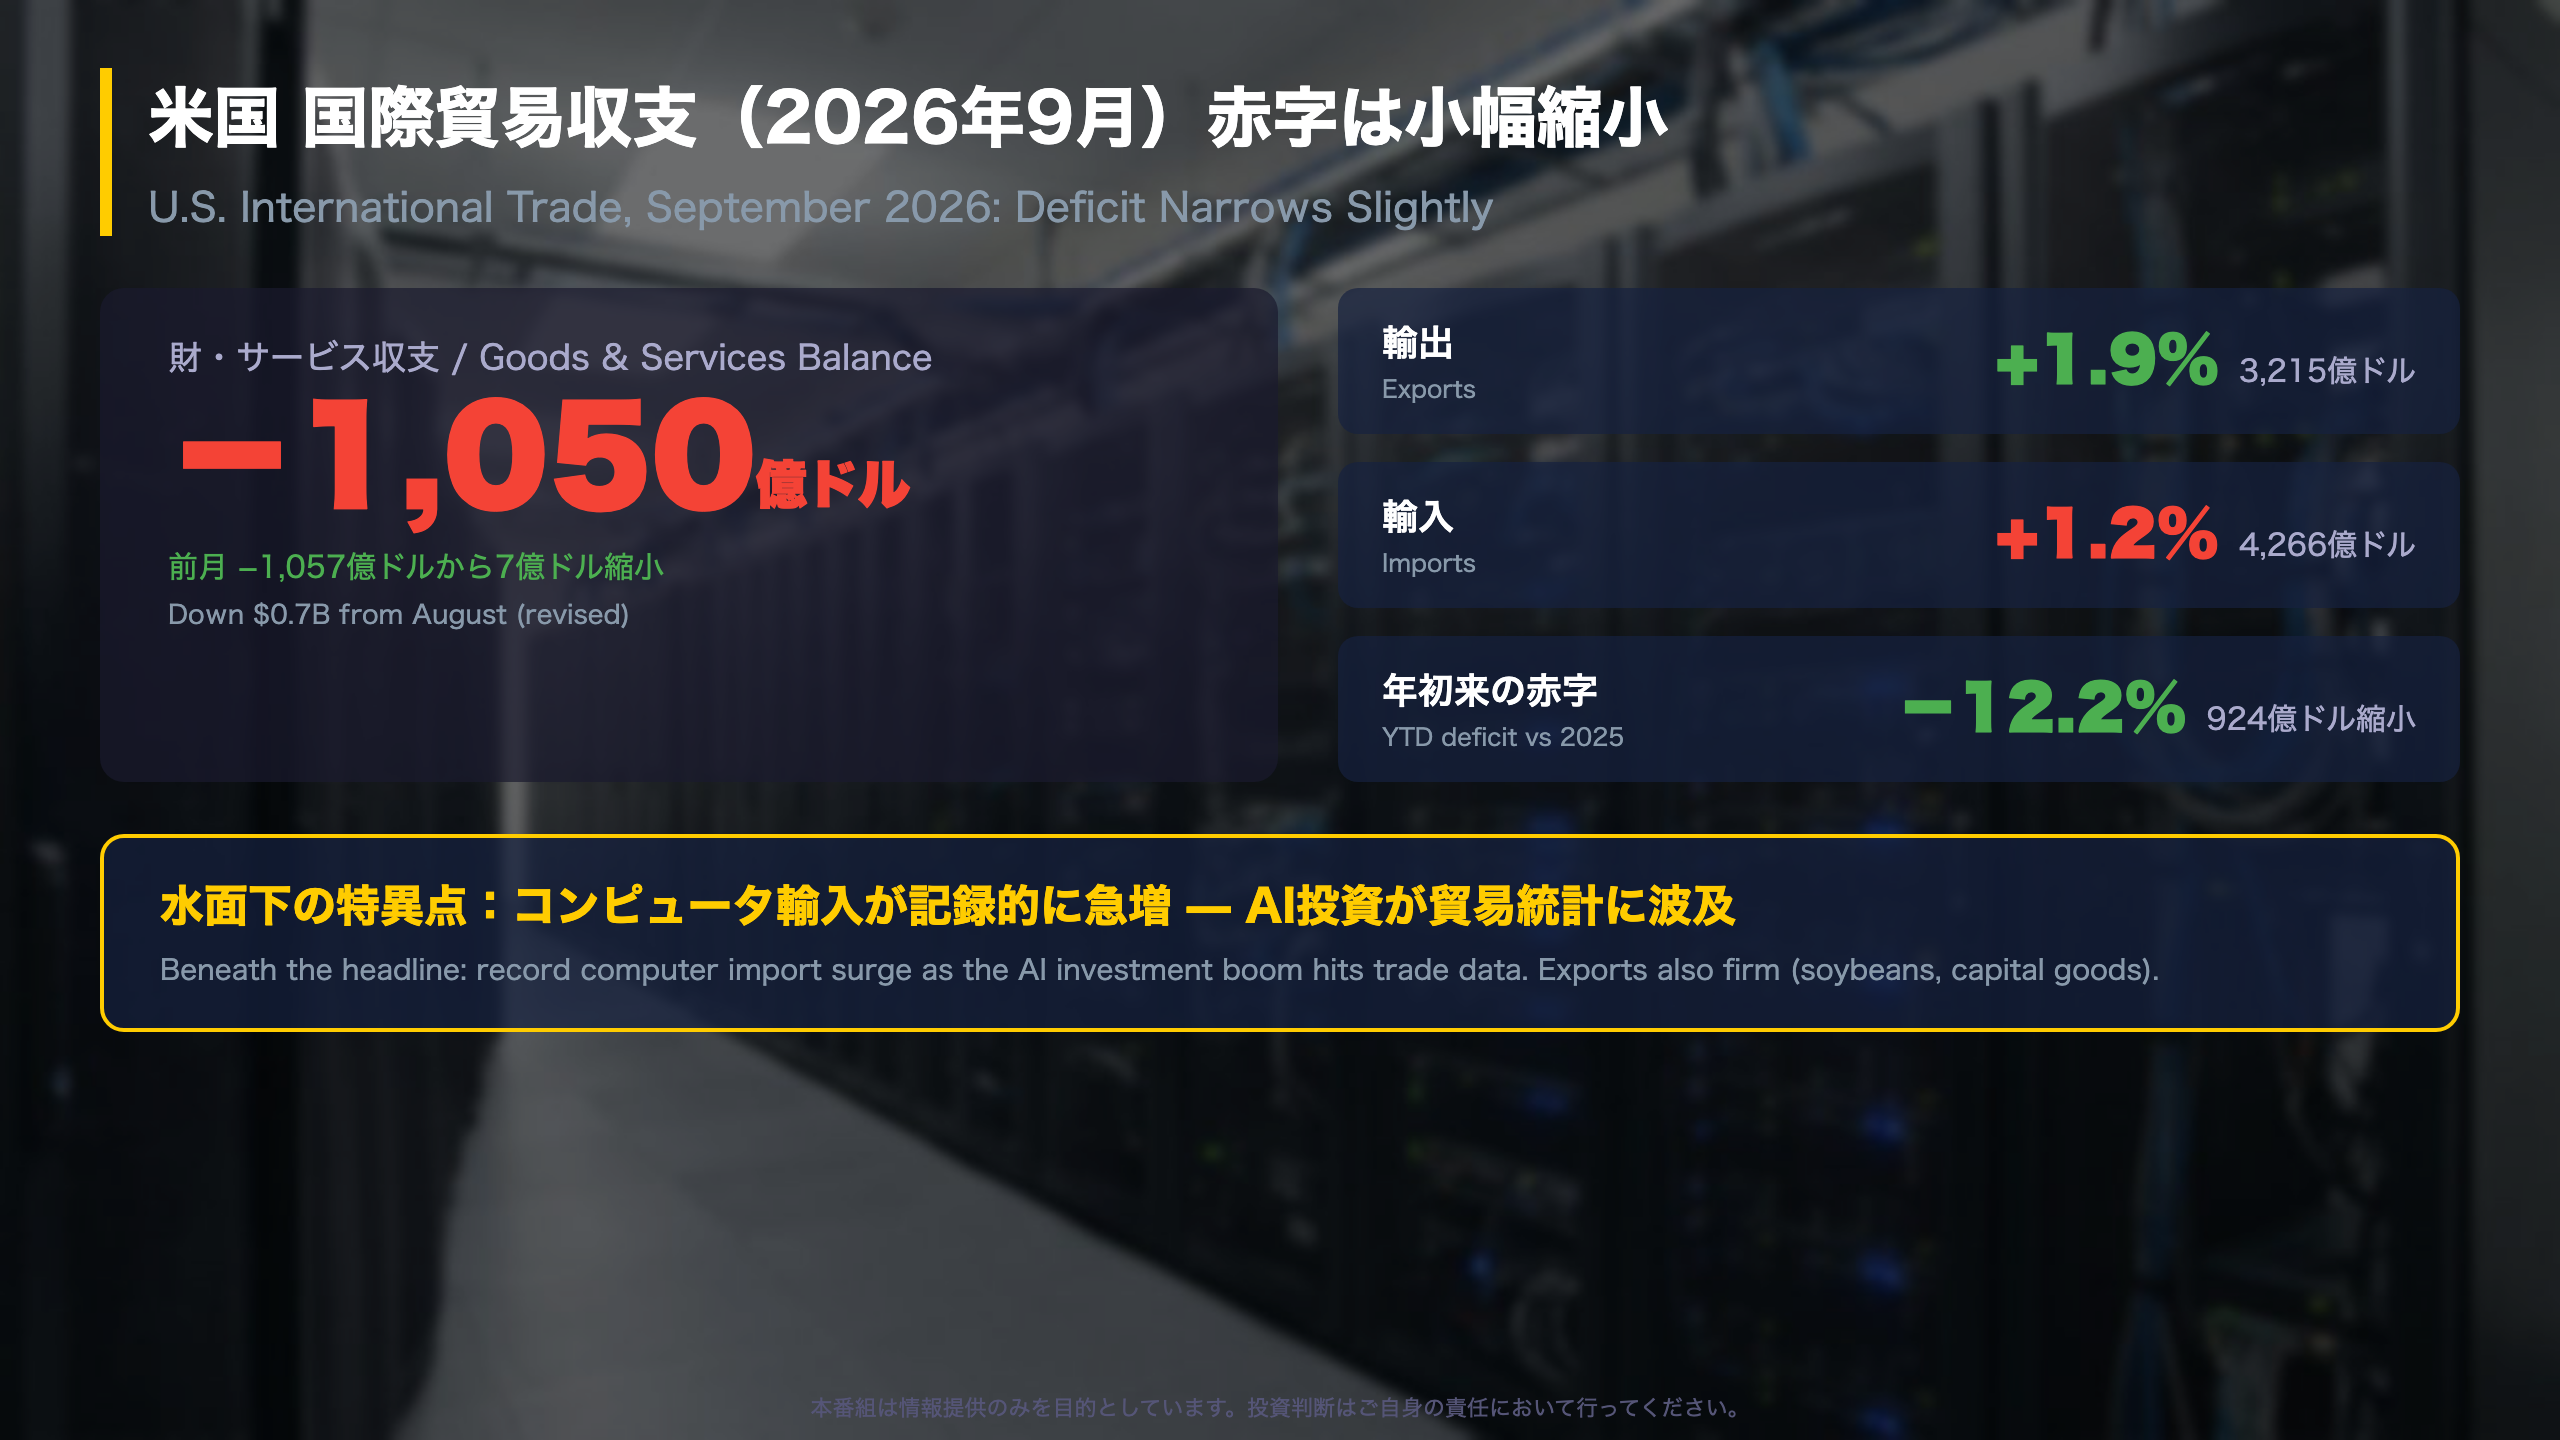
📊 The US goods & services deficit narrowed slightly to $105.0B in September.
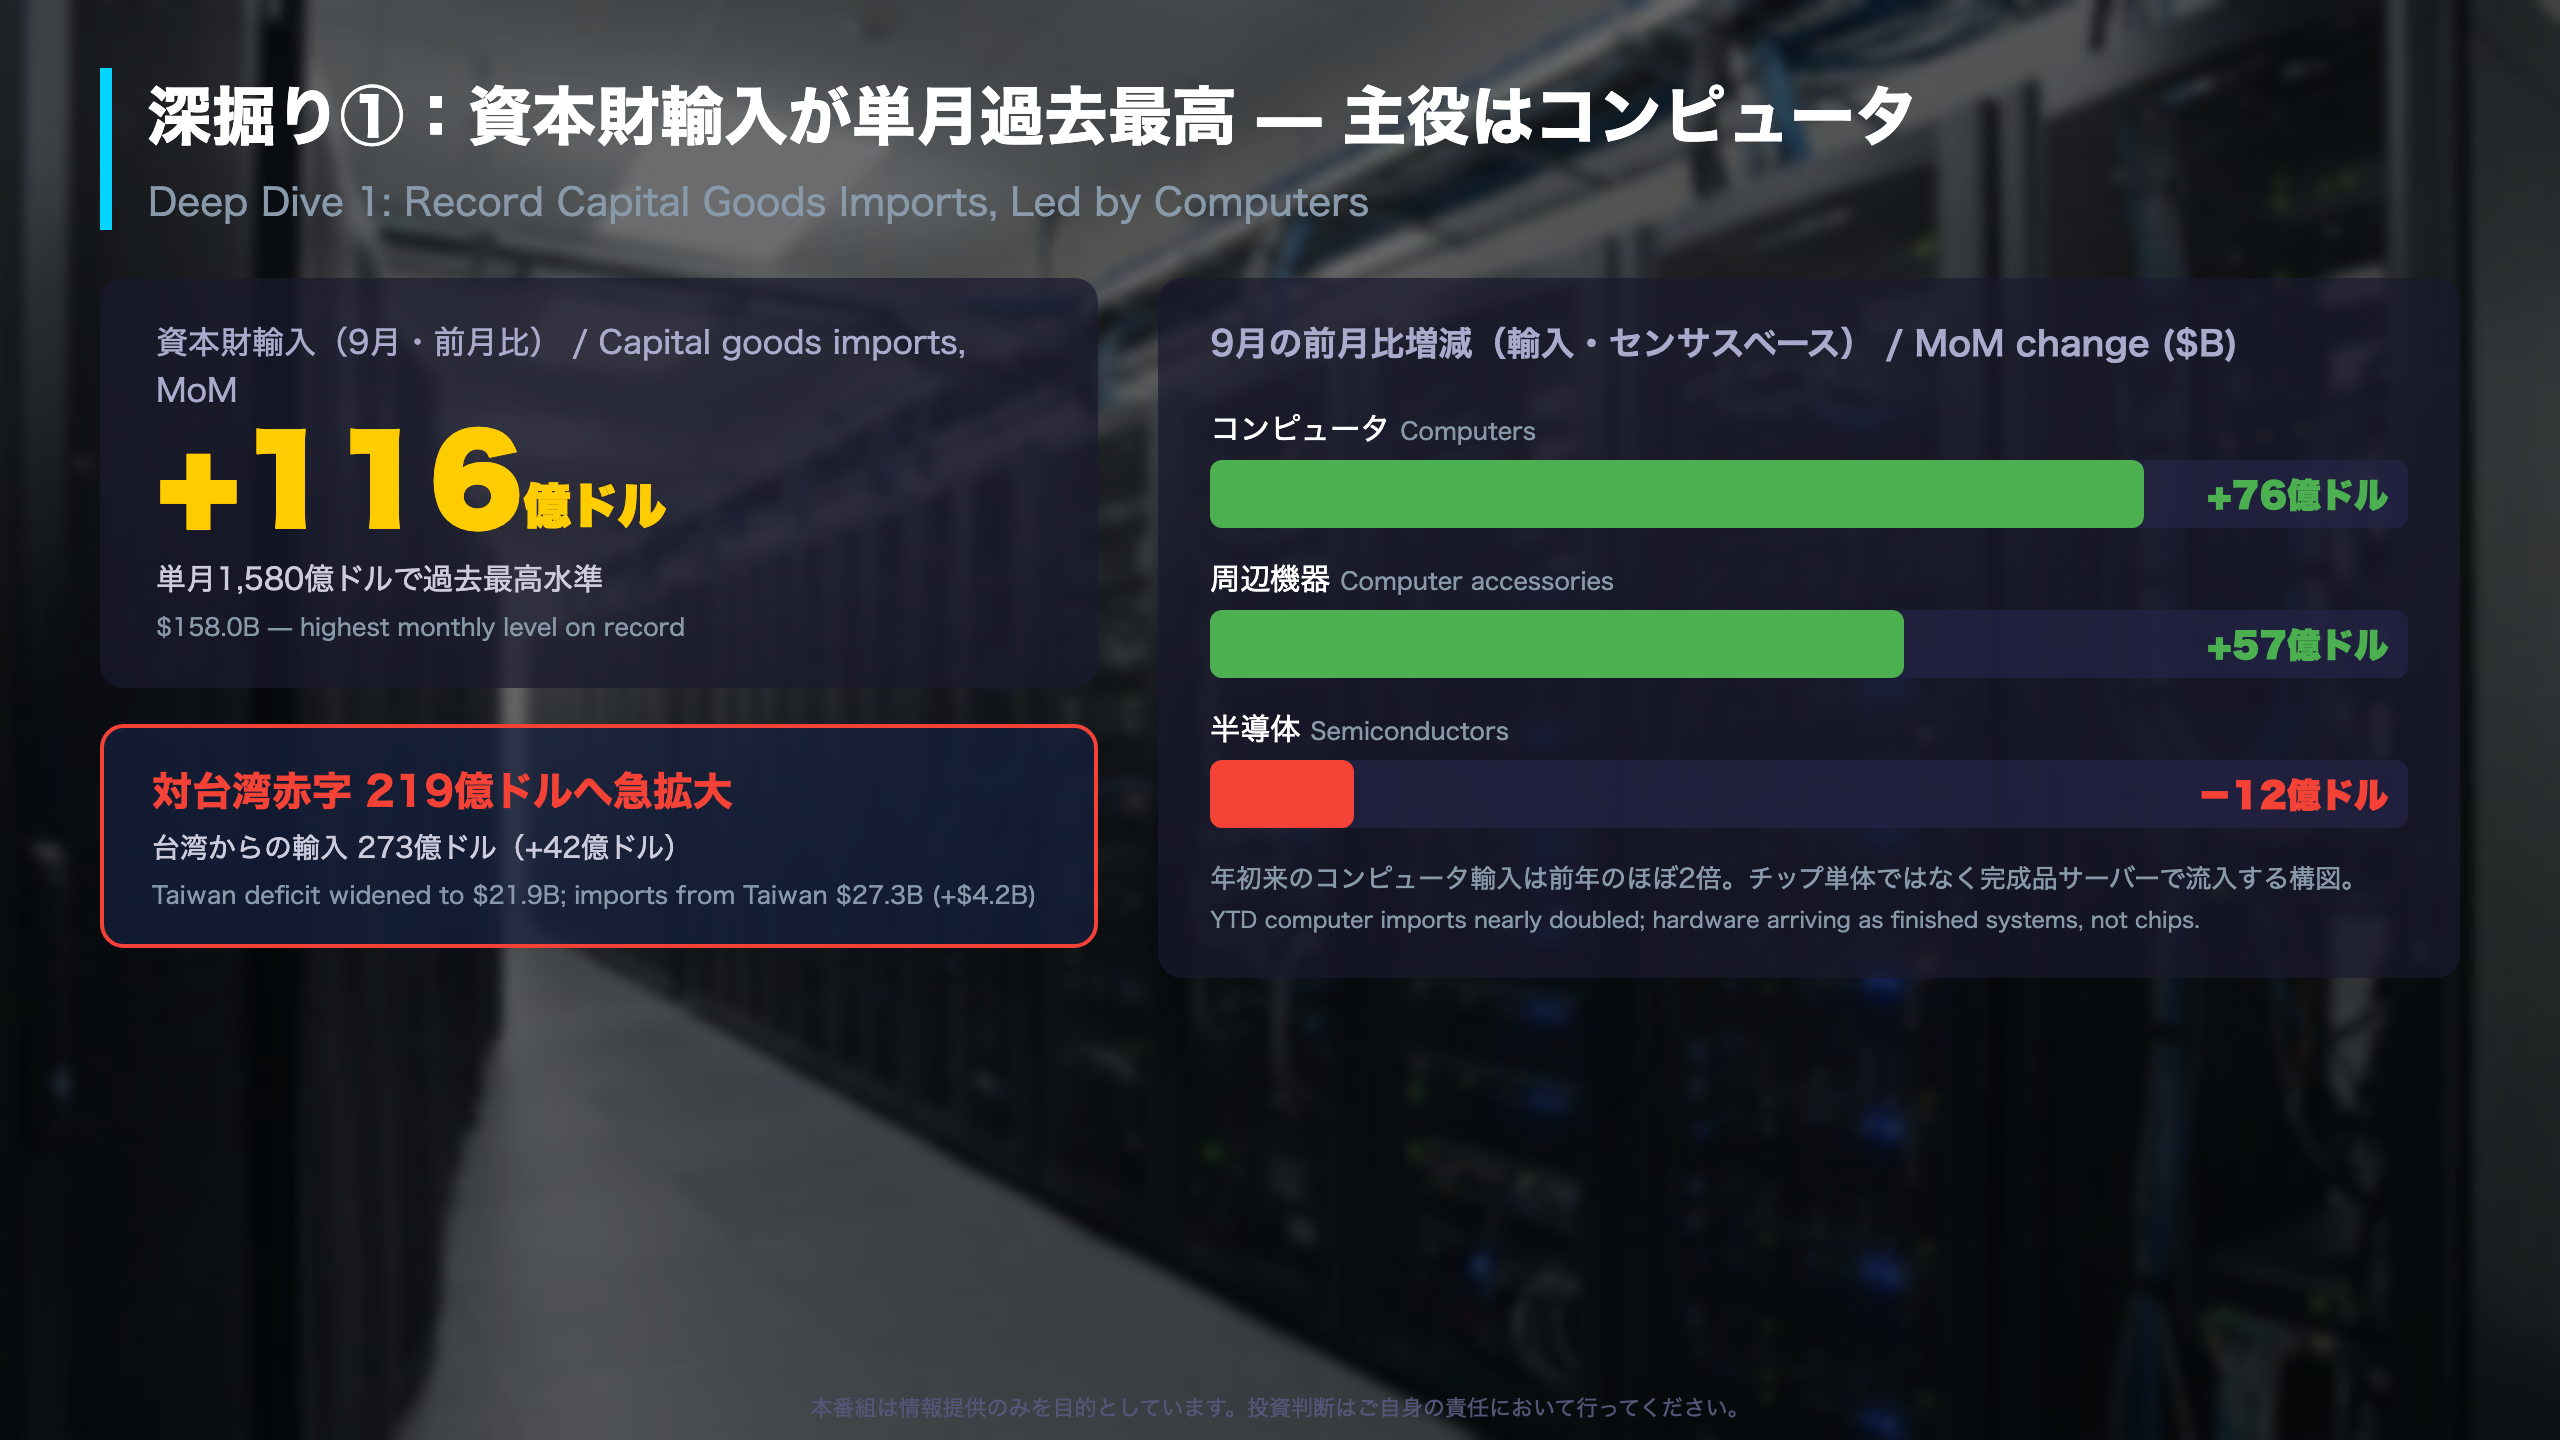
📈 Beneath the headline, capital goods imports surged $11.6B to a monthly record, driven almost entirely by computers and accessories. The advanced technology products deficit hit $84.4B for the month, and the gap with Taiwan widened sharply to $21.9B.
💡 Exports stayed firm too, led by soybeans and capital goods, with the year-to-date deficit down 12.2% from 2025.
⚠️ Consumer goods imports are falling, suggesting an investment-driven — not consumption-driven — import boom. Next release: December 8.
9月の米貿易収支:赤字1,050億ドルに小幅縮小、水面下でAI輸入が急増
What the FT-900 Is — and Why This One Matters
The FT-900 is the joint monthly trade release from the US Census Bureau and the Bureau of Economic Analysis (BEA), and it is the primary source for the net-exports component of US GDP. September’s goods and services deficit printed at $105.0 billion, down $0.7 billion from August’s revised $105.7 billion.
The real story is the six-month trend
The headline looks calm, but the monthly path does not: the deficit held near $52–54 billion from January through April 2026, then exploded to $75.8B in May, $92.8B in July, and roughly $105B in August–September. The deficit has nearly doubled in half a year, and the three-month moving average widened by $11.3B to $101.2B.
Paradoxically, the year-to-date deficit is down 12.2% versus 2025 — largely a base effect, since early 2025 was inflated by massive tariff front-running that pushed monthly deficits above $150B. Year to date, exports are up 11.6% while imports rose 6.2%, a favorable mix on its face.
Market relevance
For GDP trackers, a re-widening deficit is a drag on Q4 net exports. For FX, the composition matters more than the level: as later sections show, the import surge is concentrated in AI-related capital equipment, which maps to domestic investment rather than consumer demand. The next release (October data) lands December 8.
深掘り①:資本財輸入が単月過去最高、主役はコンピュータと台湾
Inside the Computer Import Explosion
On a Census basis, US capital goods imports rose $11.6 billion in September. The release itself spells out the drivers: “Computers increased $7.6 billion. Computer accessories increased $5.7 billion. Semiconductors decreased $1.2 billion.” Computers plus accessories added $13.3B — more than the entire category gain.
Scale of the boom (year-to-date imports)
- Computers: $148.7B → $296.7B (+99.5%)
- Computer accessories: $100.7B → $189.4B (+88.2%)
- Semiconductors: $54.8B → $104.7B (+91.1%)
The monthly dip in chips alongside record finished-system imports suggests AI hardware is increasingly landing as assembled servers rather than components — consistent with Taiwan’s role as the final assembly hub.
Taiwan and the ATP deficit
The bilateral deficit with Taiwan widened $3.6B to $21.9B in September, with imports from Taiwan at $27.3B for the month and $215.3B year to date, up roughly 60% from 2025. The Advanced Technology Products (ATP) deficit — a Census aggregation of roughly 500 leading-edge product codes — hit $84.4B for the month, the largest in the published series, with information & communications alone accounting for an $82.8B gap.
For investors, this is the trade-data confirmation of the AI capex cycle visible in hyperscaler earnings: the spending is real, it is accelerating, and its supply chain runs overwhelmingly through East Asia.
深掘り②:輸出は2桁の伸びを維持、大豆が急回復
Exports: Tech and Farm Goods Carry the Load
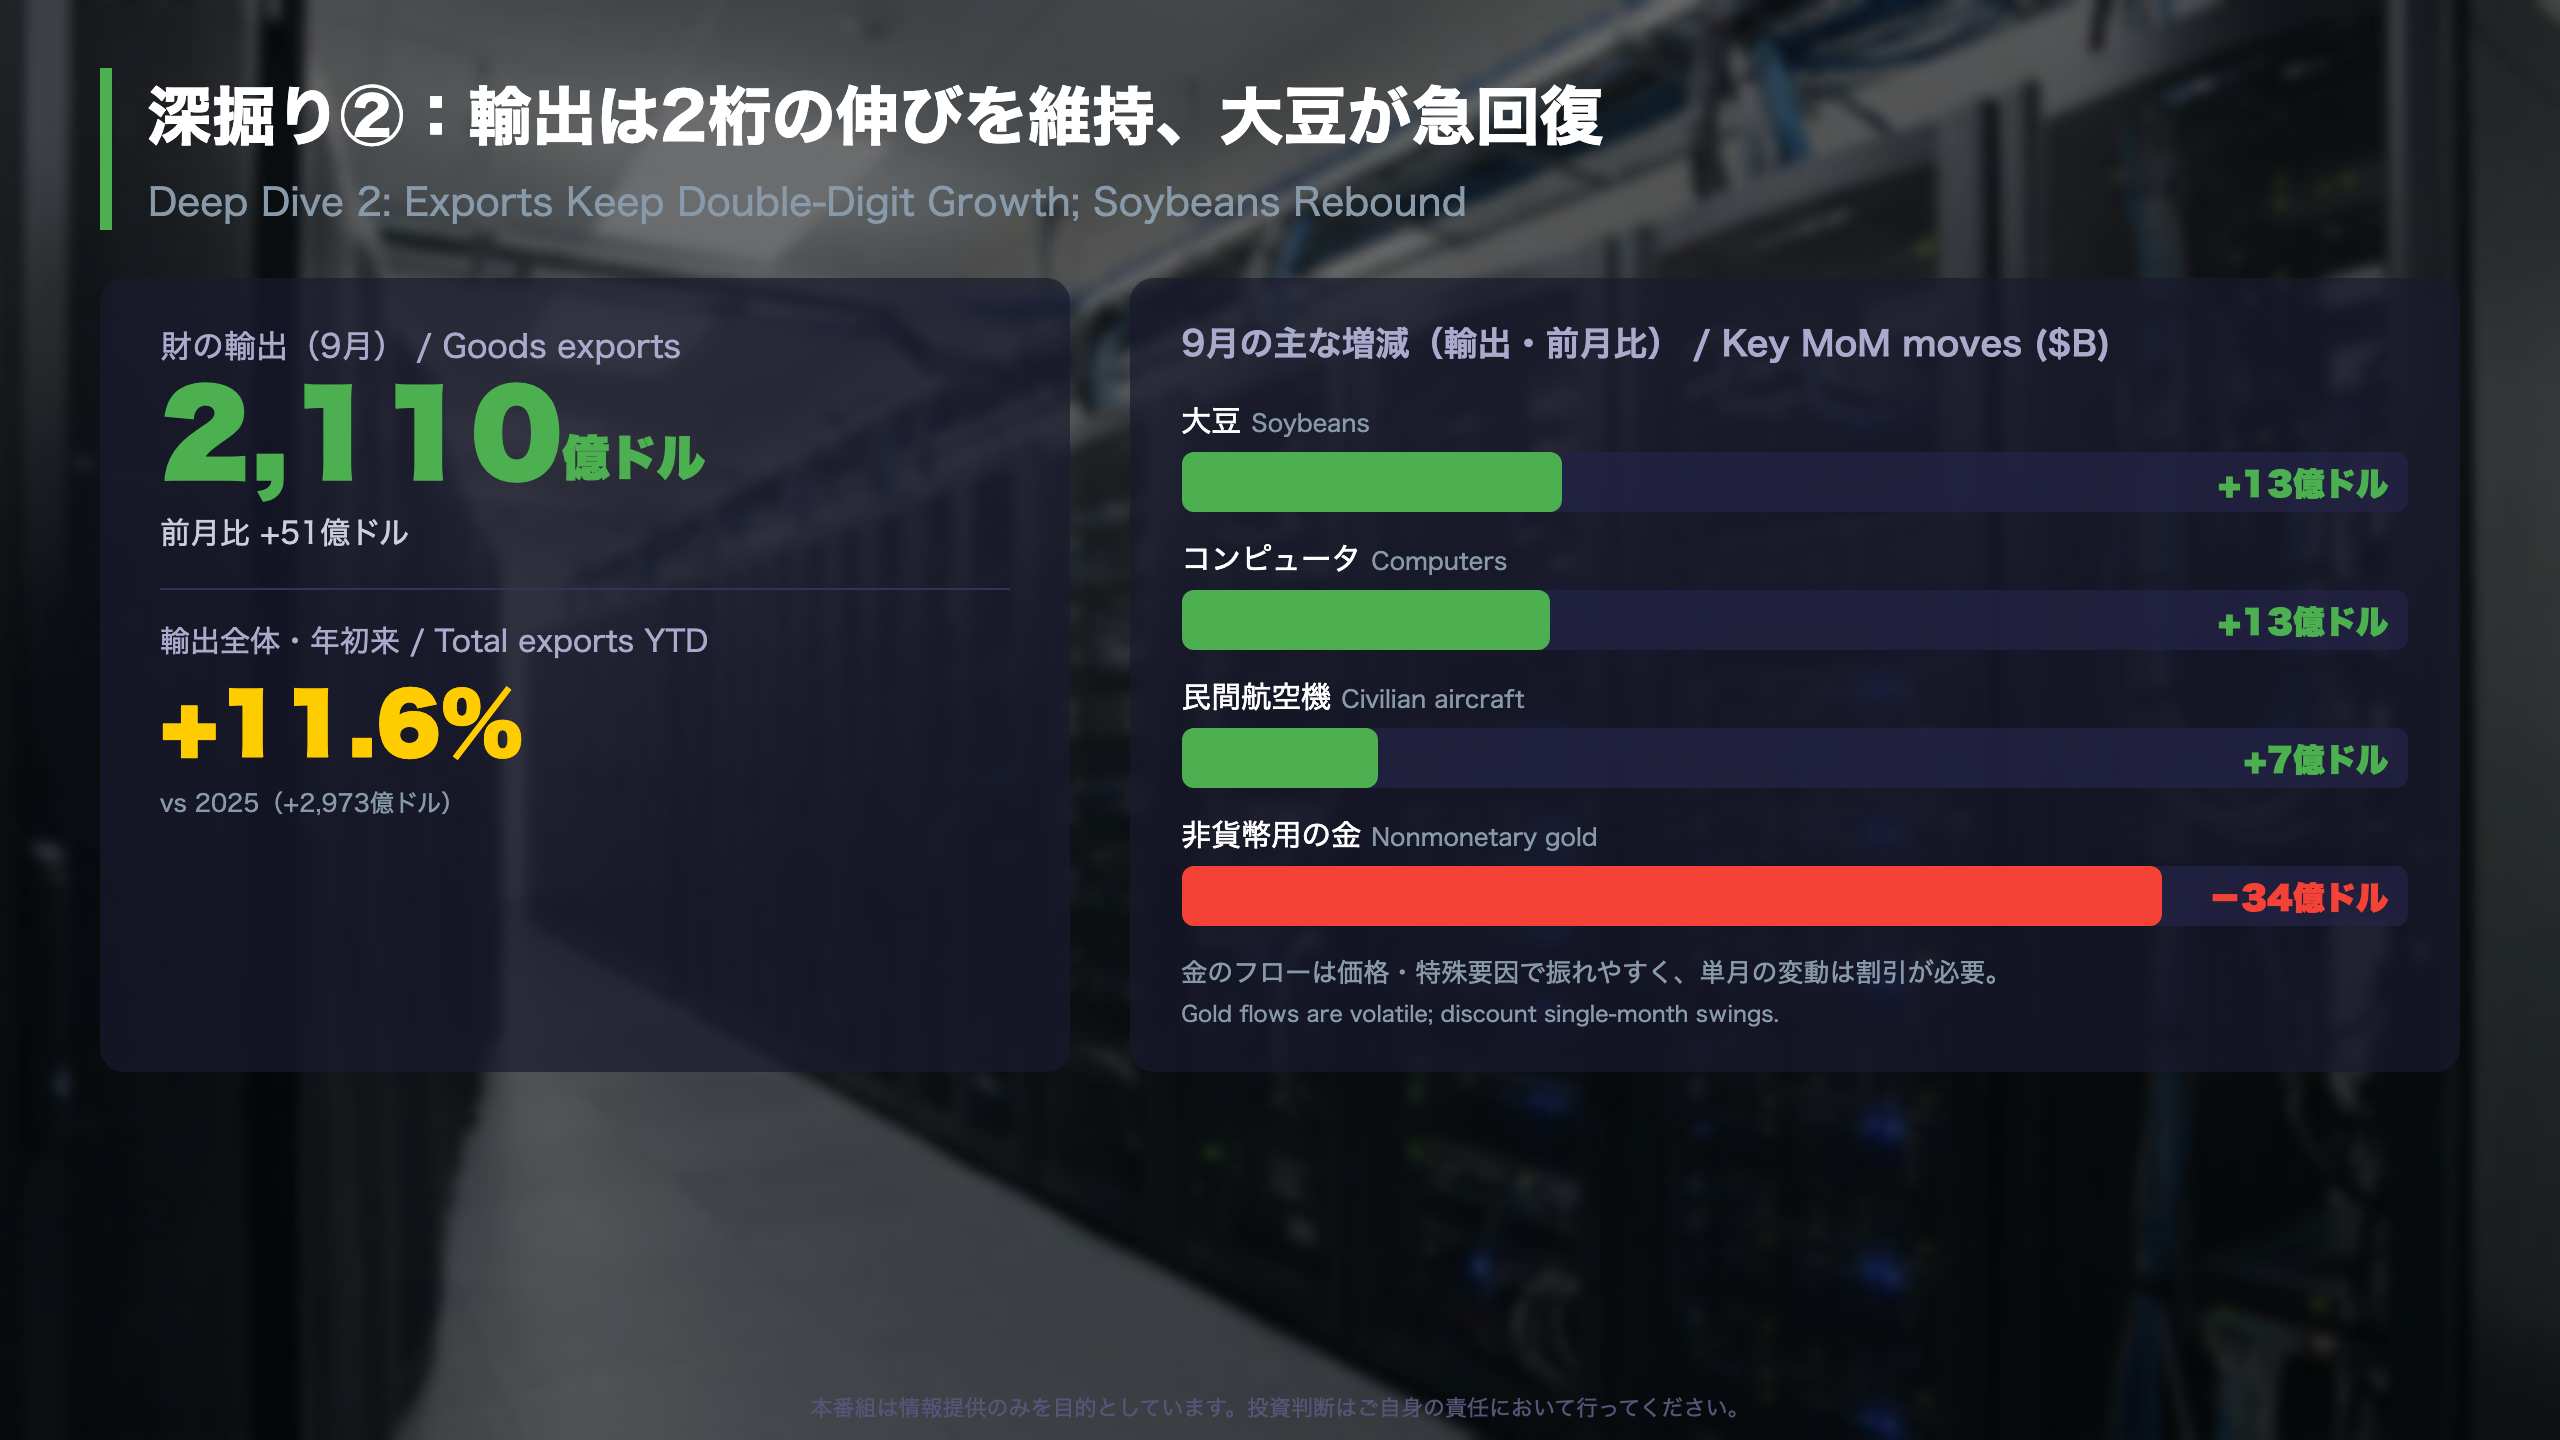
US goods exports rose $5.1B to $211.0B in September. Capital goods led with a $3.8B gain — and notably, the same AI-related categories driving imports are also lifting exports: computers +$1.3B, accessories +$0.8B, civilian aircraft +$0.7B. Year to date, computer exports are up 49% ($33.4B → $49.8B) and semiconductor exports up 28% ($50.6B → $64.8B). The US is both buyer and seller in the AI supply chain.
The soybean rebound
Soybean exports jumped $1.3B on the month to $2.6B, and are up 45.7% year to date ($14.6B → $21.3B). Corn and tree nuts also gained, supporting the broader agricultural complex — a point of political as well as economic significance given the role of China and other buyers in US farm trade.
The soft spots
- Nonmonetary gold exports fell $3.4B in September, but are up a striking $40.4B year to date — a flow driven by prices and vaulting demand, not underlying competitiveness. Analysts typically strip gold out when reading the trend.
- Passenger car exports are down $6.2B YTD (−15%), and pharmaceutical exports down $7.4B.
The takeaway for global investors: US export strength is real but narrow, concentrated in tech, energy, and agriculture, while traditional manufacturing categories lag.
質疑:この赤字は「消費の過熱」か「投資の反映」か
Testing the ‘Investment-Driven Deficit’ Hypothesis
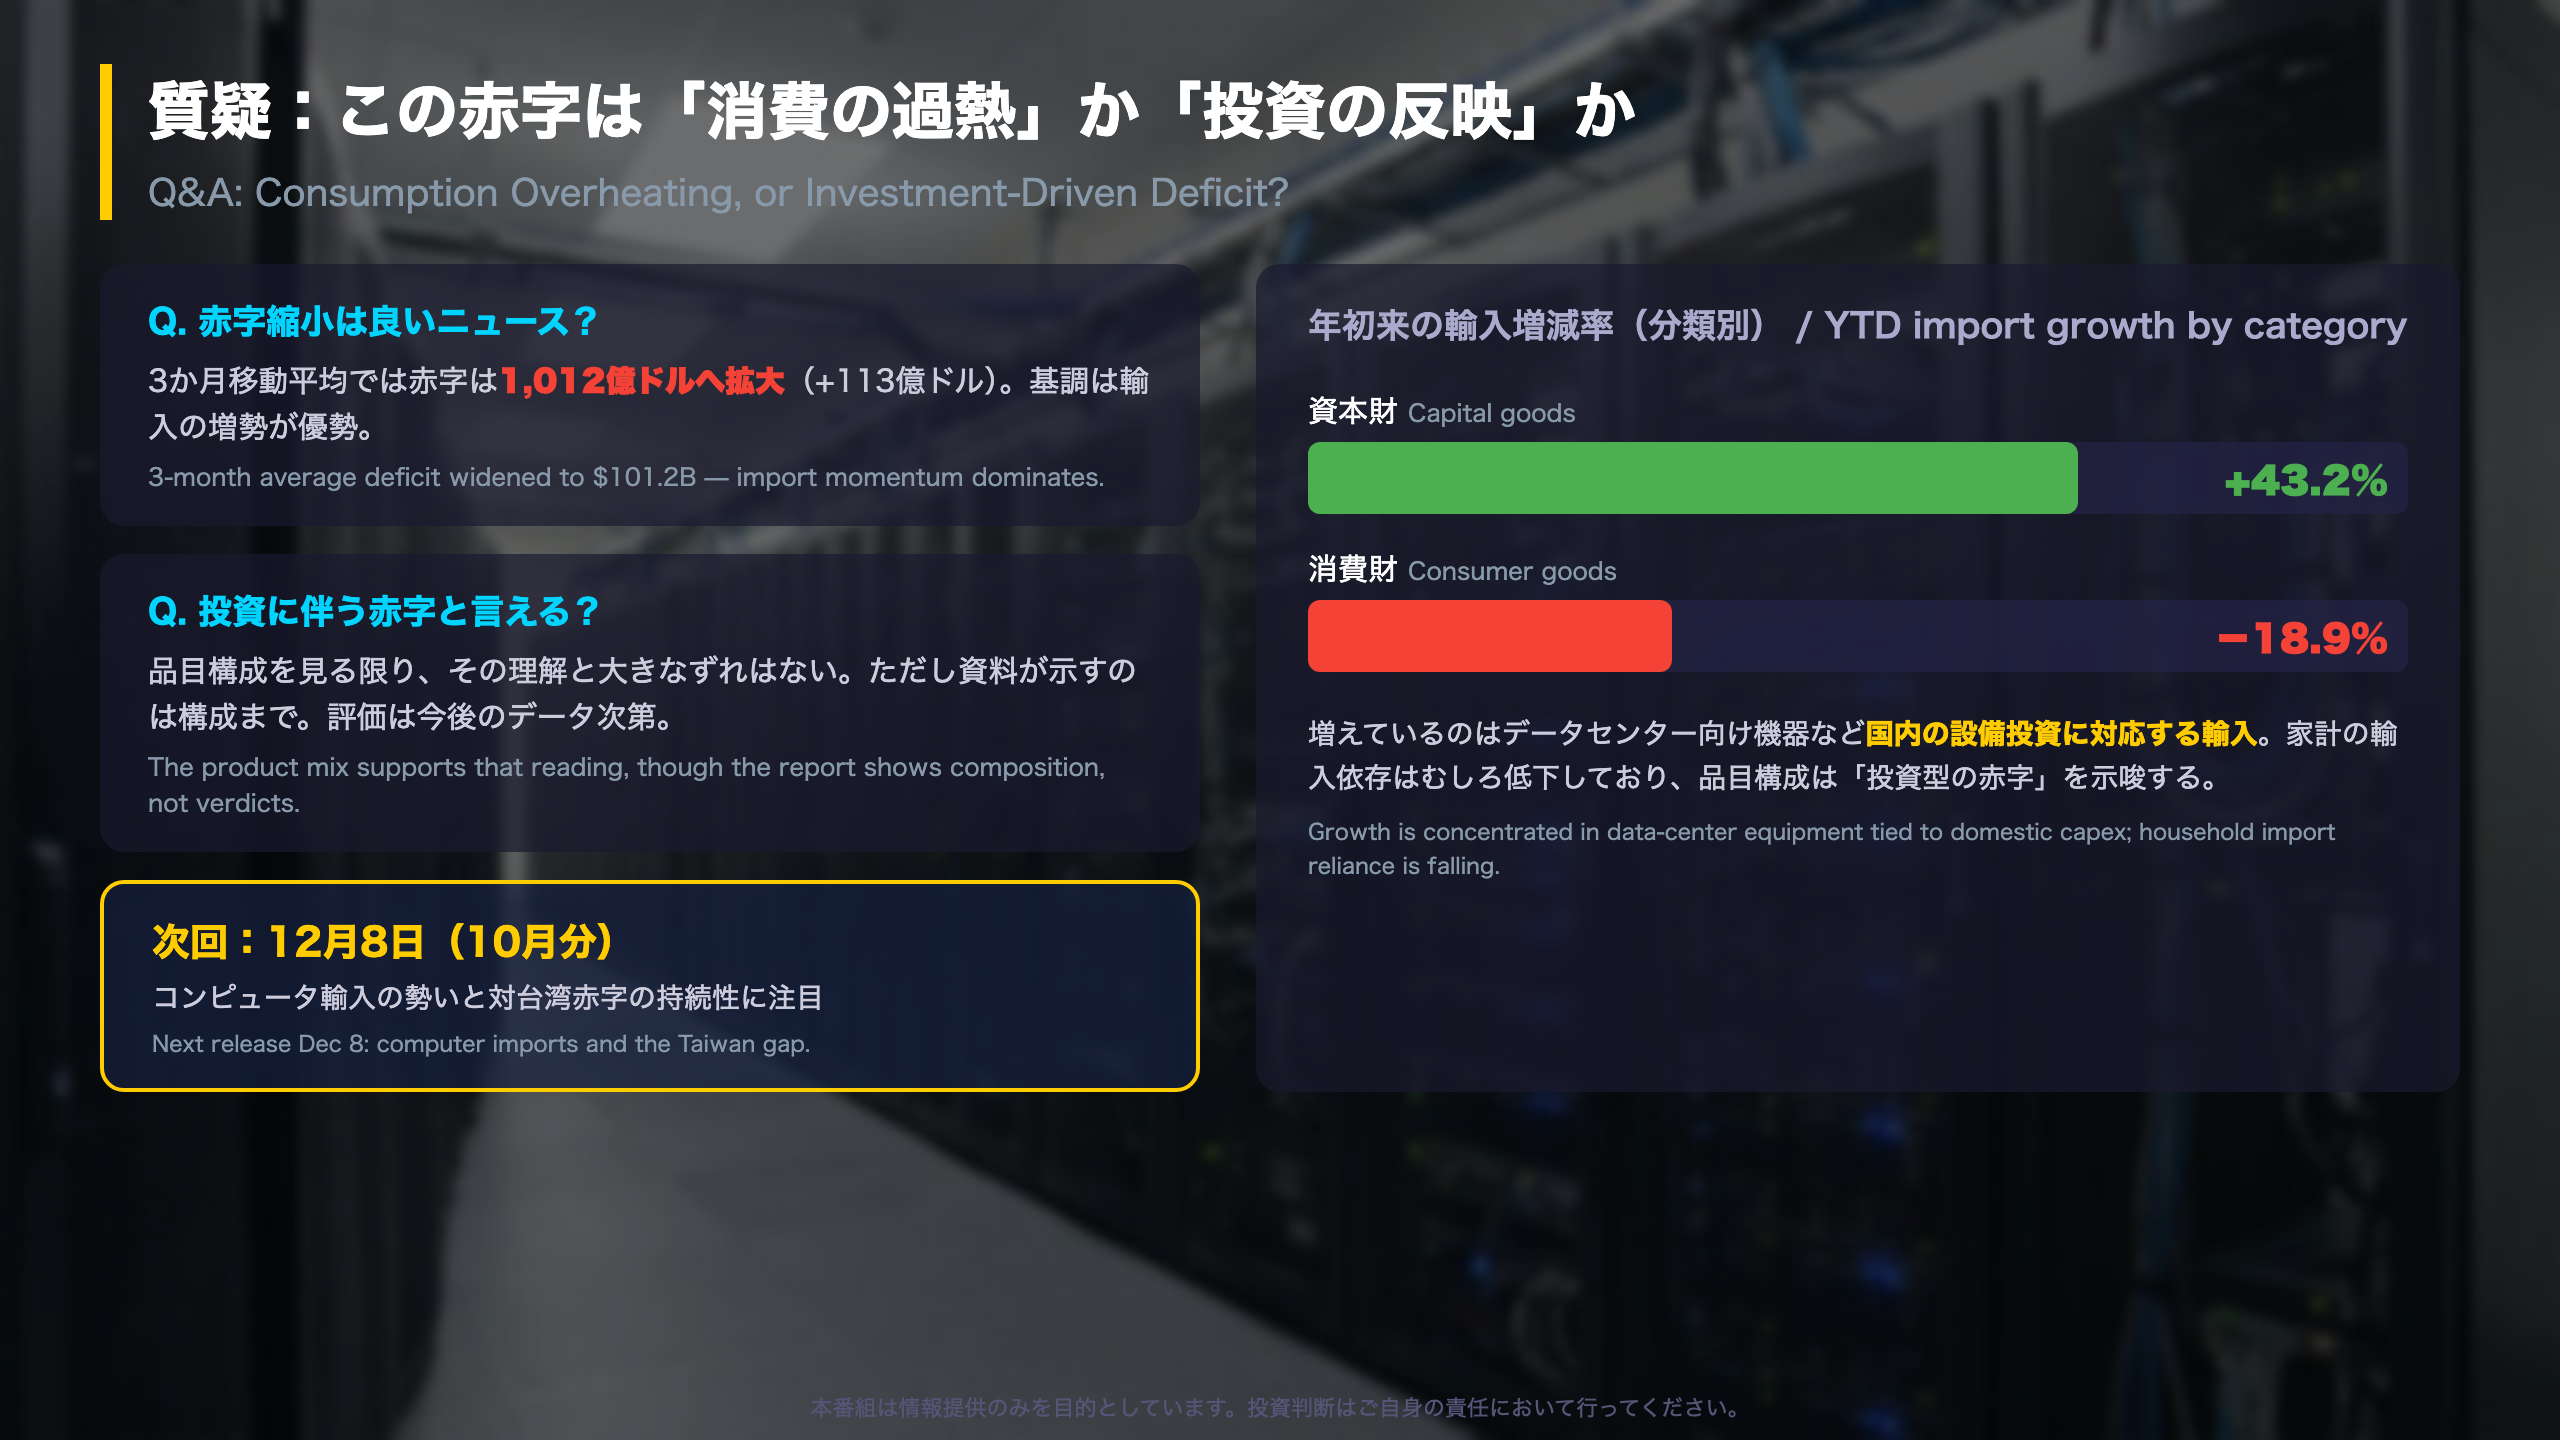
Despite the monthly improvement, the three-month moving average deficit widened $11.3B to $101.2B — $36.5B larger than a year earlier. The trend is a widening gap. The composition, however, is unusual.
Import mix shift (year-to-date, Census basis)
- Capital goods: $820.3B → $1,174.4B (+43.2%)
- Consumer goods: $630.2B → $511.2B (−18.9%)
- Industrial supplies: $555.7B → $495.3B (−10.9%)
- Automotive: $322.9B → $310.9B (−3.7%)
Capital goods are the only major category growing. Consumer goods imports fell by double digits, led by a $102.7B collapse in pharmaceutical imports (imports from Ireland shrank from $120.1B to $44.0B YTD) as 2025’s tariff front-running unwound. In US national accounts terms, a capital-equipment import boom subtracts from net exports but mirrors strength in business fixed investment — a very different macro signal from a consumption-led import surge.
Real versus nominal
The real (chained 2017-dollar) goods deficit widened 3.0% in September, faster than the 2.2% nominal increase. The import wave is a volume story, not a price illusion.
What to watch next
The October FT-900 arrives December 8. Key checks: whether monthly computer imports (now $41.7B) hold their pace, whether the Taiwan ($21.9B) and EU ($14.2B) deficits keep widening, and how BEA translates this surge into Q4 GDP’s net-export and equipment-investment lines.
Disclaimer: This article is for informational purposes only. All investment decisions are made solely at your own risk.