📺 Watch the Full Video Analysis
This article was automatically generated by the NFC Market Live AI analysis system. (Updated: 2026-06-26 23:10 JST)
📄 Primary Source
University of Michigan
http://www.sca.isr.umich.edu/
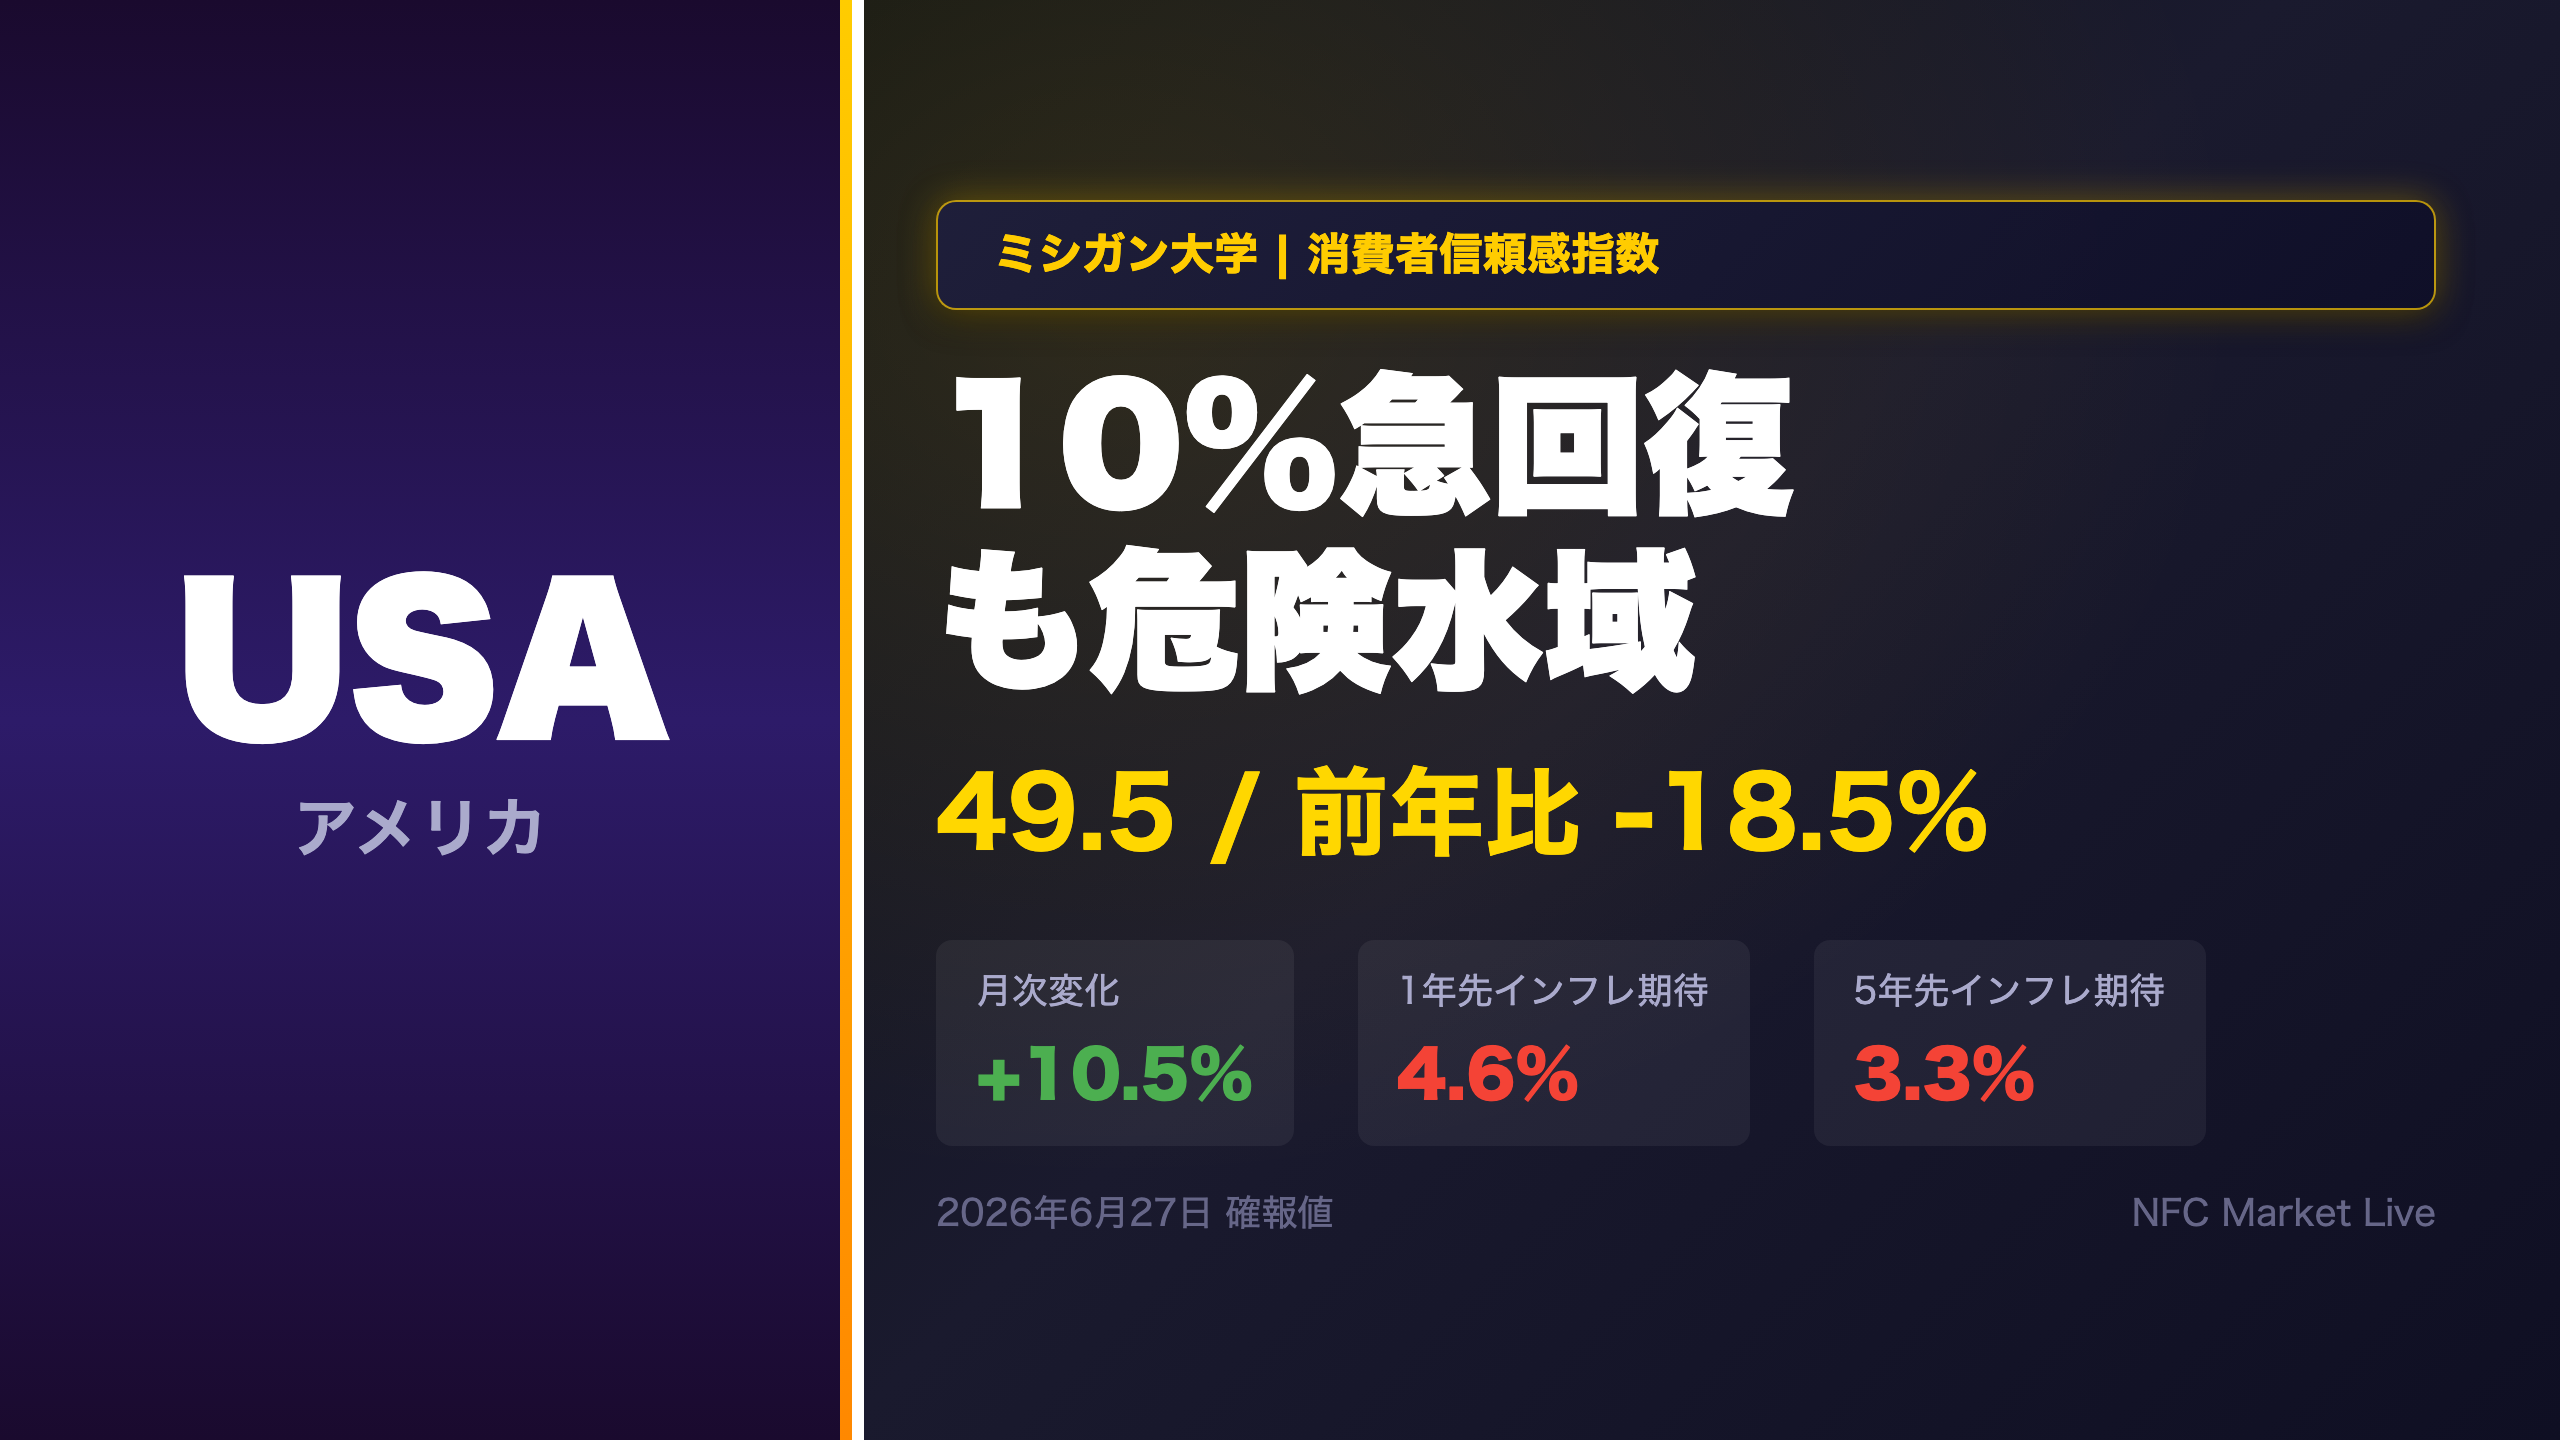
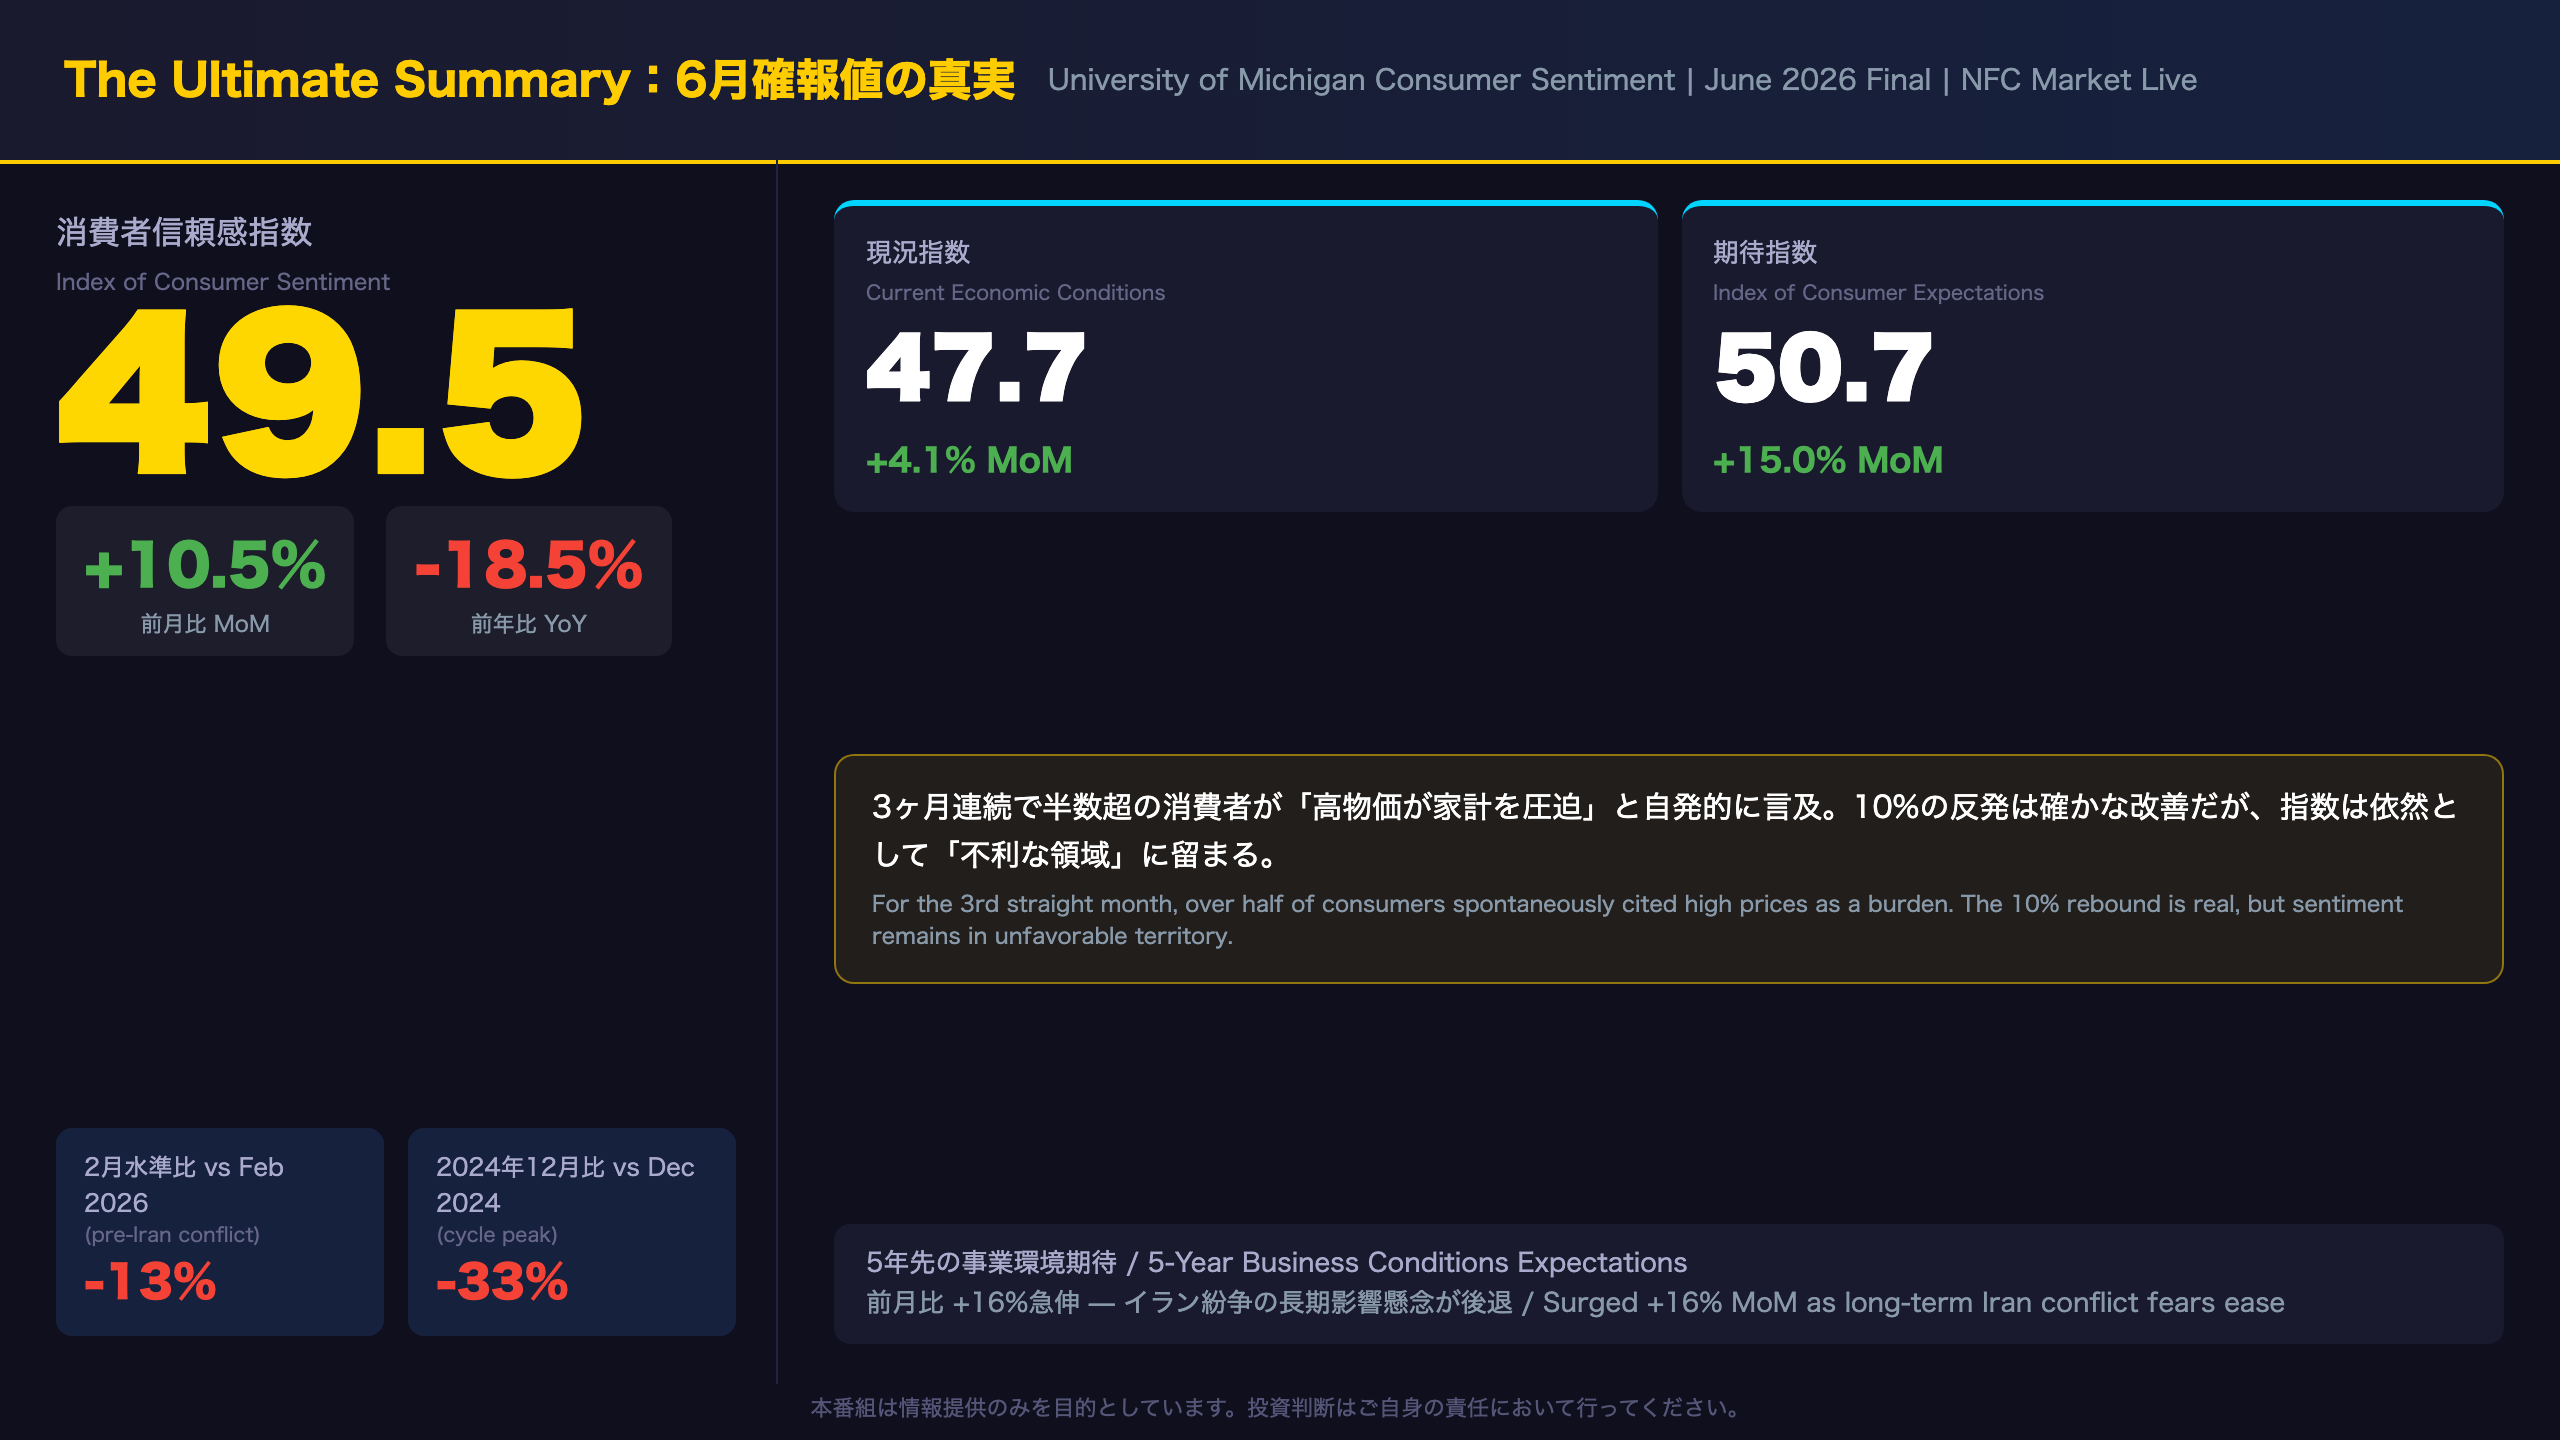
June 2026 Final: University of Michigan Consumer Sentiment rose 10.5% MoM to 49.5, driven by easing gas prices and fading Iran conflict fears. However, sentiment remains 18.5% below year-ago levels and 13% below pre-conflict February readings. Year-ahead inflation expectations stay elevated at 4.6%, while long-run expectations dropped sharply from 3.9% to 3.3%. A complex signal for the Fed — we break down what it means for rate policy and markets.
The Ultimate Summary:10%急回復の真実
June 2026 Final: Reading Between the Lines of a 10% Rebound
What Is the Michigan Consumer Sentiment Index?
The University of Michigan’s Surveys of Consumers is one of the longest-running consumer confidence surveys in the United States, dating back to the 1940s. It measures consumer attitudes on personal finances, business conditions, and buying conditions. The Index of Consumer Sentiment (ICS) is a composite of five questions, split into two sub-indices: the Index of Current Economic Conditions (ICC) and the Index of Consumer Expectations (ICE). For international investors, it is broadly comparable to the Conference Board Consumer Confidence Index, though the Michigan survey places greater emphasis on inflation expectations.
The Headline: A Genuine but Incomplete Recovery
The June 2026 final reading of 49.5 represents a 10.5% month-over-month gain from May’s 44.8 — the largest single-month percentage increase in recent memory. The driver, according to survey director Joanne Hsu, was a moderation in gasoline prices combined with easing fears about the long-term economic consequences of the Iran conflict. Notably, the improvement was broad-based across income, wealth, and political affiliation groups, which reduces the risk that the rebound is a statistical artifact of compositional shifts.
Why “Unfavorable Territory” Still Applies
Despite the rebound, three structural concerns remain:
- Year-over-year decline of 18.5%: The index stood at 60.7 in June 2025. The current reading of 49.5 is nearly 20% below that level, reflecting a sustained deterioration in consumer psychology.
- Still 13% below pre-conflict levels: February 2026’s reading of 56.6 — recorded before the Iran conflict began — serves as a natural baseline. The gap of 7.1 points suggests the conflict’s psychological impact has not been fully reversed.
- Persistent cost-of-living concerns: For the third consecutive month, more than half of consumers spontaneously (i.e., without being prompted) mentioned that high prices are weighing on their personal finances. This is a qualitative signal that carries significant weight — it reflects the lived experience of inflation rather than a survey-induced response.
Historical Context for International Investors
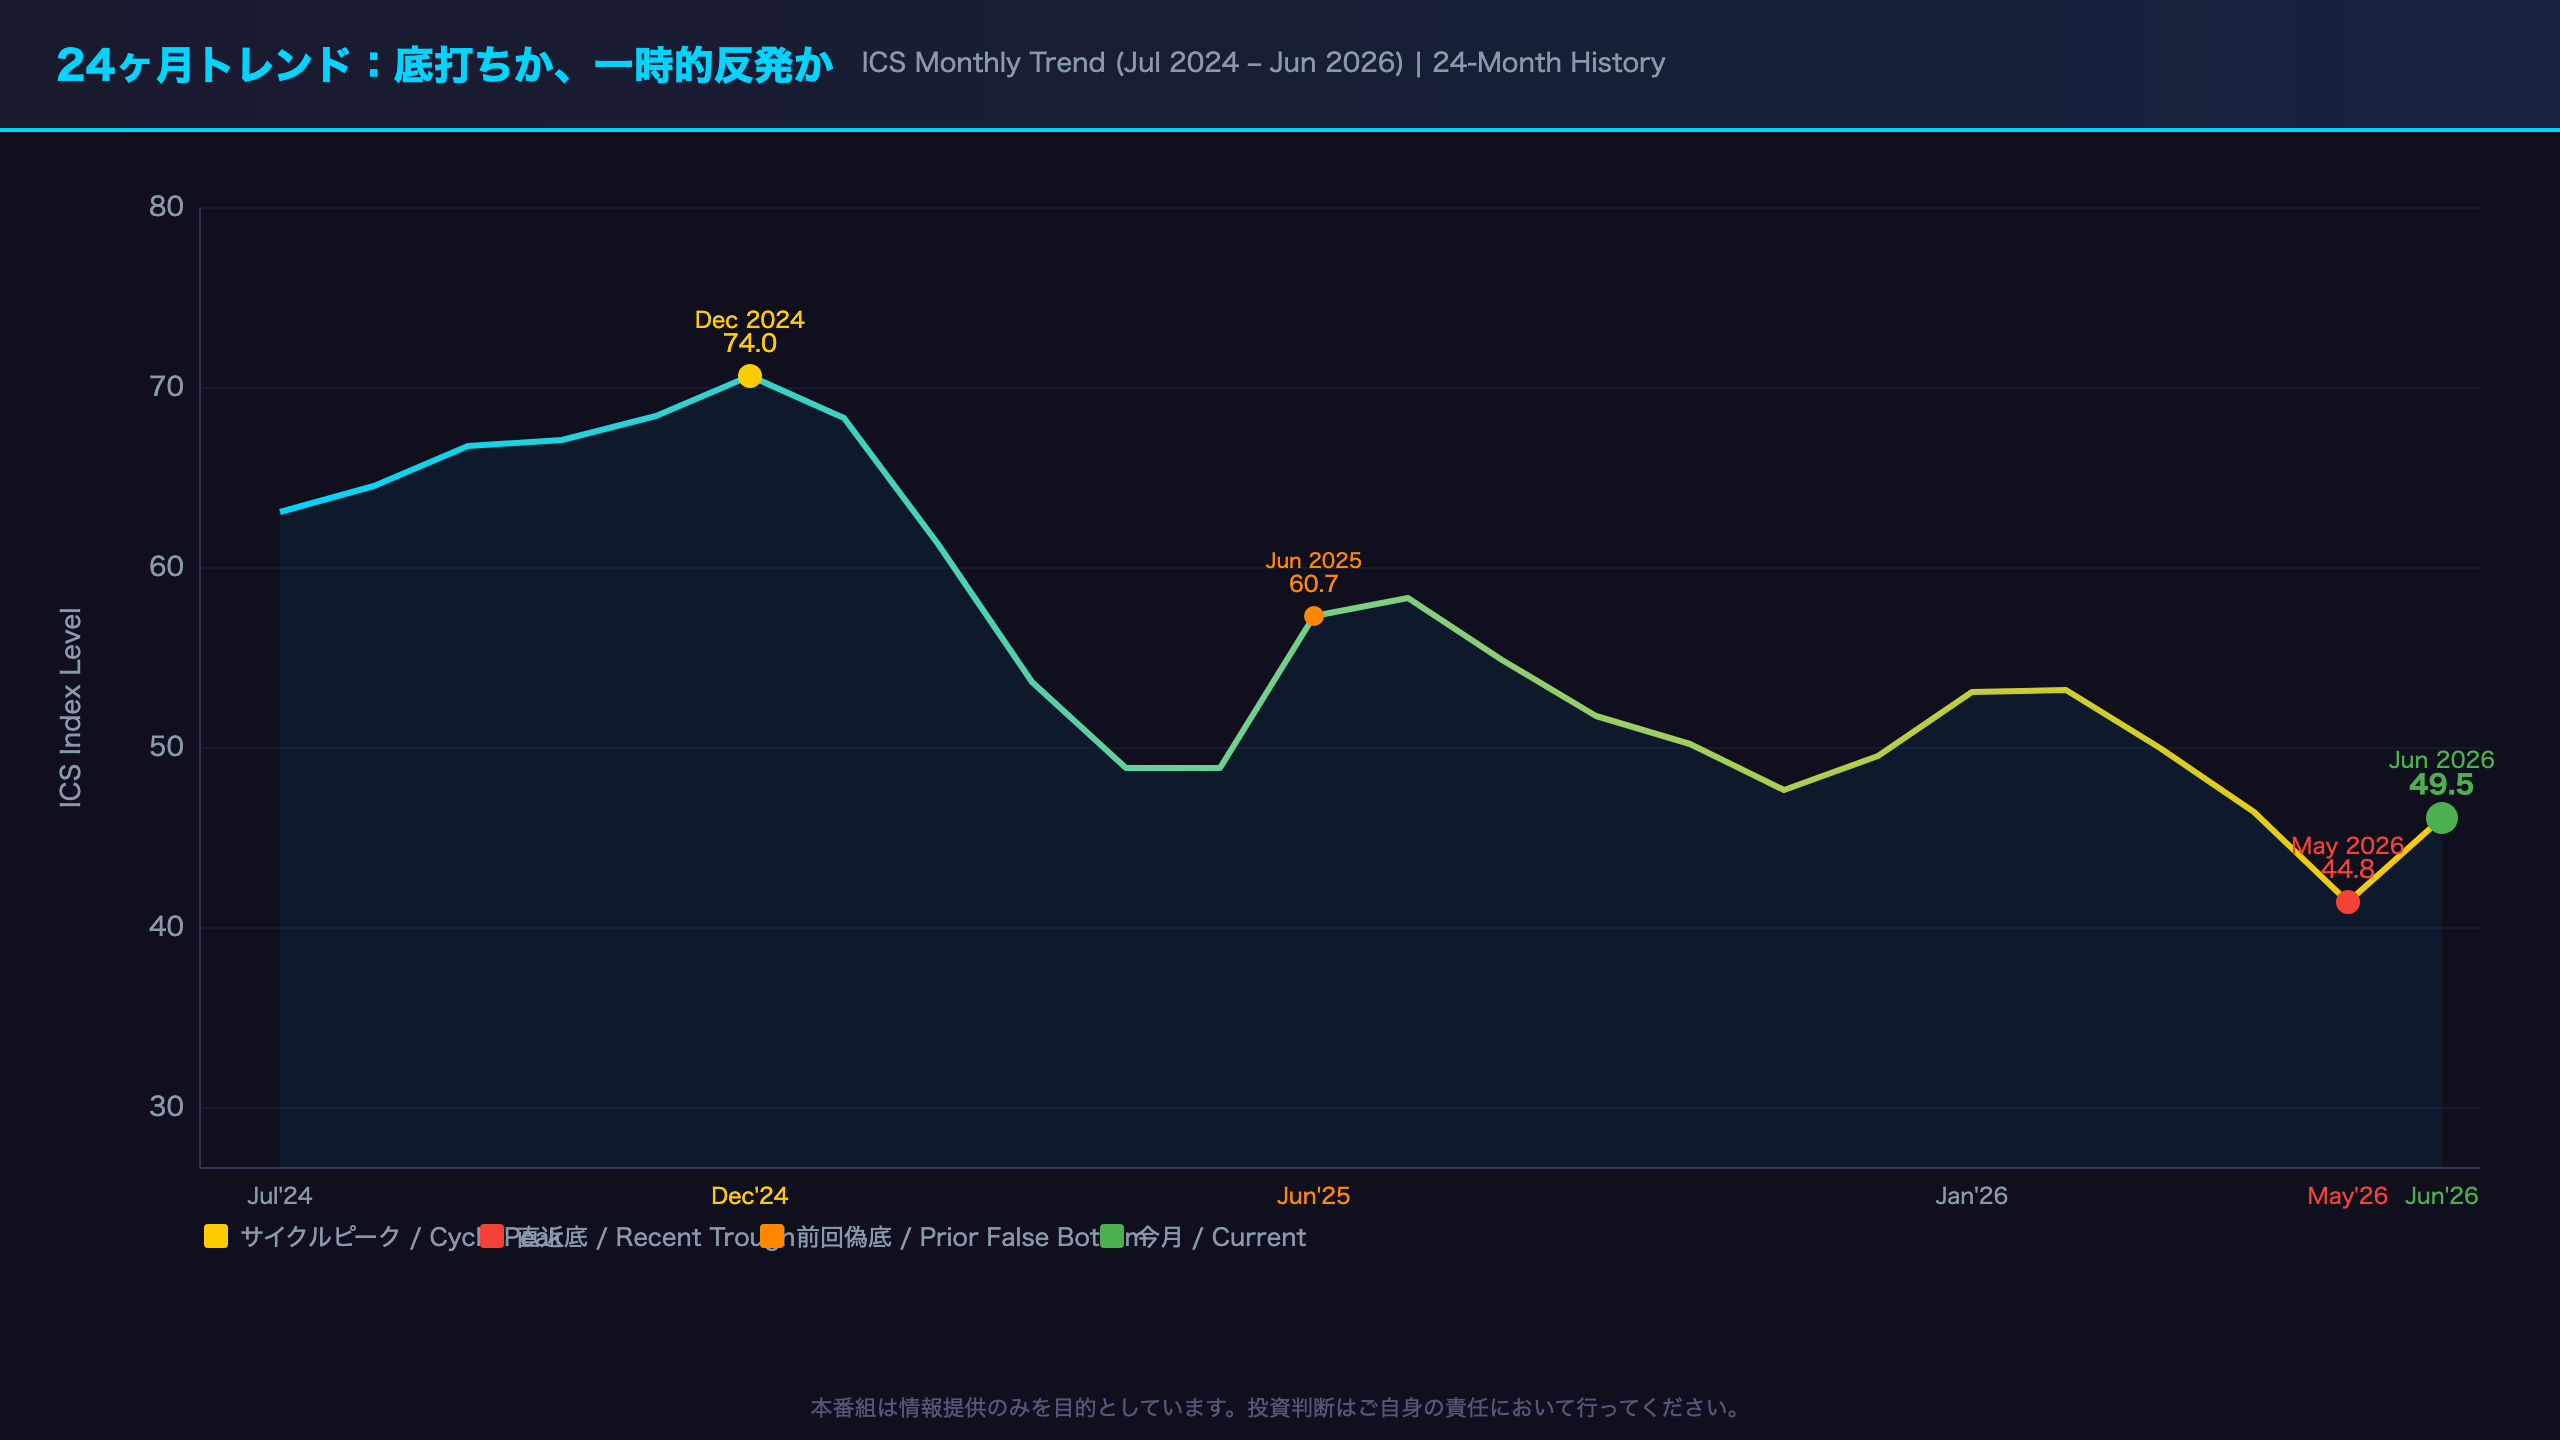
The ICS peaked at 74.0 in December 2024 and has been in a sustained downtrend since. The current reading of 49.5 is well below the 2024 average of approximately 70, and only marginally above the cycle low of 44.8 set in May 2026. For context, readings below 50 have historically been associated with periods of elevated recession risk, though the relationship is not deterministic.
24ヶ月トレンド:底打ちか、一時的反発か
24-Month Trend Analysis: Can We Trust the Bottom?
Three Phases of the Trend
The 24-month ICS history breaks cleanly into three phases:
Phase 1 (Jul–Dec 2024): The Ascent
The index climbed from 66.4 to a cycle high of 74.0 in December 2024, reflecting growing optimism about a soft landing for the US economy.
Phase 2 (Jan 2025–May 2026): The Sustained Decline
From 71.7 in January 2025 to a cycle low of 44.8 in May 2026 — a decline of approximately 38%. The Iran conflict, which began around February 2025, appears to have been a key inflection point, though the deterioration had already begun in January 2025.
Phase 3 (Jun 2026): The Rebound
A 10.5% bounce to 49.5. The durability of this rebound is the central question.
The “False Bottom” Precedent
A strikingly similar pattern occurred in June 2025. After the index bottomed at 52.2 in April–May 2025, it surged to 60.7 in June 2025 — a 16% rebound. However, the recovery proved short-lived: the index peaked at 61.7 in July 2025 and then resumed its decline, eventually reaching the May 2026 low of 44.8. Investors should be aware that the current rebound could follow a similar trajectory.
The ICC vs. ICE Divergence
A notable feature of this month’s data is the asymmetric recovery between the two sub-indices:
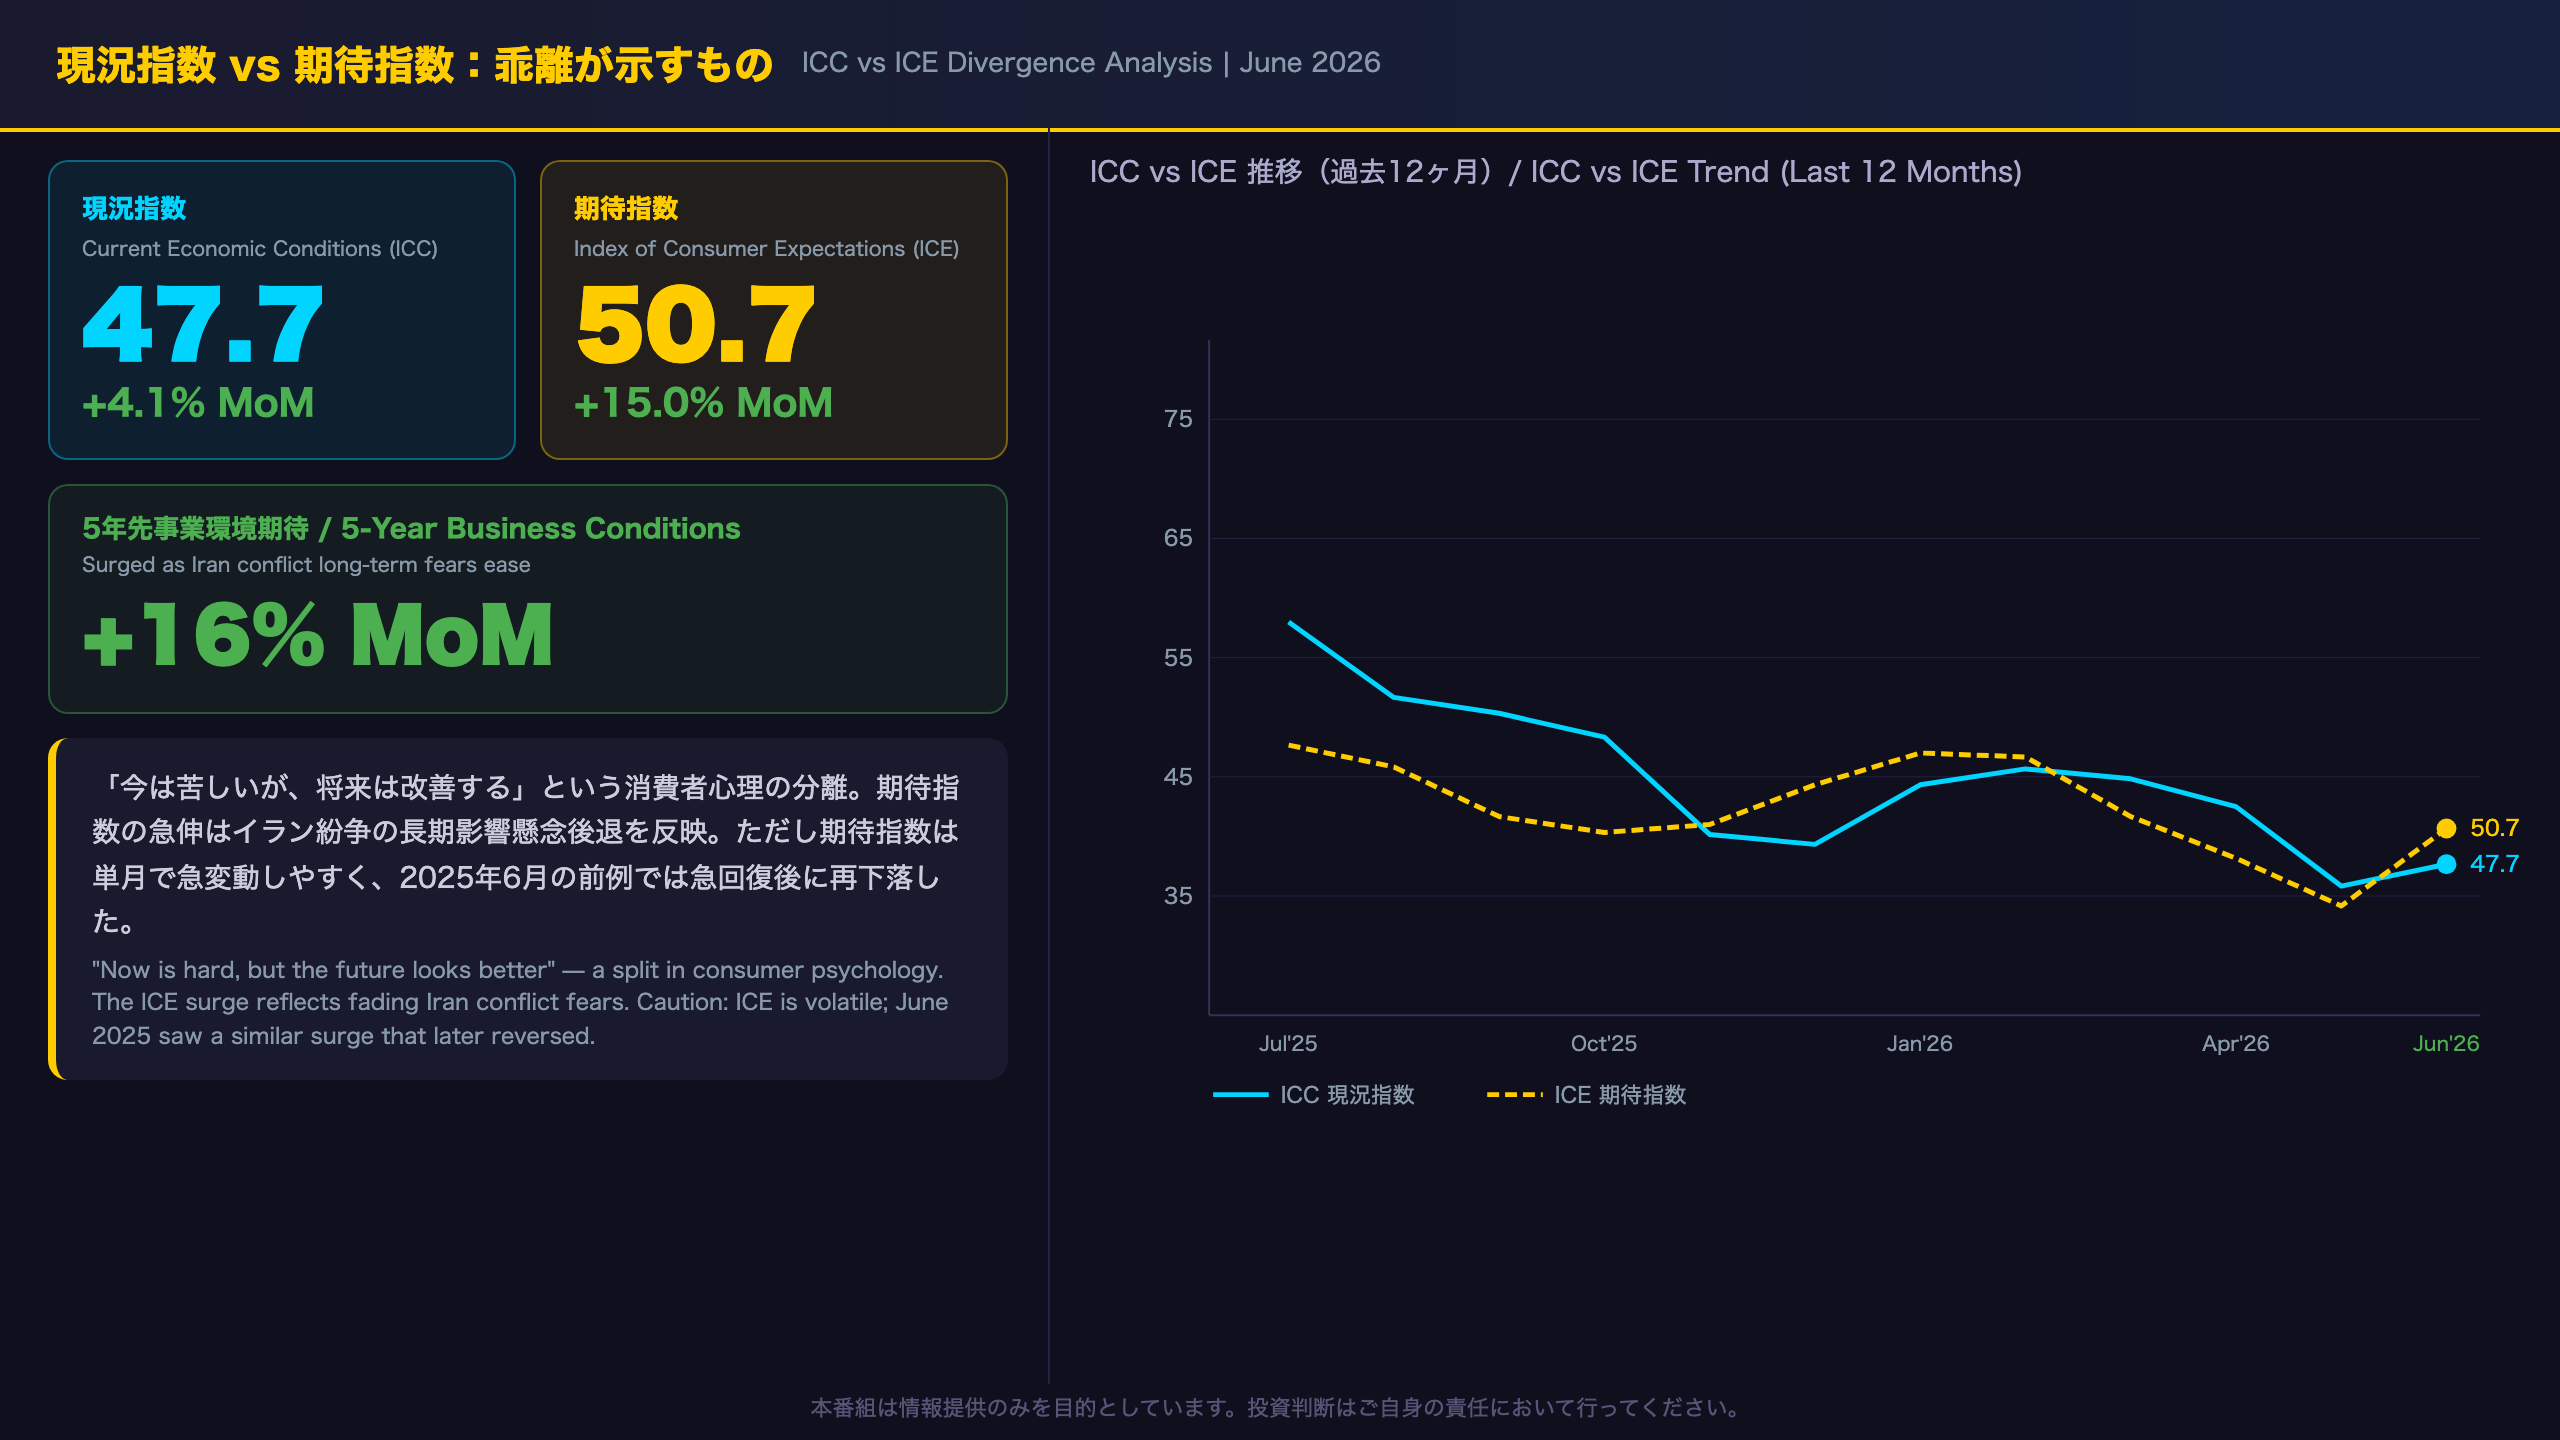
– Current Economic Conditions (ICC): +4.1% MoM — a modest improvement in how consumers view their present situation
– Consumer Expectations (ICE): +15.0% MoM — a much larger improvement in forward-looking sentiment
This divergence suggests consumers believe current conditions remain difficult but expect improvement ahead. The ICE’s larger swing is consistent with the easing of Iran conflict fears, which are inherently forward-looking. However, the ICE has historically been more volatile and prone to reversal than the ICC.
What to Watch Next
The preliminary July 2026 reading is scheduled for release on Friday, July 17, 2026 at 10am ET. Key variables to monitor: gasoline price trends, Iran conflict developments, and any changes in labor market conditions that could shift the current economic conditions sub-index.
現況指数 vs 期待指数:乖離が示すもの
Current Conditions vs. Expectations: Anatomy of the Divergence
The Asymmetric Recovery
The most structurally interesting feature of the June 2026 data is the stark difference in recovery magnitude between the two sub-indices:
| Sub-Index | May 2026 | Jun 2026 | MoM Change |
|---|---|---|---|
| Current Economic Conditions (ICC) | 45.8 | 47.7 | +4.1% |
| Consumer Expectations (ICE) | 44.1 | 50.7 | +15.0% |
The ICC measures how consumers assess their present financial situation and current buying conditions. The ICE captures their forward-looking views on personal finances, business conditions, and employment over the next 1–5 years.
Economic Interpretation
The divergence suggests a split in consumer psychology: “Now is still hard, but things should get better.” The modest ICC improvement is consistent with ongoing cost-of-living pressures — the survey director notes that over half of consumers continue to spontaneously cite high prices as a burden. The much larger ICE jump likely reflects two factors: (1) the easing of Iran conflict fears, which are inherently forward-looking, and (2) the moderation in gasoline prices, which consumers may be extrapolating into future inflation relief.
The 16% surge in five-year business conditions expectations is particularly notable. This component is the most forward-looking element of the survey and its sharp improvement suggests that consumers are beginning to discount the long-term economic disruption from the Iran conflict.
Historical Context: When Divergences Resolve
Looking at the 24-month history, ICC and ICE have oscillated in their relative positioning:
– Late 2024: Both indices were broadly aligned in the 60–75 range
– April 2025: ICE (47.3) fell sharply below ICC (59.8) — a classic “fear of the future” pattern
– June 2026: ICE (50.7) has now moved above ICC (47.7) — a reversal of that pattern
Historically, when ICE rises above ICC, it can be an early signal of a broader sentiment recovery. However, the June 2025 episode — where ICE surged before the overall index resumed its decline — serves as a cautionary precedent.
インフレ期待の分岐:1年先 vs 5年先
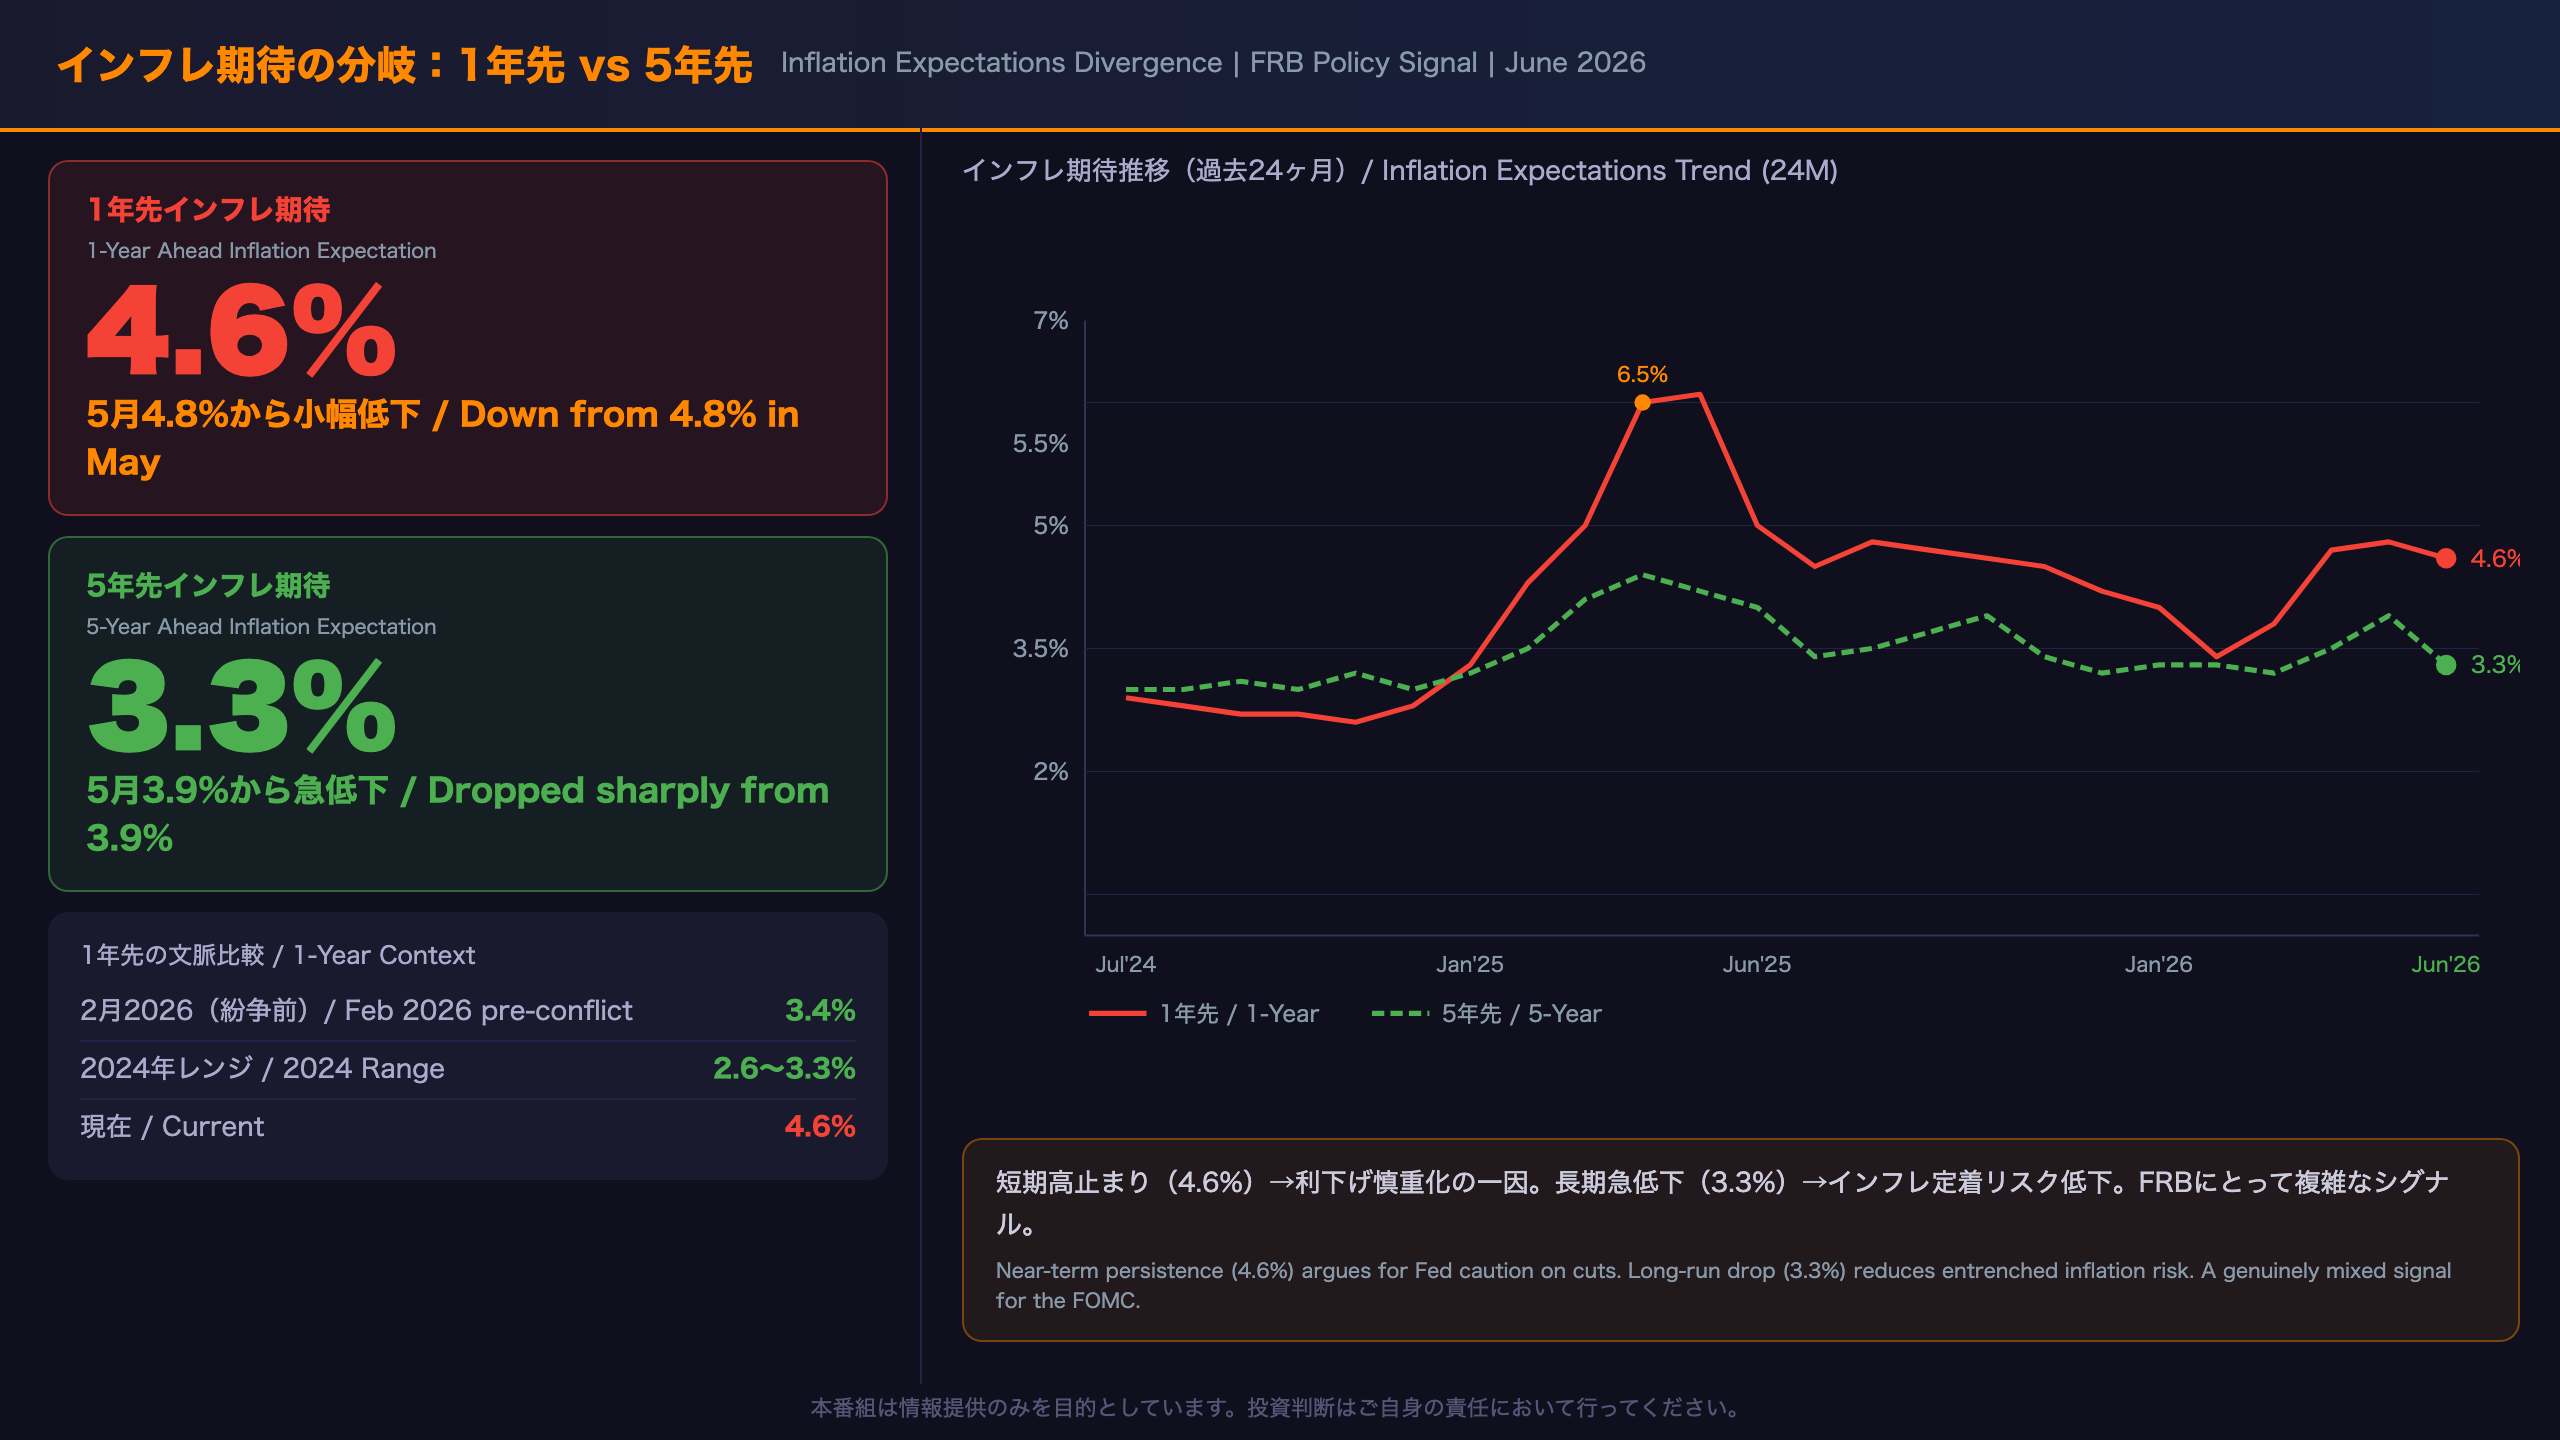
Inflation Expectations Diverge: A Complex Signal for the Fed
The Data at a Glance
| Measure | Jun 2026 | May 2026 | Feb 2026 | 2024 Range |
|---|---|---|---|---|
| 1-Year Ahead | 4.6% | 4.8% | 3.4% | 2.6–3.3% |
| 5-Year Ahead | 3.3% | 3.9% | 3.3% | 2.8–3.2% |
Why These Numbers Matter to the Fed
The Federal Reserve monitors Michigan’s inflation expectations data closely because consumer inflation expectations can become self-fulfilling: if workers expect higher inflation, they demand higher wages; if businesses expect higher inflation, they raise prices preemptively. The Fed’s dual mandate — price stability and maximum employment — makes anchoring long-run inflation expectations a core policy objective.
The Near-Term Problem: 4.6% Is Still Very High
The one-year-ahead expectation of 4.6% is only marginally below May’s 4.8%, and it remains dramatically elevated relative to:
– February 2026 (pre-Iran conflict): 3.4% — a gap of 1.2 percentage points
– Full-year 2024 range: 2.6–3.3% — the current reading is 1.3–2.0 percentage points above this range
– Fed’s 2% inflation target: The gap between consumer expectations (4.6%) and the Fed’s target (2%) remains very wide
This persistence in near-term inflation expectations is a headwind for Fed rate cuts. If consumers expect prices to rise 4.6% over the next year, they may demand higher wages and accept higher prices, potentially validating their own expectations.
The Long-Run Silver Lining: 3.3% Approaches 2024 Norms
The five-year-ahead expectation’s drop from 3.9% to 3.3% is the most encouraging data point in this report. The 3.9% reading in May 2026 was the highest five-year expectation in the 24-month dataset, raising concerns about de-anchoring. The return to 3.3% — which is within striking distance of the 2.8–3.2% range seen throughout 2024 — suggests that consumers do not believe the current inflation shock will persist indefinitely.
For the Fed, this reduces the risk of the most dangerous scenario: a wage-price spiral driven by entrenched long-run inflation expectations. However, one month’s improvement in a volatile series is insufficient to declare the problem resolved.
The Divergence as a Policy Dilemma
The simultaneous presence of elevated near-term expectations (4.6%) and improving long-run expectations (3.3%) creates a genuine policy dilemma. Cutting rates too soon risks validating near-term inflation fears; keeping rates high for too long risks unnecessary economic damage if long-run expectations are genuinely re-anchoring. This data alone cannot resolve that dilemma — it is one input among many that the FOMC will weigh.
インプリケーション:市場・FRBへの示唆
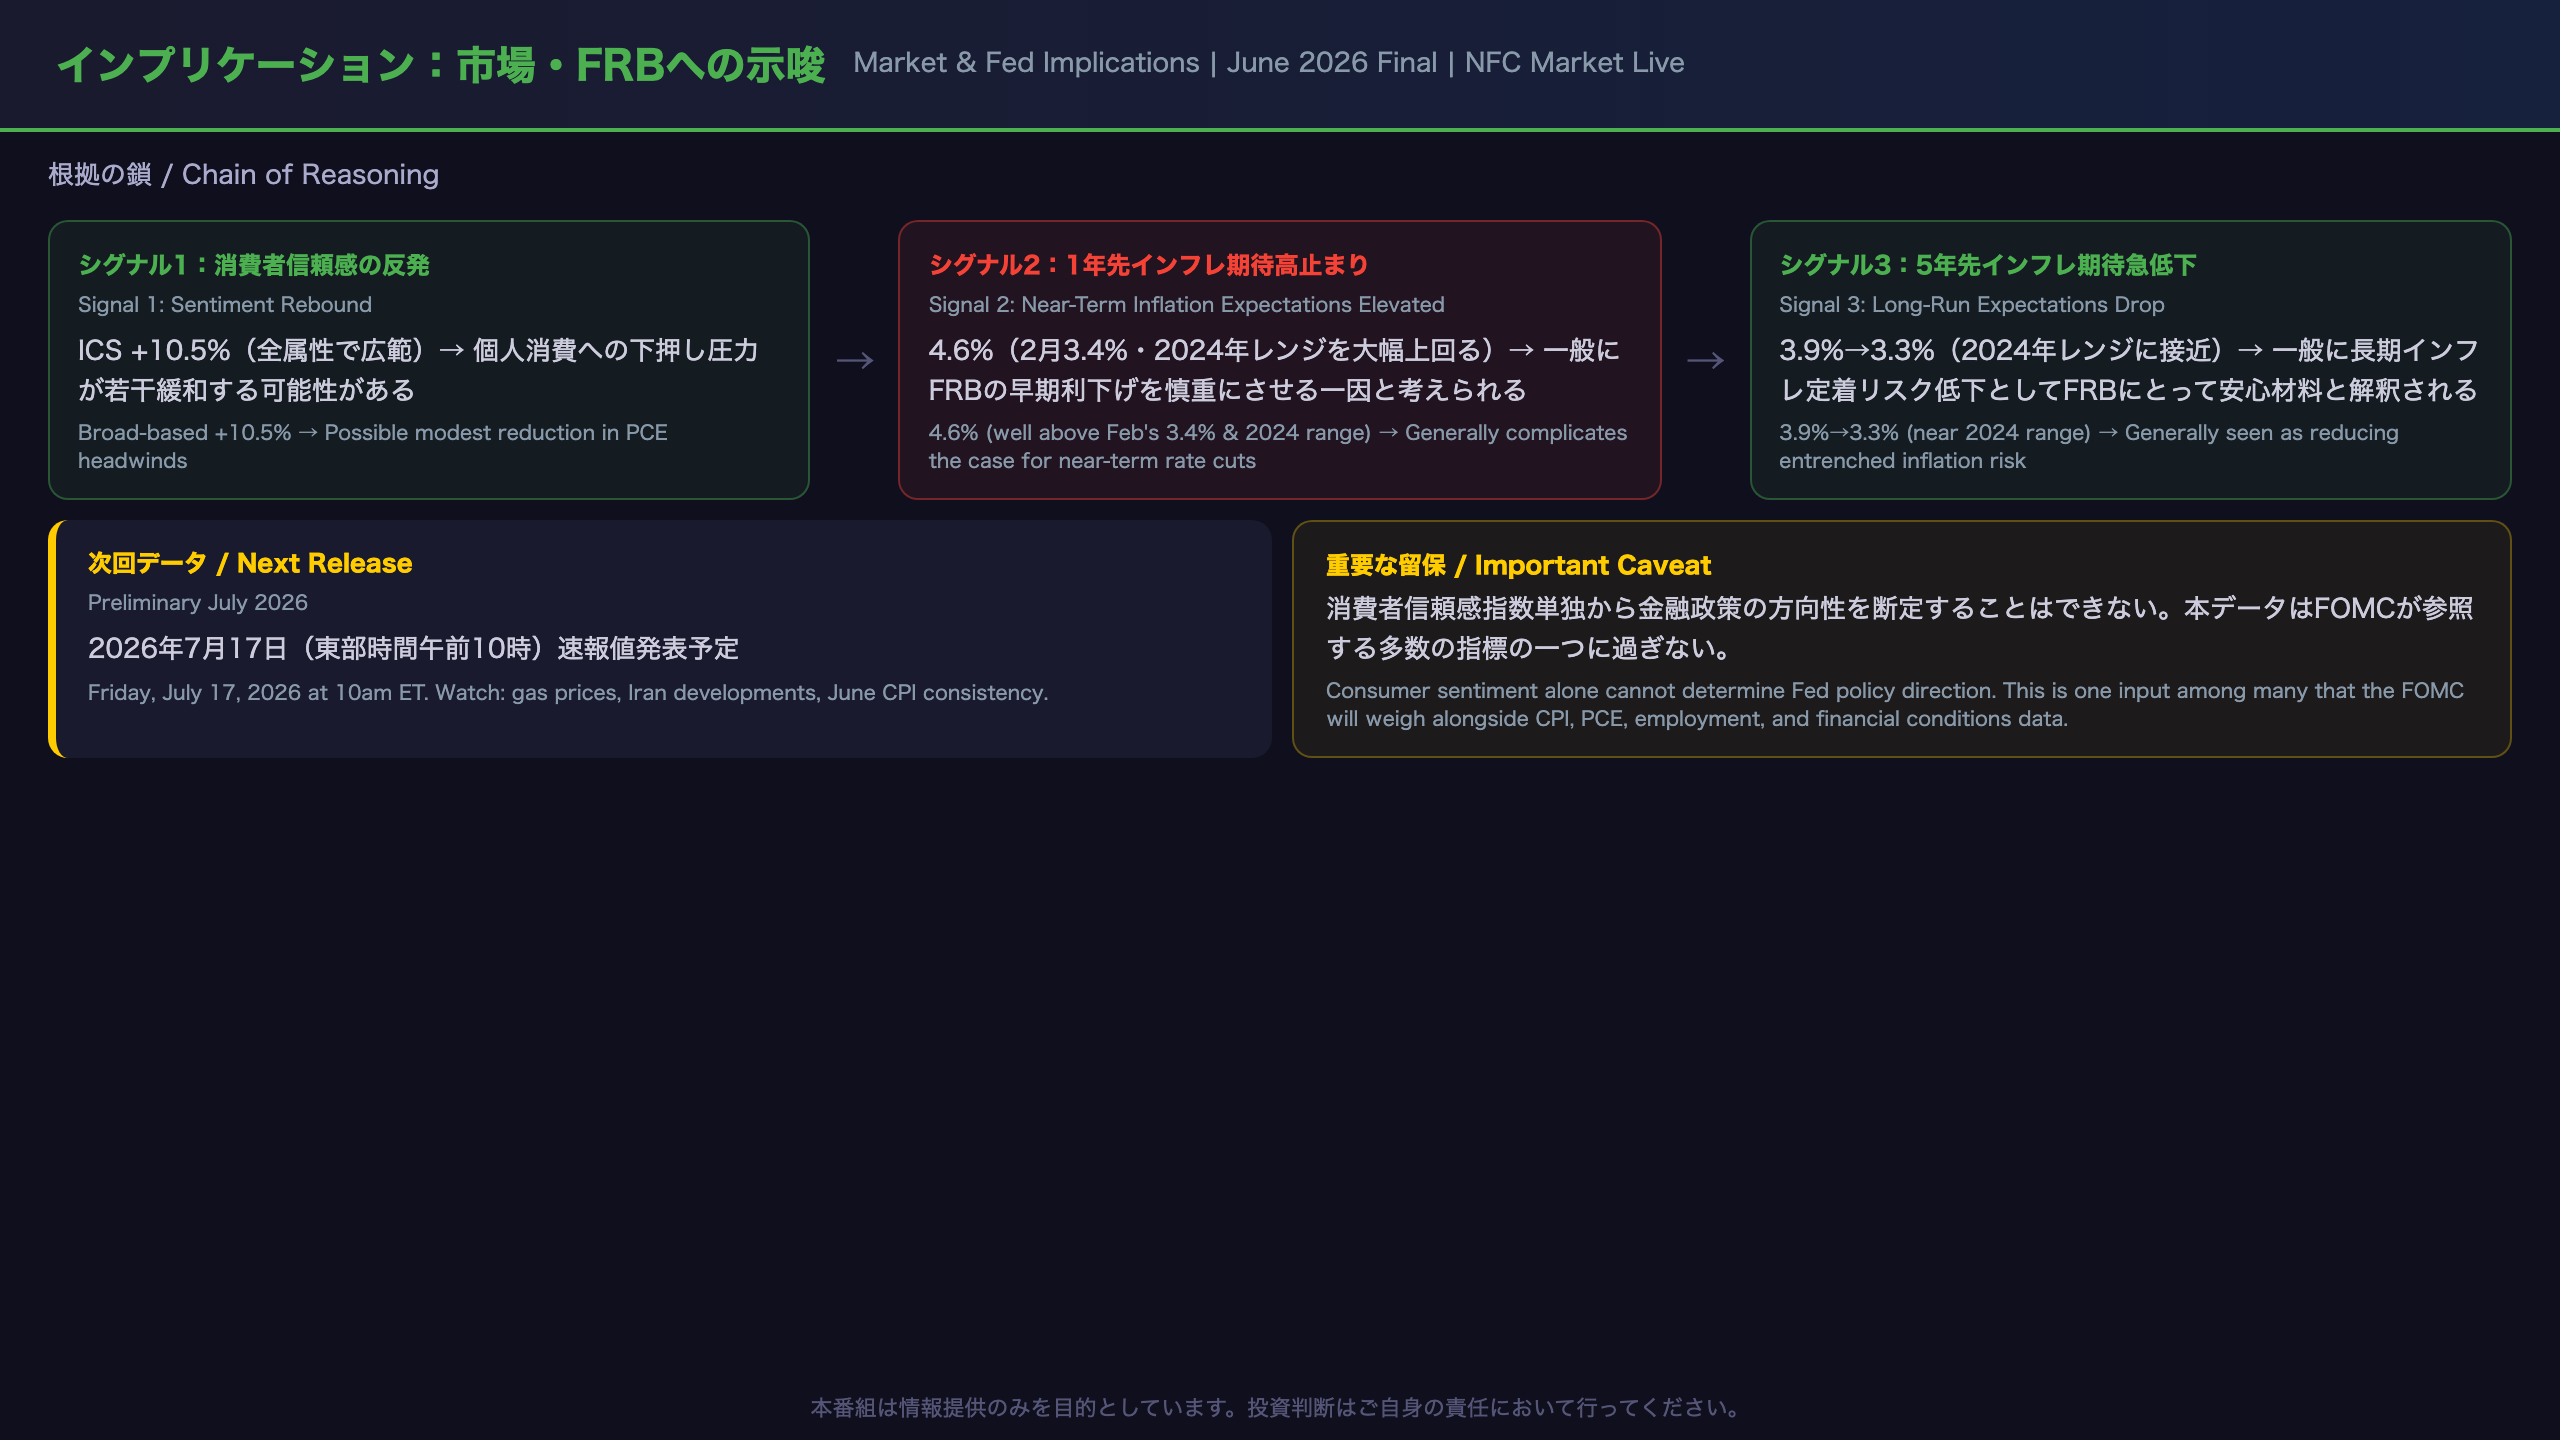
Implications: What This Data Means for Markets and the Fed
The “Chain of Reasoning” Framework
Signal 1: The Sentiment Rebound
ICS 44.8 → 49.5 (+10.5%), driven by gas price relief and fading Iran conflict fears → Consumer spending intentions may improve modestly → Slight reduction in downward pressure on personal consumption expenditures (PCE), which accounts for approximately 70% of US GDP
However, the index remains at a depressed 49.5, and the structural year-over-year decline of 18.5% persists. Declaring a “confirmed bottom” in consumer spending from a single month’s rebound would exceed what the data can support.
Signal 2: Elevated Near-Term Inflation Expectations
1-year inflation expectation at 4.6% (well above February’s 3.4% and the full-year 2024 range of 2.6–3.3%) → Consumer price perceptions remain at an elevated level → This is generally considered a factor that complicates the case for near-term Fed rate cuts
However, the relationship between consumer inflation expectations, actual inflation, and Fed policy decisions is complex. This indicator alone cannot determine the timing of rate cuts.
Signal 3: Falling Long-Run Inflation Expectations
5-year inflation expectation drops from 3.9% to 3.3% (approaching the 2024 range of 2.8–3.2%) → Long-run inflation entrenchment risk may be diminishing → Generally interpreted as a positive development for the Fed’s inflation-fighting credibility
Bull vs. Bear Interpretations
The Bull Case: The 10% rebound was broad-based across all demographic groups and supported by a tangible driver (gas price relief). The sharp drop in five-year inflation expectations suggests that consumers do not believe the current inflation shock will persist indefinitely. The ICE’s 15% surge indicates forward-looking optimism.
The Bear Case: 49.5 remains in “unfavorable territory” by the survey’s own characterization, and the structural year-over-year decline of 18.5% continues. The June 2025 “false bottom” precedent — where a similar surge was followed by renewed decline — cannot be dismissed. Near-term inflation expectations at 4.6% remain well above pre-conflict levels.
What to Watch: July 17, 2026
The preliminary July 2026 reading is scheduled for Friday, July 17, 2026 at 10am ET. Key variables:
– Gasoline price trends (summer driving season dynamics)
– Iran conflict developments
– Consistency with June CPI and employment data
– Implications for the July FOMC meeting (tentatively July 28–29, 2026)
Disclaimer: This article is for informational purposes only. All investment decisions are made solely at your own risk.







