📺 Watch the Full Video Analysis
This article was automatically generated by the NFC Market Live AI analysis system. (Updated: 2026-06-25 21:40 JST)
📄 Primary Source
U.S. Bureau of Economic Analysis
https://www.bea.gov/sites/default/files/2026-06/pi0526.pdf
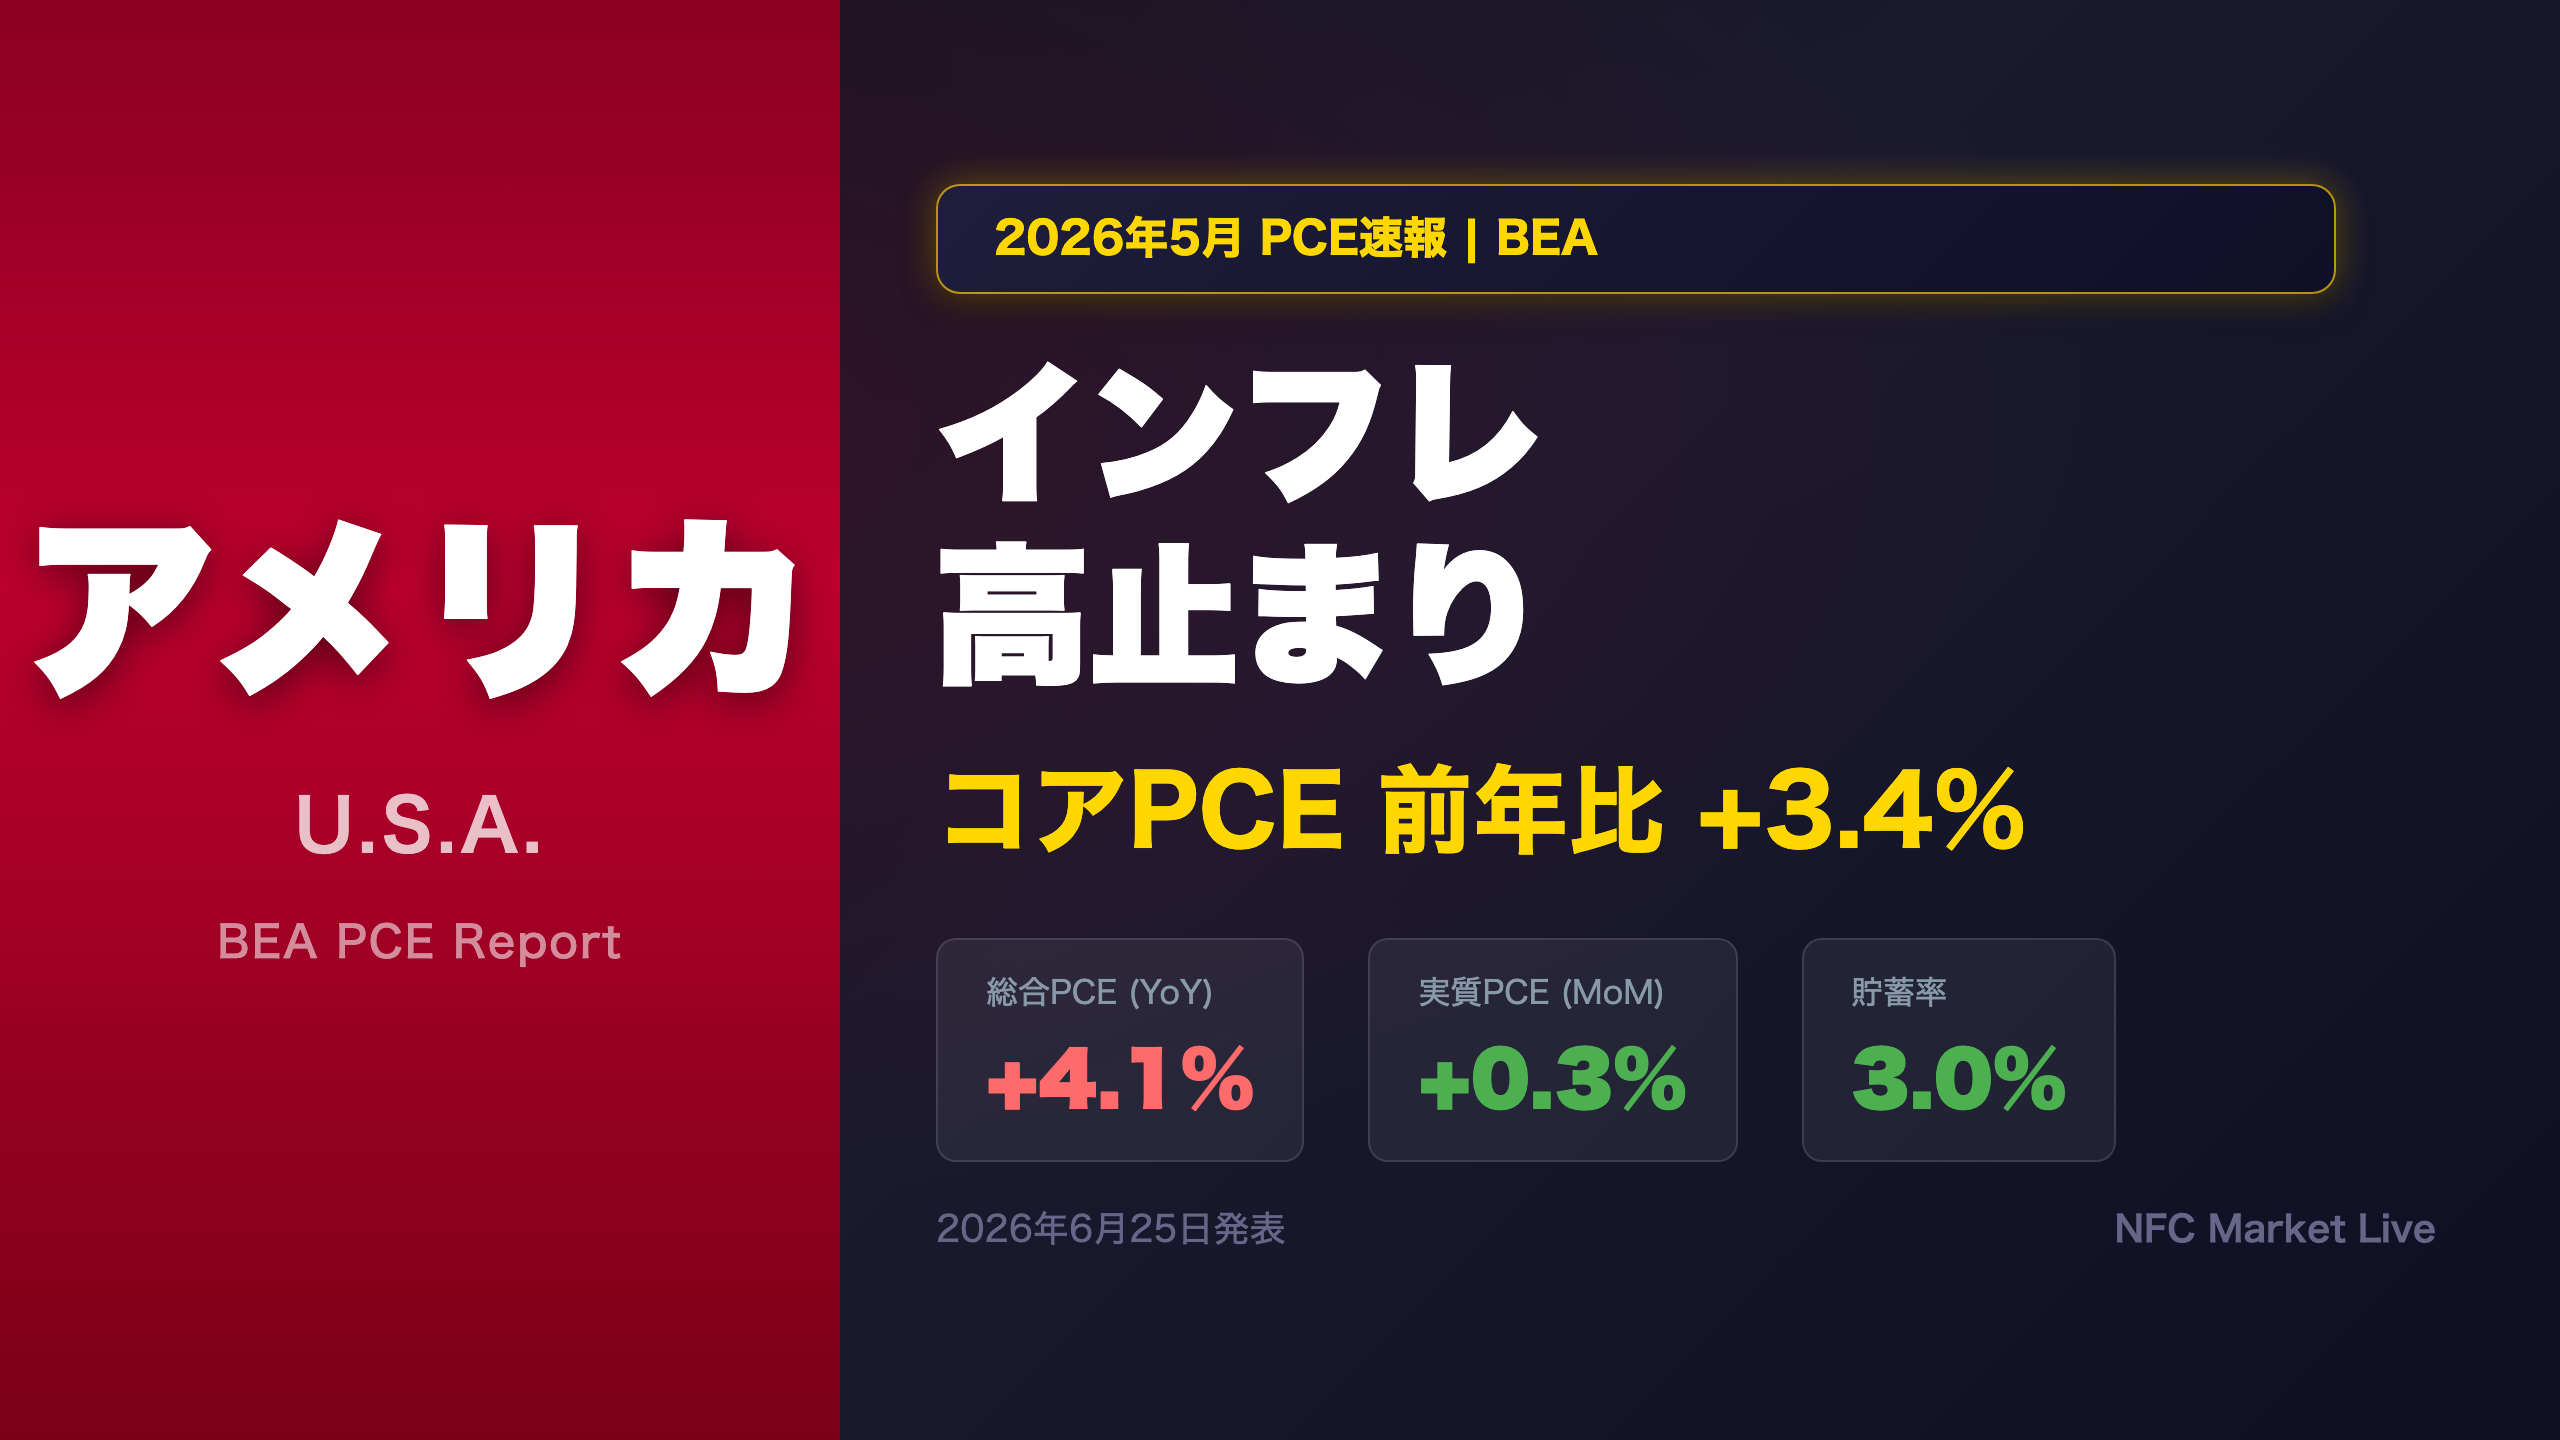
BEA’s May 2026 Personal Income & Outlays report shows headline PCE inflation accelerating to 4.1% YoY while core PCE holds at 3.4%. We dissect the goods vs. services split, the income-spending balance, and what the rising saving rate signals for Fed policy. Essential viewing for macro investors tracking the Fed’s rate path.
The Ultimate Summary:5月PCEの全体像
May 2026 PCE Report: Executive Summary for Global Investors
What Is the PCE Report?
The Personal Income and Outlays report, published monthly by the U.S. Bureau of Economic Analysis (BEA), is the Federal Reserve’s preferred inflation gauge. Unlike the Consumer Price Index (CPI) published by the Bureau of Labor Statistics, PCE uses a chain-weighted methodology that adjusts for substitution effects, giving it a broader and more flexible measure of consumer prices. The Fed’s official inflation target of 2% is expressed in terms of the core PCE deflator (excluding food and energy).
Key Data Points: May 2026
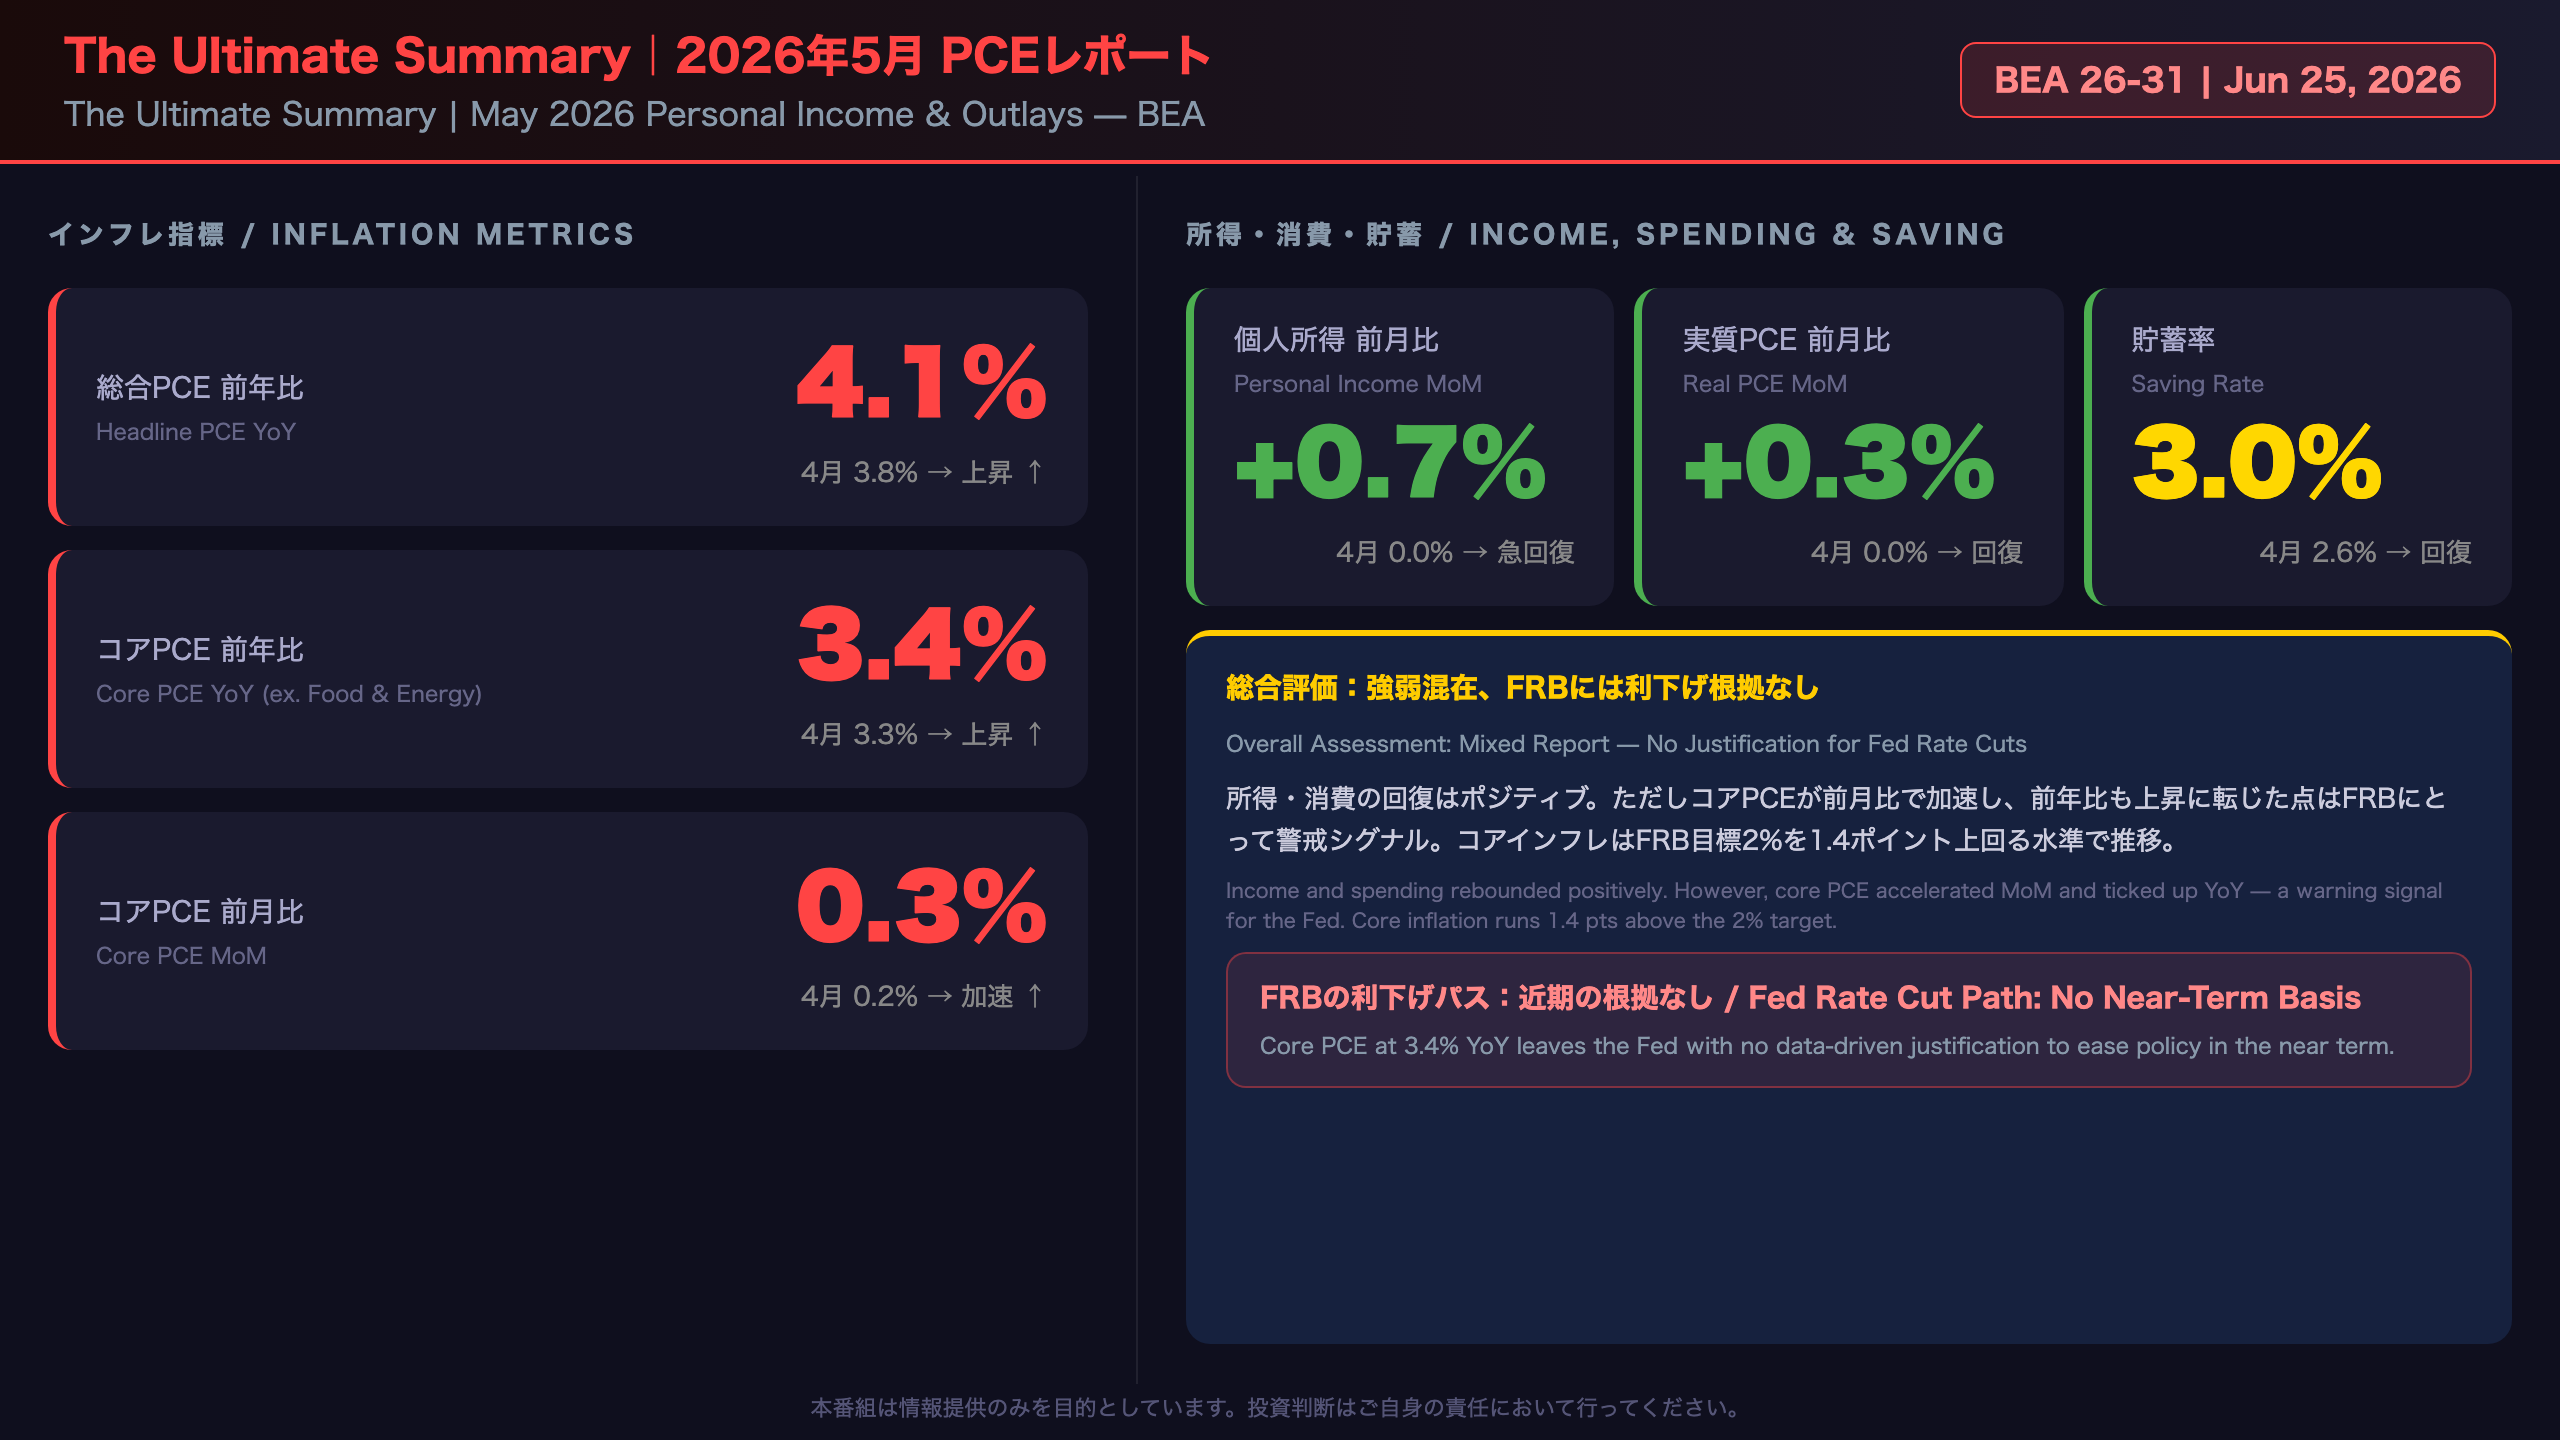
| Metric | April | May | Change |
|---|---|---|---|
| Headline PCE (YoY) | 3.8% | 4.1% | +0.3pt |
| Core PCE (YoY) | 3.3% | 3.4% | +0.1pt |
| Headline PCE (MoM) | 0.4% | 0.4% | Flat |
| Core PCE (MoM) | 0.2% | 0.3% | Accelerated |
| Real PCE (MoM) | 0.0% | 0.3% | Strong rebound |
| Personal Income (MoM) | 0.0% | 0.7% | Strong rebound |
| Saving Rate | 2.6% | 3.0% | Slight recovery |
The Bull Case
Personal income surged 0.7% MoM — a sharp reversal from April’s flat reading. Real PCE also rebounded to +0.3% from zero, suggesting the consumer is not rolling over. The saving rate’s recovery to 3.0% indicates households are not yet in distress.
The Bear Case
Core PCE accelerated on a monthly basis (0.2% → 0.3%), which annualizes to roughly 3.6% — well above the Fed’s 2% target. The year-over-year core reading ticked up to 3.4%, interrupting any nascent disinflation narrative. Critically, part of the income surge reflects one-time government farm subsidy payments under the American Relief Act of 2025, raising questions about sustainability.
Fed Policy Implication
With core PCE at 3.4% YoY — 140 basis points above target — the data provides no near-term catalyst for rate cuts. The next release covering June data is scheduled for July 30, 2026.
コアPCEの深掘り:前月比・前年比トレンド
Core PCE Trend Analysis: Acceleration or Stickiness?
Monthly Core PCE Trend (from BEA source data)
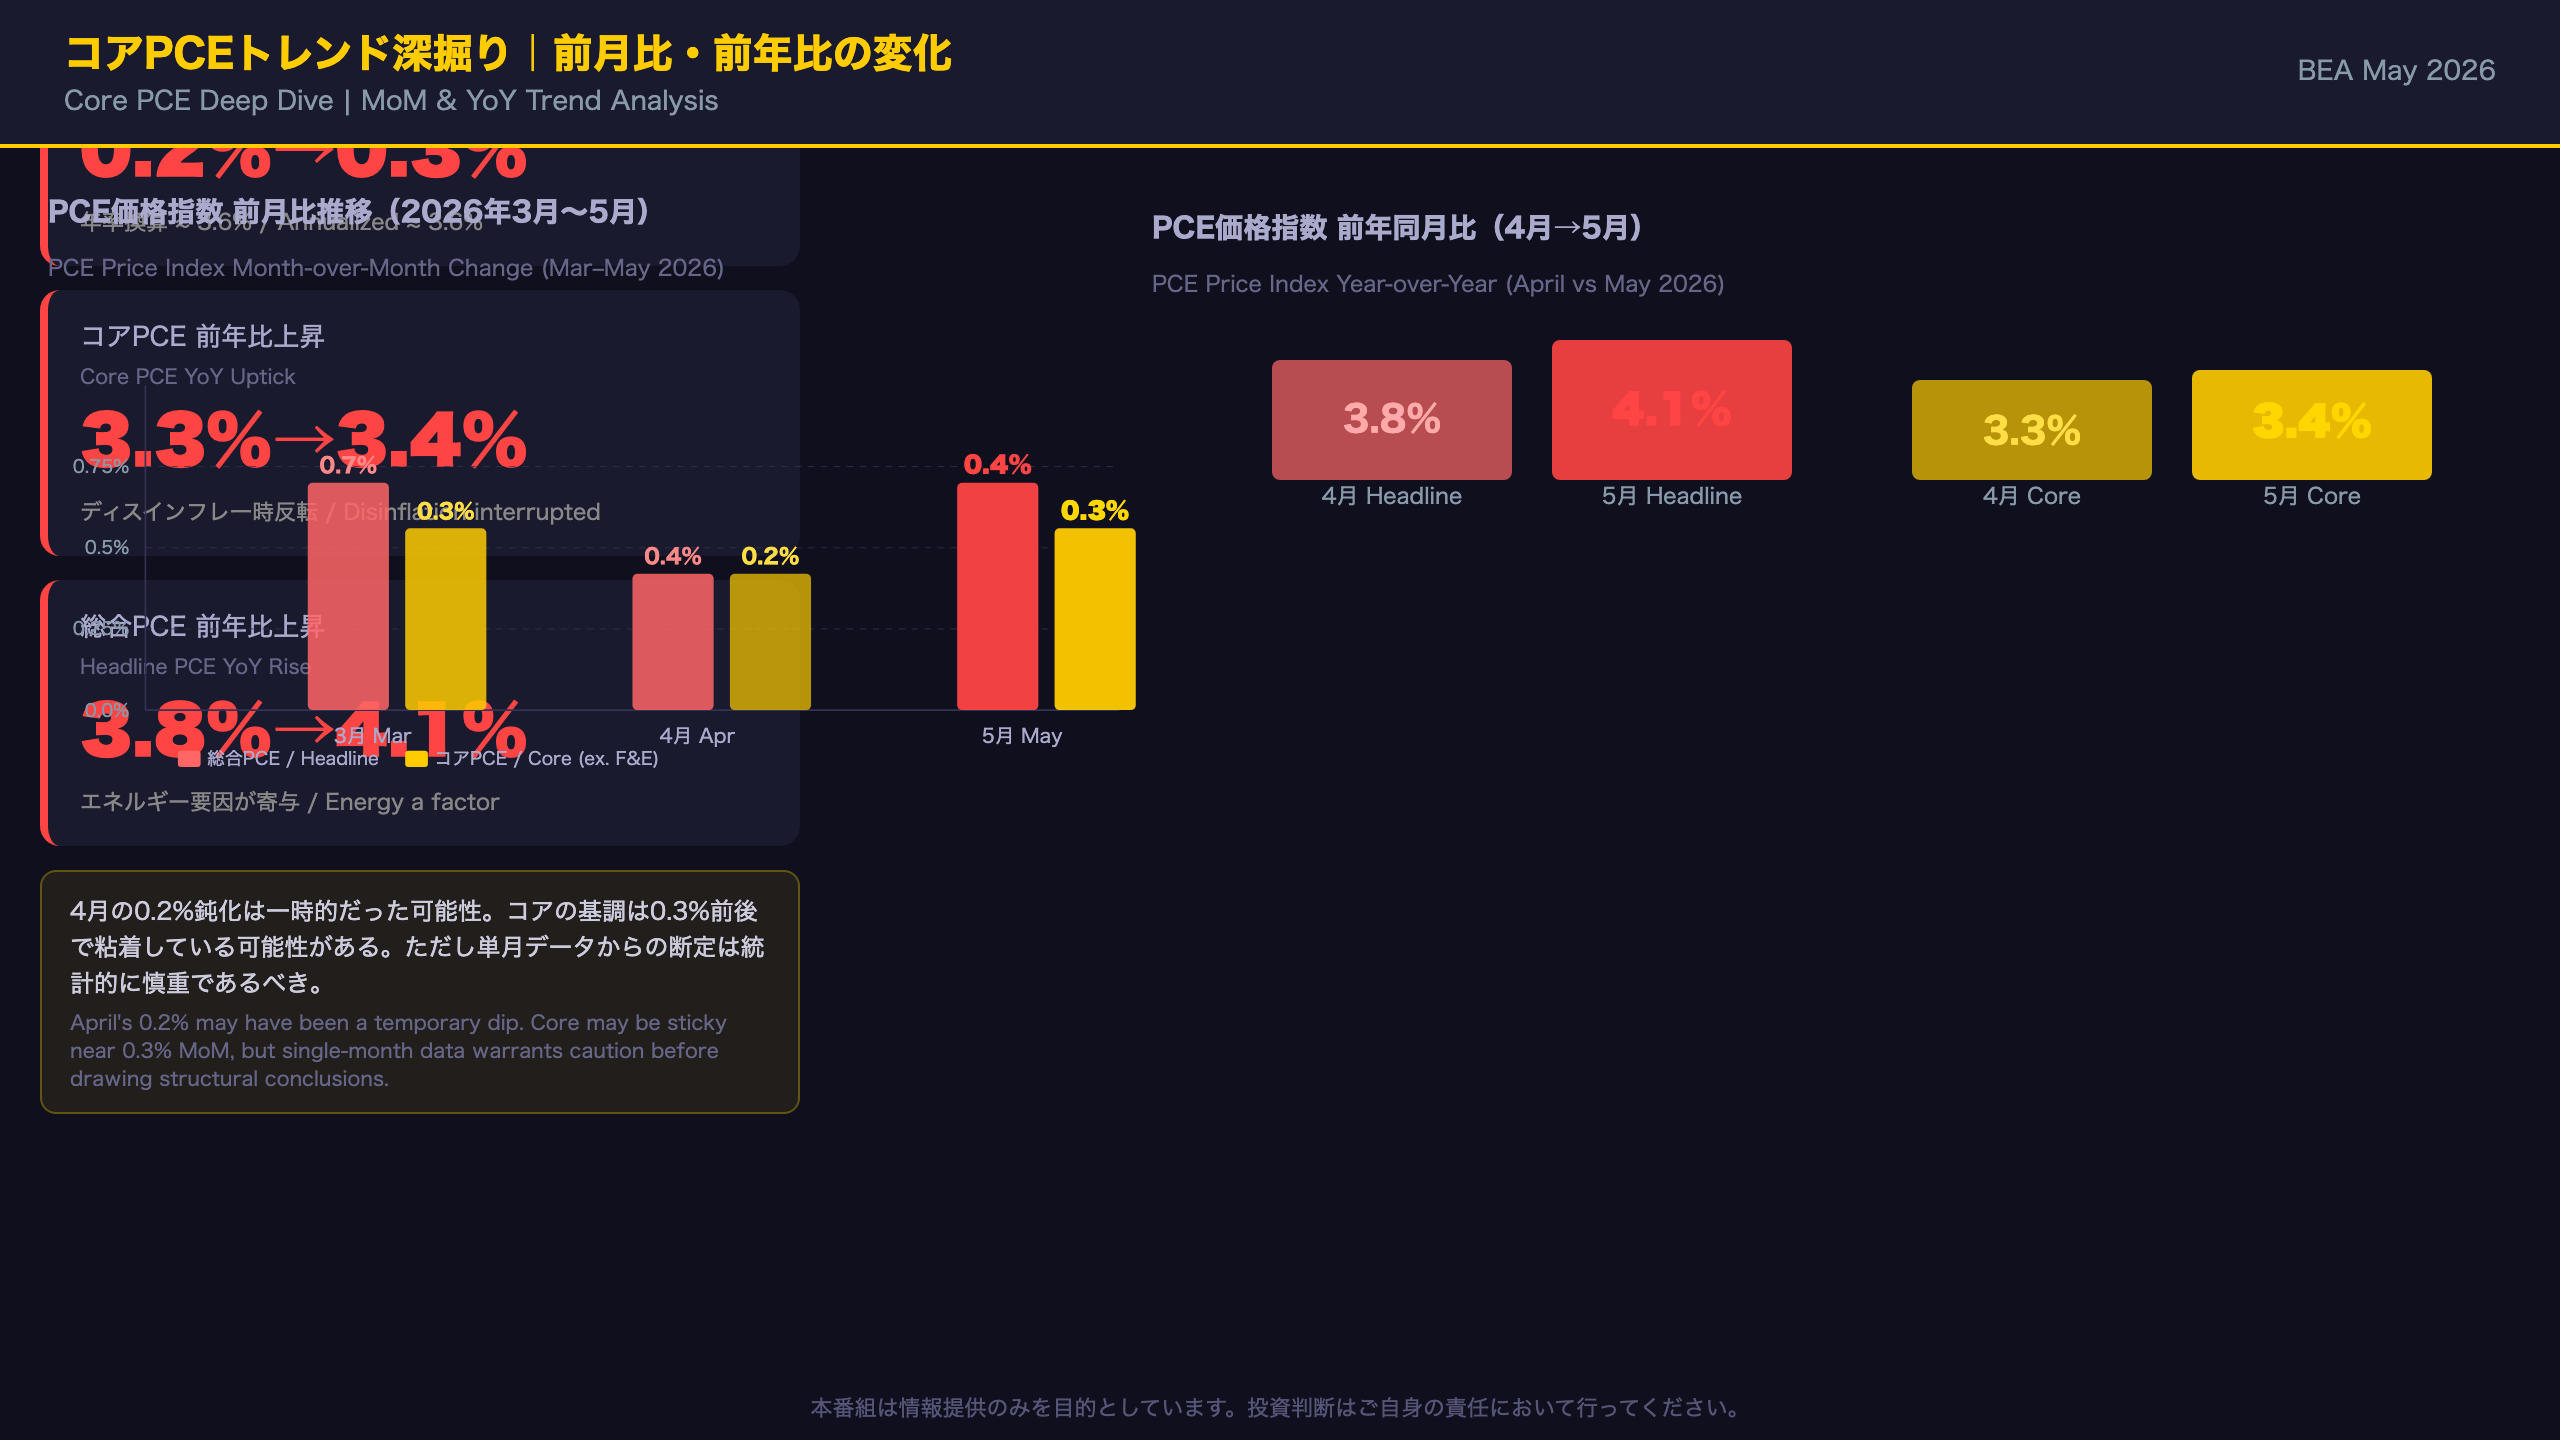
| Month | Headline PCE MoM | Core PCE MoM |
|---|---|---|
| March 2026 | 0.7% | 0.3% |
| April 2026 | 0.4% | 0.2% |
| May 2026 | 0.4% | 0.3% |
The April reading of 0.2% MoM had briefly suggested that disinflation was gaining traction. May’s re-acceleration to 0.3% challenges that narrative. Annualized, 0.3% MoM equates to approximately 3.6% — nearly double the Fed’s 2% target.
Year-over-Year Comparison
| Month | Headline PCE YoY | Core PCE YoY |
|---|---|---|
| April 2026 | 3.8% | 3.3% |
| May 2026 | 4.1% | 3.4% |
The larger jump in headline (+0.3pt) versus core (+0.1pt) suggests energy prices are amplifying the headline figure. The BEA’s spending breakdown confirms that gasoline and other energy goods was the single largest contributor to goods spending in May at +$21.1 billion.
Legal Services Price Adjustment
BEA’s technical notes state that the PCE price index for legal services was adjusted for January and March, but no adjustment was made for February, April, or May. This is a methodological detail worth noting: past adjustments can create discontinuities in the time series that may affect trend analysis.
Bull vs. Bear Interpretation
Bull case: The 0.3% MoM reading matches March’s level — this could be characterized as “sticky” rather than “re-accelerating.” A single month’s data point is insufficient to declare a new uptrend.
Bear case: April’s 0.2% may have been the anomaly, and the underlying trend is firmly anchored at 0.3% MoM — a pace inconsistent with the Fed’s inflation mandate. The YoY uptick from 3.3% to 3.4% adds weight to this view.
財 vs サービス:インフレの粘着性はどこにあるか
Goods vs. Services: Where Is Inflation Sticking?
May 2026 PCE Spending Breakdown (BEA Source Data)
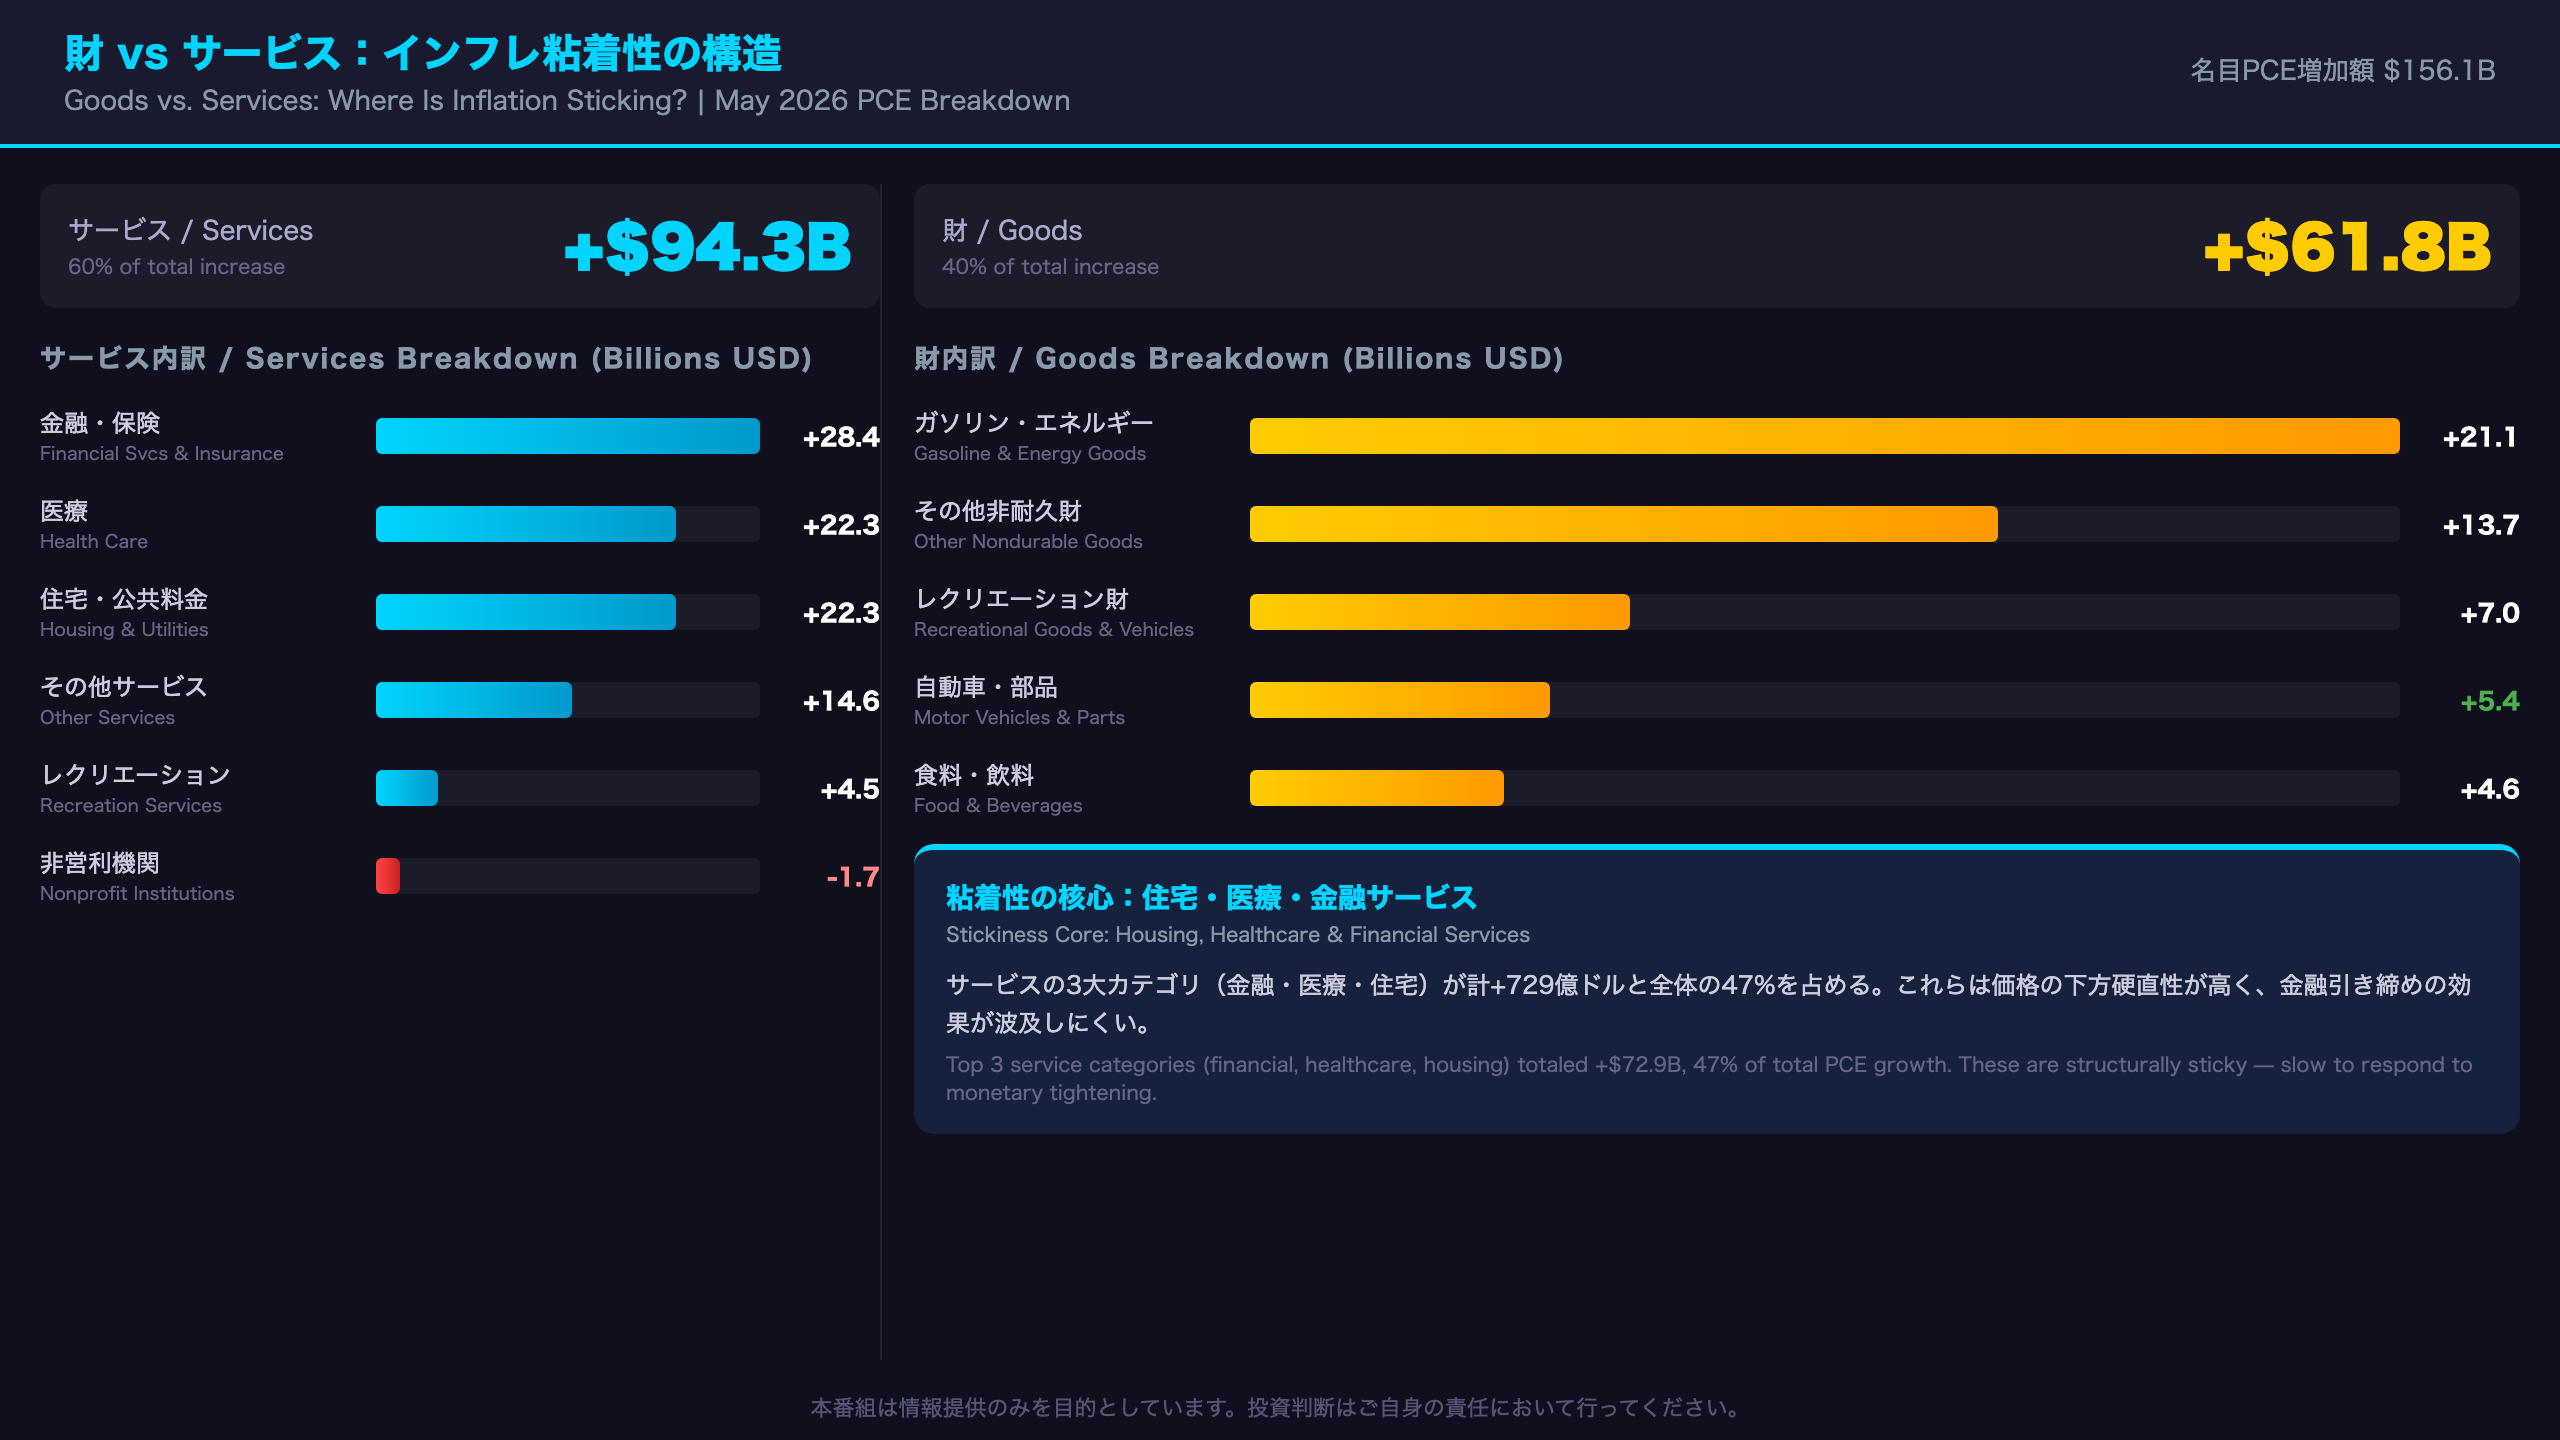
Services (+$94.3B total)
– Financial services & insurance: +$28.4B (largest contributor)
– Health care: +$22.3B
– Housing & utilities: +$22.3B
– Other services: +$14.6B
– Recreation services: +$4.5B
– Transportation services: +$3.5B
– Food services & accommodations: +$0.4B
– Final expenditures of nonprofits: -$1.7B
Goods (+$61.8B total)
– Gasoline & other energy goods: +$21.1B (largest contributor)
– Other nondurable goods: +$13.7B
– Recreational goods & vehicles: +$7.0B
– Motor vehicles & parts: +$5.4B (reversed from -$9.2B in April)
– Food & beverages: +$4.6B
– Furnishings & durable household equipment: +$4.1B
– Other durable goods: +$3.1B
– Clothing & footwear: +$2.9B
Why Services Inflation Is Structurally Sticky
Housing and utilities (+$22.3B) and health care (+$22.3B) are among the most price-inelastic categories in the PCE basket. Housing costs are driven by lease renewal cycles and lagged rent adjustments, while health care prices are influenced by multi-year insurance contracts and regulatory pricing. These categories are notoriously slow to respond to monetary tightening.
The surge in financial services and insurance (+$28.4B) is particularly notable given that this category fell $3.9B in April. The sharp reversal may reflect financial market activity or insurance premium adjustment cycles — a volatile component that warrants monitoring.
Goods: Recovery or Bounce?
Motor vehicles and parts swung from -$9.2B in April to +$5.4B in May. Whether this represents a genuine recovery in auto demand or a technical rebound from April’s weakness cannot be determined from a single month’s data. Energy goods (+$21.1B) are excluded from core PCE but were the primary driver of headline acceleration.
所得・支出・貯蓄率:消費者の耐久力を検証
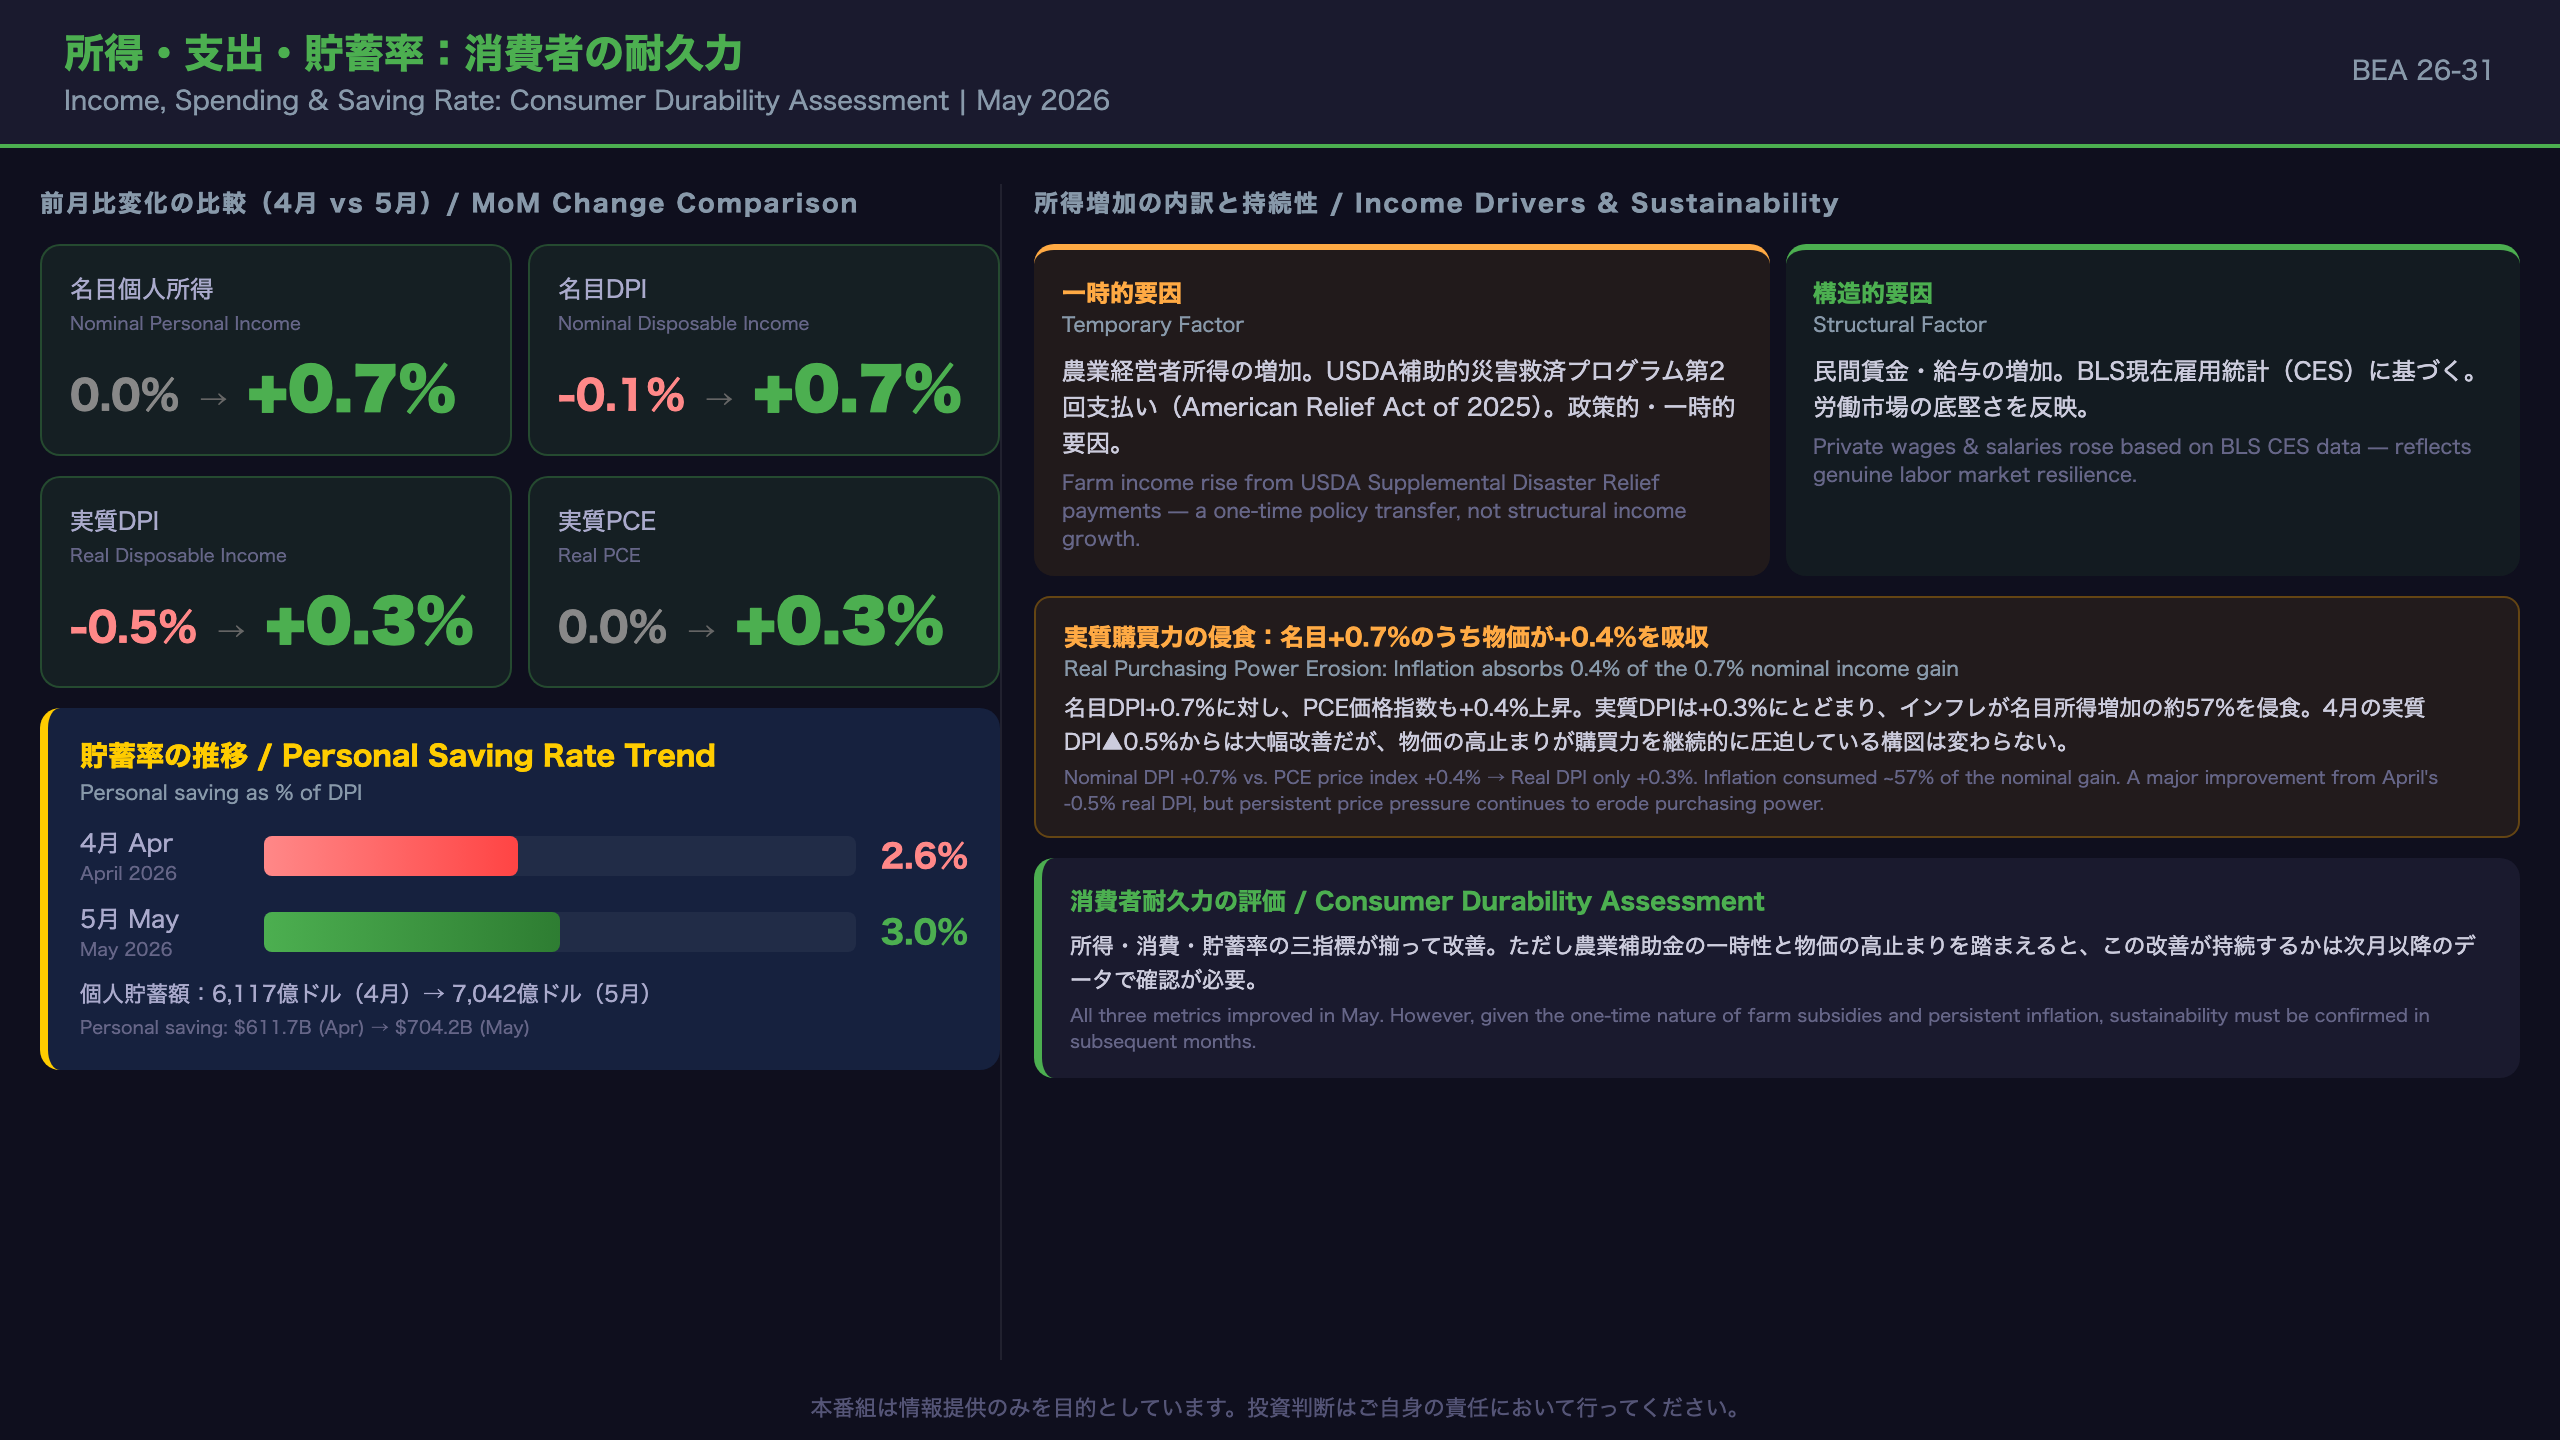
Income, Spending & Saving Rate: Assessing Consumer Durability
Key Metrics Comparison (Month-over-Month)
| Metric | April | May | Change |
|---|---|---|---|
| Nominal Personal Income | 0.0% | +0.7% | Sharp rebound |
| Nominal DPI | -0.1% | +0.7% | Sharp rebound |
| Real DPI | -0.5% | +0.3% | Recovery |
| Nominal PCE | +0.4% | +0.7% | Accelerated |
| Real PCE | 0.0% | +0.3% | Recovery |
| Saving Rate | 2.6% | 3.0% | +0.4pt |
Breaking Down the Income Surge
The BEA’s technical notes identify two drivers of May’s income jump:
-
Farm proprietors’ income: The USDA issued a second round of Supplemental Disaster Relief Program payments under the American Relief Act of 2025. This is explicitly a one-time, policy-driven transfer — not organic income growth.
-
Private wages and salaries: Based on BLS Current Employment Statistics (CES) data. This component represents genuine labor market income and is structurally more durable.
Note that April’s income was depressed partly because the Farmer Bridge Assistance Program closed application submissions in mid-April. May’s rebound partially reflects this reversal. The sustainability of income growth in coming months will depend heavily on the private wages component.
Real Purchasing Power: Still Being Eroded
Nominal DPI rose 0.7%, but the PCE price index also rose 0.4%, leaving real DPI at just +0.3%. Inflation is consuming roughly 57% of the nominal income gain. This is a significant improvement from April, when real DPI fell 0.5% (nominal -0.1% minus inflation +0.4%).
Saving Rate in Context
At 3.0%, the personal saving rate remains historically low compared to the pandemic-era peak (above 20% in 2020-2021). However, the recovery from April’s 2.6% suggests consumers are not yet in a distress-driven dissaving mode. The saving rate’s direction — rather than its absolute level — is the more important signal for near-term consumption sustainability.
インプリケーション:FRB政策と市場への示唆
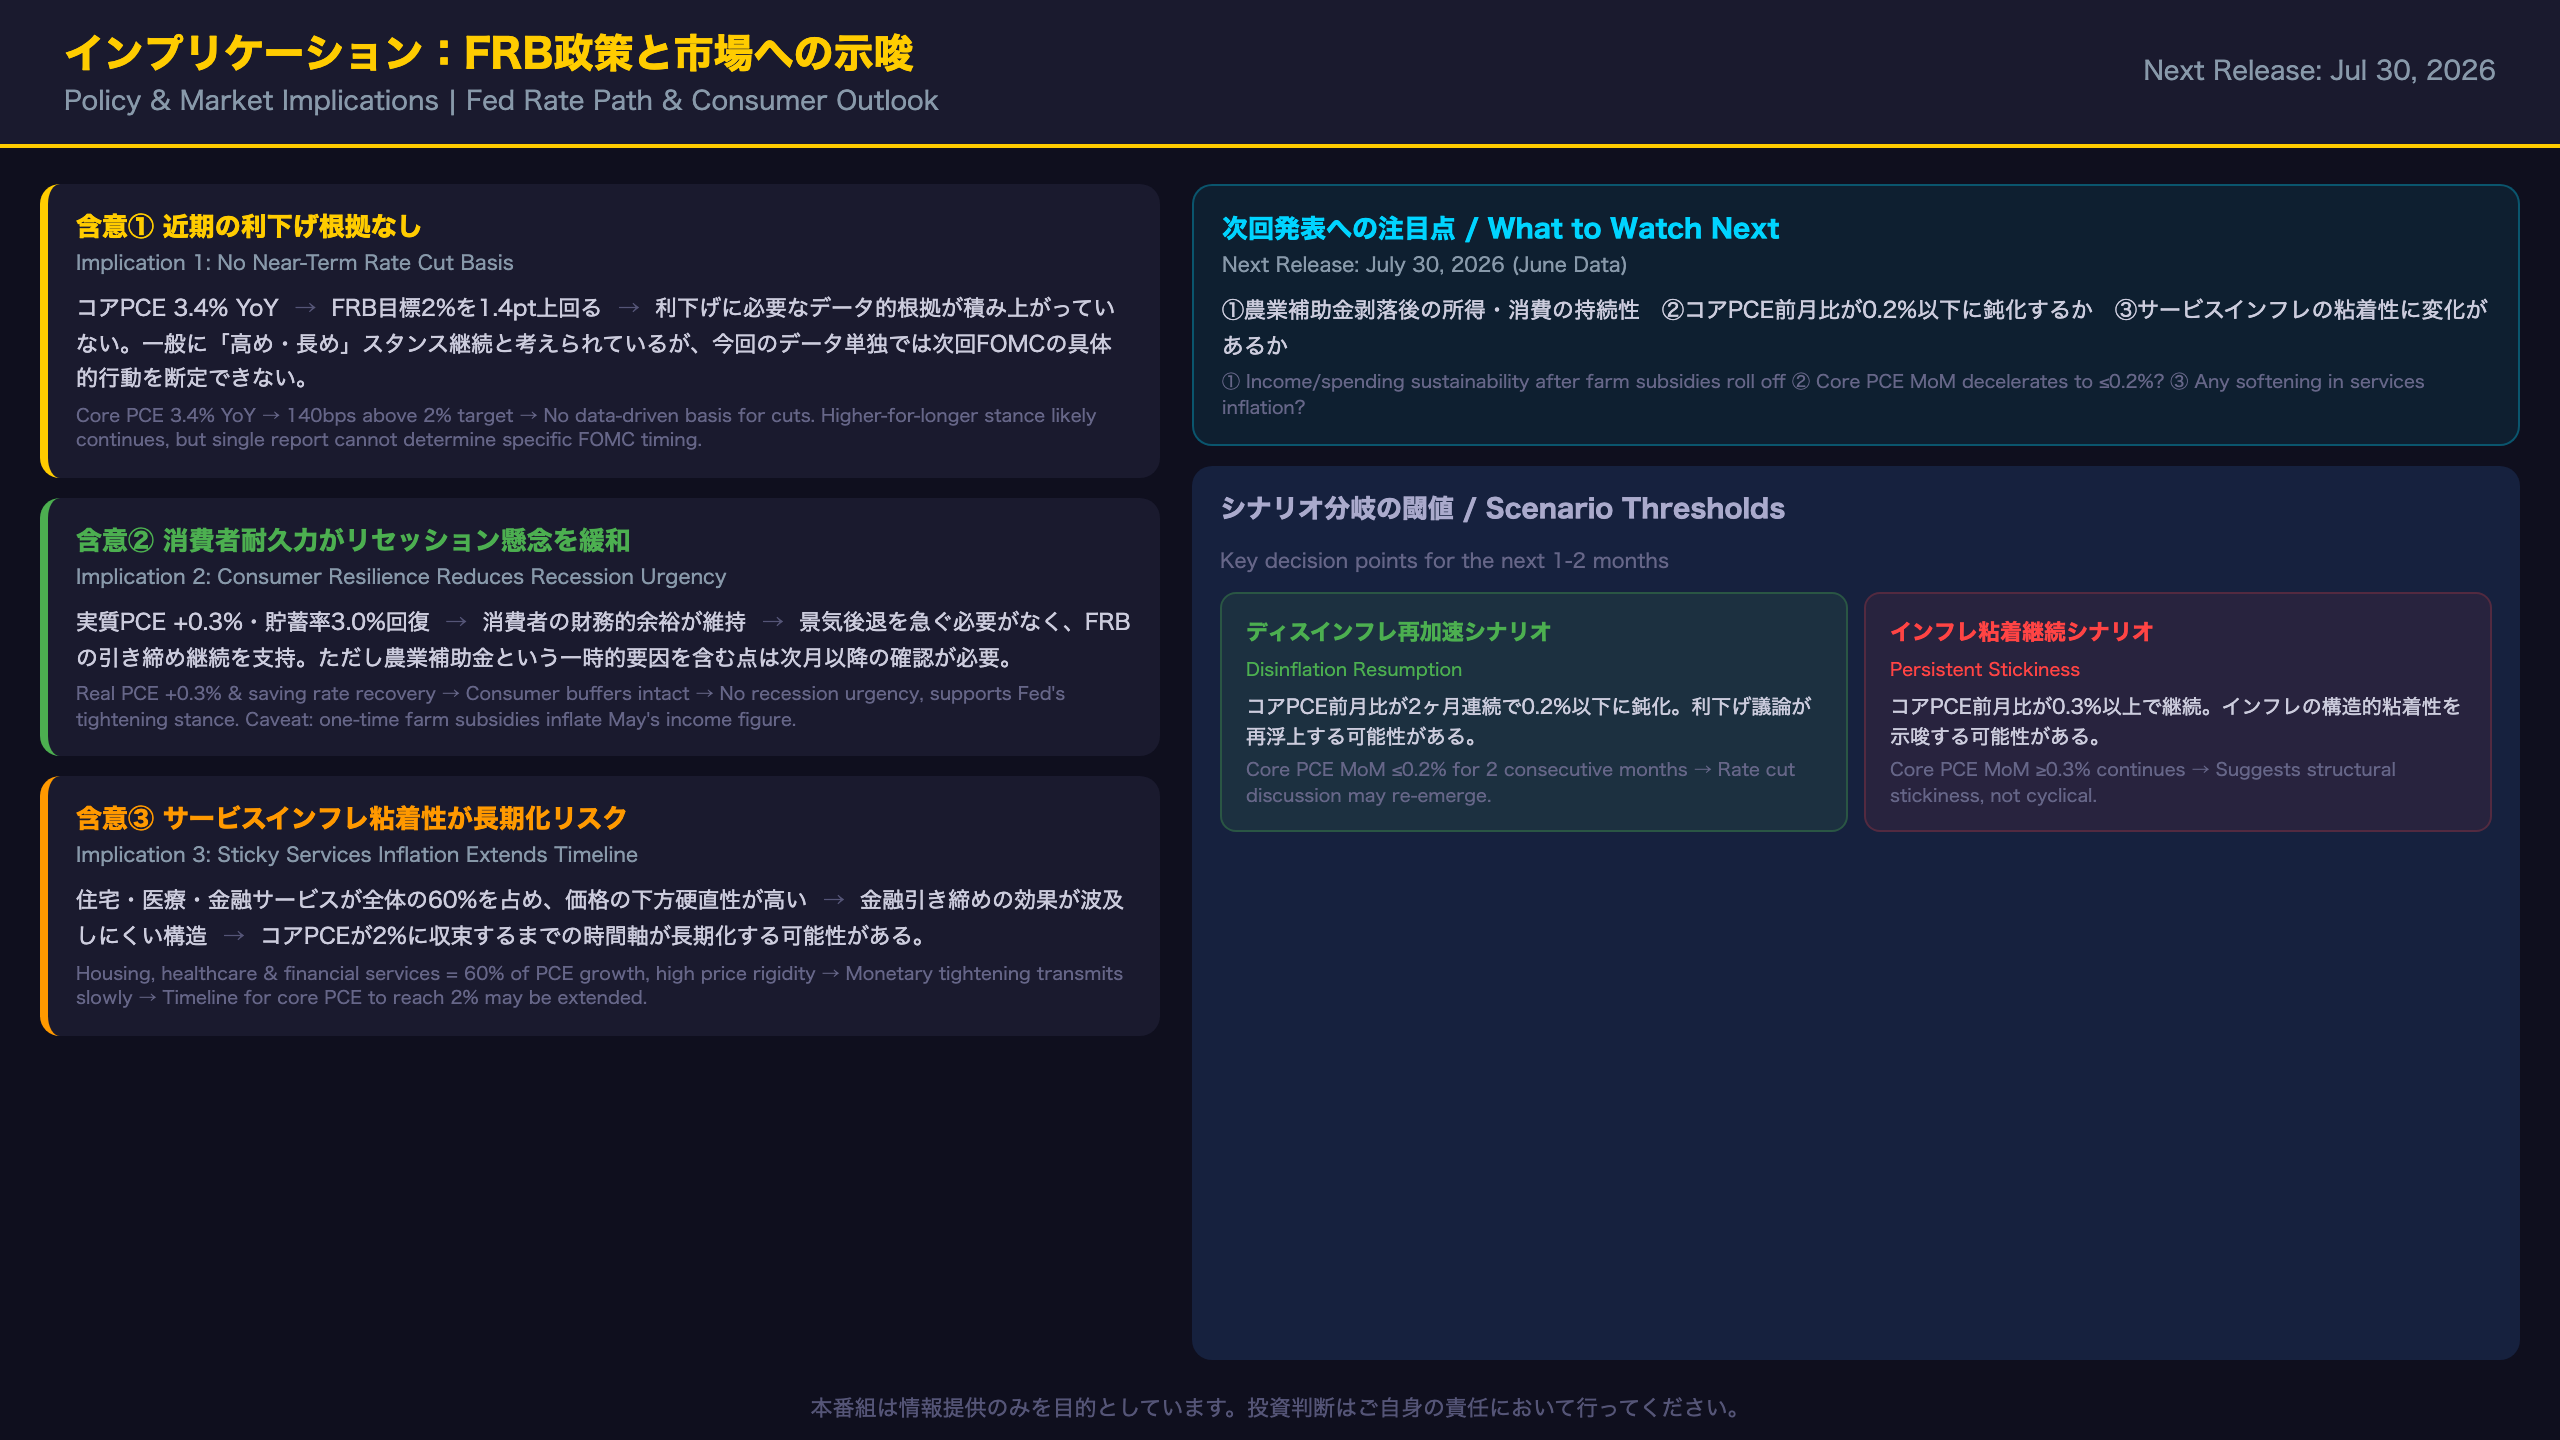
Policy & Market Implications: The Fed’s Dilemma
The “Chain of Evidence” Framework
Implication 1: No Near-Term Rate Cut Basis
Core PCE at 3.4% YoY and 0.3% MoM → Running 140 basis points above the Fed’s 2% target → No data-driven justification for easing → It is generally understood that the Fed requires sustained disinflation progress before cutting rates, but today’s single report alone cannot determine the specific timing of the next FOMC action.
Implication 2: Consumer Resilience Reduces Recession Urgency
Real PCE +0.3% and saving rate recovery to 3.0% → Consumer financial buffers remain intact → No recession-driven urgency for a policy pivot → This supports the Fed’s higher-for-longer stance, though the one-time farm subsidy component warrants monitoring in subsequent months.
Implication 3: Structural Stickiness Extends the Timeline
Services inflation (housing, healthcare, financial services) accounts for ~60% of PCE growth, with high price downward rigidity → Monetary tightening transmits slowly to these categories → The timeline for core PCE to converge to 2% may be longer than previously anticipated.
What to Watch in the Next Release
- Next release date: July 30, 2026 (covering June data)
- Key questions: ① Does income/spending hold up after farm subsidies roll off? ② Does core PCE MoM decelerate back to 0.2% or below? ③ Is there any softening in services inflation?
- Scenario thresholds: Two consecutive months of core PCE MoM at 0.2% or below would suggest disinflation is resuming. Conversely, a third consecutive month at 0.3% or above would strengthen the case that stickiness is structural, not cyclical.
International Context
For comparison, the ECB targets 2% HICP inflation, and the Bank of Japan targets 2% CPI. The U.S. core PCE at 3.4% YoY stands in contrast to the Fed’s own target and highlights why the Fed remains in a distinctly more constrained position relative to central banks in economies where inflation has already returned closer to target.
Disclaimer: This article is for informational purposes only. All investment decisions are made solely at your own risk.







