📺 Watch the Full Video Analysis
This article was automatically generated by the NFC Market Live AI analysis system. (Updated: 2026-07-02 21:41 JST)
📄 Primary Source
U.S. Bureau of Labor Statistics
https://www.bls.gov/news.release/empsit.htm
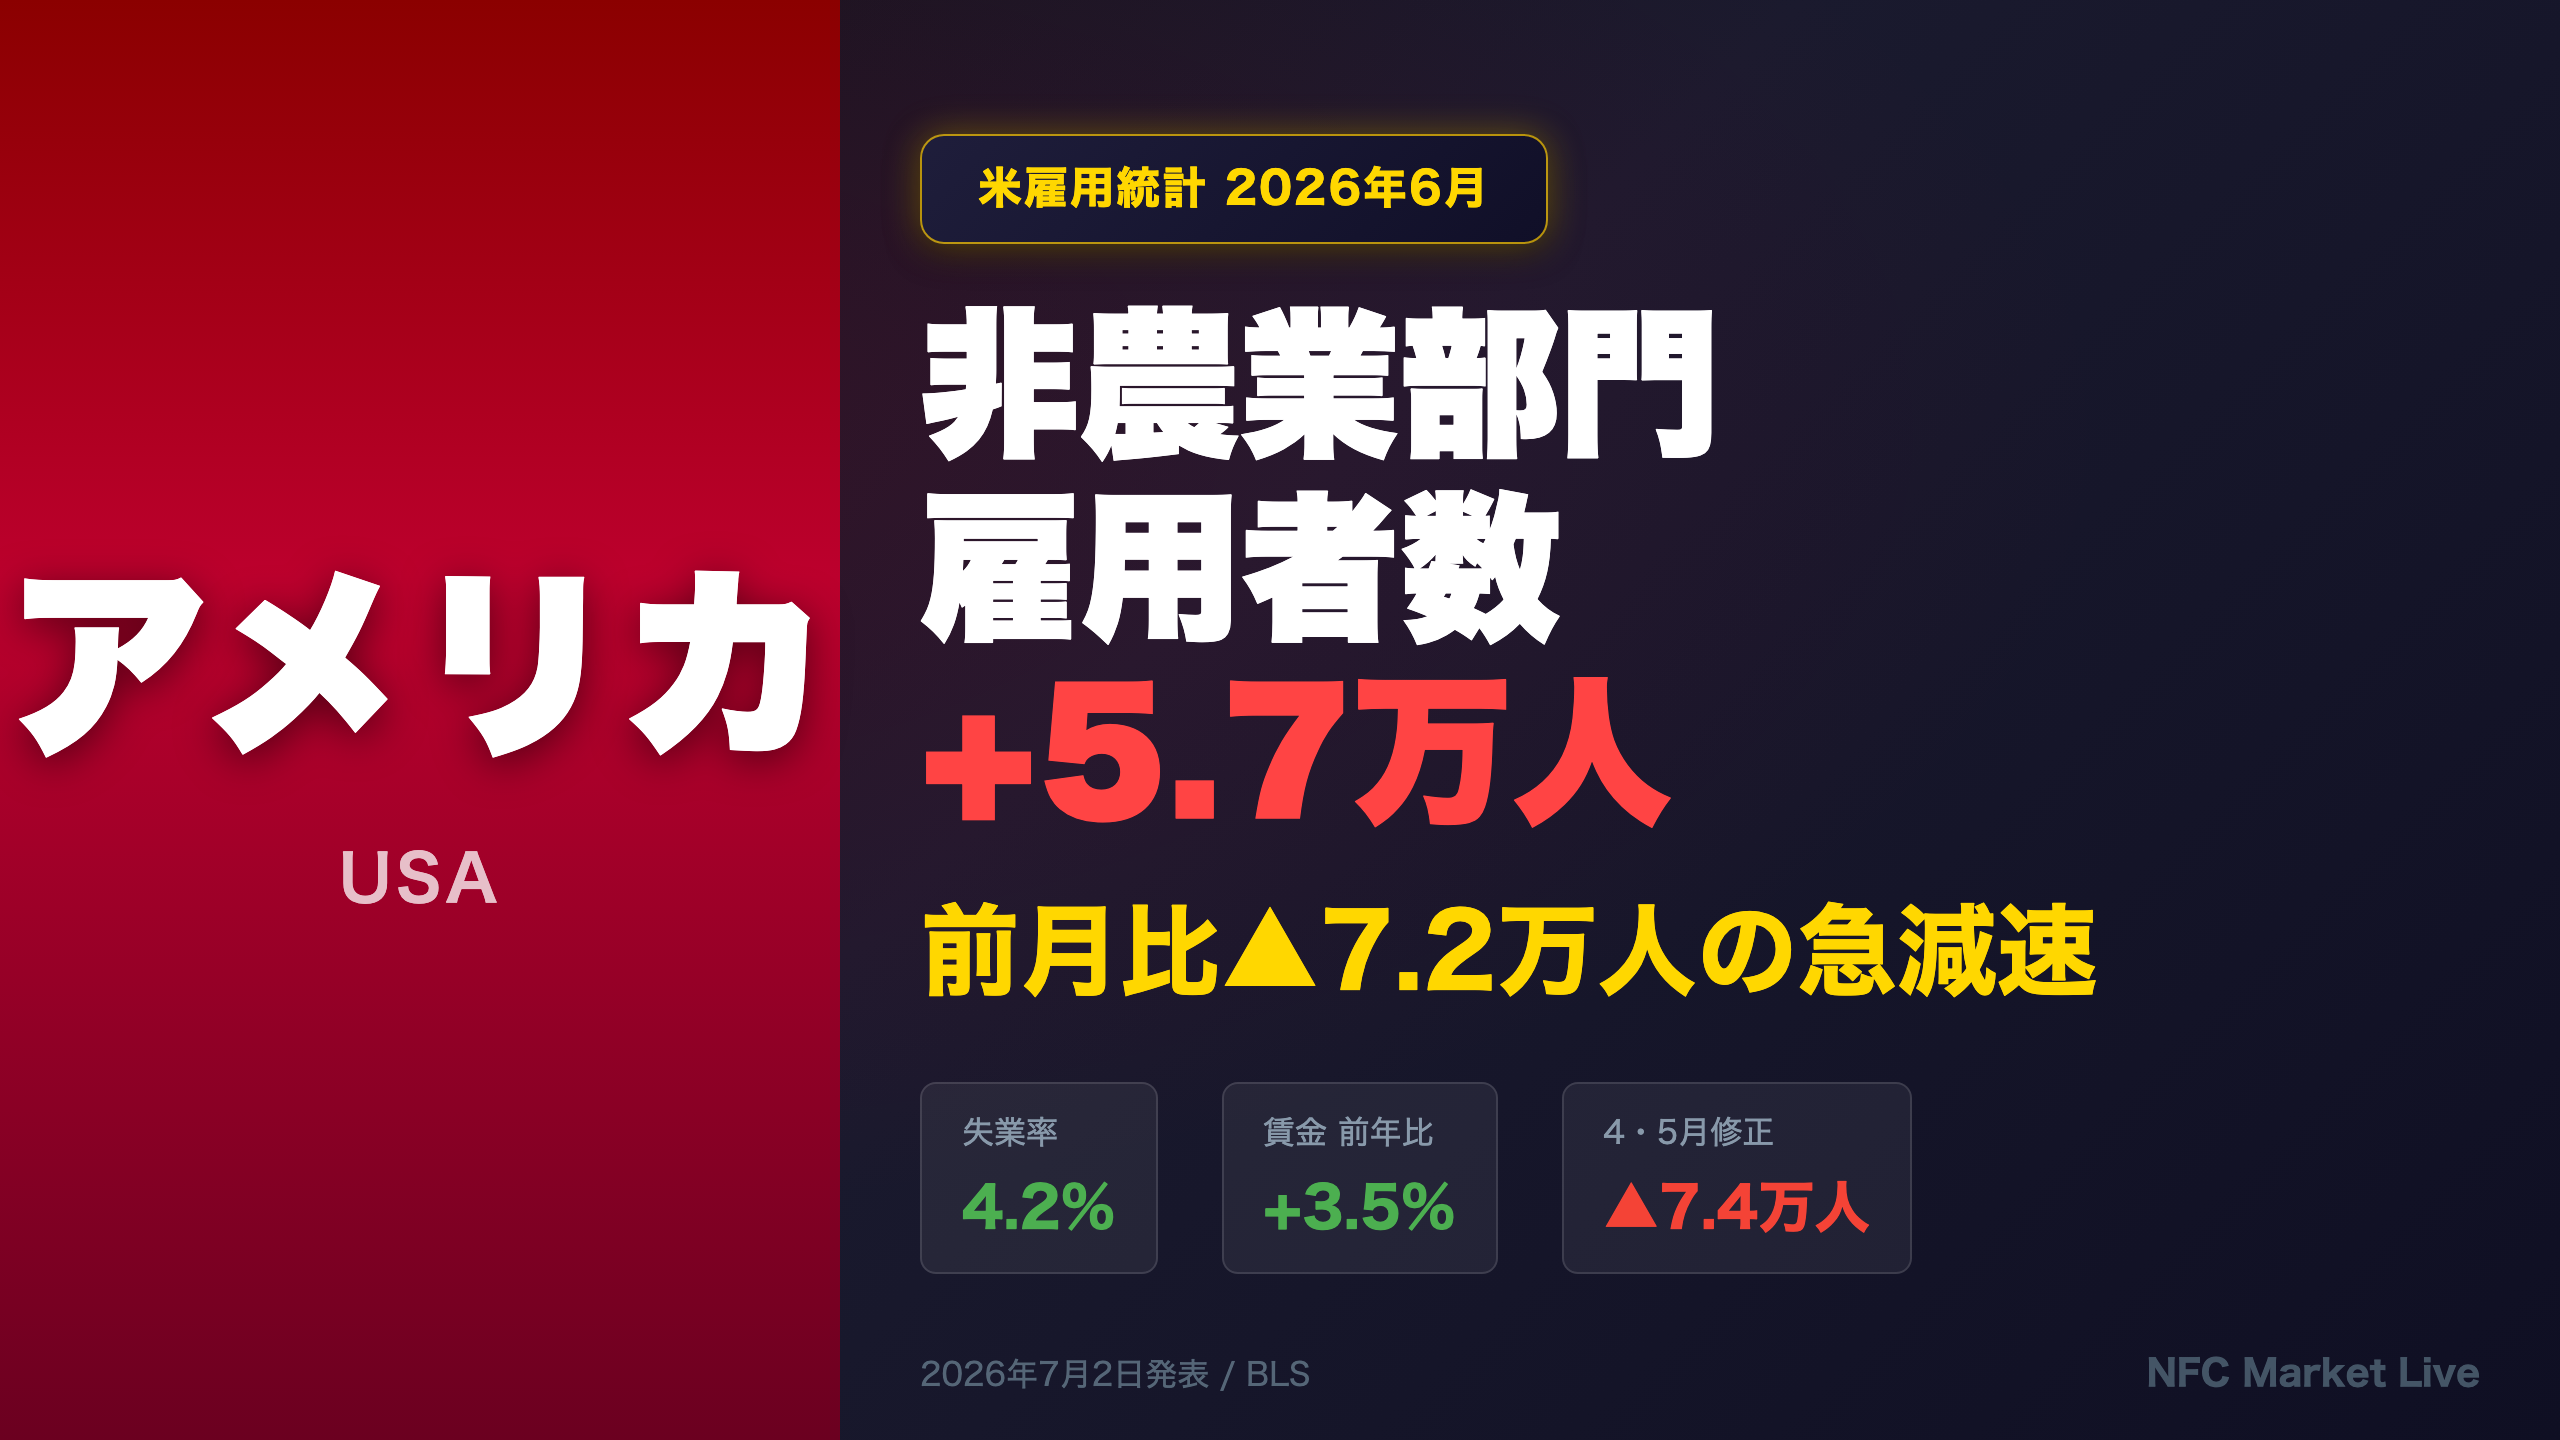
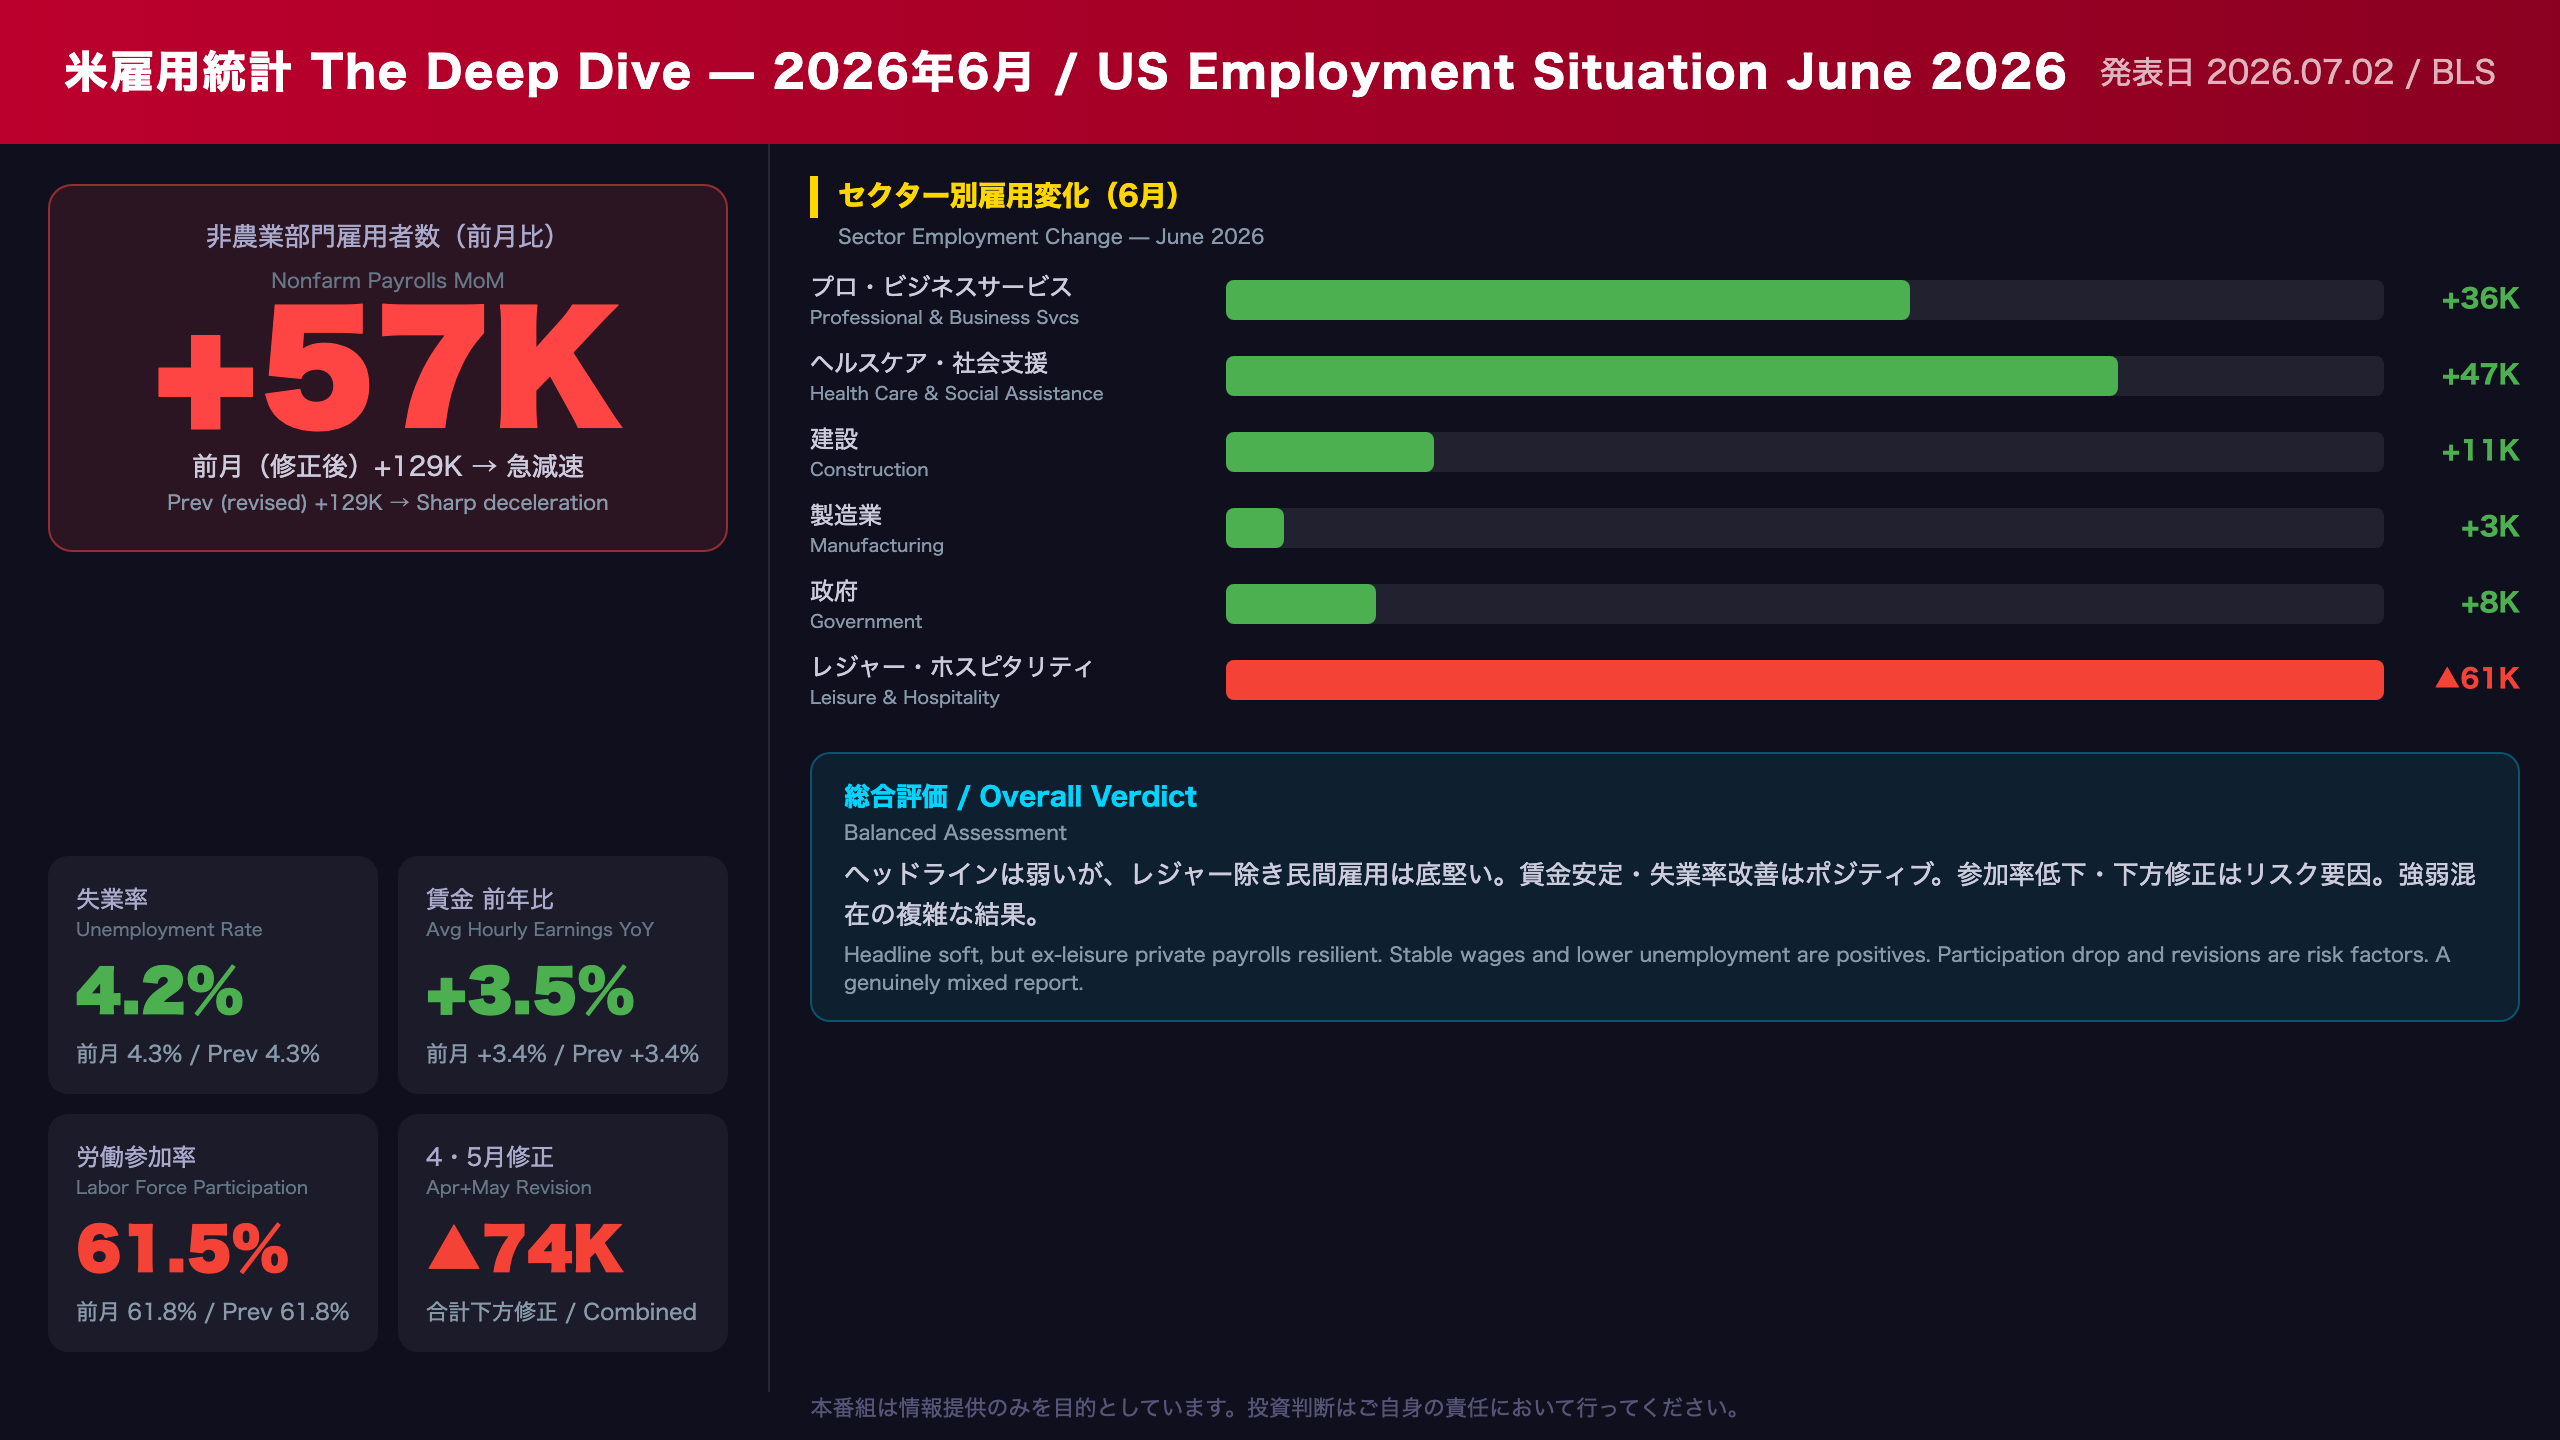
Deep dive into the June 2026 US Employment Situation report from BLS. Nonfarm payrolls came in at +57K — a sharp deceleration from May’s +129K (revised down). But strip out leisure & hospitality’s seasonal drag (-61K) and the underlying picture looks more resilient: professional services +36K, health/social assistance +47K, construction +11K. Unemployment ticked down to 4.2%. Wages +3.5% YoY. We also unpack the -74K combined downward revision to April and May. What does this mean for the Fed? Full analysis inside.
The Ultimate Summary:6月米雇用統計の全貌
June 2026 US Employment Situation: What the Headline Misses
About This Report
The Employment Situation is published monthly by the U.S. Bureau of Labor Statistics (BLS) and draws on two separate surveys: the Current Population Survey (CPS), a household survey of ~60,000 households that produces the unemployment rate; and the Current Employment Statistics (CES) survey, an establishment survey of ~119,000 businesses that produces the nonfarm payroll count. The two surveys can diverge significantly in any given month.
Key Numbers at a Glance
| Metric | June 2026 | May 2026 (revised) | June 2025 |
|---|---|---|---|
| Nonfarm Payrolls MoM | +57K | +129K | -20K |
| Unemployment Rate | 4.2% | 4.3% | 4.1% |
| Avg Hourly Earnings YoY | +3.5% | +3.4% | — |
| Labor Force Participation | 61.5% | 61.8% | 62.3% |
The Revision Story
A critical but often overlooked element: April was revised down by 31K (from +179K to +148K) and May was revised down by 43K (from +172K to +129K). The combined -74K revision means the labor market was adding fewer jobs than initially reported. The 3-month average now stands at +111K — still above the 12-month average of +36K, but the trend is clearly decelerating.
Leisure & Hospitality: Seasonal Distortion
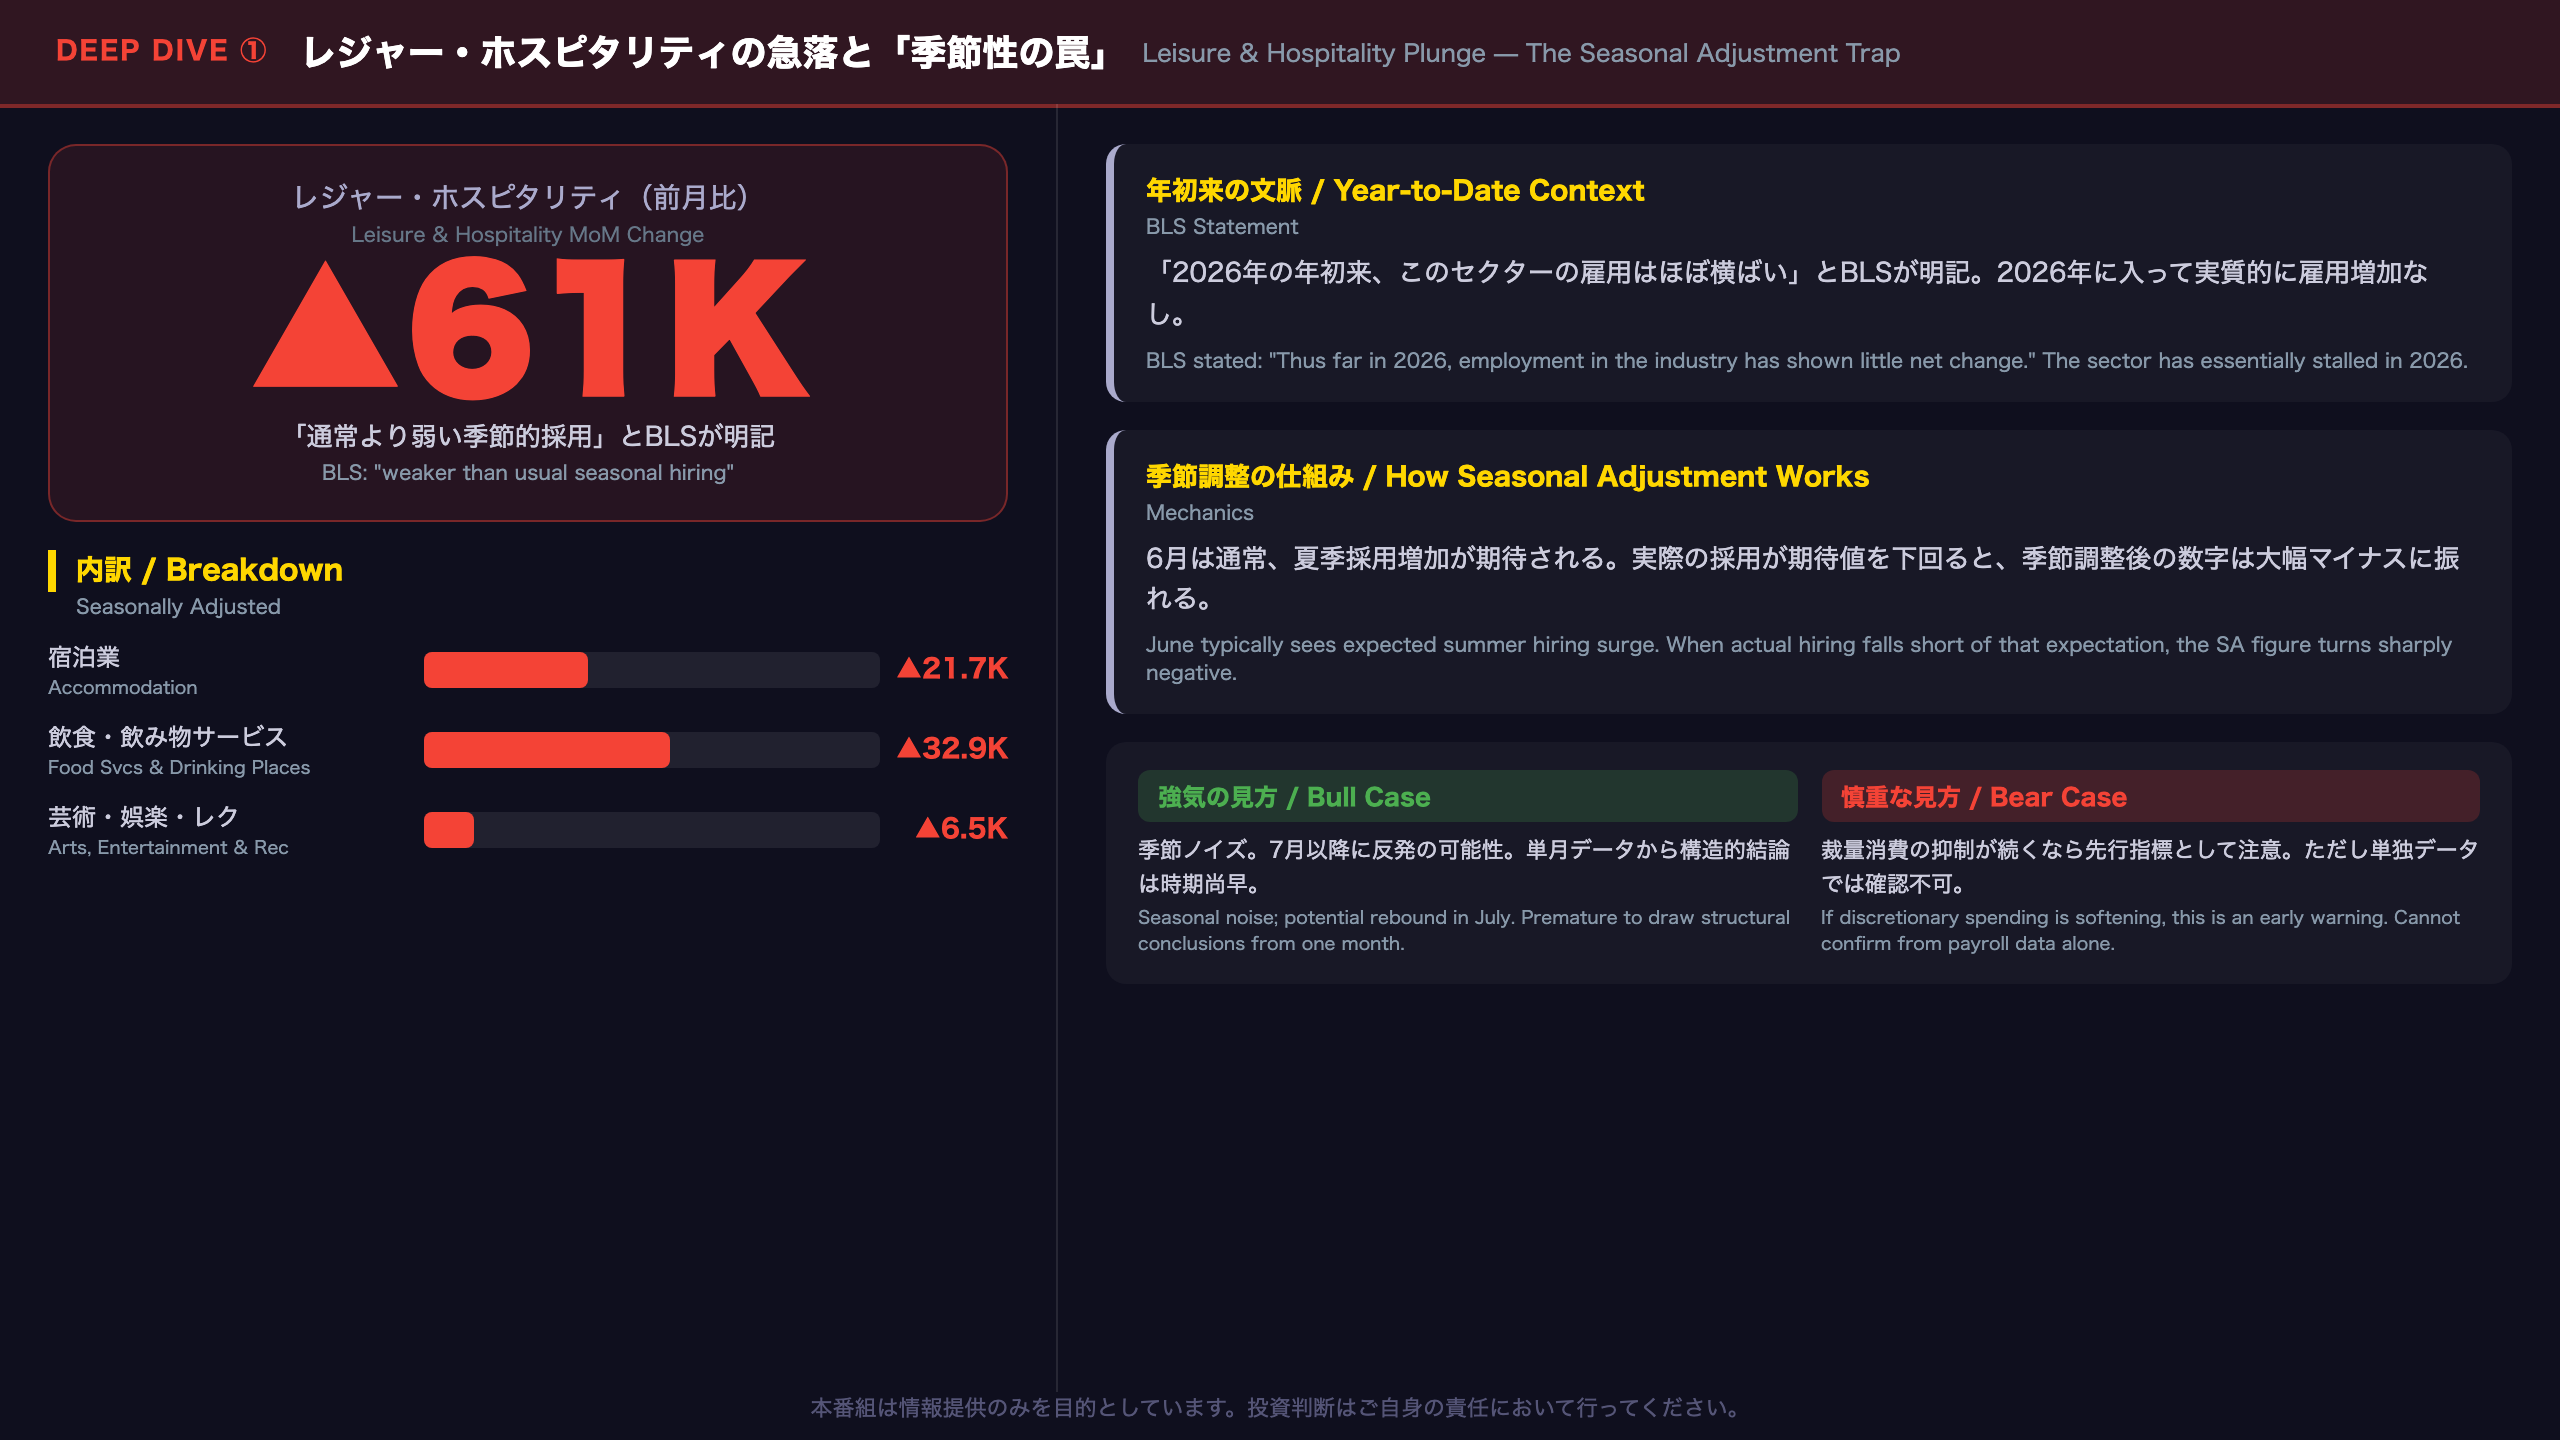
The BLS explicitly noted “weaker than usual seasonal hiring” in leisure and hospitality (-61K). In seasonal adjustment terms, this means actual hiring fell short of what the model expected for a typical June. This sector has shown “little net change” year-to-date in 2026, which may indicate structural softness in discretionary consumer spending — though a single month’s data is insufficient to confirm a trend.
Private Sector Resilience
Stripping out leisure & hospitality, the private sector added approximately +110K jobs — a more constructive picture. Professional and business services have now added +172K since their October 2025 trough. Health care and social assistance continue their structural growth trend driven by demographic demand. Construction’s +11K gain is consistent with ongoing infrastructure activity.
Fed Implications
For the Federal Reserve, this report is genuinely ambiguous. The soft headline and downward revisions provide some justification for rate cuts, while stable wage growth (+3.5% YoY) and continued private-sector job creation argue against urgency. The drop in labor force participation to 61.5% is a wildcard — it mechanically reduces the unemployment rate but may reflect discouraged workers exiting the labor force rather than genuine labor market strength. The next Employment Situation release is scheduled for August 7, 2026.
Deep Dive①:レジャー・ホスピタリティの急落と「季節性の罠」
Leisure & Hospitality: Seasonal Trap or Structural Warning?
How Seasonal Adjustment Works
The BLS uses a concurrent seasonal adjustment methodology, recalculating seasonal factors each month using all available data. For June, the model expects a surge in summer hiring in leisure and hospitality. When actual hiring falls short of that expectation, the seasonally adjusted figure turns sharply negative — even if raw (not seasonally adjusted) employment actually increased.
This is precisely what happened in June 2026. The BLS stated: “Leisure and hospitality employment declined by 61,000 in June, reflecting weaker than usual seasonal hiring.”
Breakdown
- Accommodation: -21.7K (seasonally adjusted)
- Food services and drinking places: -32.9K (seasonally adjusted)
- Arts, entertainment, and recreation: -6.5K (seasonally adjusted)
Year-to-Date Context
The BLS noted that “thus far in 2026, employment in the industry has shown little net change.” This is a meaningful statement: the sector that was a major engine of post-pandemic job growth has essentially flatlined in 2026. For comparison, leisure and hospitality lost 2K jobs in June 2025 on a seasonally adjusted basis.
Bull vs. Bear Interpretation
Bull case: This is seasonal noise. The sector may rebound in July as summer activity picks up. Drawing structural conclusions from a single month’s data is premature.
Bear case: If consumers are pulling back on discretionary spending (dining out, travel, entertainment), this sector serves as an early warning indicator. However, this interpretation requires corroboration from consumer spending data — it cannot be confirmed from payroll data alone.
International Context
For comparison, the UK and Eurozone have also seen service sector employment growth moderate in 2026, suggesting some common global factors may be at play beyond US-specific dynamics.
Deep Dive②:民間部門の自律的強さ——プロサービス・ヘルスケア・建設
Private Sector Resilience: Three Engines of Autonomous Job Creation
Professional & Business Services: Sustained Recovery
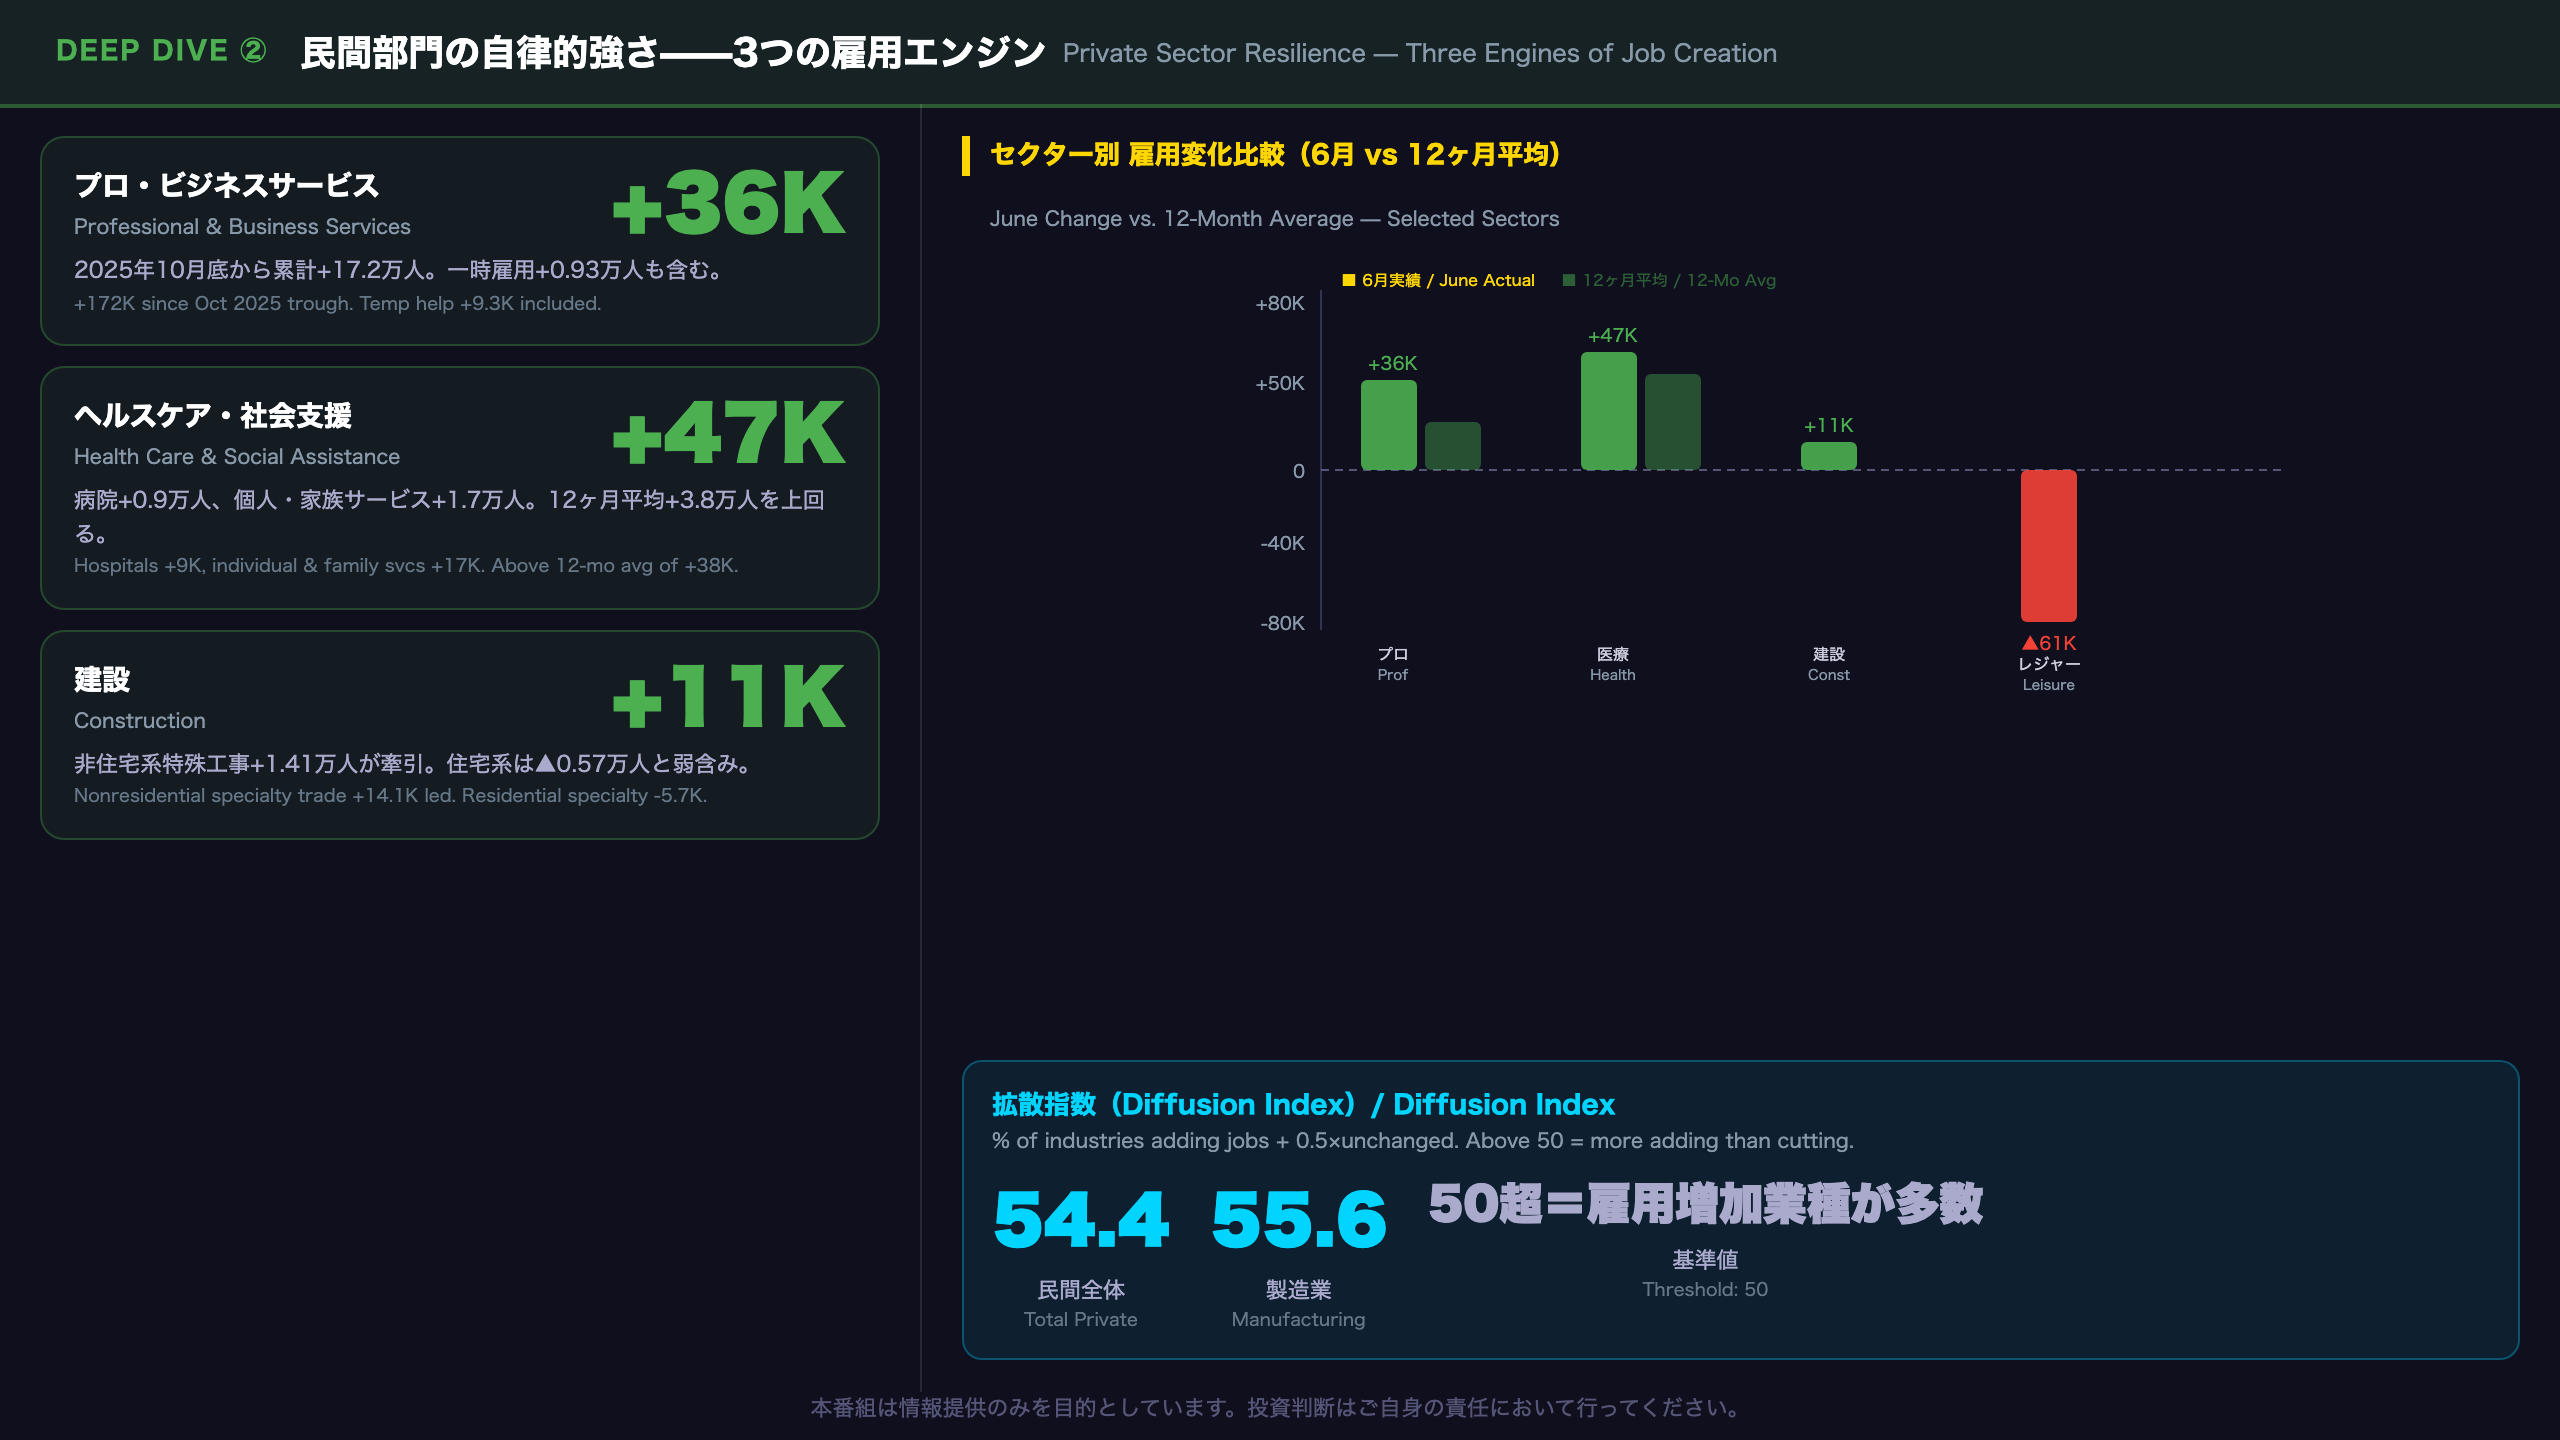
The +36K gain in June extends what the BLS describes as a recovery from a “recent low in October 2025,” with the sector having added 172K jobs over that period. Key sub-components:
- Professional, scientific & technical services: +18.2K (computer systems design +4.3K, architectural/engineering +0.6K)
- Administrative & support services: +19.0K (employment services +14.1K, of which temporary help +9.3K)
The +9.3K gain in temporary help services is worth monitoring. Temporary employment is often considered a leading indicator of permanent hiring, as firms tend to use temp workers to test demand before committing to full-time hires. However, a single month’s data is insufficient to confirm a trend.
Health Care & Social Assistance: Demographic Tailwind
At +47K, this sector exceeded its 12-month average of +38K. Hospitals added 9K, home health care +3.3K, and individual and family services +16.6K. The structural demand from an aging population provides a durable floor for employment in this sector that is relatively insensitive to the business cycle.
Construction: Non-Residential Leading
While residential specialty trade contractors declined 5.7K (consistent with elevated mortgage rates), nonresidential specialty trade contractors added 14.1K. The resilience of non-residential construction (commercial, infrastructure) despite high interest rates suggests that infrastructure spending programs continue to support employment in this sector.
Diffusion Index Signal
The private sector diffusion index came in at 54.4 (above 50 = more industries adding than cutting jobs). Manufacturing’s diffusion index improved to 55.6 from 52.8 in May. A reading above 50 means job-adding industries outnumber job-cutting ones — a sign of broad-based, if modest, employment growth.
Deep Dive③:下方修正と労働参加率低下——労働市場の緩やかな軟化シグナル
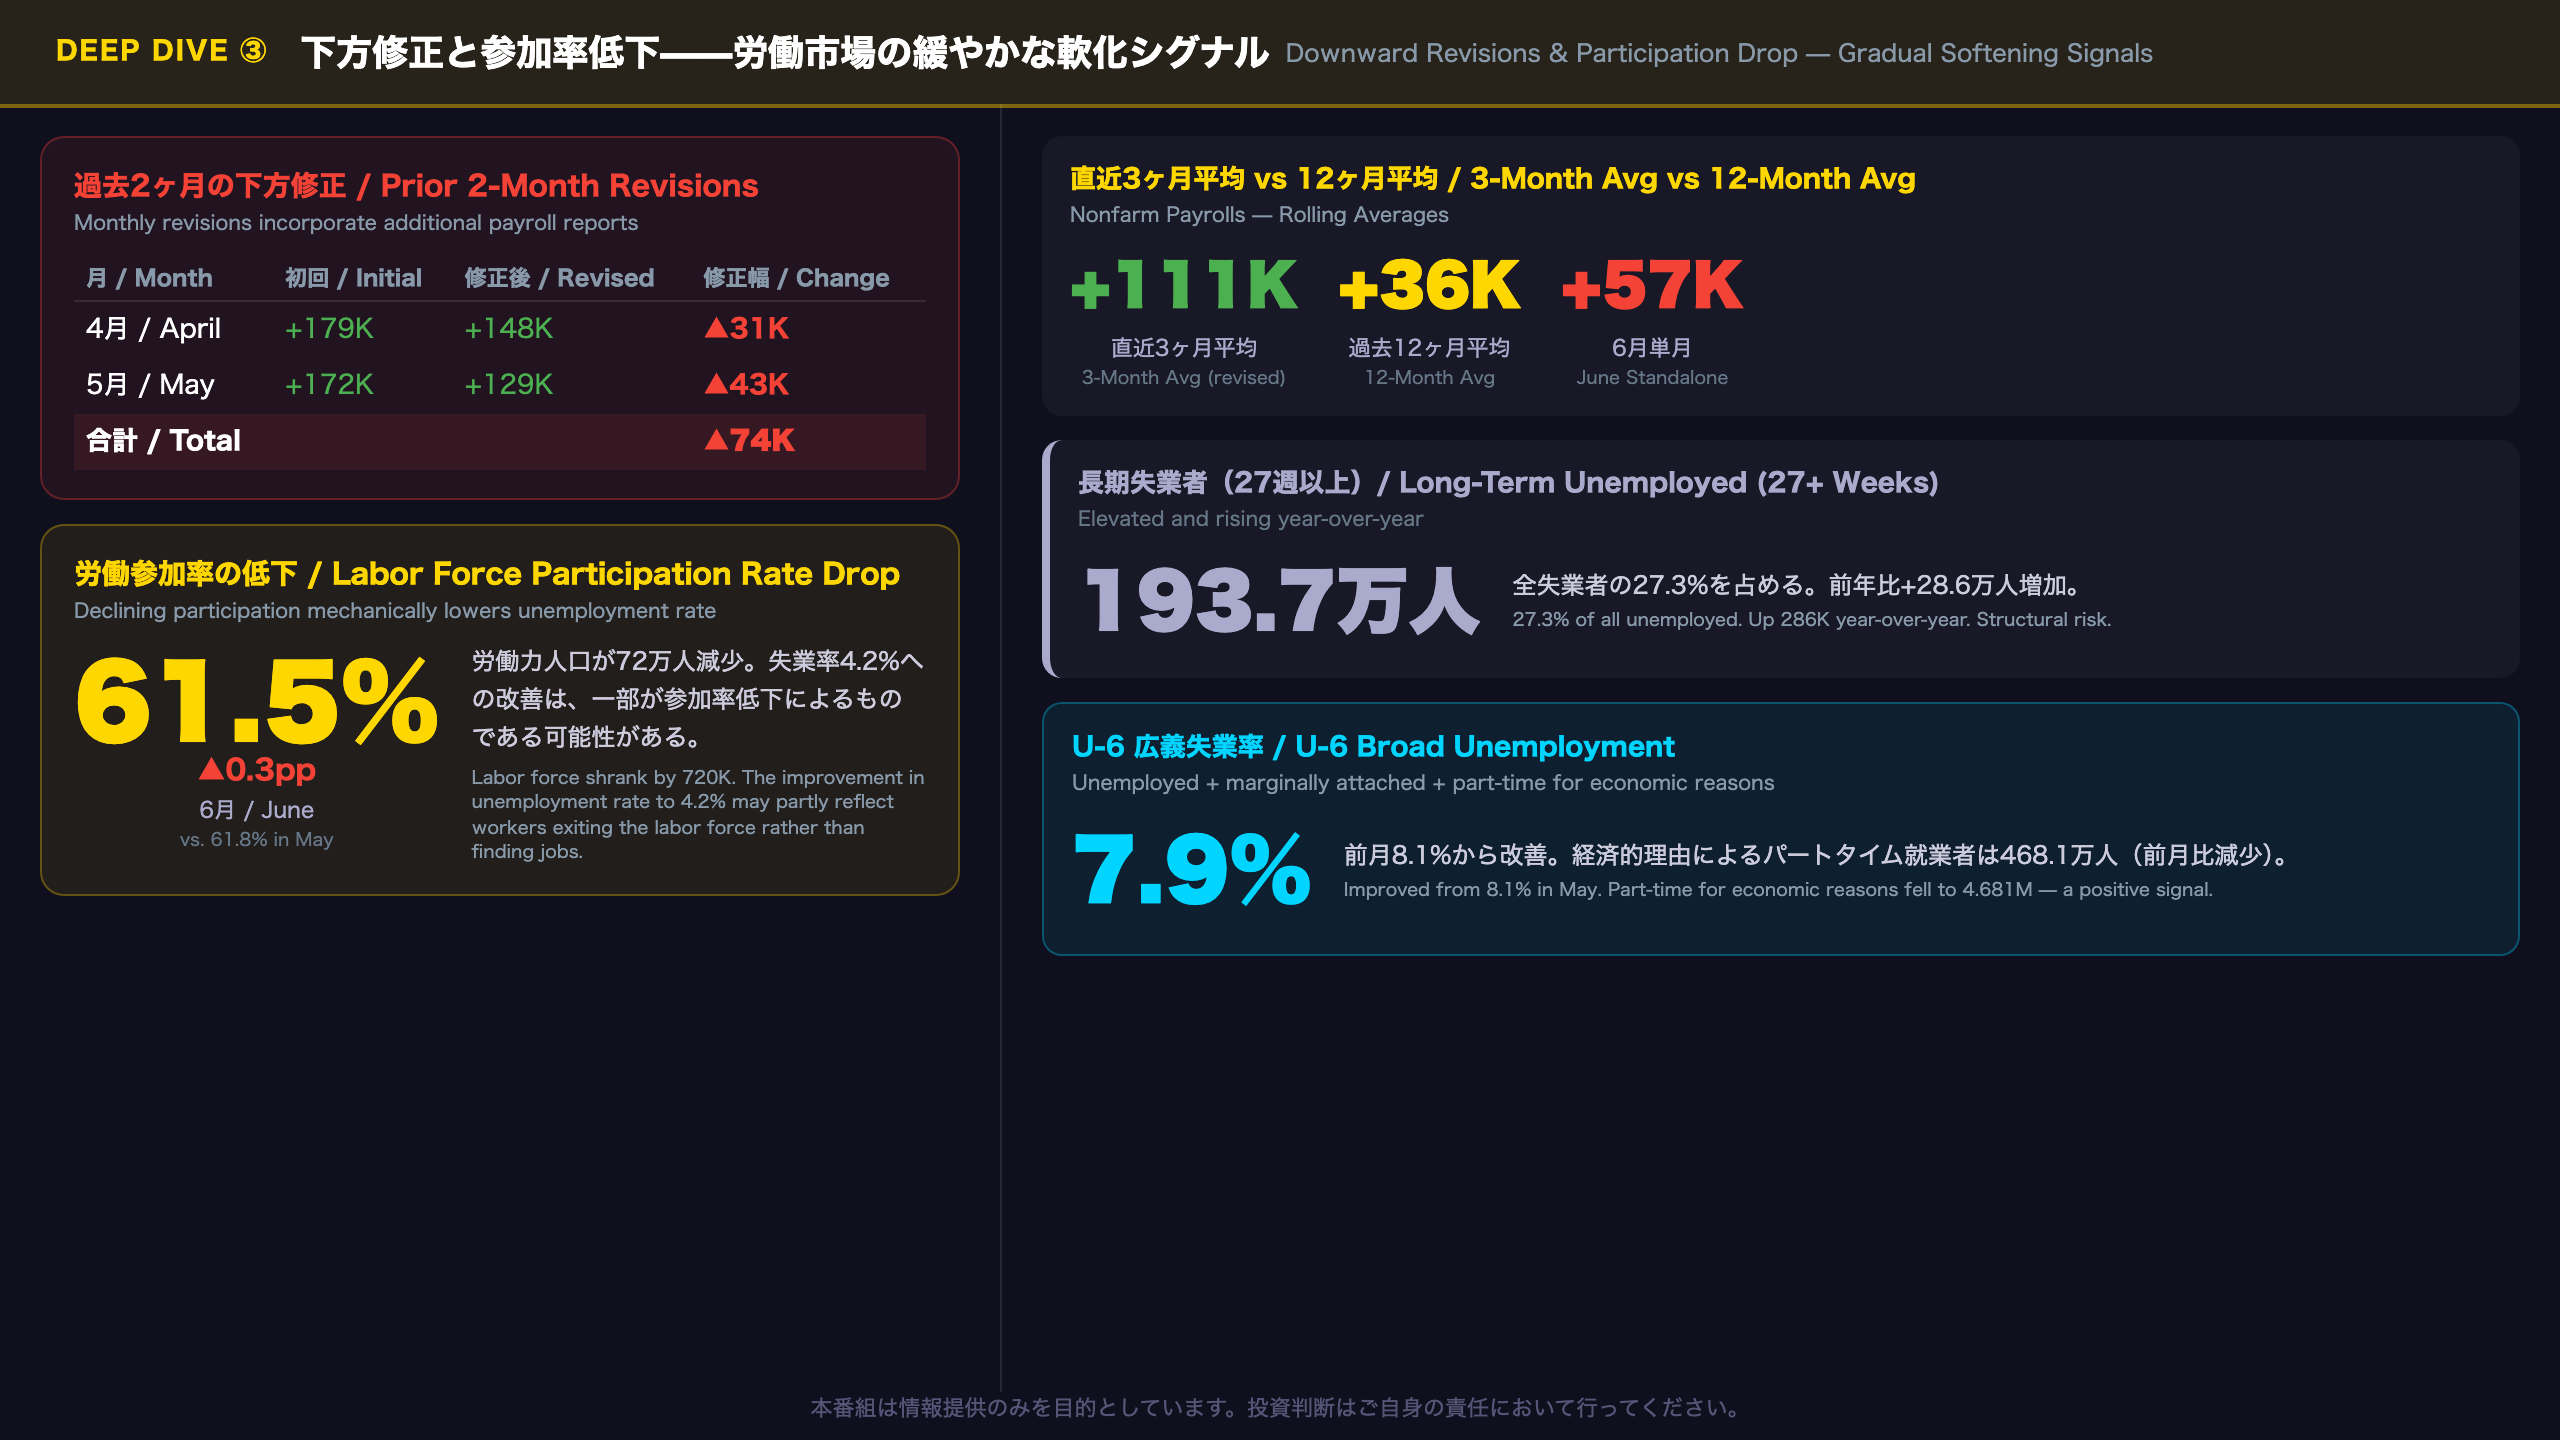
Downward Revisions and Participation Drop: Two Signals of Gradual Labor Market Softening
The Revision Story in Detail
Monthly revisions are a normal part of the BLS estimation process — the establishment survey revises the prior two months as additional payroll reports are received. However, the scale of this month’s revisions is notable:
| Month | Initial | Revised | Change |
|---|---|---|---|
| April | +179K | +148K | -31K |
| May | +172K | +129K | -43K |
| Total | -74K |
The 3-month average (April through June) now stands at +111K — still above the 12-month average of +36K, but significantly below what the pre-revision numbers suggested (~+177K). This matters because financial markets and the Fed use these numbers to calibrate their assessments of labor market momentum.
Labor Force Participation: Questioning the Quality of Unemployment Rate Improvement
The unemployment rate improved from 4.3% to 4.2%, but simultaneously, the labor force participation rate fell from 61.8% to 61.5% — a 0.3 percentage point decline. In absolute terms, the civilian labor force shrank by 720 thousand people.
Since the unemployment rate is calculated as unemployed / labor force, a shrinking labor force mechanically lowers the rate even if the number of unemployed people doesn’t change. The improvement in the unemployment rate should therefore be interpreted cautiously — it may partly reflect workers exiting the labor force (discouraged workers, early retirees) rather than finding employment.
Long-Term Unemployment Remains Elevated
Long-term unemployed (27+ weeks) stood at 1.937 million in June, accounting for 27.3% of all unemployed. While this is slightly below May’s 1.988 million, it is up 286 thousand over the year. Persistent long-term unemployment can indicate structural mismatches between available jobs and worker skills — a concern for both labor market health and potential inflationary pressure from wage demands.
U-6 Broad Unemployment
The U-6 measure (unemployed + marginally attached + part-time for economic reasons) improved to 7.9% from 8.1% in May. The decline in part-time for economic reasons to 4.681 million is a positive signal, suggesting fewer workers are being forced into part-time arrangements against their preference.
Deep Dive④:賃金と労働時間——インフレ・生産性の複合シグナル
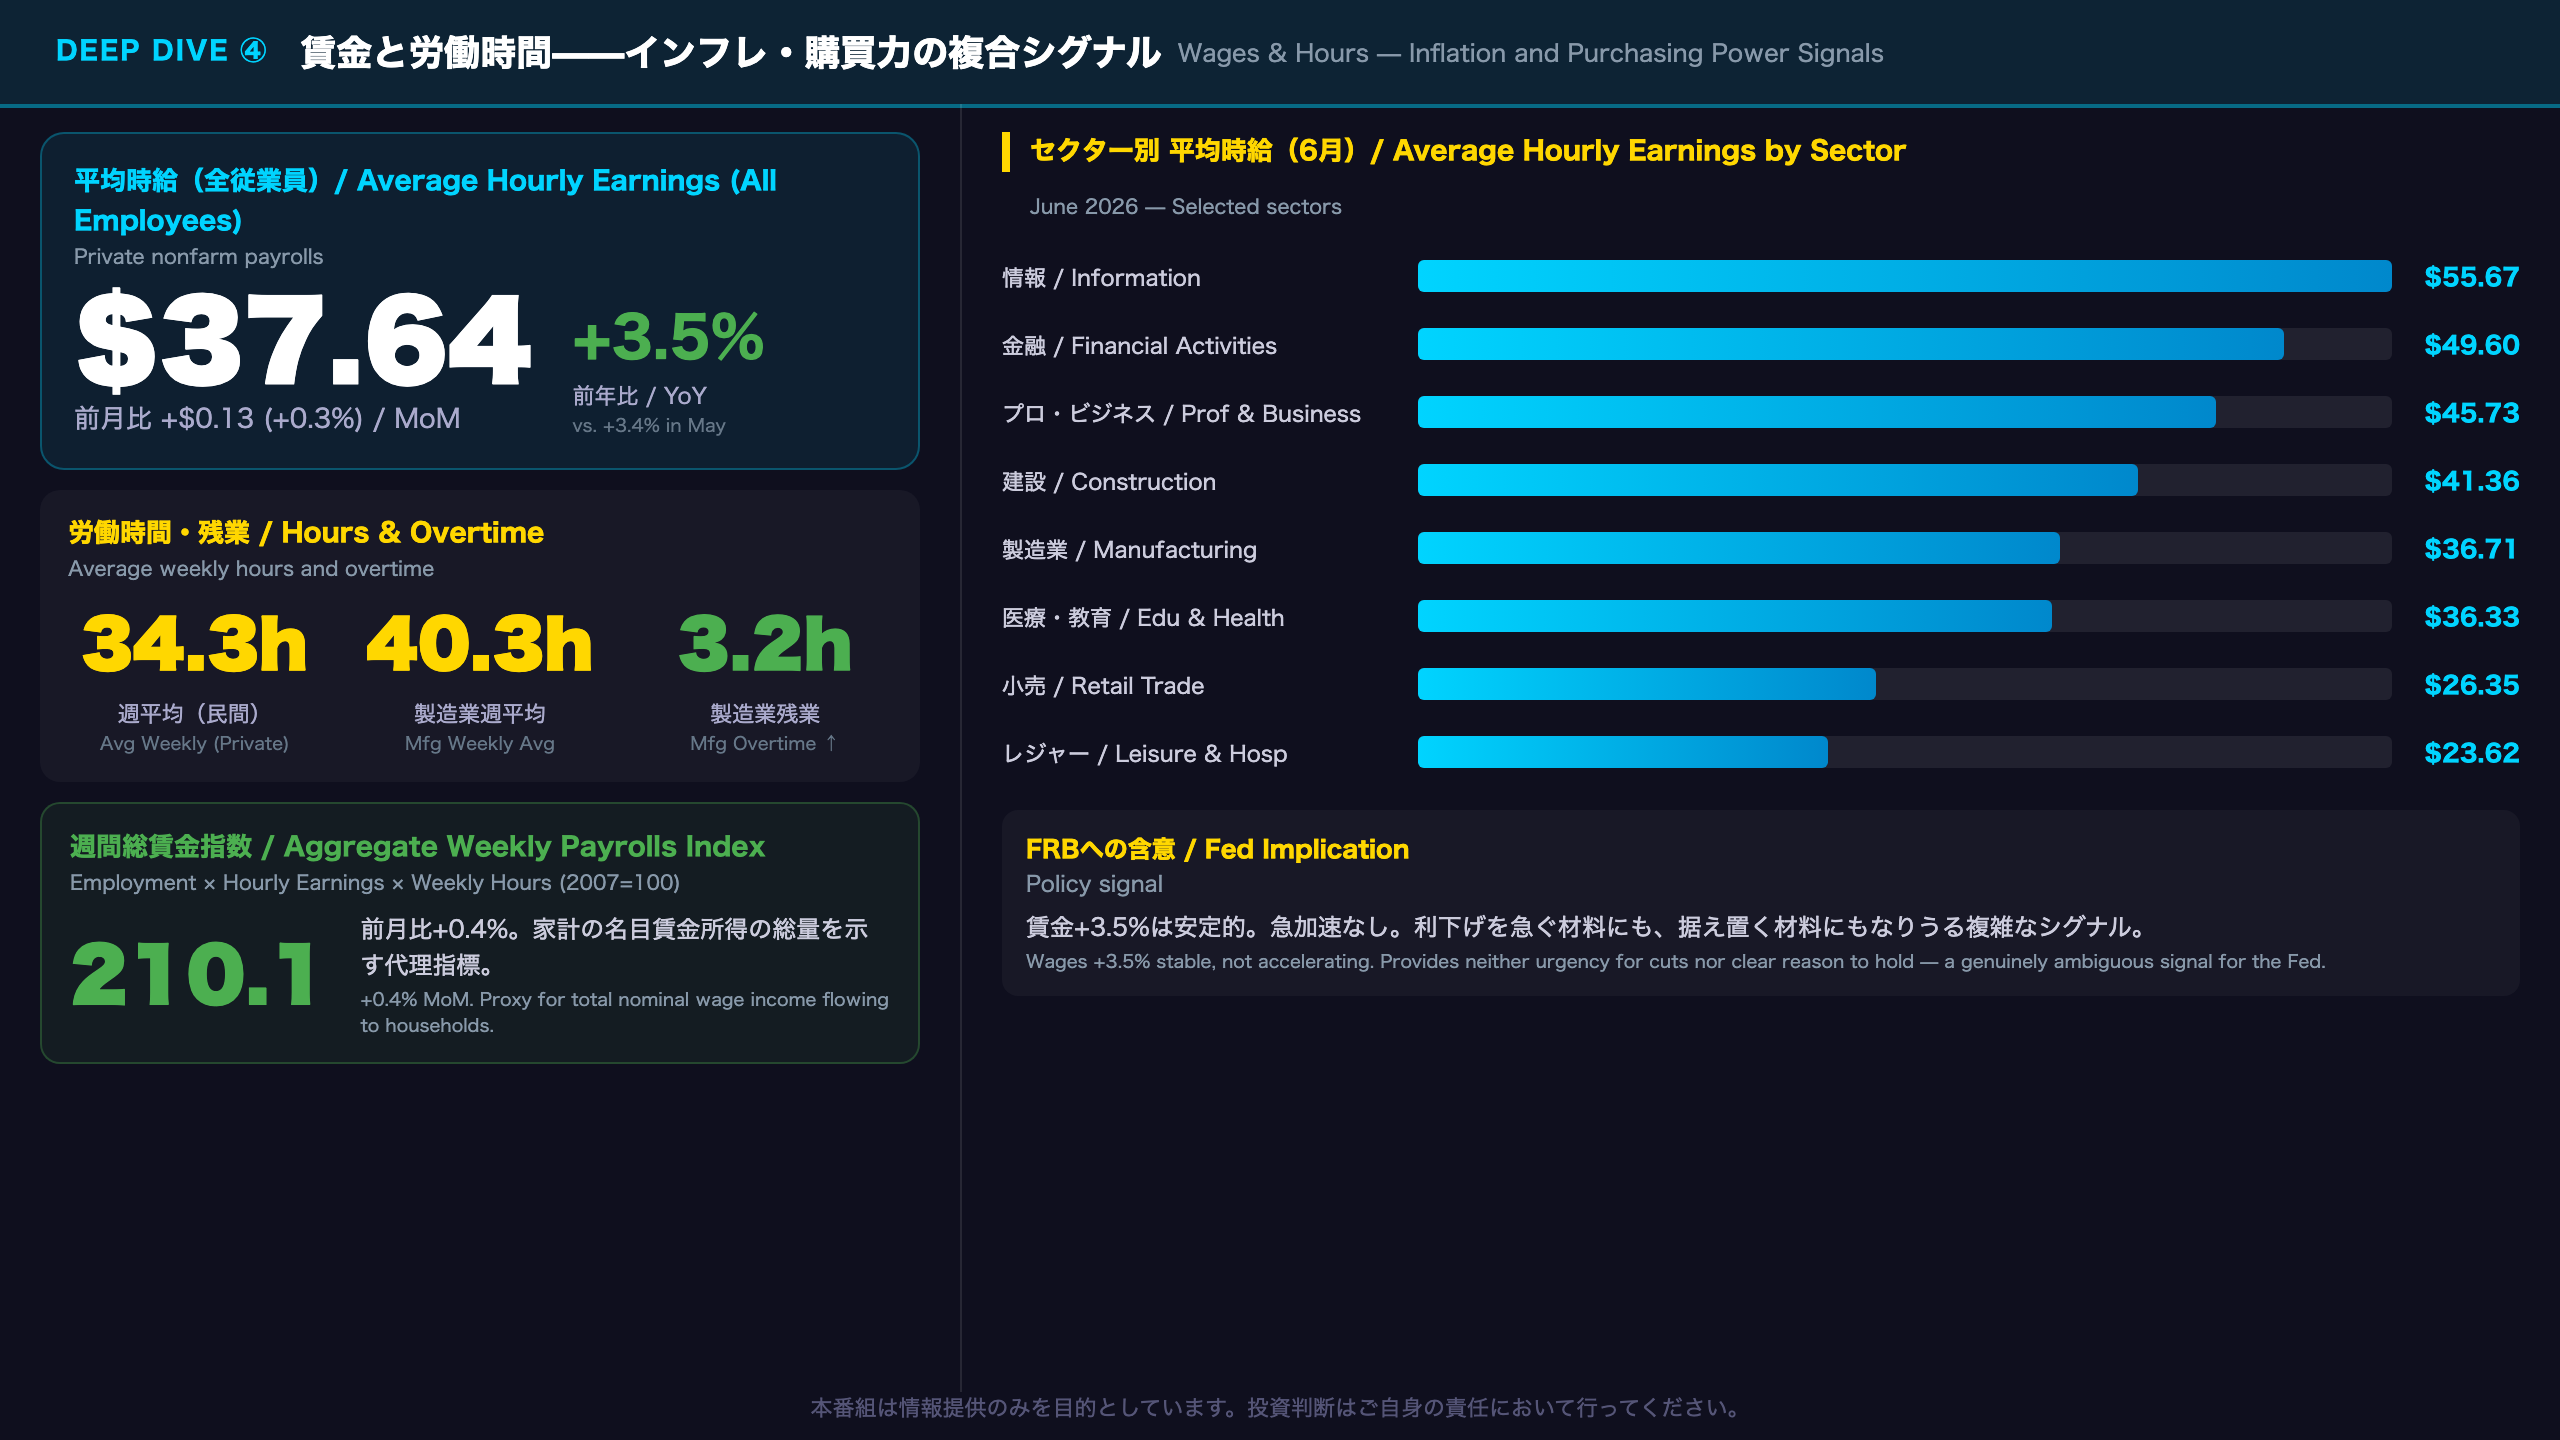
Wages and Hours: Inflation and Purchasing Power Signals
Wage Detail
All employees, average hourly earnings: $37.64 (+$0.13 MoM, +0.3%)
– Year-over-year: +3.5% (slight acceleration from May’s +3.4%)
– June 2025 comparison: $36.36
Production and nonsupervisory employees: $32.38 (+$0.07 MoM, +0.2%)
By sector, information ($55.67), financial activities ($49.60), and professional/business services ($45.73) command the highest wages. Leisure and hospitality ($23.62) remains the lowest-paid major sector.
The Significance of Hours
Average weekly hours held steady at 34.3 hours. This matters because total labor input = employment × hours. Even with modest payroll gains, stable hours mean total labor input (measured by the aggregate weekly hours index) rose only 0.1% to 116.8 — a modest but positive signal.
Aggregate Weekly Payrolls Index: Household Purchasing Power Proxy
The index of aggregate weekly payrolls (2007=100) rose 0.4% to 210.1. This composite measure — employment × hourly earnings × weekly hours — represents the total wage income flowing to households. Year-over-year, this index has risen approximately 4.4%, suggesting nominal household purchasing power remains intact.
Fed Implications
Wage growth of +3.5% YoY sits above what is generally considered consistent with the Fed’s 2% inflation target (assuming ~1.5% productivity growth, wage growth of ~3.5% could be inflationary). However, the pace is not accelerating sharply, and the Fed will weigh this against the softening headline payroll number. In general, sustained above-target wage growth is thought to risk feeding into services inflation through higher labor costs — but this data point alone is insufficient to draw that conclusion with confidence.
インプリケーション:FRBの政策判断と市場への示唆
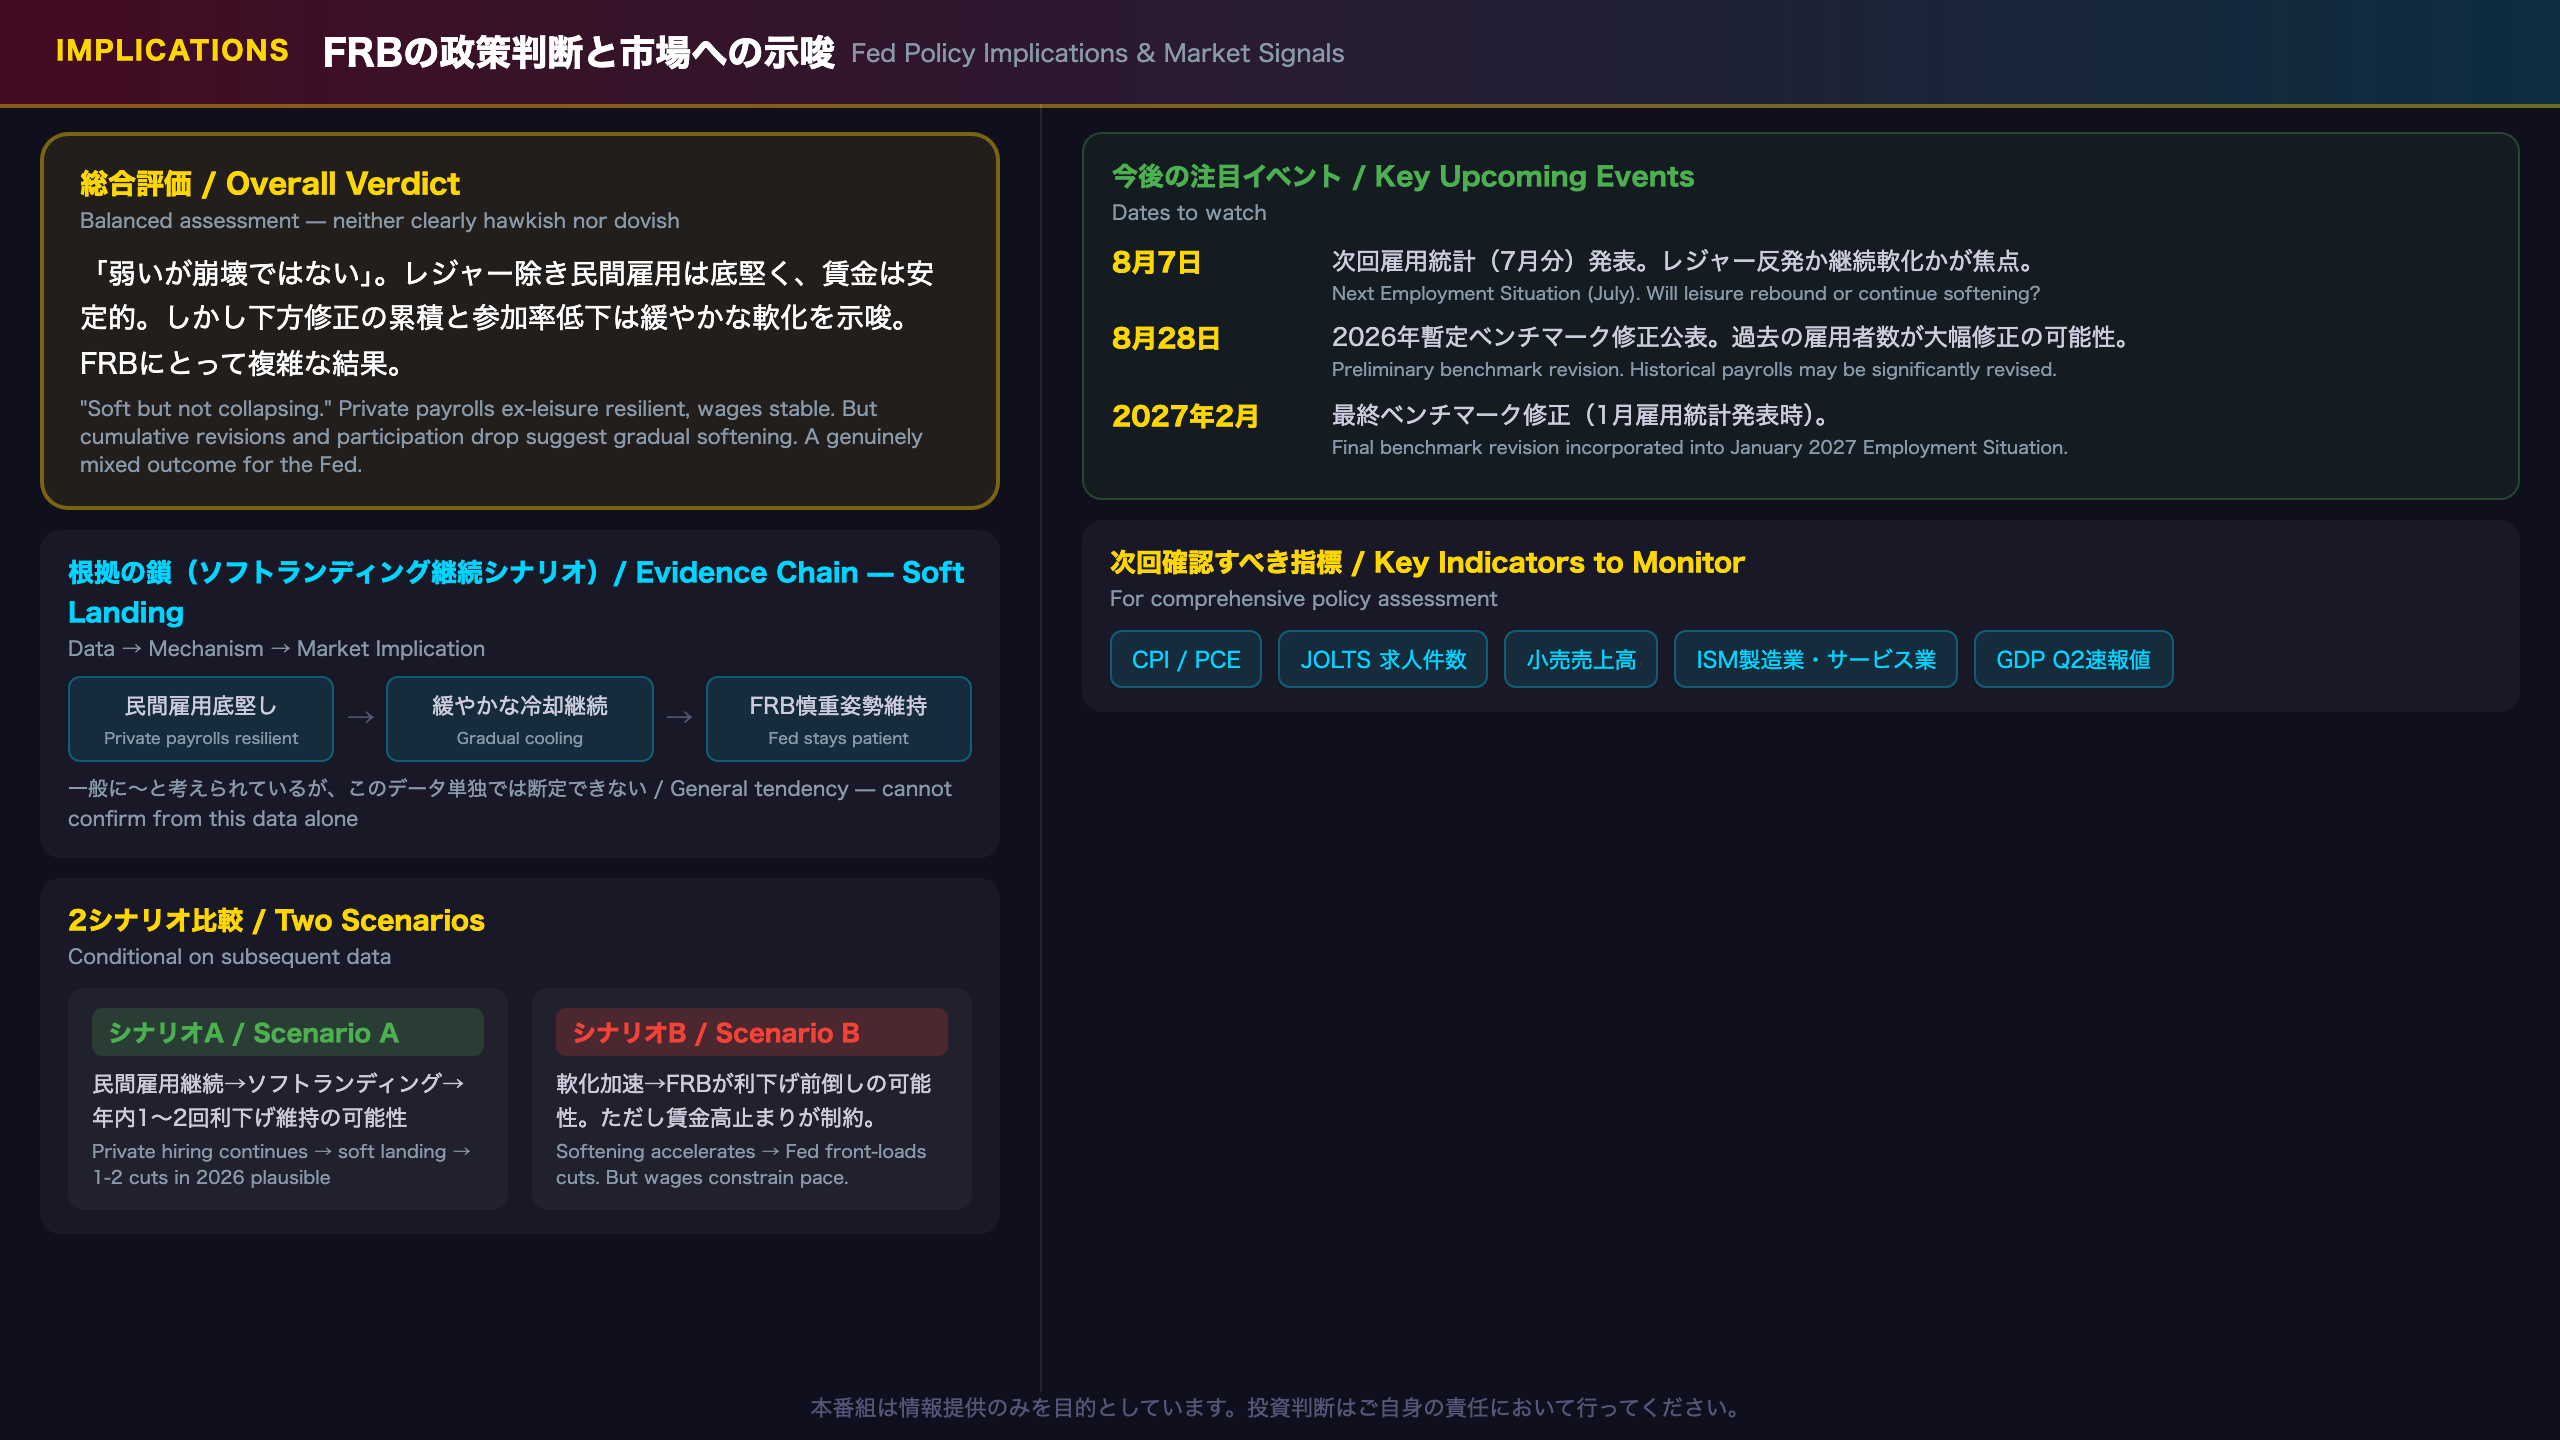
Implications: Fed Policy and Market Signals
The Evidence Chain Framework
Scenario A (Soft Landing Continues)
– [Resilient private payrolls ex-leisure (+83K combined)] → [Labor market cooling gradually, not collapsing] → [Fed maintains patient stance; 1-2 cuts in 2026 remain plausible]
– Caveat: “1-2 cuts” cannot be confirmed from this data alone. Requires corroboration from CPI, PCE, and JOLTS.
Scenario B (Earlier Rate Cuts)
– [Headline +57K + combined -74K revision + participation drop] → [Labor market softening faster than expected] → [Fed may front-load rate cuts]
– Caveat: Wage growth at +3.5% YoY constrains the Fed’s ability to cut aggressively without risking inflation re-acceleration.
Key Dates to Watch
- Next Employment Situation (August 7, 2026): Will leisure & hospitality rebound? Will private sector momentum continue?
- Preliminary Benchmark Revision (August 28, 2026): BLS will publish the preliminary estimate of the annual benchmark revision based on QCEW data. This could significantly revise historical payroll counts. The final benchmark revision will be incorporated into the January 2027 Employment Situation release.
- CPI and PCE Deflator: Critical to determine whether wage growth of +3.5% is feeding into consumer prices.
- JOLTS (Job Openings and Labor Turnover Survey): Job openings data serves as a leading indicator of labor demand.
Overall Assessment
The most accurate characterization of this report is “soft but not collapsing.” Private payrolls ex-leisure remain resilient, wages are stable, and the unemployment rate edged lower. However, the cumulative downward revisions and participation rate decline suggest the labor market may be gradually softening. For the Fed, this report provides arguments both for and against near-term rate cuts — a genuinely mixed outcome that is unlikely to force a decisive policy pivot in either direction.
Disclaimer: This article is for informational purposes only. All investment decisions are made solely at your own risk.







