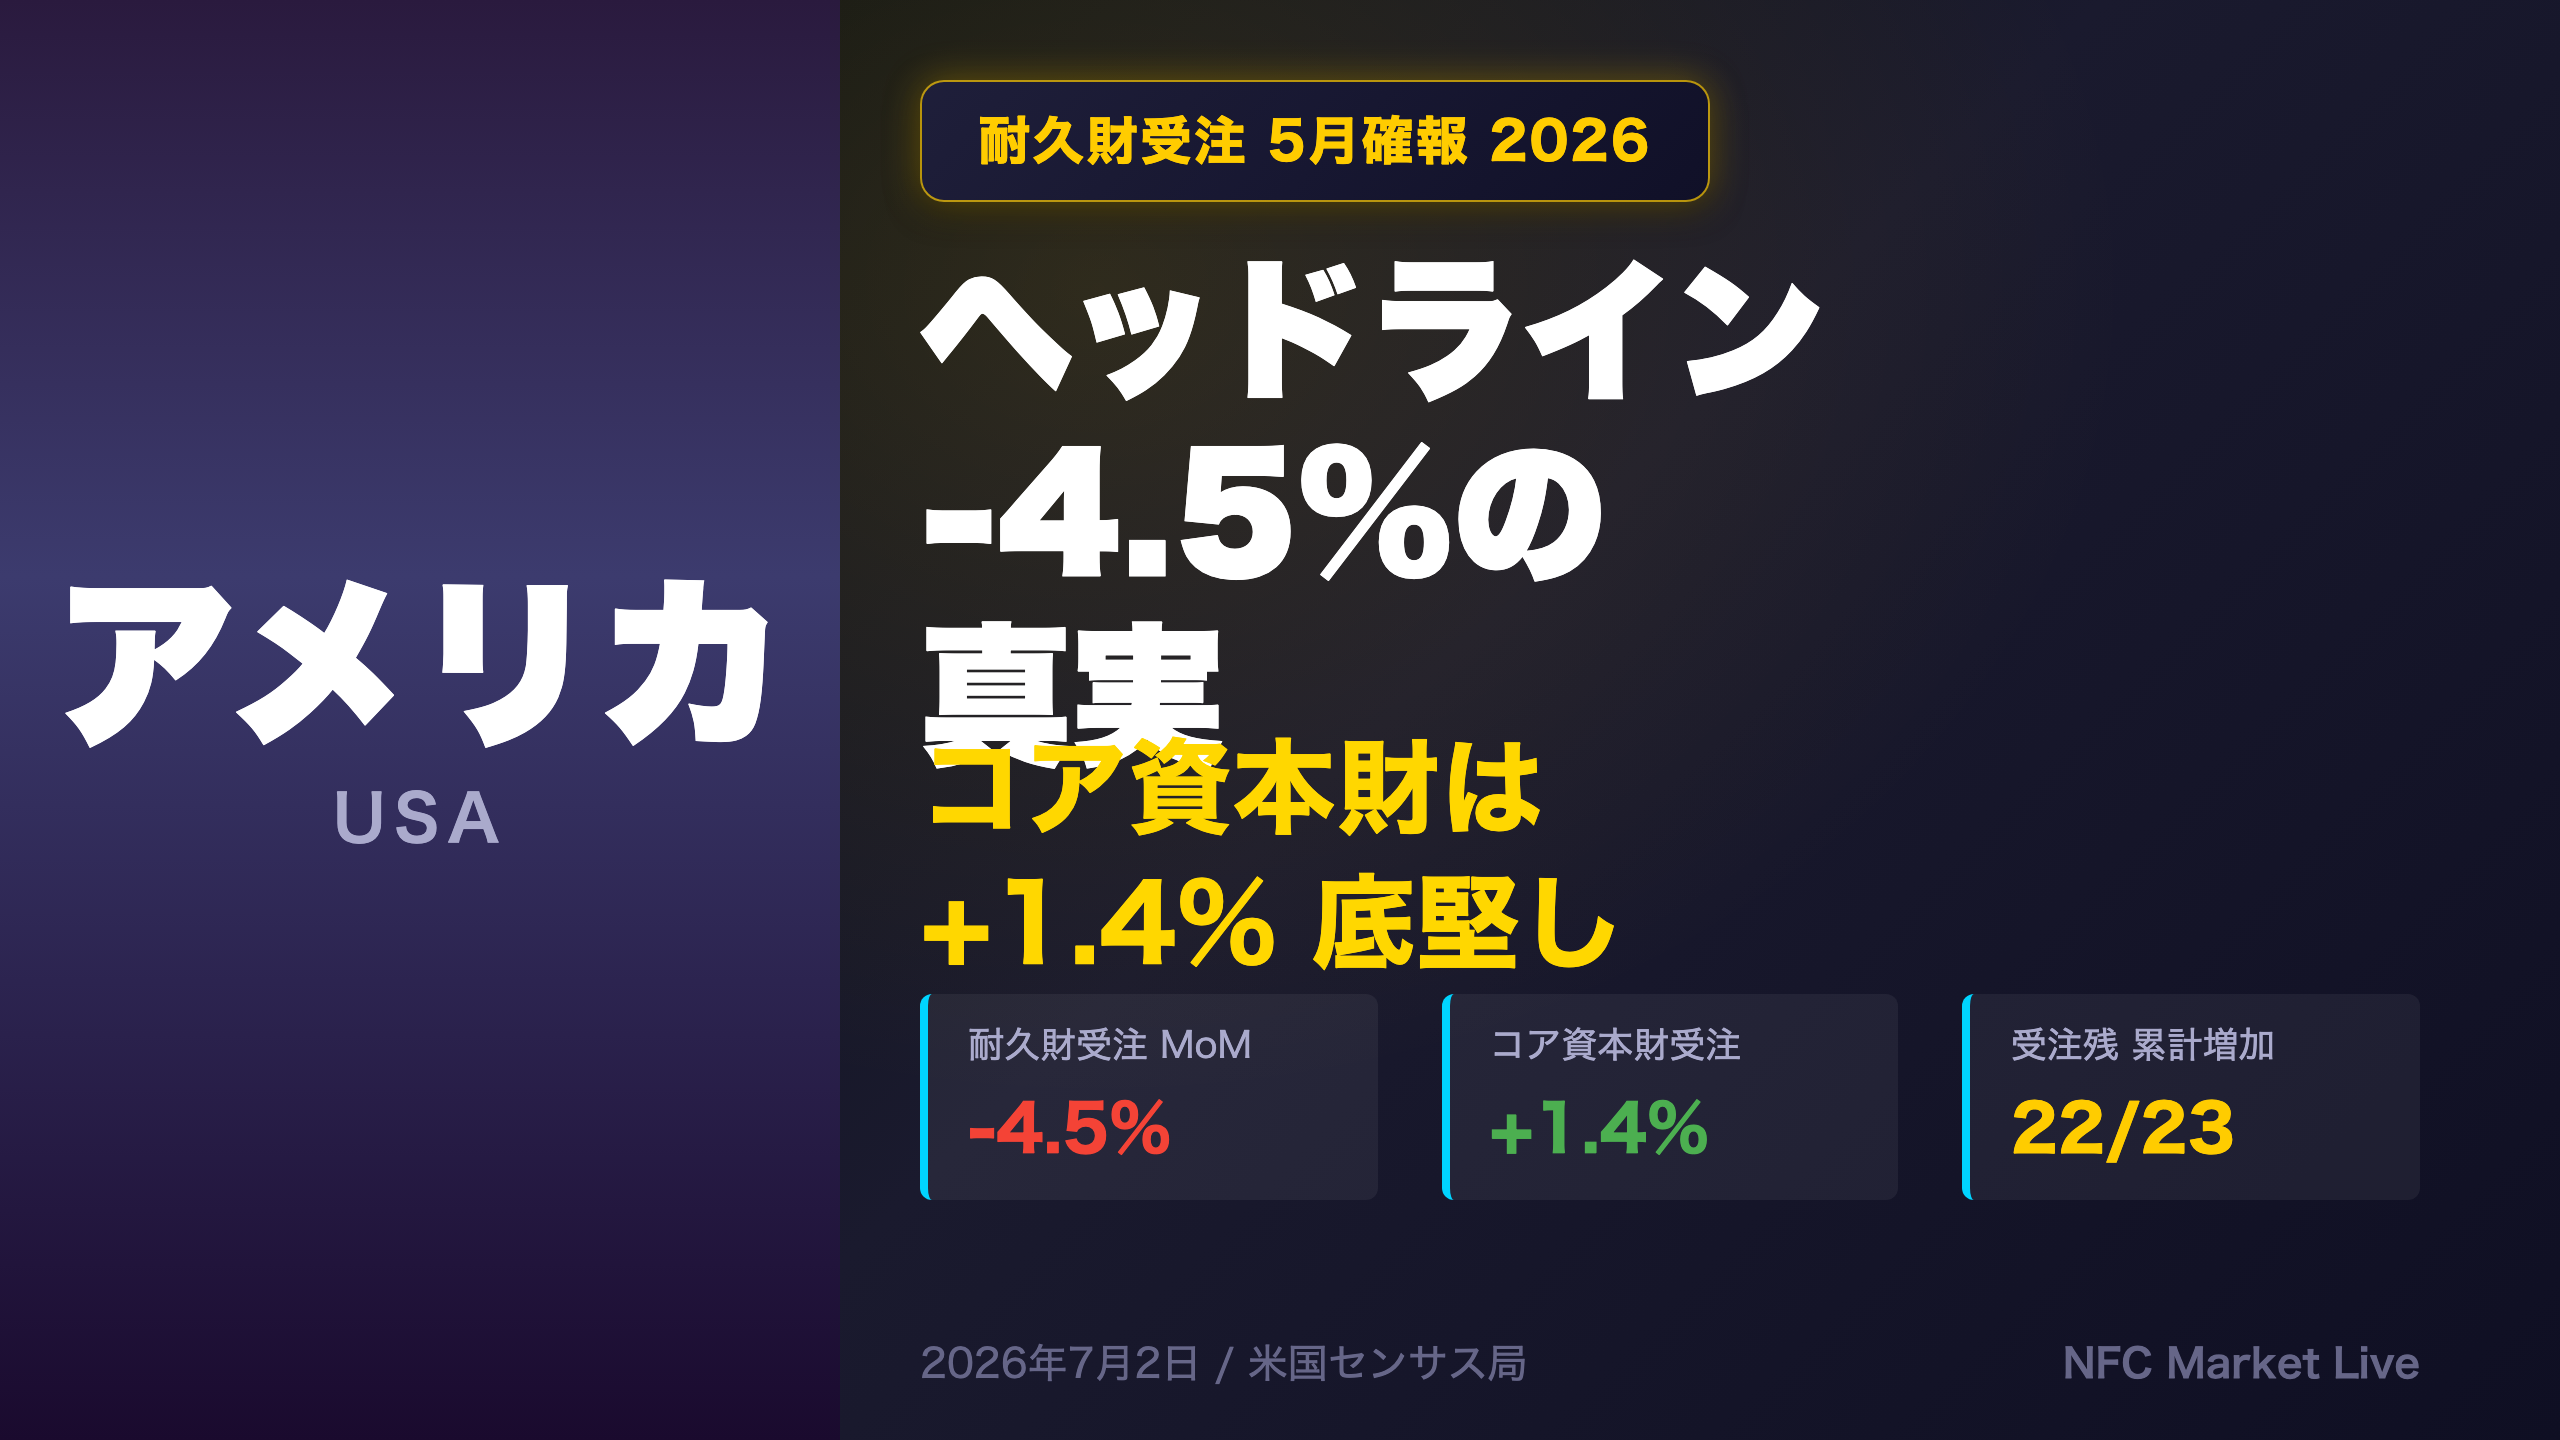
📺 Watch the Full Video Analysis
This article was automatically generated by the NFC Market Live AI analysis system. (Updated: 2026-07-02 23:09 JST)
📄 Primary Source
U.S. Census Bureau
https://www.census.gov/manufacturing/m3/prel/pdf/s-i-o.pdf
The US Census Bureau released the May 2026 full manufacturing report on July 2. While durable goods orders fell 4.5% MoM on the headline, the drop was almost entirely driven by a 51.8% plunge in nondefense aircraft orders. Core capital goods orders (ex-aircraft, ex-defense) rose 1.4%, signaling resilient business investment. We break down shipments, unfilled orders, and inventory trends to give you the full picture.
The Ultimate Summary:5月耐久財受注の総合評価
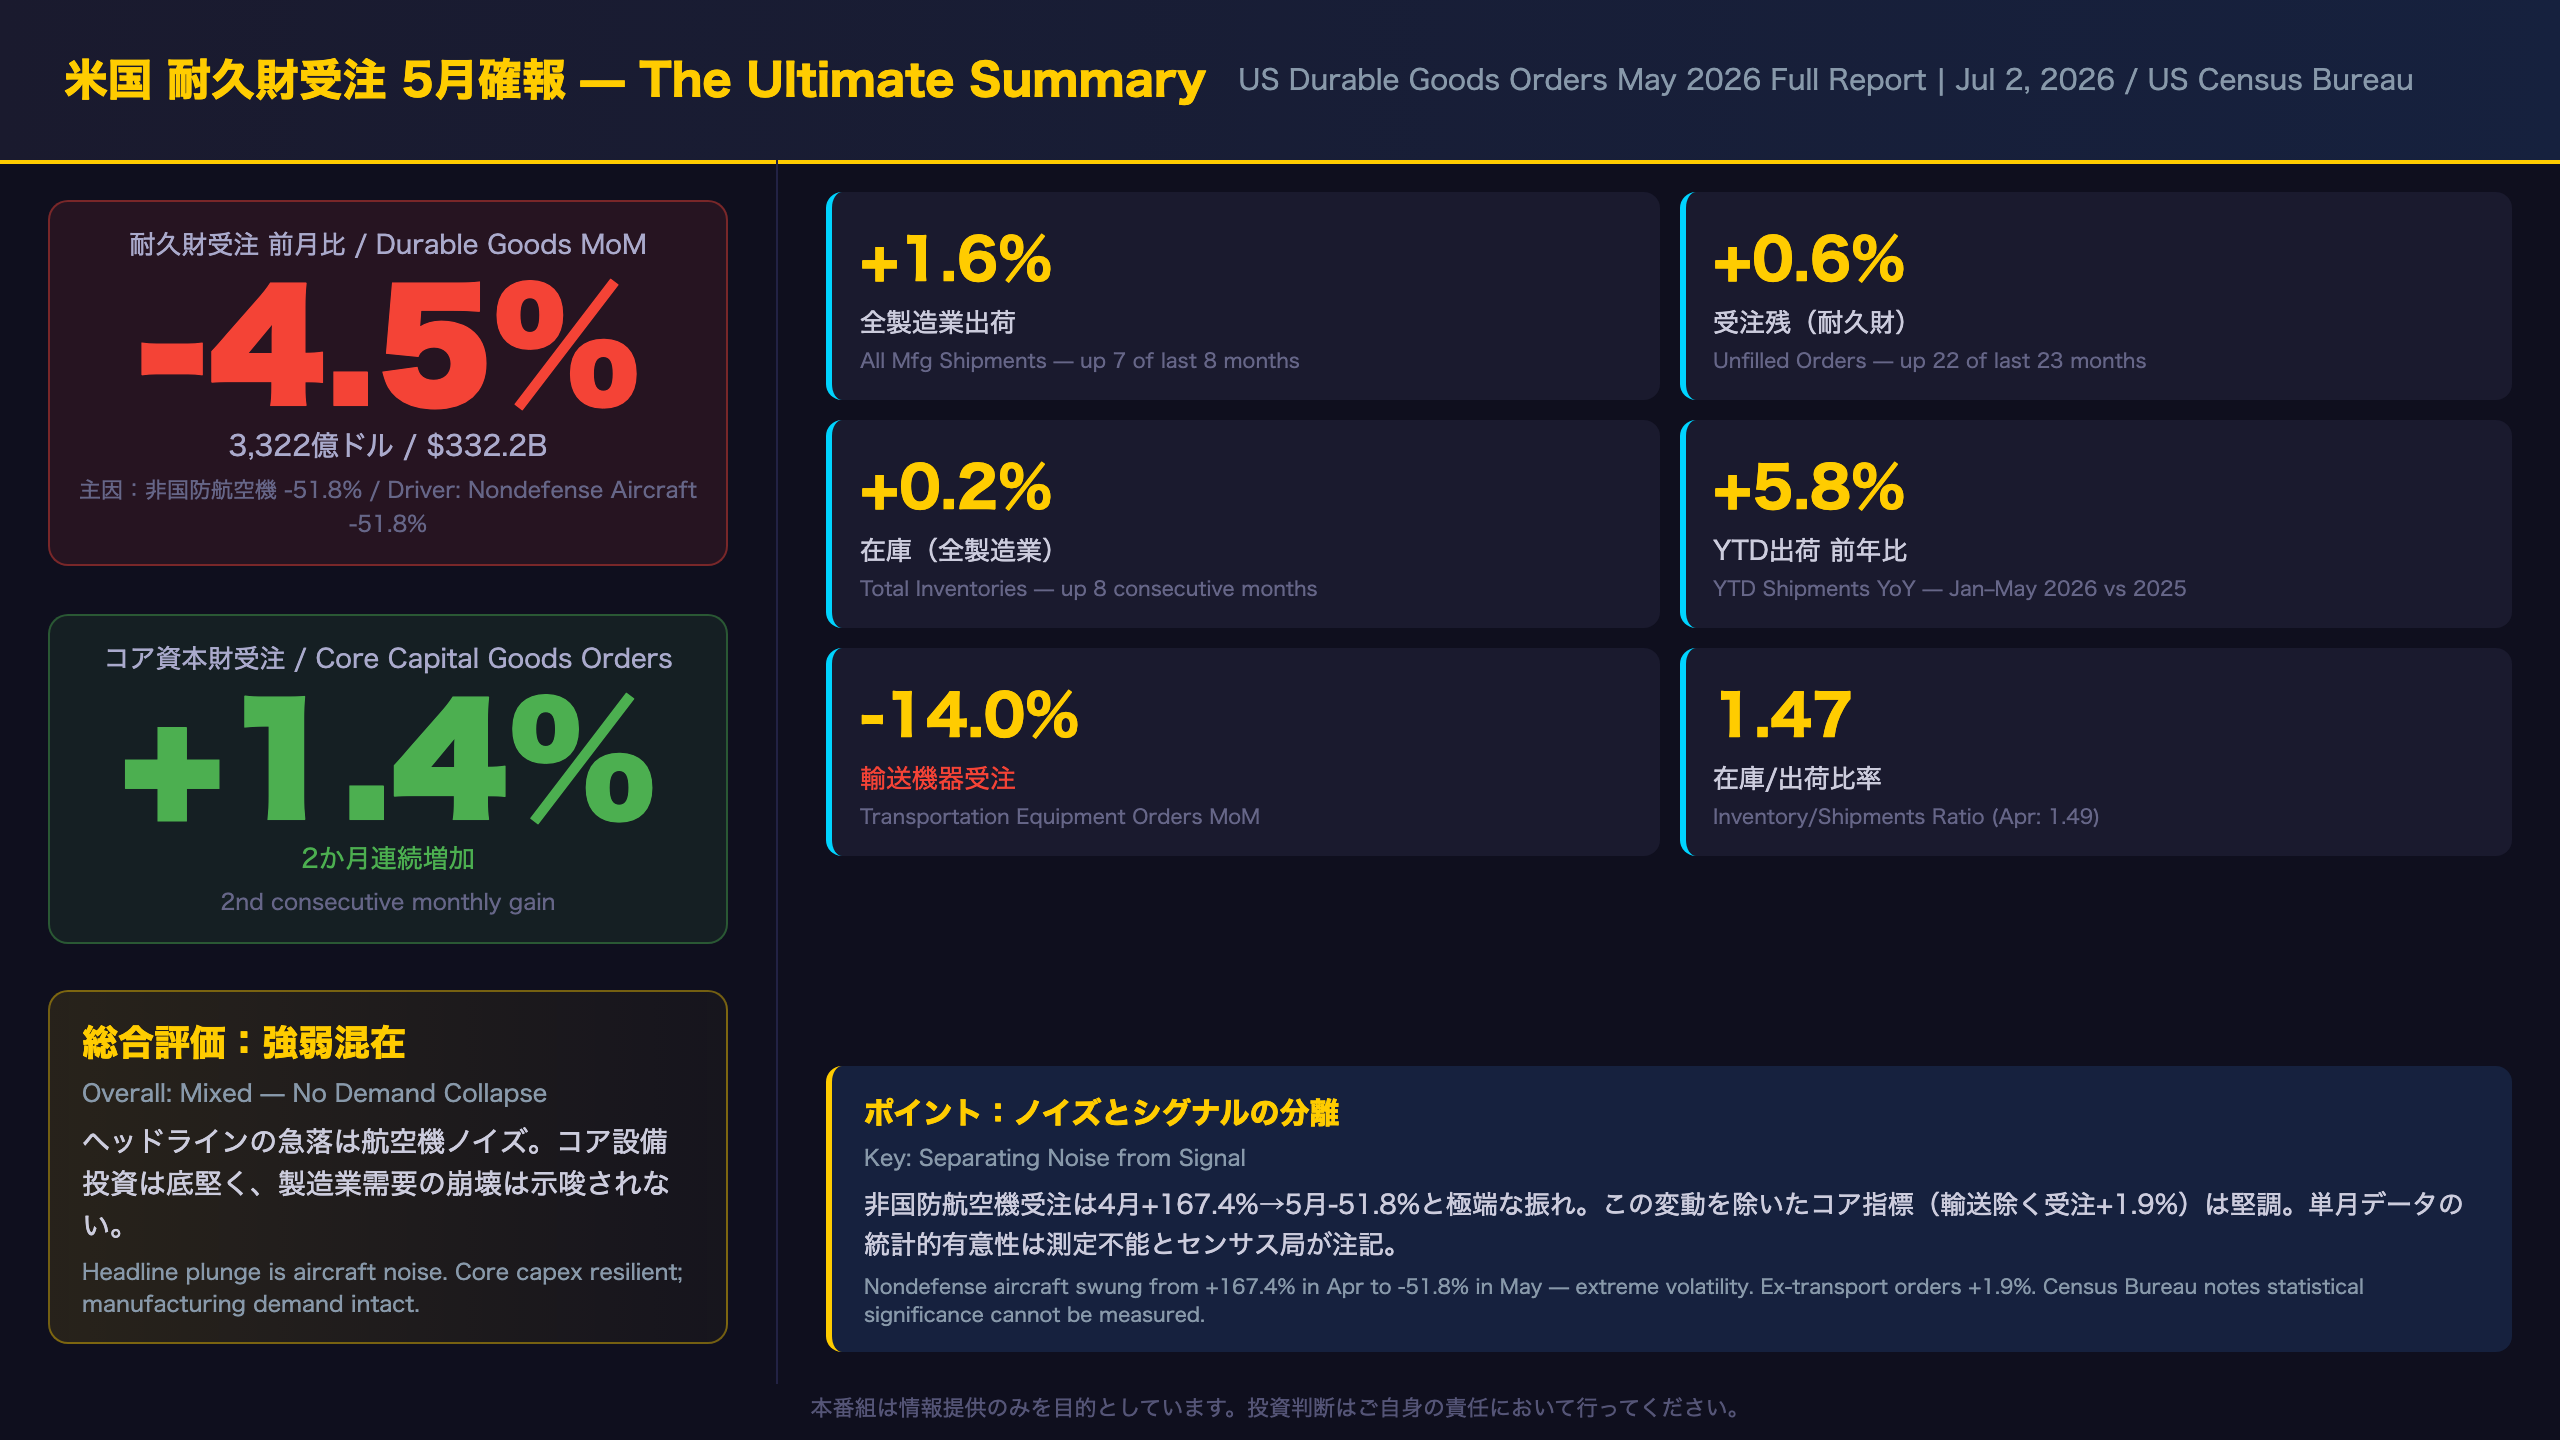
May 2026 Durable Goods: Separating Signal from Noise
What Is This Report?
The US Census Bureau’s Manufacturers’ Shipments, Inventories, and Orders (M3) survey is a monthly voluntary survey covering approximately 4,700 reporting units across 92 industry categories. It provides data on new orders, shipments, unfilled orders (backlog), and inventories for the US manufacturing sector. The report is released in two stages: an Advance Report (covering durable goods only, released ~4 weeks after month-end) and a Full Report (covering all manufacturing, released ~5 weeks after month-end).
Key Numbers at a Glance
| Metric | May 2026 | MoM Change | April 2026 |
|---|---|---|---|
| All Mfg New Orders | $657.4B | -1.3% | +5.3% |
| Durable Goods Orders | $332.2B | -4.5% | +8.5% |
| All Mfg Shipments | $653.2B | +1.6% | +1.3% |
| Unfilled Orders (Durables) | $1,579.5B | +0.6% | +1.8% |
| Total Inventories | $962.0B | +0.2% | +0.3% |
The Core Capex Story
For investors tracking US business investment, the headline durable goods number is notoriously noisy due to lumpy aircraft orders. In May, nondefense aircraft orders collapsed 51.8% MoM — a direct reversal of April’s extraordinary +167.4% surge driven by Boeing order timing.
Stripping out defense and aircraft, core capital goods orders rose 1.4%, the second consecutive monthly gain. This is the metric most closely watched as a leading indicator for private fixed investment in GDP accounts.
Bullish vs. Bearish Reads
Bullish case: Core capex up two consecutive months; shipments rising in 7 of 8 months; unfilled orders up in 22 of 23 months — multiple indicators pointing in the same direction suggests underlying manufacturing demand is intact. Year-to-date shipments are up 5.8% vs. 2025.
Bearish case: Inventories have risen for 8 consecutive months. If inventory accumulation outpaces demand growth, it could signal future production cutbacks. The Census Bureau itself notes that statistical significance “cannot be measured” for this survey — single-month readings carry wide uncertainty bands.
Fed Implications
Resilient core capex data, combined with solid shipments, provides limited justification for the Fed to accelerate rate cuts. However, one month of data is insufficient to draw firm conclusions about the investment cycle direction. The June advance durable goods report (due July 27) will be the next key data point.
Deep Dive①:ヘッドラインを歪める輸送機器ノイズの解剖
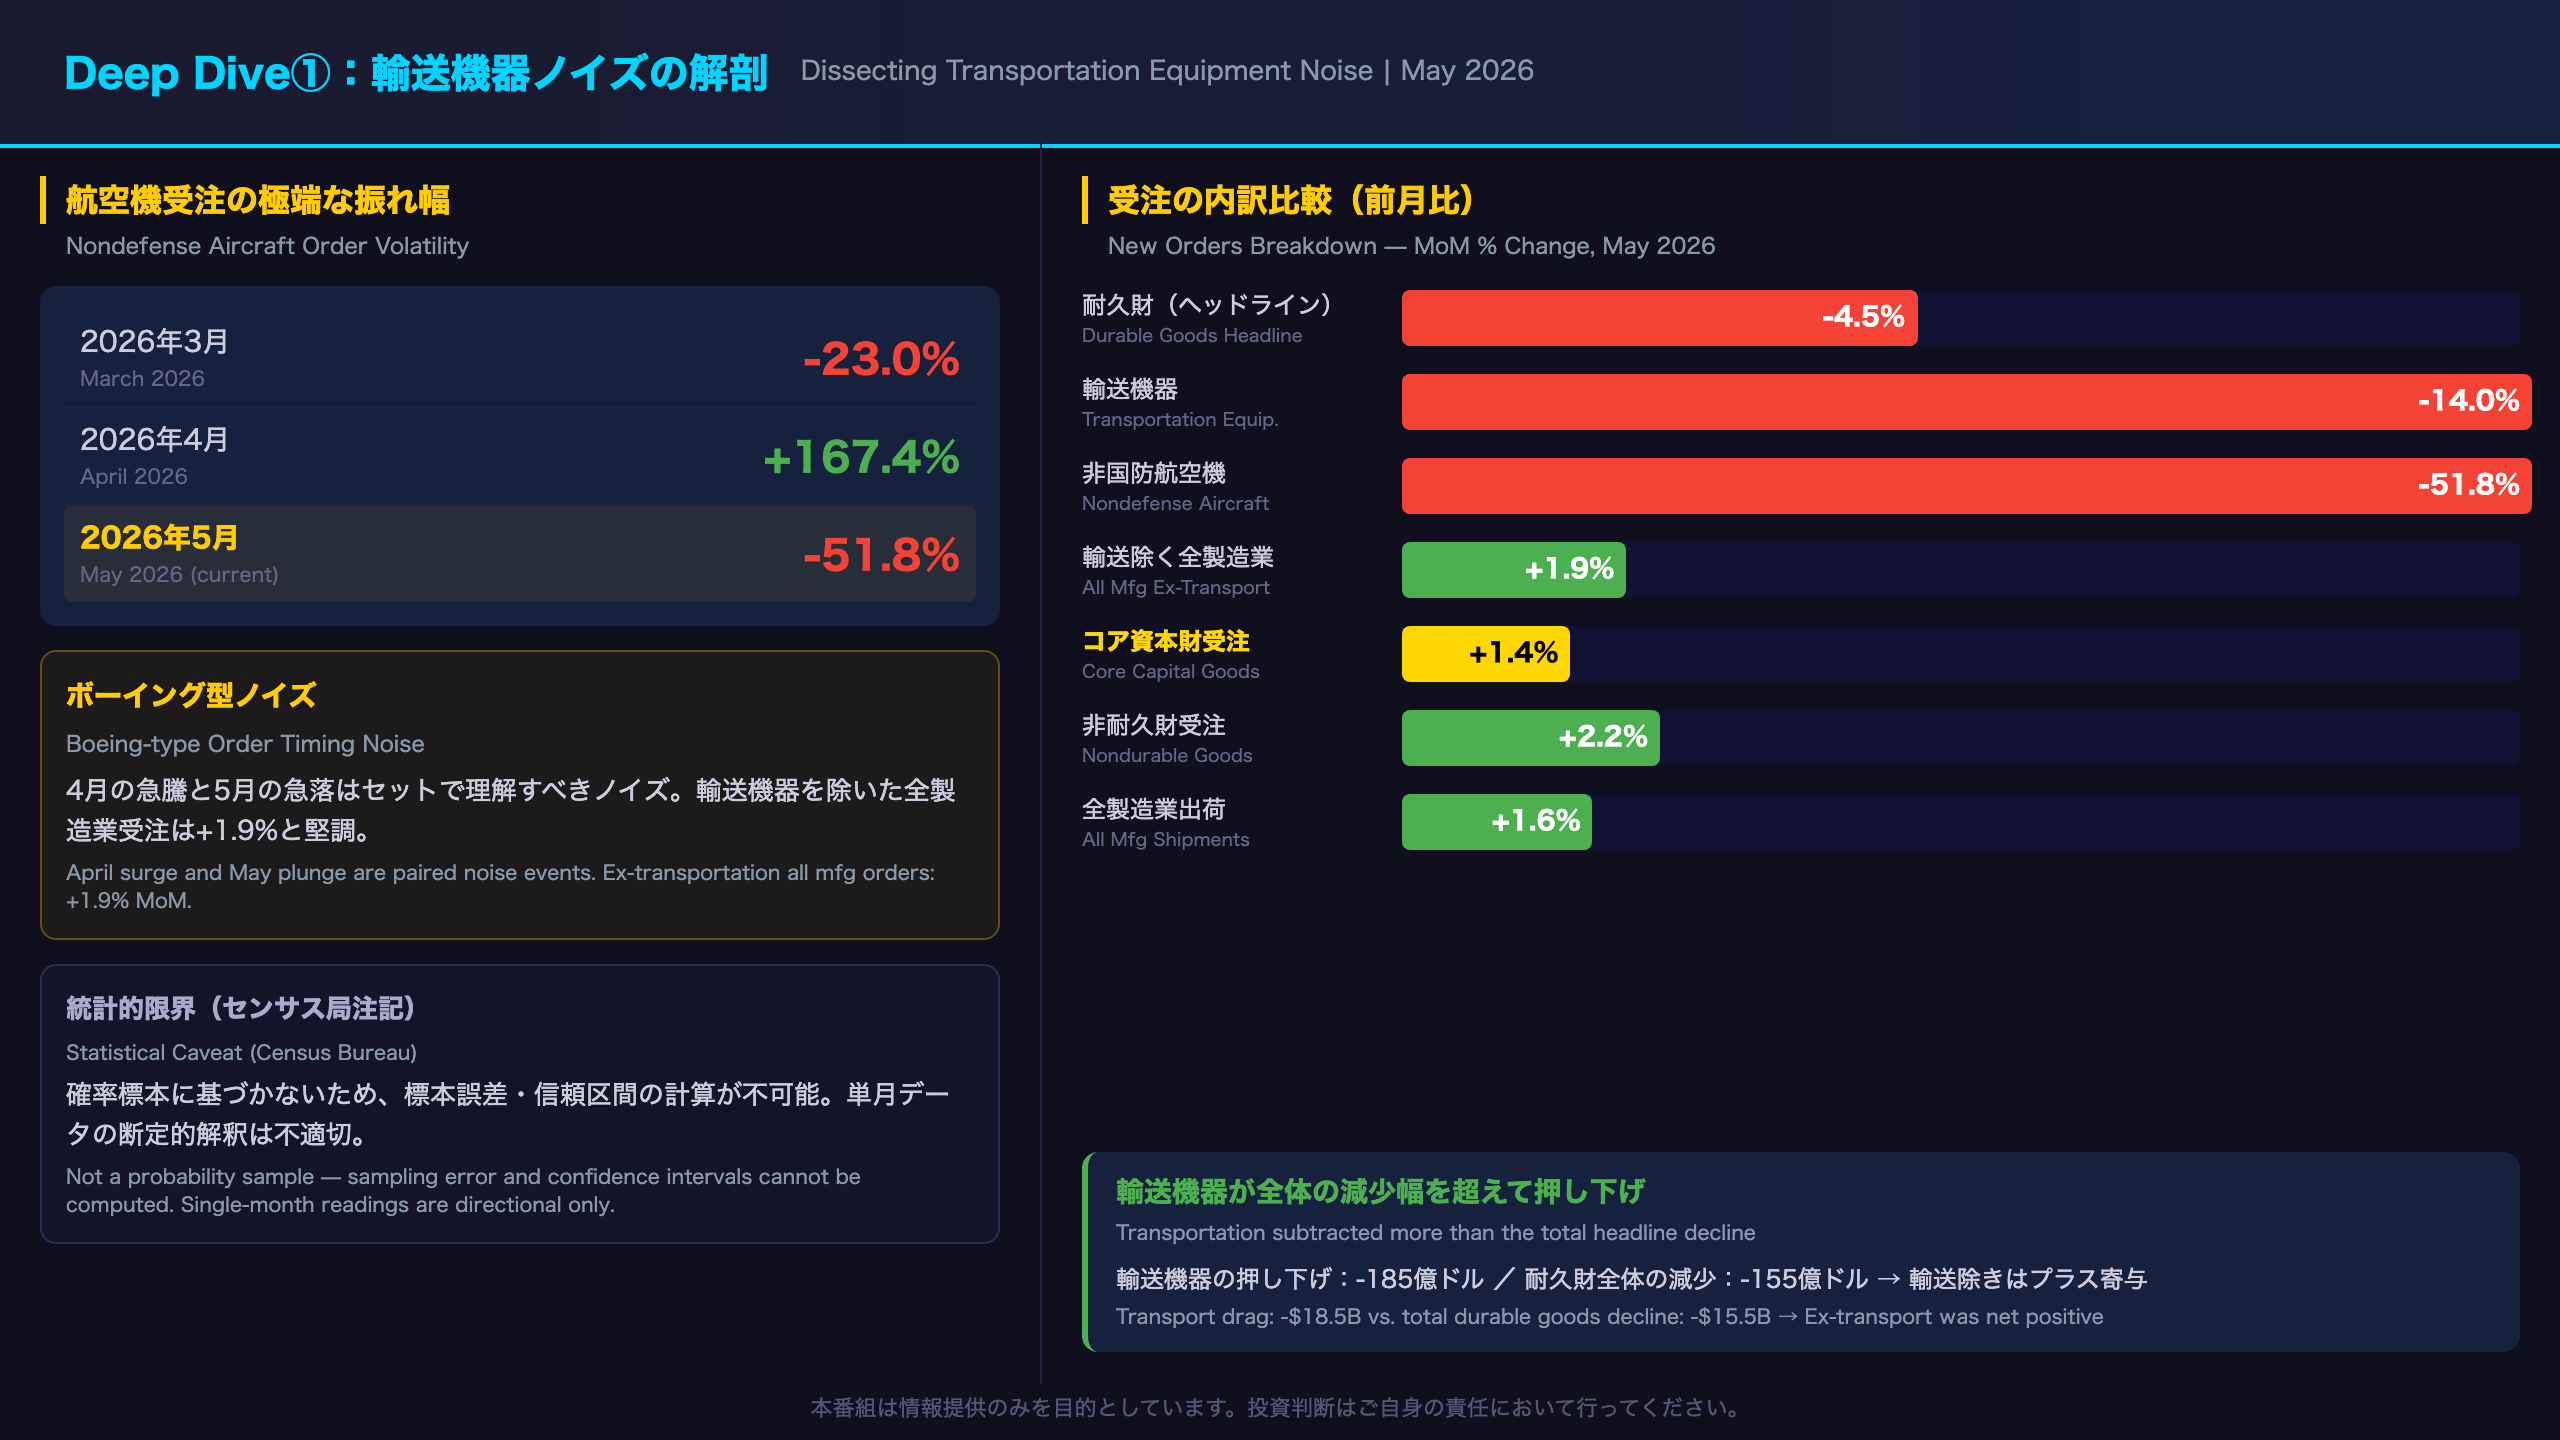
Dissecting Transportation Noise: Why the Headline Is Misleading
The Aircraft Order Rollercoaster
Nondefense aircraft orders have swung wildly in recent months:
| Month | MoM Change |
|---|---|
| March 2026 | -23.0% |
| April 2026 | +167.4% |
| May 2026 | -51.8% |
This extreme volatility reflects the lumpy nature of large commercial aircraft orders — when Boeing or Airbus receives a large batch order, it shows up as a massive spike, followed by an equally large reversal. Neither month in isolation tells us anything meaningful about the underlying investment trend.
The Ex-Transportation Picture
When transportation equipment is excluded, all manufacturing new orders rose +1.9% MoM in May. Transportation equipment alone subtracted $18.5 billion from total durable goods orders — more than the entire $15.5 billion headline decline. This means every other durable goods category combined was net positive.
Defense Volatility
Defense capital goods orders also fluctuate significantly month-to-month. In May, defense capital goods orders rose 7.8% MoM, but this single-month reading should not be extrapolated as a trend.
Statistical Caveats
The Census Bureau explicitly states that the M3 survey “is not based on a probability sample, so the sampling error of these estimates cannot be measured, nor can the confidence intervals be computed.” This is a critical caveat: unlike most economic surveys, there is no standard error or confidence interval attached to these monthly percent changes. Investors should treat single-month readings as directional indicators rather than precise measurements.
Deep Dive②:コア資本財と設備投資の実態
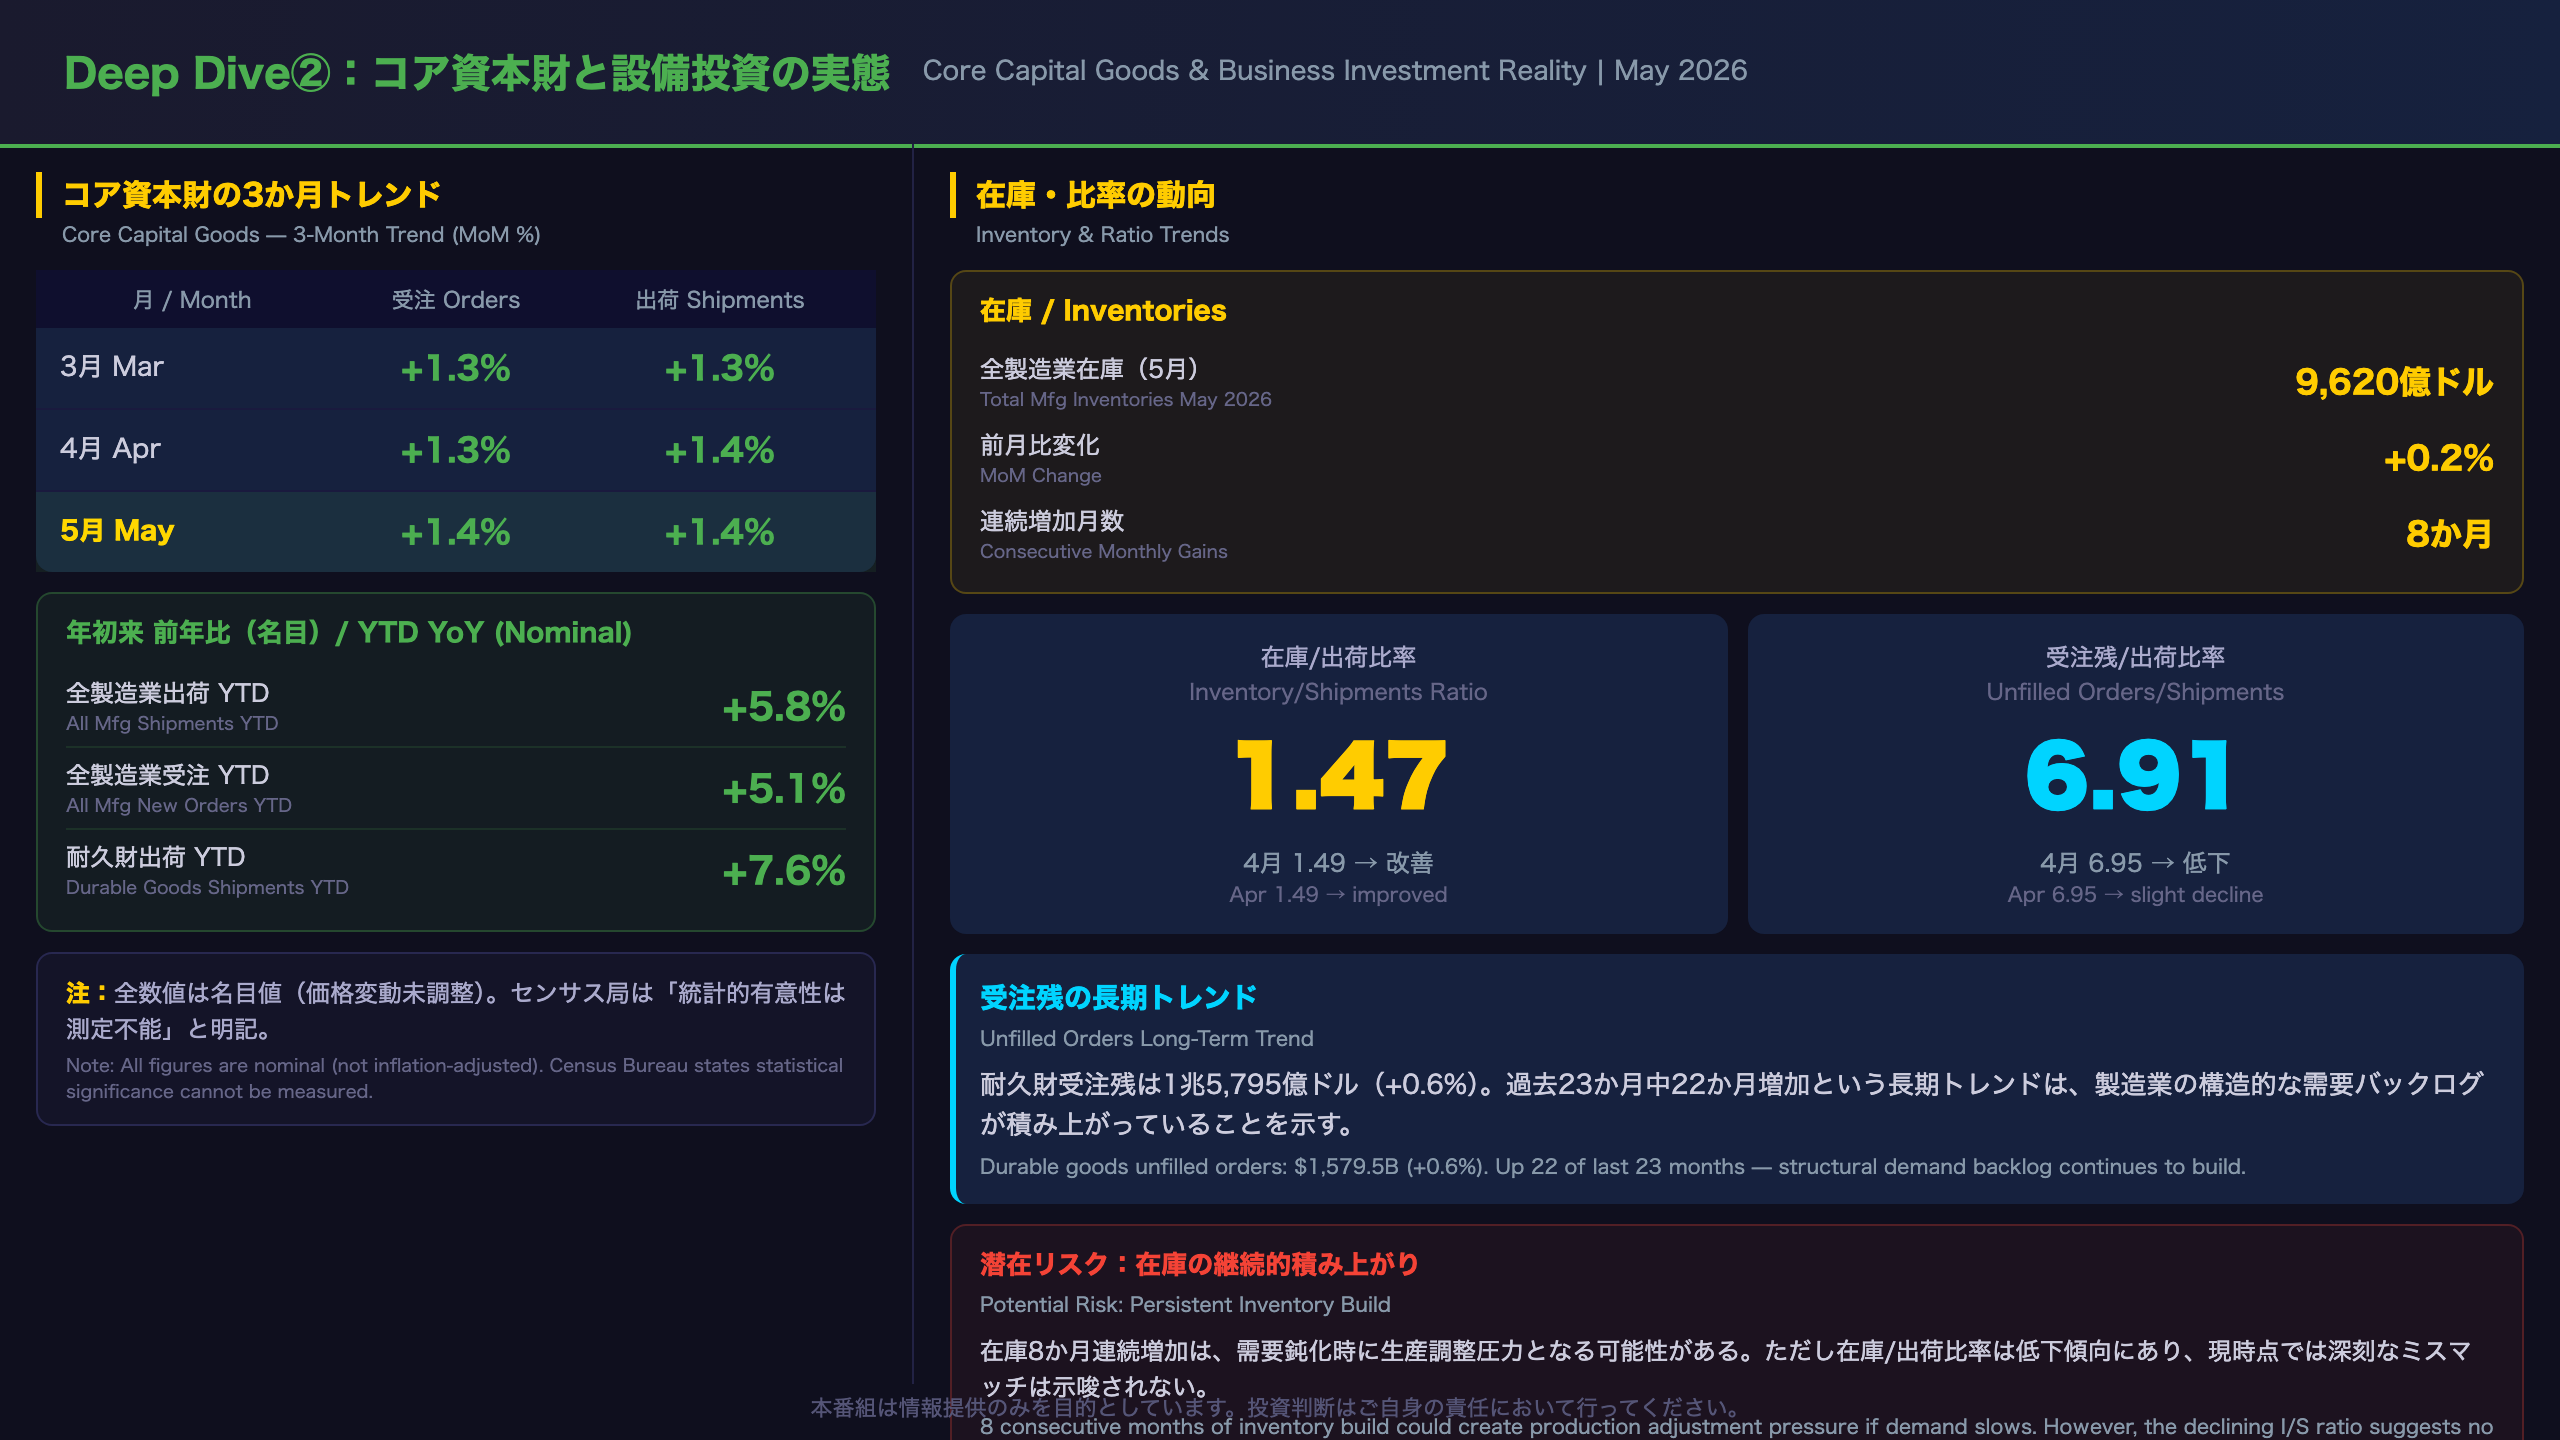
Core Capital Goods: What the Leading Indicator Is Telling Us
What Are Core Capital Goods Orders?
“Core capital goods orders” refers to nondefense capital goods orders excluding aircraft. By stripping out defense spending and aircraft order volatility, this metric provides the cleanest read on private business investment intentions. It is one of the most closely watched manufacturing indicators by the Federal Reserve and market participants as a leading indicator for the GDP private fixed investment (equipment) component.
Three-Month Trend
| Month | Core CapEx Orders MoM | Core CapEx Shipments MoM |
|---|---|---|
| March 2026 | +1.3% | +1.3% |
| April 2026 | +1.3% | +1.4% |
| May 2026 | +1.4% | +1.4% |
Three consecutive positive months, with both orders and shipments moving in the same direction, suggests a directional trend rather than noise. However, this remains a Level B inference (multiple indicators pointing the same way) — it is not sufficient to conclude that business investment is accelerating.
Year-to-Date vs. Prior Year
Year-to-date (January–May 2026) all manufacturing shipments total $3,121.3 billion, up 5.8% versus the same period in 2025. New orders YTD total $3,159.1 billion, up 5.1% YoY. These are solid nominal gains, though the Census Bureau notes that figures are not adjusted for price changes — real growth rates would be lower after accounting for inflation.
Inventory Risk: A Potential Headwind
Total manufacturing inventories have risen for 8 consecutive months, reaching $962.0 billion in May. The inventory-to-shipments ratio declined slightly to 1.47 from 1.49 in April, suggesting shipment growth is partially absorbing the inventory build. However, if demand growth slows, the persistent inventory accumulation could create production adjustment pressure — a risk worth monitoring in coming months.
インプリケーション:市場・政策への含意

Market & Policy Implications: Following the Chain of Reasoning
Federal Reserve Policy
Chain of reasoning:
“Core capital goods orders +1.4% (2nd consecutive gain) → suggests private business investment is being maintained → suggests lower near-term recession risk → may reduce urgency for Fed rate cuts”
However, each link in this chain relies on general economic mechanisms. The data alone cannot definitively support this conclusion. Core capital goods orders are a leading indicator for GDP equipment investment, but they are nominal (not inflation-adjusted), and the Census Bureau notes statistical significance cannot be measured. This inference should be rated Level B — directional, not definitive.
Equity Market Implications
Chain of reasoning:
“Resilient core capex → maintained order flow for industrial machinery and electrical equipment sectors → potential positive contribution to earnings outlook for those sectors”
Counterpoint: The -4.5% headline number will dominate media coverage and could weigh on short-term sentiment, even if the underlying data is more nuanced.
Currency Implications
Manufacturing resilience is generally considered supportive of the US dollar, but this single data point alone is insufficient to make a definitive currency call.
What to Watch Next
- July 27 (8:30 AM EDT): June Advance Durable Goods Report
- Will aircraft orders rebound after May’s 51.8% plunge?
- Will core capital goods orders maintain their positive streak?
-
Key threshold: A third consecutive positive reading for core capex would strengthen the “resilient investment” narrative
-
August 4 (10:00 AM EDT): June Full Manufacturing Report
Statistical Caveat Revisited
Because the M3 survey is not a probability sample, confidence intervals for monthly percent changes cannot be computed. This means we cannot statistically determine whether May’s +1.4% core capex reading represents a “true” change or falls within measurement error. Multi-month trends provide more reliable signals than any single month’s reading.
Disclaimer: This article is for informational purposes only. All investment decisions are made solely at your own risk.







