This article was automatically generated by the NFC Market Live AI analysis system. (Updated: 2026-11-14 10:25 JST)
📊 BOJ Summary of Opinions: two opinions called for holding rates, while another still favored continued hikes. Japan’s corporate goods price index rose 7.1% y/y in October, with the m/m change turning positive after two declines.
This week’s six items (Nov 9-12):
・BOJ Summary of Opinions (Oct. meeting)
・Corporate Goods Price Index (Oct.): +7.1% y/y
・Balance of Payments (Sep.): surplus JPY 2.37tn, trade in deficit
・Composite Indexes of Business Cycle (Sep.): coincident index improving, leading index down
・Weekly cross-border securities flows: bond buying for a 6th week, small stock sell-off
・Money Stock (Oct.): M2 1.7%, broad liquidity 4.1%
💡 Strengths and cautions, side by side, based on official sources.
今週の日本経済指標まとめ(11月9日〜11月12日)
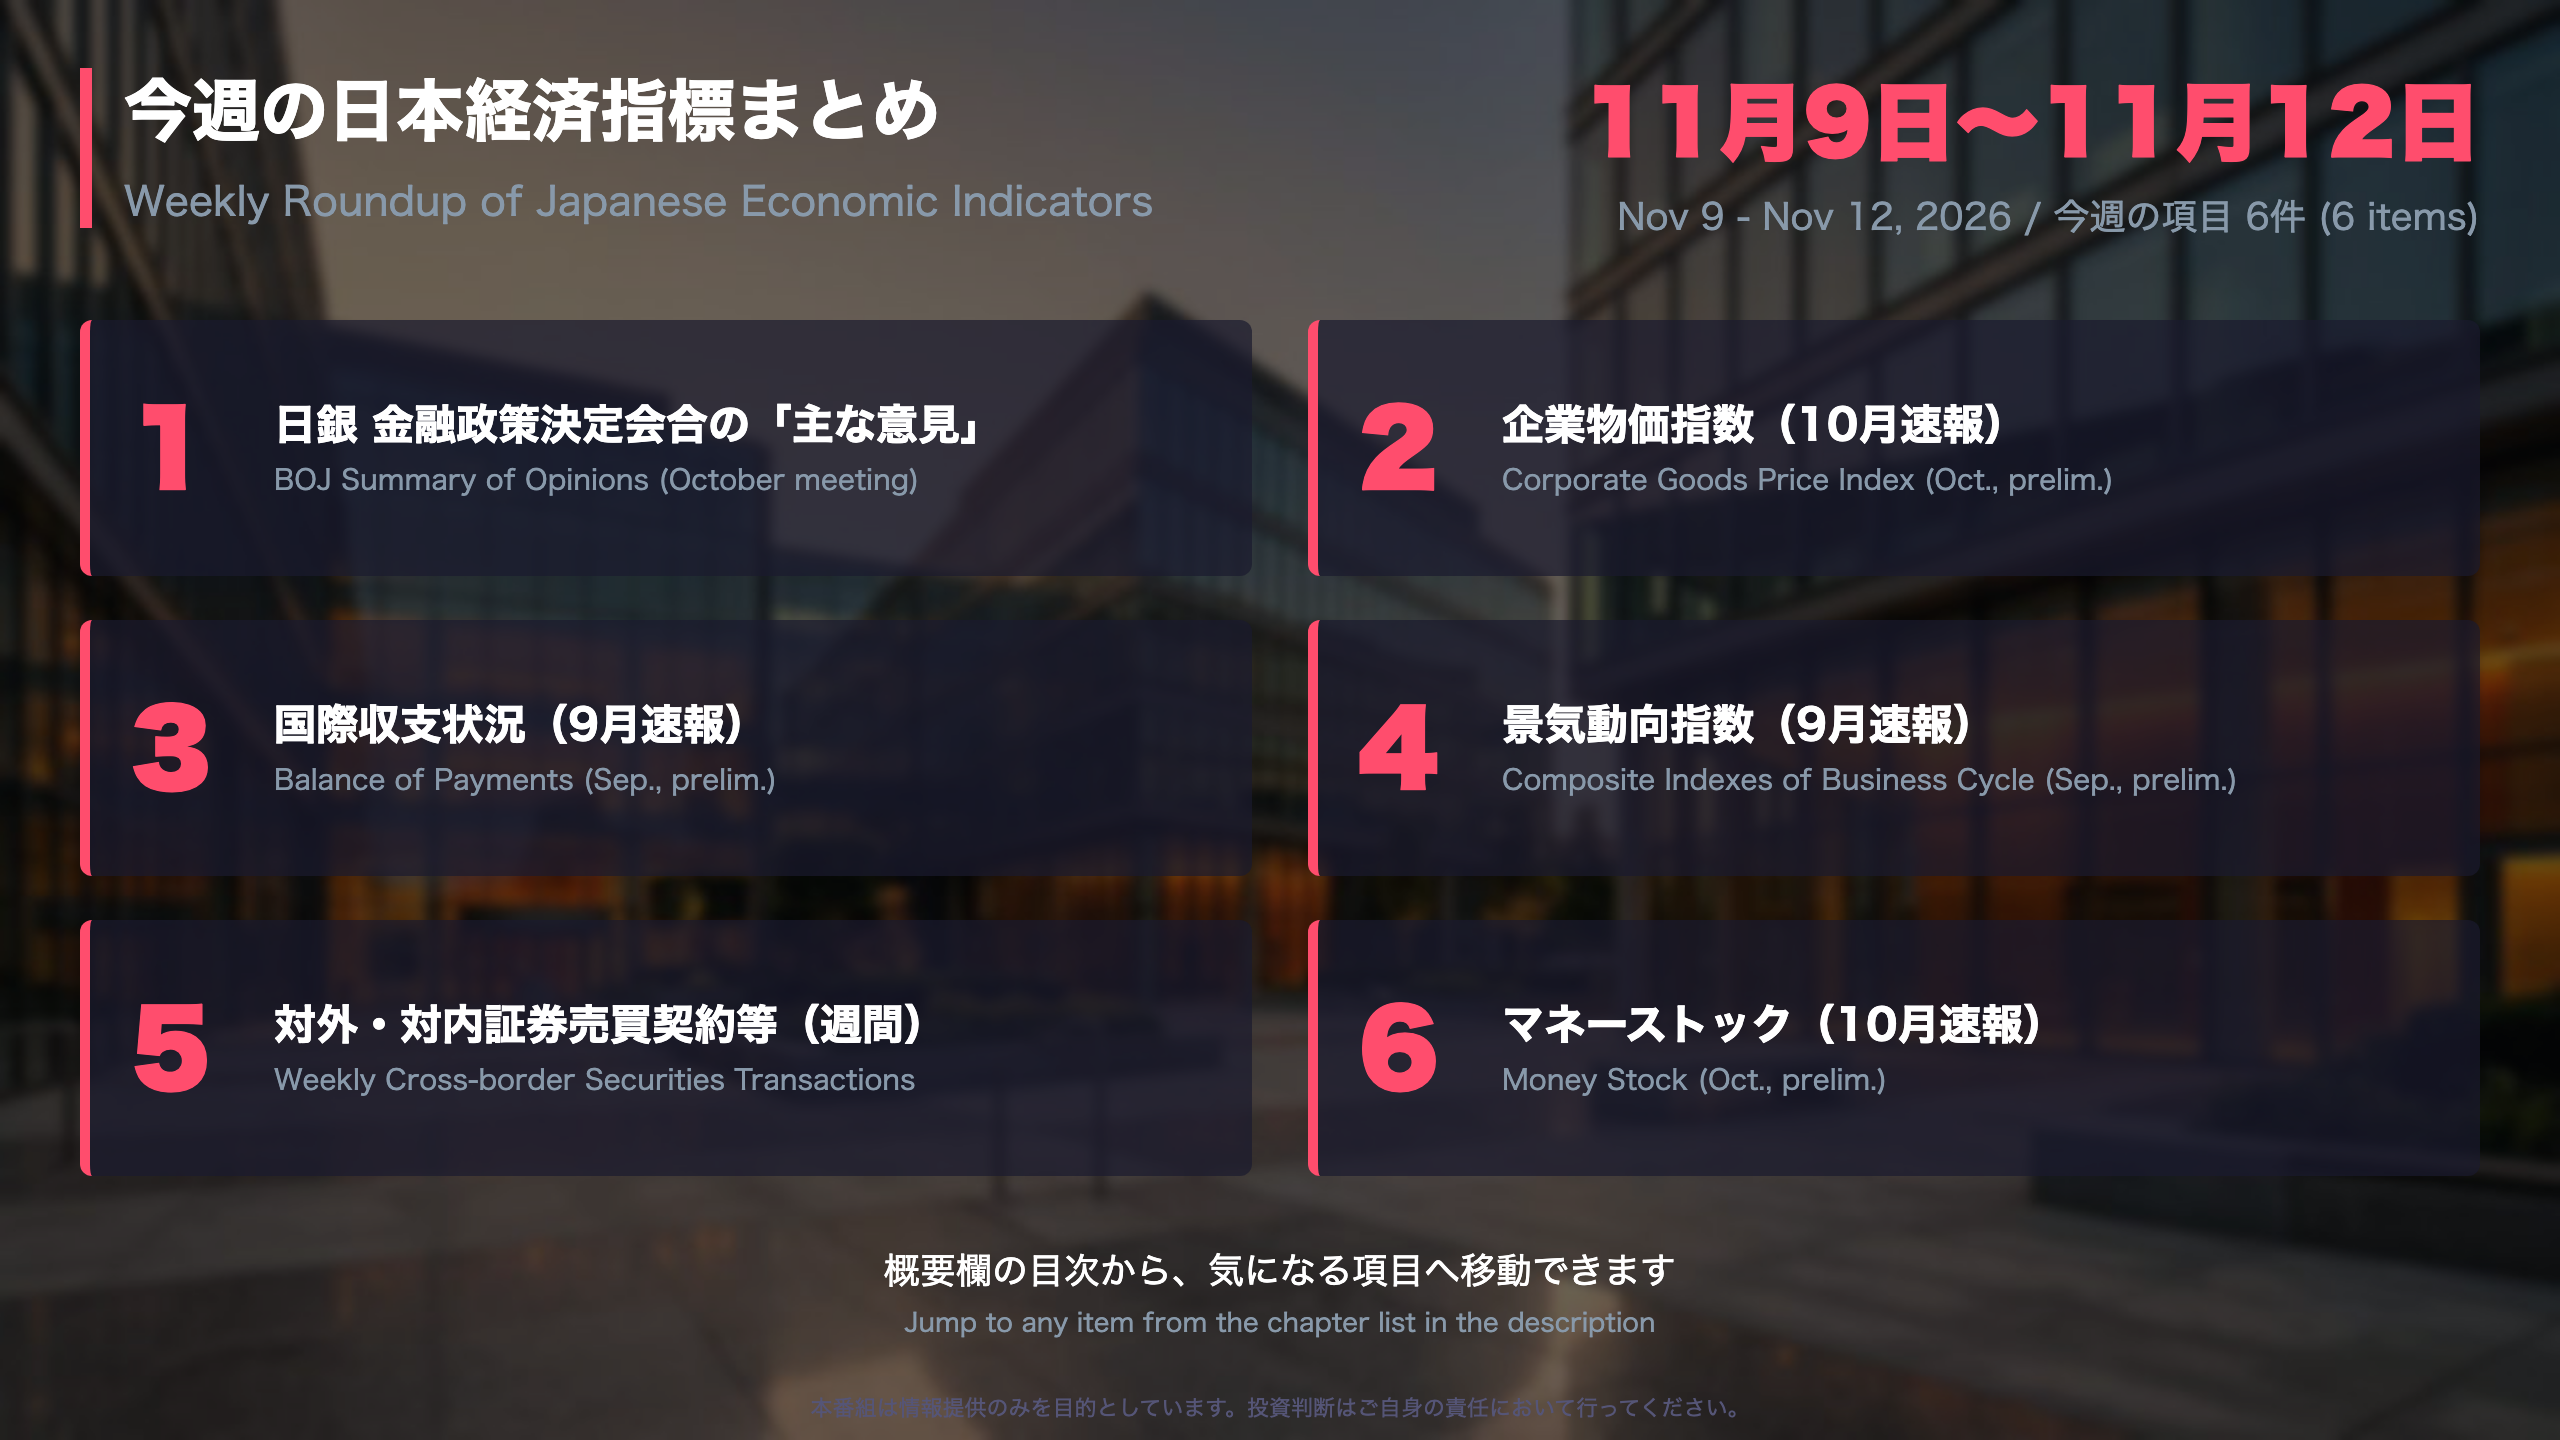
Six releases, six angles on Japan’s economy
Between November 9 and 12 we covered six releases. Each measures a different part of the economy: the business cycle, monetary policy deliberations, prices, cross-border transactions and the quantity of money.
Who publishes what
- Cabinet Office: Composite Indexes of Business Cycle (September, preliminary). Its coincident index sets the official business-cycle assessment.
- Bank of Japan (BOJ): the Summary of Opinions from the October policy meeting, the Corporate Goods Price Index (CGPI) and Money Stock. The Summary of Opinions is anonymous, so it shows how widely a view is held rather than who holds it.
- Ministry of Finance (MOF): Balance of Payments (September, preliminary) and weekly cross-border securities transactions.
A note on comparability
The CGPI is Japan’s producer-price gauge, broadly analogous to the US PPI. It is a different measure from consumer prices, which are the BOJ’s target variable. The months also differ across releases: September for the business-cycle indexes and balance of payments, October for money stock and CGPI, and the first week of November for securities flows.
The mix of signals
- Resilience: the coincident index kept its assessment of improvement, and overseas investors bought Japanese long-term bonds for a sixth straight week.
- Caution: the leading index fell for the first time in 17 months, M2 growth slowed to 1.7% from a May peak of 2.5%, and the current account surplus shrank from a year earlier.
The roundup does not forecast markets. It lines up what each source published so you can see where the signals agree and where they do not.
10月会合「主な意見」:据え置き2件、利上げ継続の意見も残る
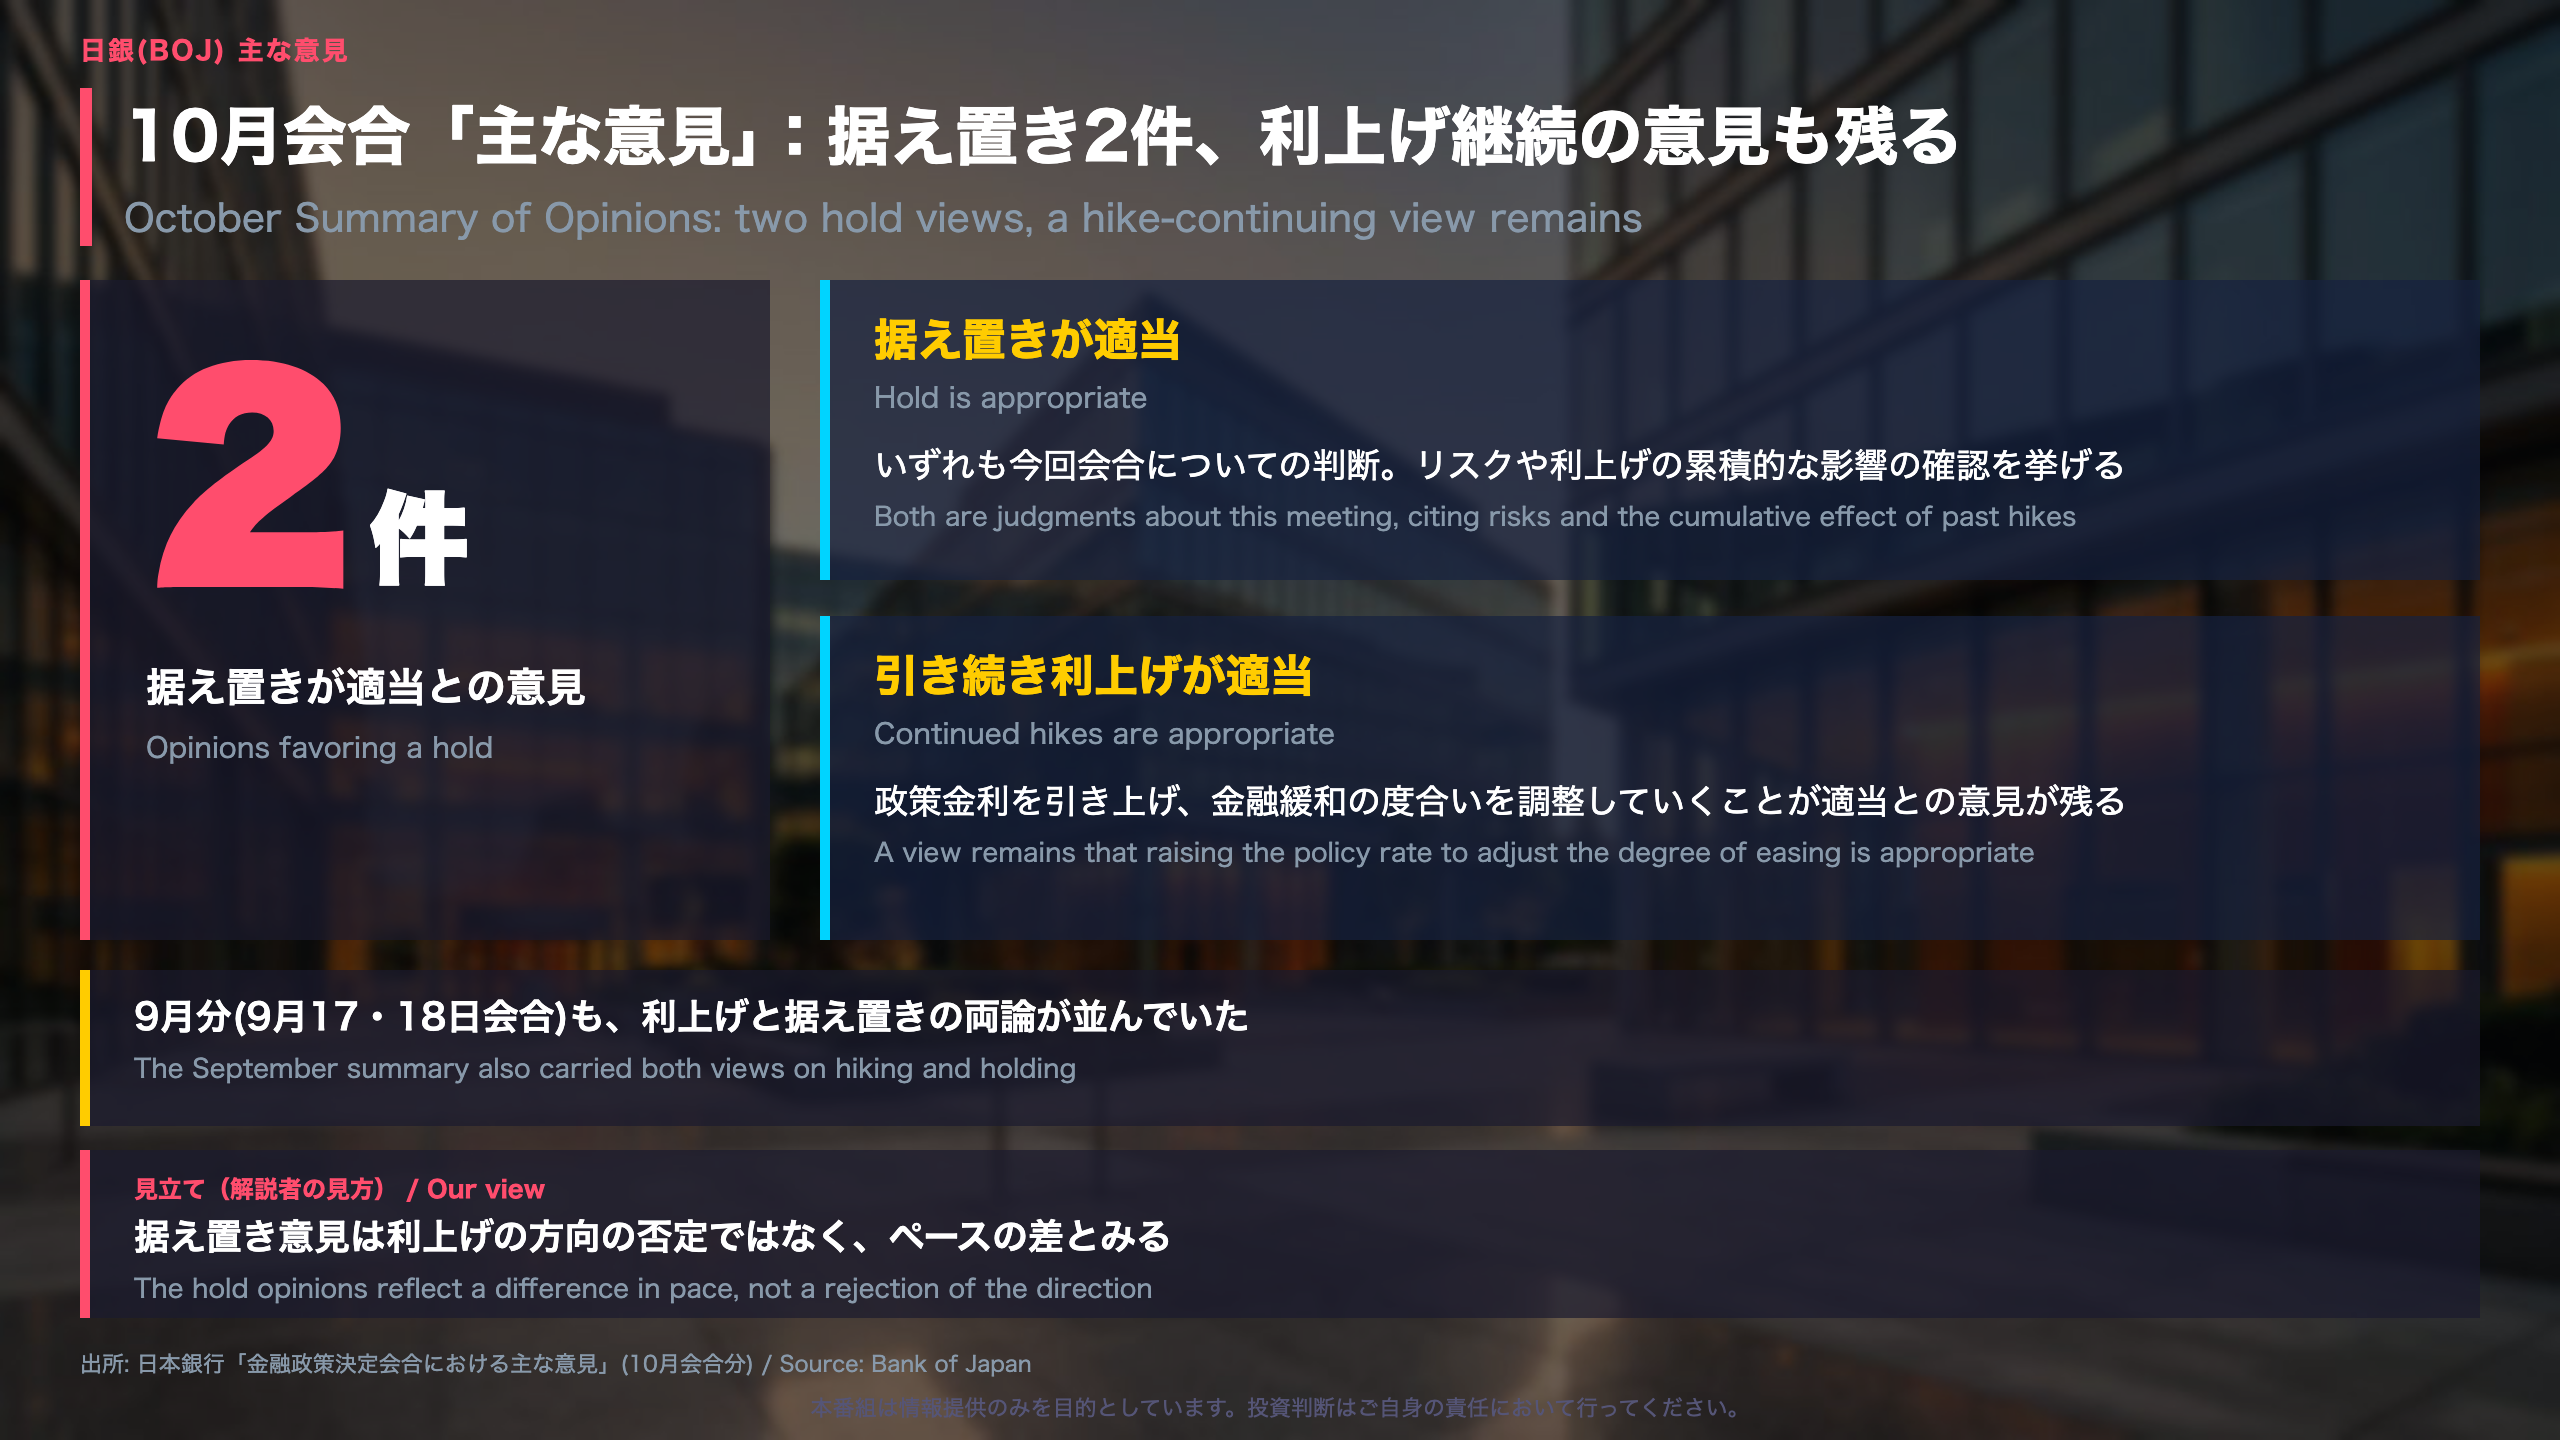
What the Summary of Opinions is
The Bank of Japan (BOJ) publishes this document after each Monetary Policy Meeting. Board members and government representatives summarize their own remarks, and the Governor, as chair, edits them by topic. Speakers are anonymous, so the document is best read for how widely a view is shared, not for who said it. It has three parts: economic and price conditions, monetary policy, and the government’s views. It is a different document from the Fed’s FOMC minutes in one respect: it is a thematic digest, not a record of the debate.
What stands out this time
- Two opinions favor holding at this meeting, while at least one argues for continued rate hikes to adjust the degree of easing.
- The September summary also carried both camps, so the split itself is not new.
- On the economy, the document notes that consumption activity in July-August was below the April-June level, and that there is no “force strong enough to lead the economy as a whole.”
- AI-related demand is described as a support for activity and prices, concentrated in chip materials, equipment and data centers, with a caution about durability.
Two ways to read it
The hike-continuing side points to inflation near target and still-accommodative financial conditions. The cautious side points to some soft spots in activity and the cumulative effect of past hikes. Notably, the hold opinions are described as judgments about this meeting, not objections to raising rates.
What to watch
Several opinions cite next year’s spring wage negotiations (shunto) as the check on whether wage-price dynamics are settling. The document does not state the next meeting date.
物価と賃金の見方:目標と整合的との認識、春闘が焦点
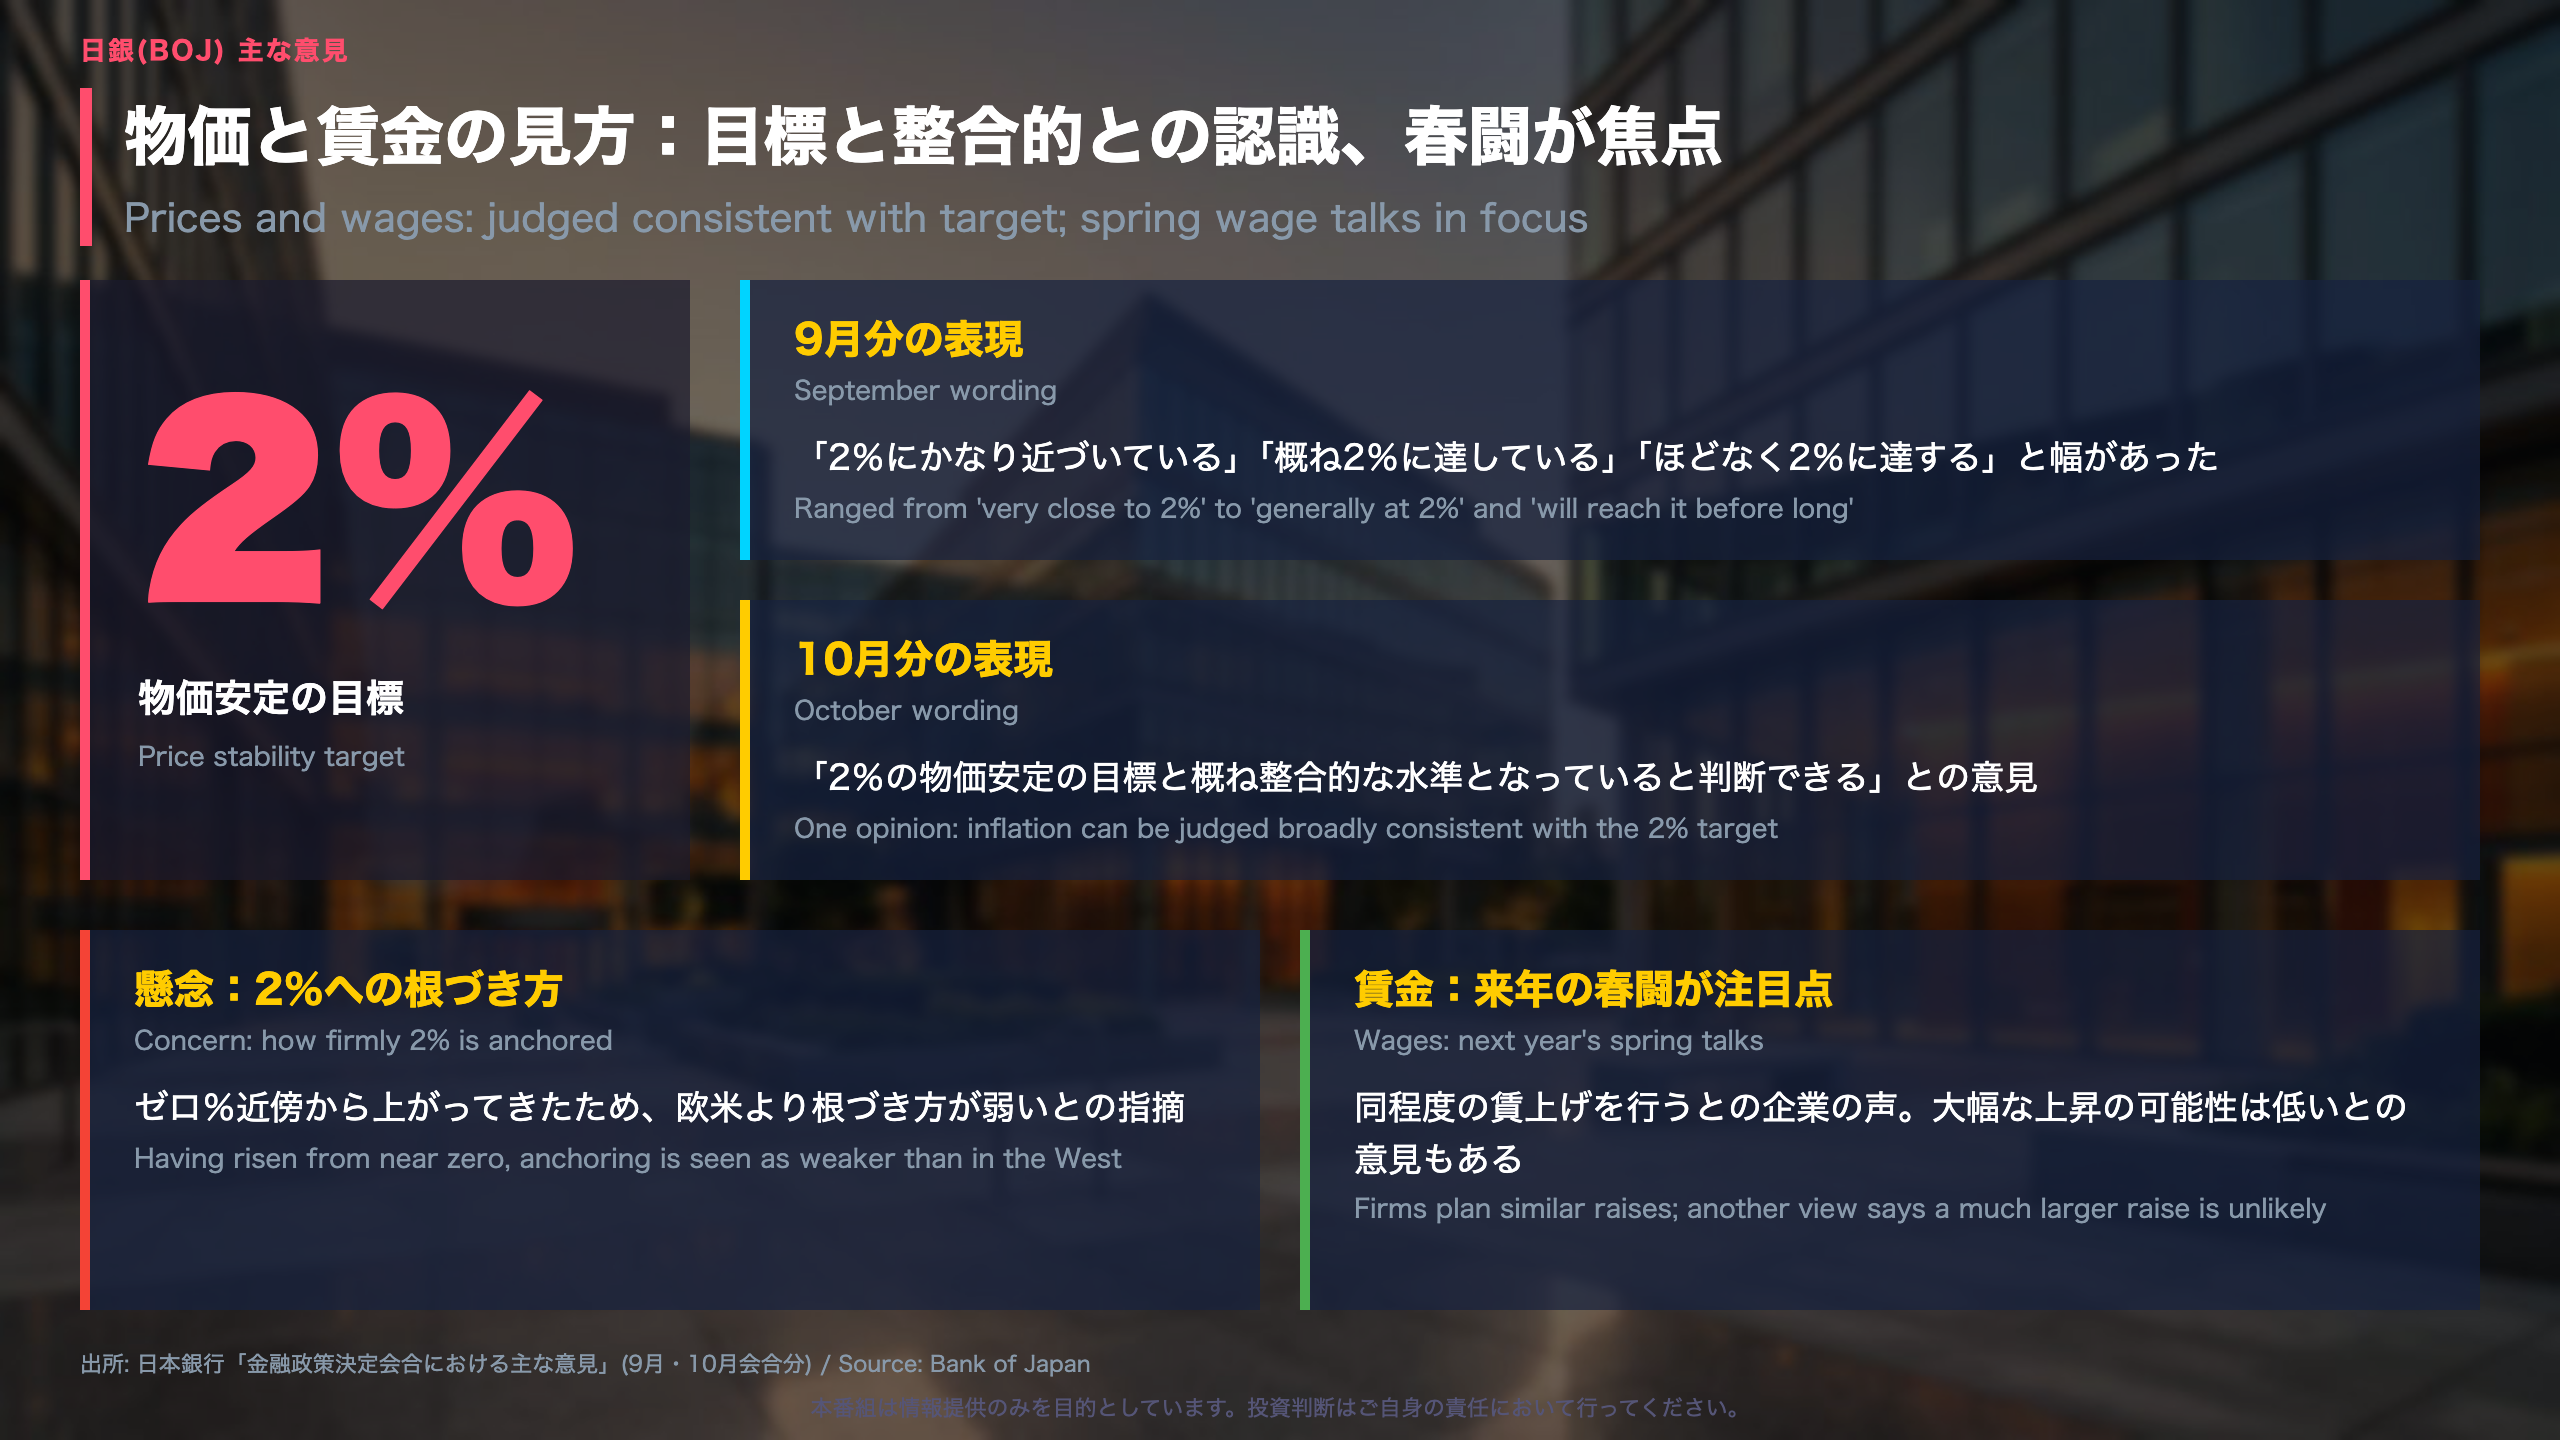
From “close to target” to “broadly consistent”
In the September summary, opinions on underlying inflation ranged from “very close to 2 percent” to “generally at 2 percent” and “will reach it before long.” This time, one opinion states that underlying inflation can be judged “broadly consistent” with the 2 percent price stability target. Several opinions pointing the same way is a mild signal that the wording is converging, not proof of a new regime. Note that the BOJ’s target is defined on headline consumer prices excluding nothing, while the US Fed targets PCE inflation, so the two 2 percent goals are not measured on the same yardstick.
Wages and second-round effects
- Some firms plan raises next year similar to this year’s, and one opinion says wage growth consistent with the 2 percent target could well continue.
- Another opinion argues that a much larger raise next year is unlikely, so the risk of second-round effects from prices into wages is not high.
- A further concern: because Japanese inflation rose from near zero, expectations may be less firmly anchored than in the US or Europe, making prices more reactive to external shocks. The document also stresses checking actual CPI readings alongside inflation expectations.
Two readings
The upside-watching side notes that year-on-year inflation has moved into the 2 percent range. The cautious side notes that consumer prices, currently pulled down by policy measures, may affect wage bargaining, and that rate hikes work with a lag.
What to watch
Next year’s spring wage negotiations (shunto) are cited by several opinions. Whether raises match this year’s or exceed them shapes how the second-round risk is judged.
利上げペースの論点:早めたい側と確認したい側、政府の意見
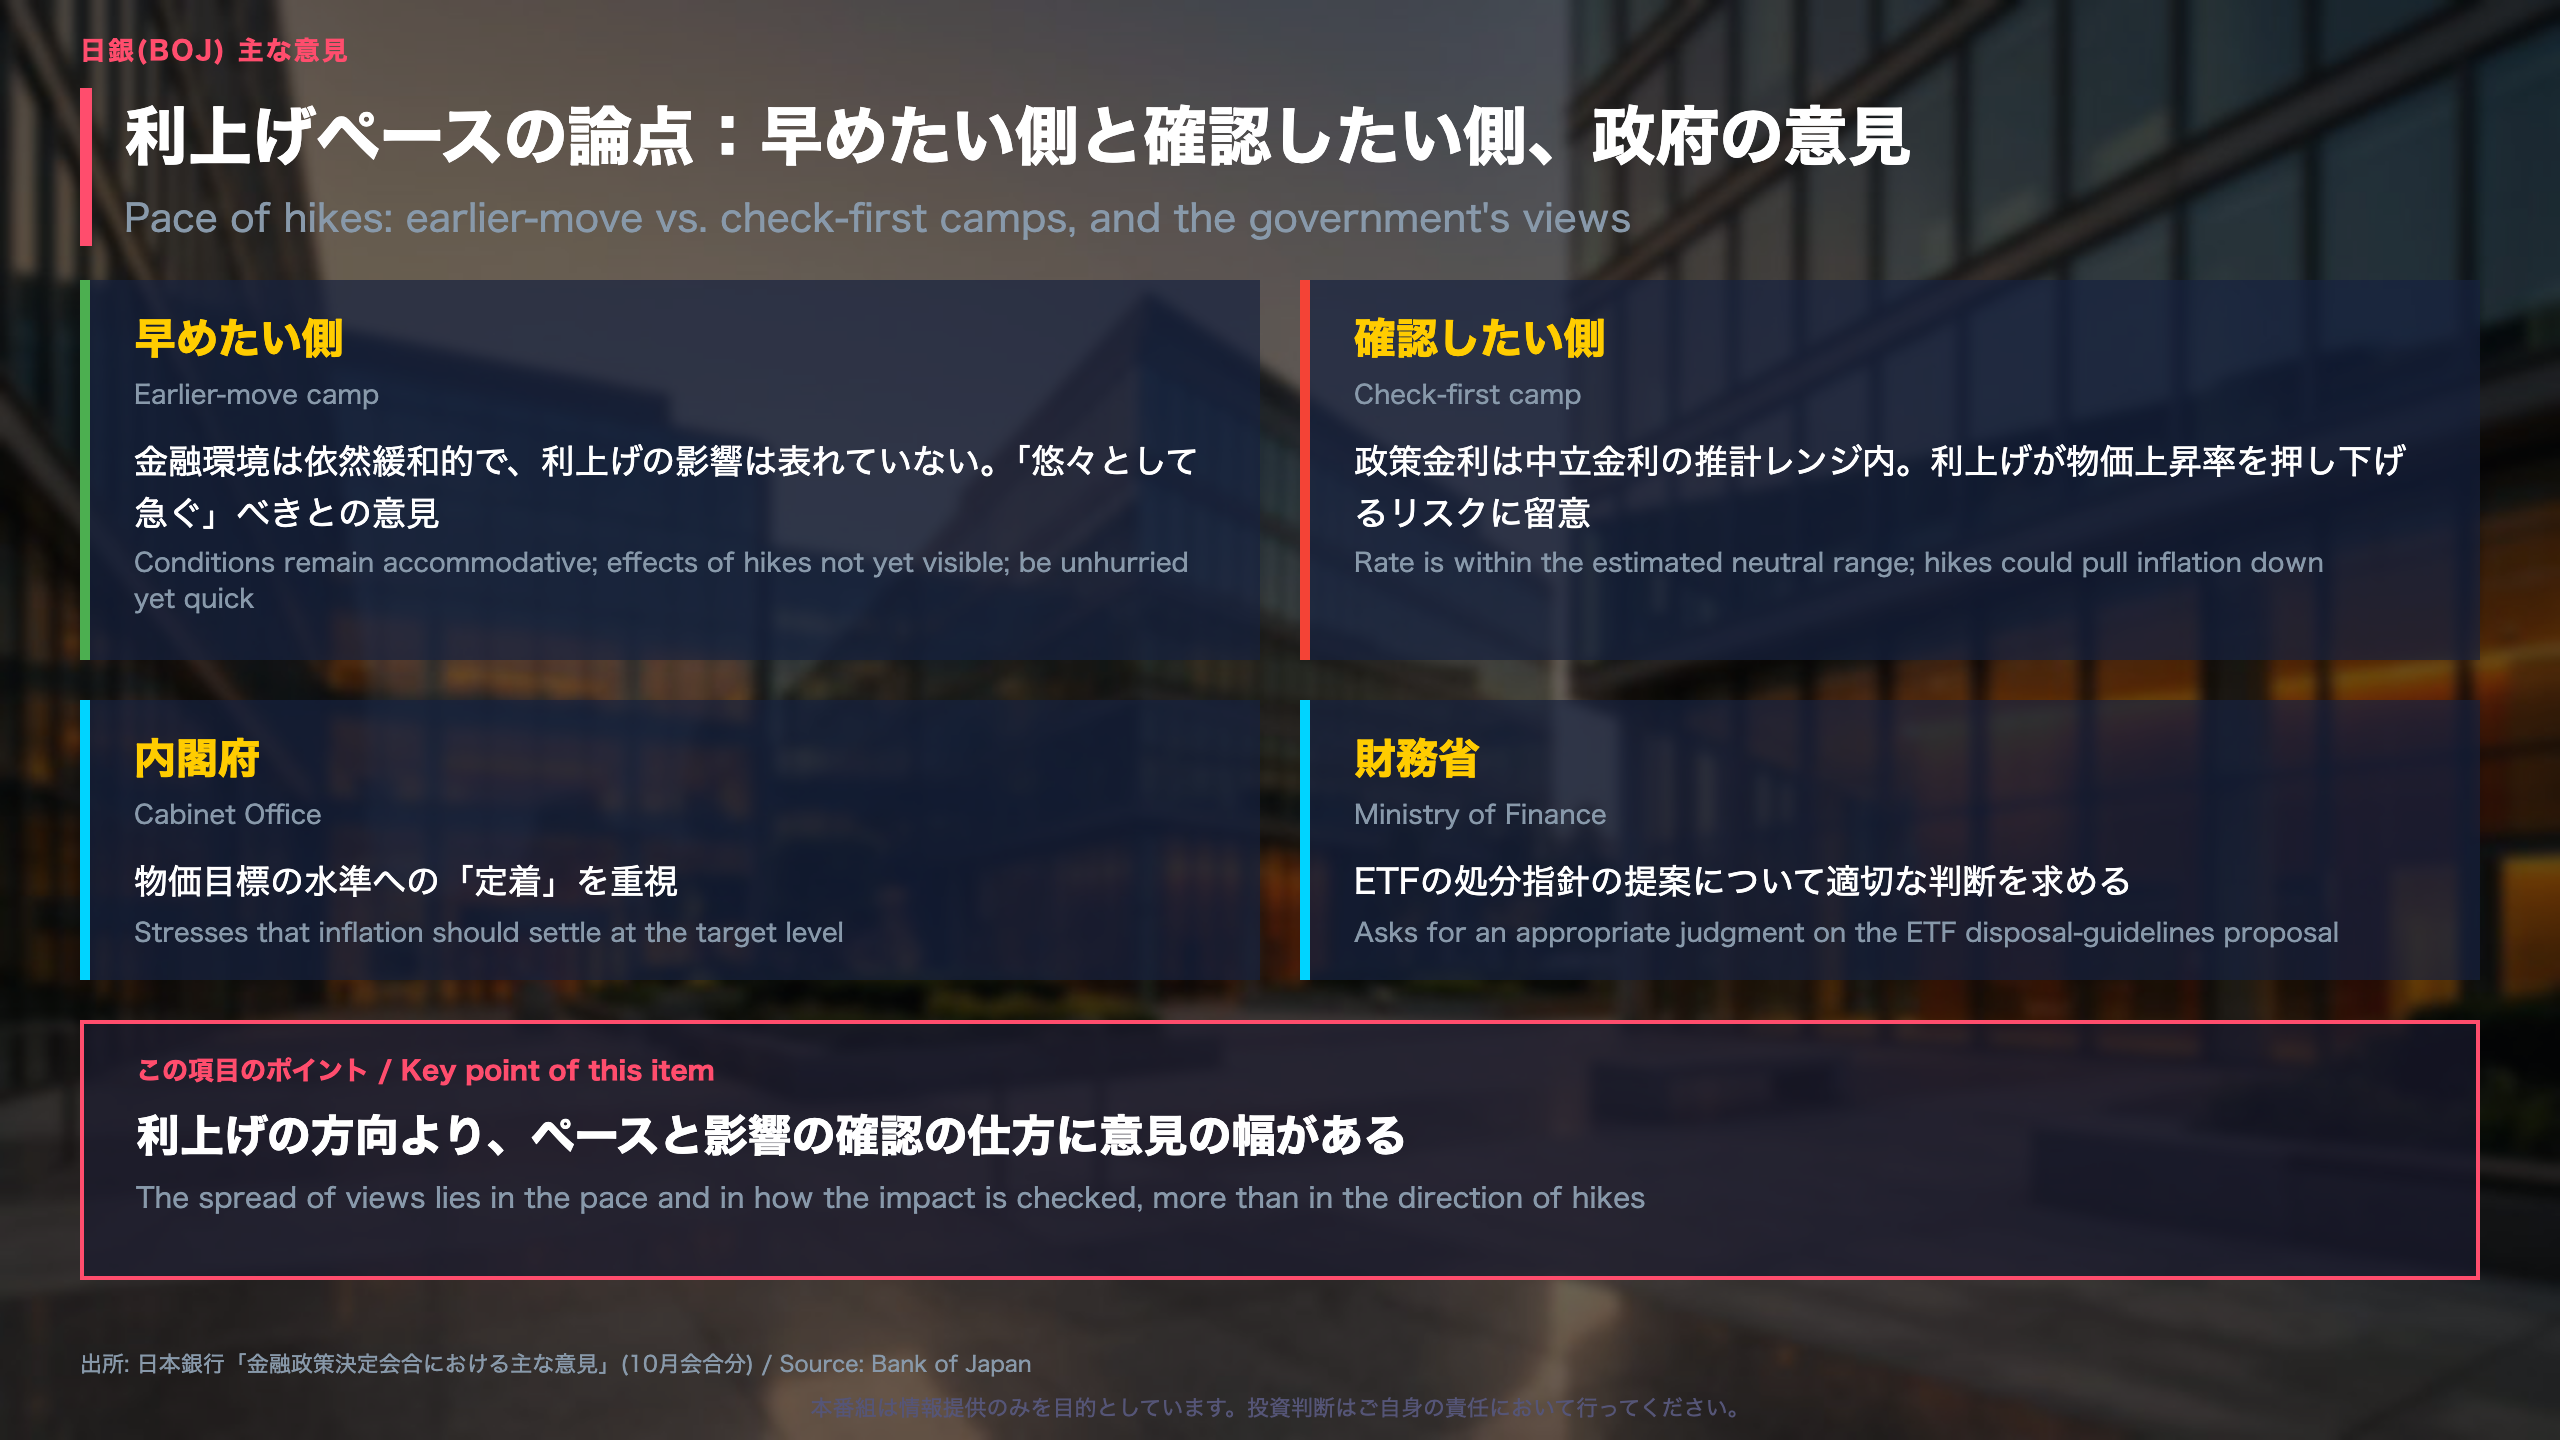
Two camps on the pace of tightening
The BOJ’s “neutral rate” is the policy rate that neither stimulates nor restrains the economy. It cannot be observed directly and is estimated as a range, which is why the document speaks of an “estimated range.” This is conceptually similar to the Fed’s longer-run rate, though the BOJ does not publish a dot plot.
- Earlier-move camp: Firms have grown more resilient to higher rates, the effects of past hikes have not materialized, and conditions remain accommodative. One opinion calls for checking conditions every few months after each hike while moving “unhurried yet quickly.”
- Cautious camp: The policy rate is already within the estimated neutral range, so further hikes could weigh on the economy and on underlying inflation. Underlying inflation may also settle near 2 percent without rushing.
Other points in the document
One opinion suggests assessing financial conditions along three axes: the real-rate gap, corporate finance and bank lending, and asset prices. It adds that equity gains are driven mainly by global AI demand, a factor separate from monetary policy.
On the ETF holdings the BOJ is selling, two opinions propose revisiting the sales pace, noting that roughly one year after sales began in January, they have proceeded without major market impact.
The government’s seats
The Ministry of Finance moved from asking for an appropriate judgment on a policy-rate proposal in September to the same request on an ETF disposal-guidelines proposal in October. The Cabinet Office called the moment a “fork in the road” for entering a virtuous cycle of growth and stressed that inflation should settle at the target level. Both kept the standard line calling for appropriate policy toward the 2 percent target.
What to watch
Whether the neutral-rate estimates remain a theme in later documents. This summary gives no next meeting date.
10月の企業物価、前月比プラスに転じる
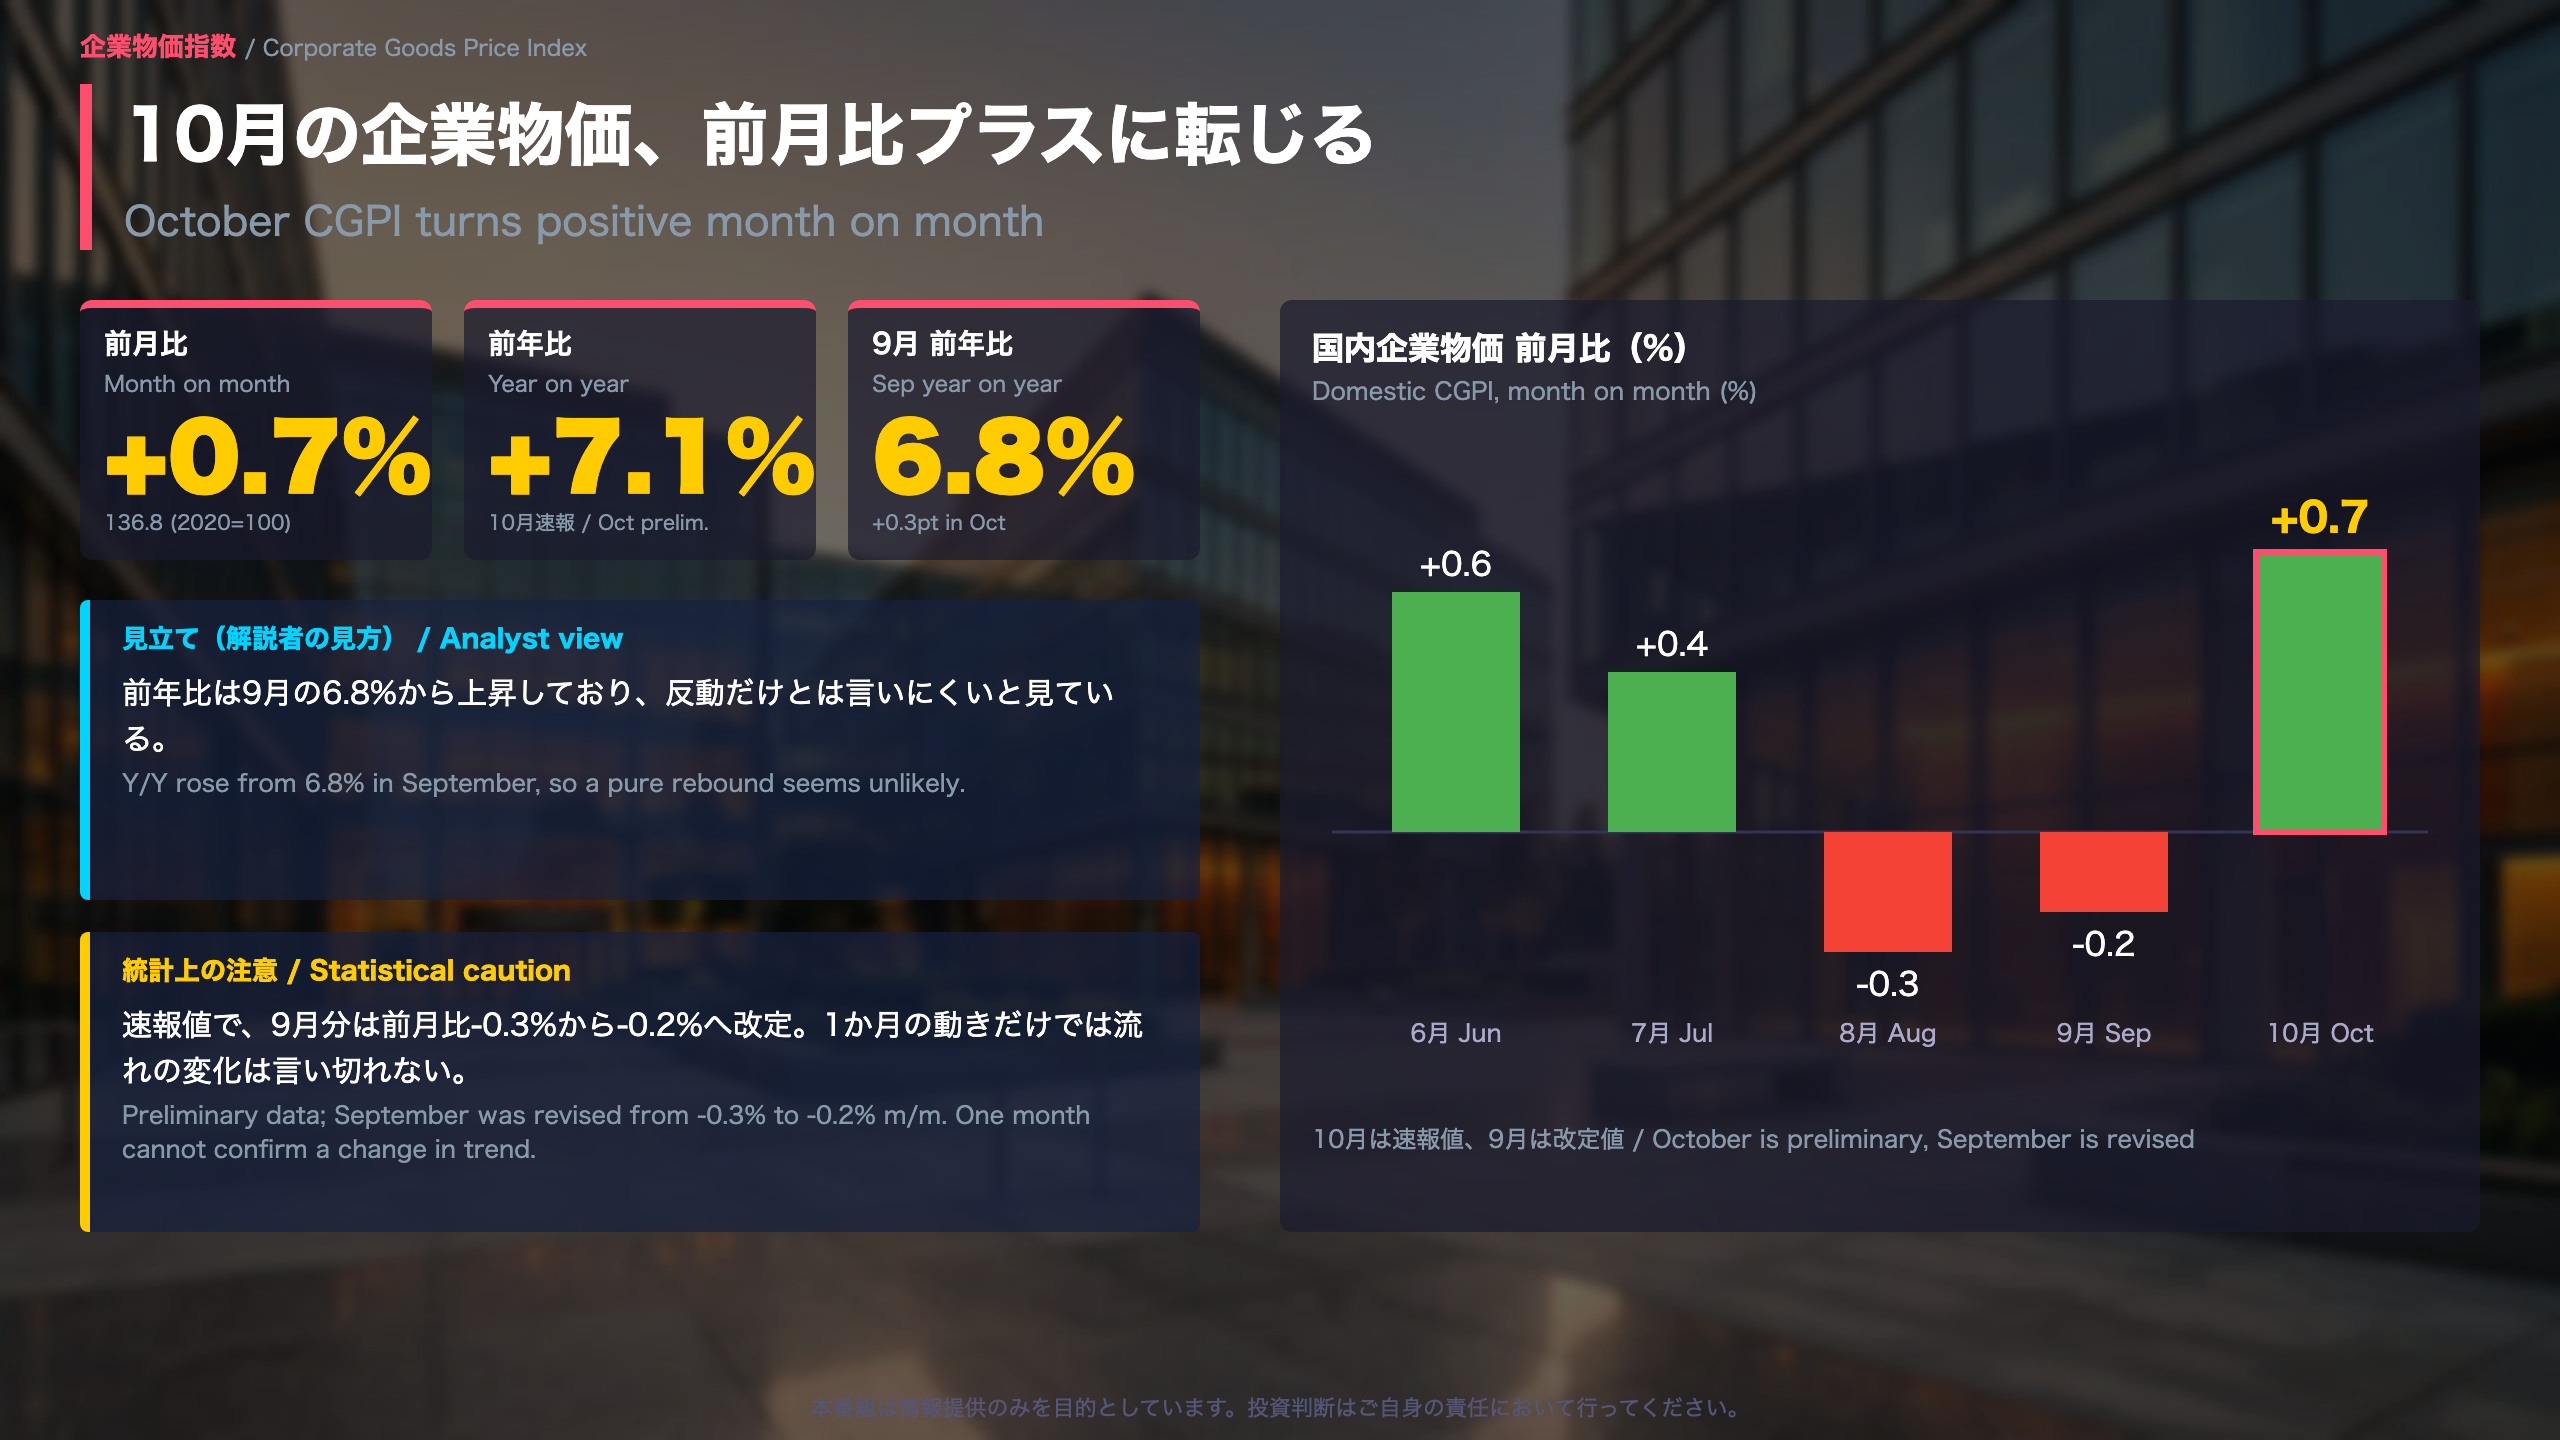
October CGPI: A Rebound After Two Monthly Declines
The Corporate Goods Price Index (CGPI), compiled by the Bank of Japan (BOJ), tracks the prices of goods traded between businesses. It plays a role comparable to producer price indexes published elsewhere, such as the US PPI, although baskets and methods differ. It is not the consumer price index that households see.
Headline figures
- Domestic CGPI: 136.8 (2020 average = 100)
- Month on month: +0.7%; year on year: +7.1%
- Adjusted for summer electricity rates: +0.9% month on month
The recent path
- June: +0.6% m/m, 7.5% y/y
- July: +0.4% m/m, 7.7% y/y
- August: -0.3% m/m, 7.6% y/y
- September (revised): -0.2% m/m, 6.8% y/y
- October (preliminary): +0.7% m/m, 7.1% y/y
Longer context
Year-on-year growth was 2.5%, 2.5% and 2.2% from December 2025 to February 2026. It jumped to 3.0% in March and 5.5% in April (+2.8% m/m), and has hovered around 7% since. The 7.7% reading in July remains the recent high.
Two readings
- Constructive: both monthly and annual rates turned up, and most categories rose.
- Cautious: this is a preliminary print, and the prior month was itself revised. One month does not establish a change in direction. Year-on-year rates also depend on the size of price moves a year earlier, so they should be read with care.
What to watch
The next release covers November data and is scheduled for December 10. The BOJ publication is a statistical release and contains no comment on monetary policy.
輸入物価:為替より外貨建て価格の上昇が大きい
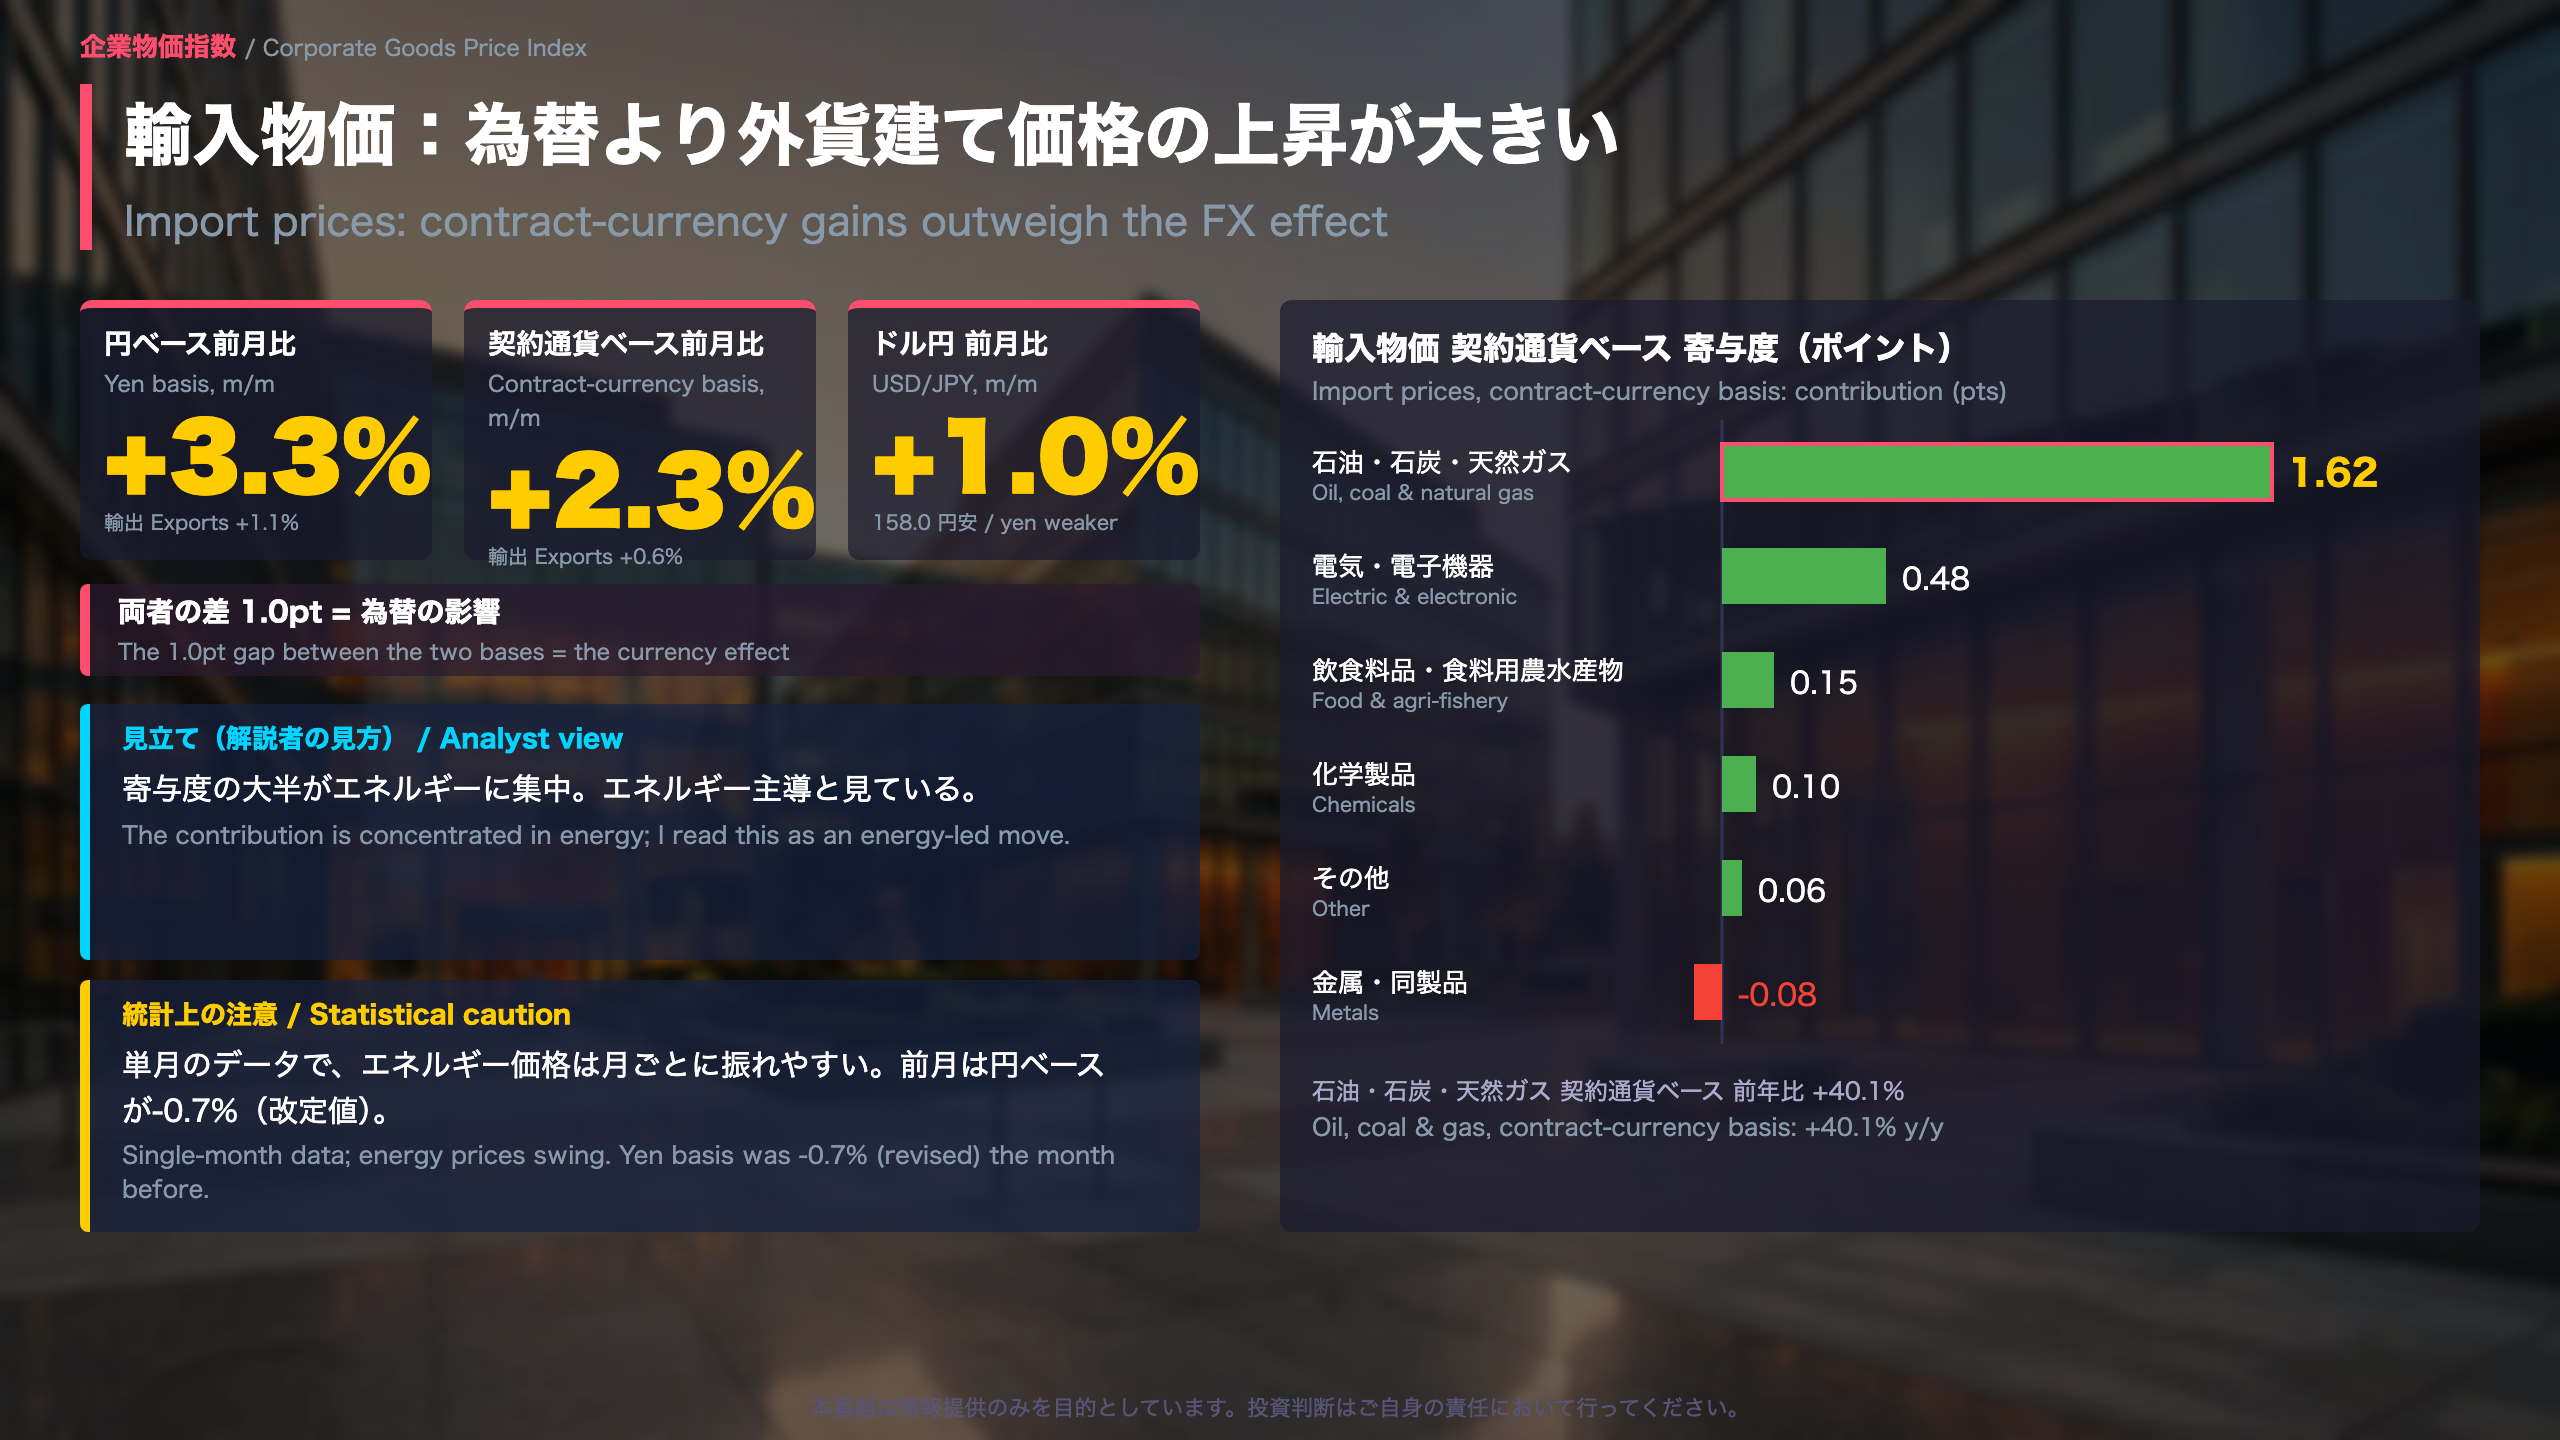
Splitting Import Prices Into Currency and Underlying Price Effects
Japan’s import price index is published in two forms. The yen basis converts prices into yen, while the contract-currency basis tracks prices in the currencies actually used in trade, such as the US dollar. The difference between them is the exchange-rate effect. This month the dollar-yen rate was 158.0, a 1.0% move toward a weaker yen from the previous month.
Headline comparison (month on month)
- Imports: +3.3% (yen basis) versus +2.3% (contract-currency basis)
- Exports: +1.1% (yen basis) versus +0.6% (contract-currency basis)
Because the 1.0-point gap on imports matches the currency move, the contract-currency rise of 2.3% is the larger part of the story.
Where the increase came from
Contributions to the contract-currency import index (percentage points):
– Oil, coal and natural gas: 1.62 (+5.3% m/m; +40.1% y/y)
– Electric and electronic equipment: 0.48 (memory integrated circuits are among the items)
– Food and agri-fishery inputs: 0.15
– Chemicals: 0.10
– Metals: -0.08
On the export side, chemicals (+0.30), petroleum and other products (+0.30) and electronics (+0.15) pushed the index up, while metals (-0.15) pulled it down.
Two views
- Energy-led: the bulk of the contribution is concentrated in oil, coal and gas.
- Caution: this is one month of data, and energy prices can swing. The yen-basis import index had fallen 0.7% (revised) the previous month.
Why it matters
Import prices feed into costs for Japanese firms, so this breakdown helps separate currency effects from the underlying price of imported goods. The next data point arrives on December 10.
国内企業物価:上昇は広がる、農林水産物が下押し
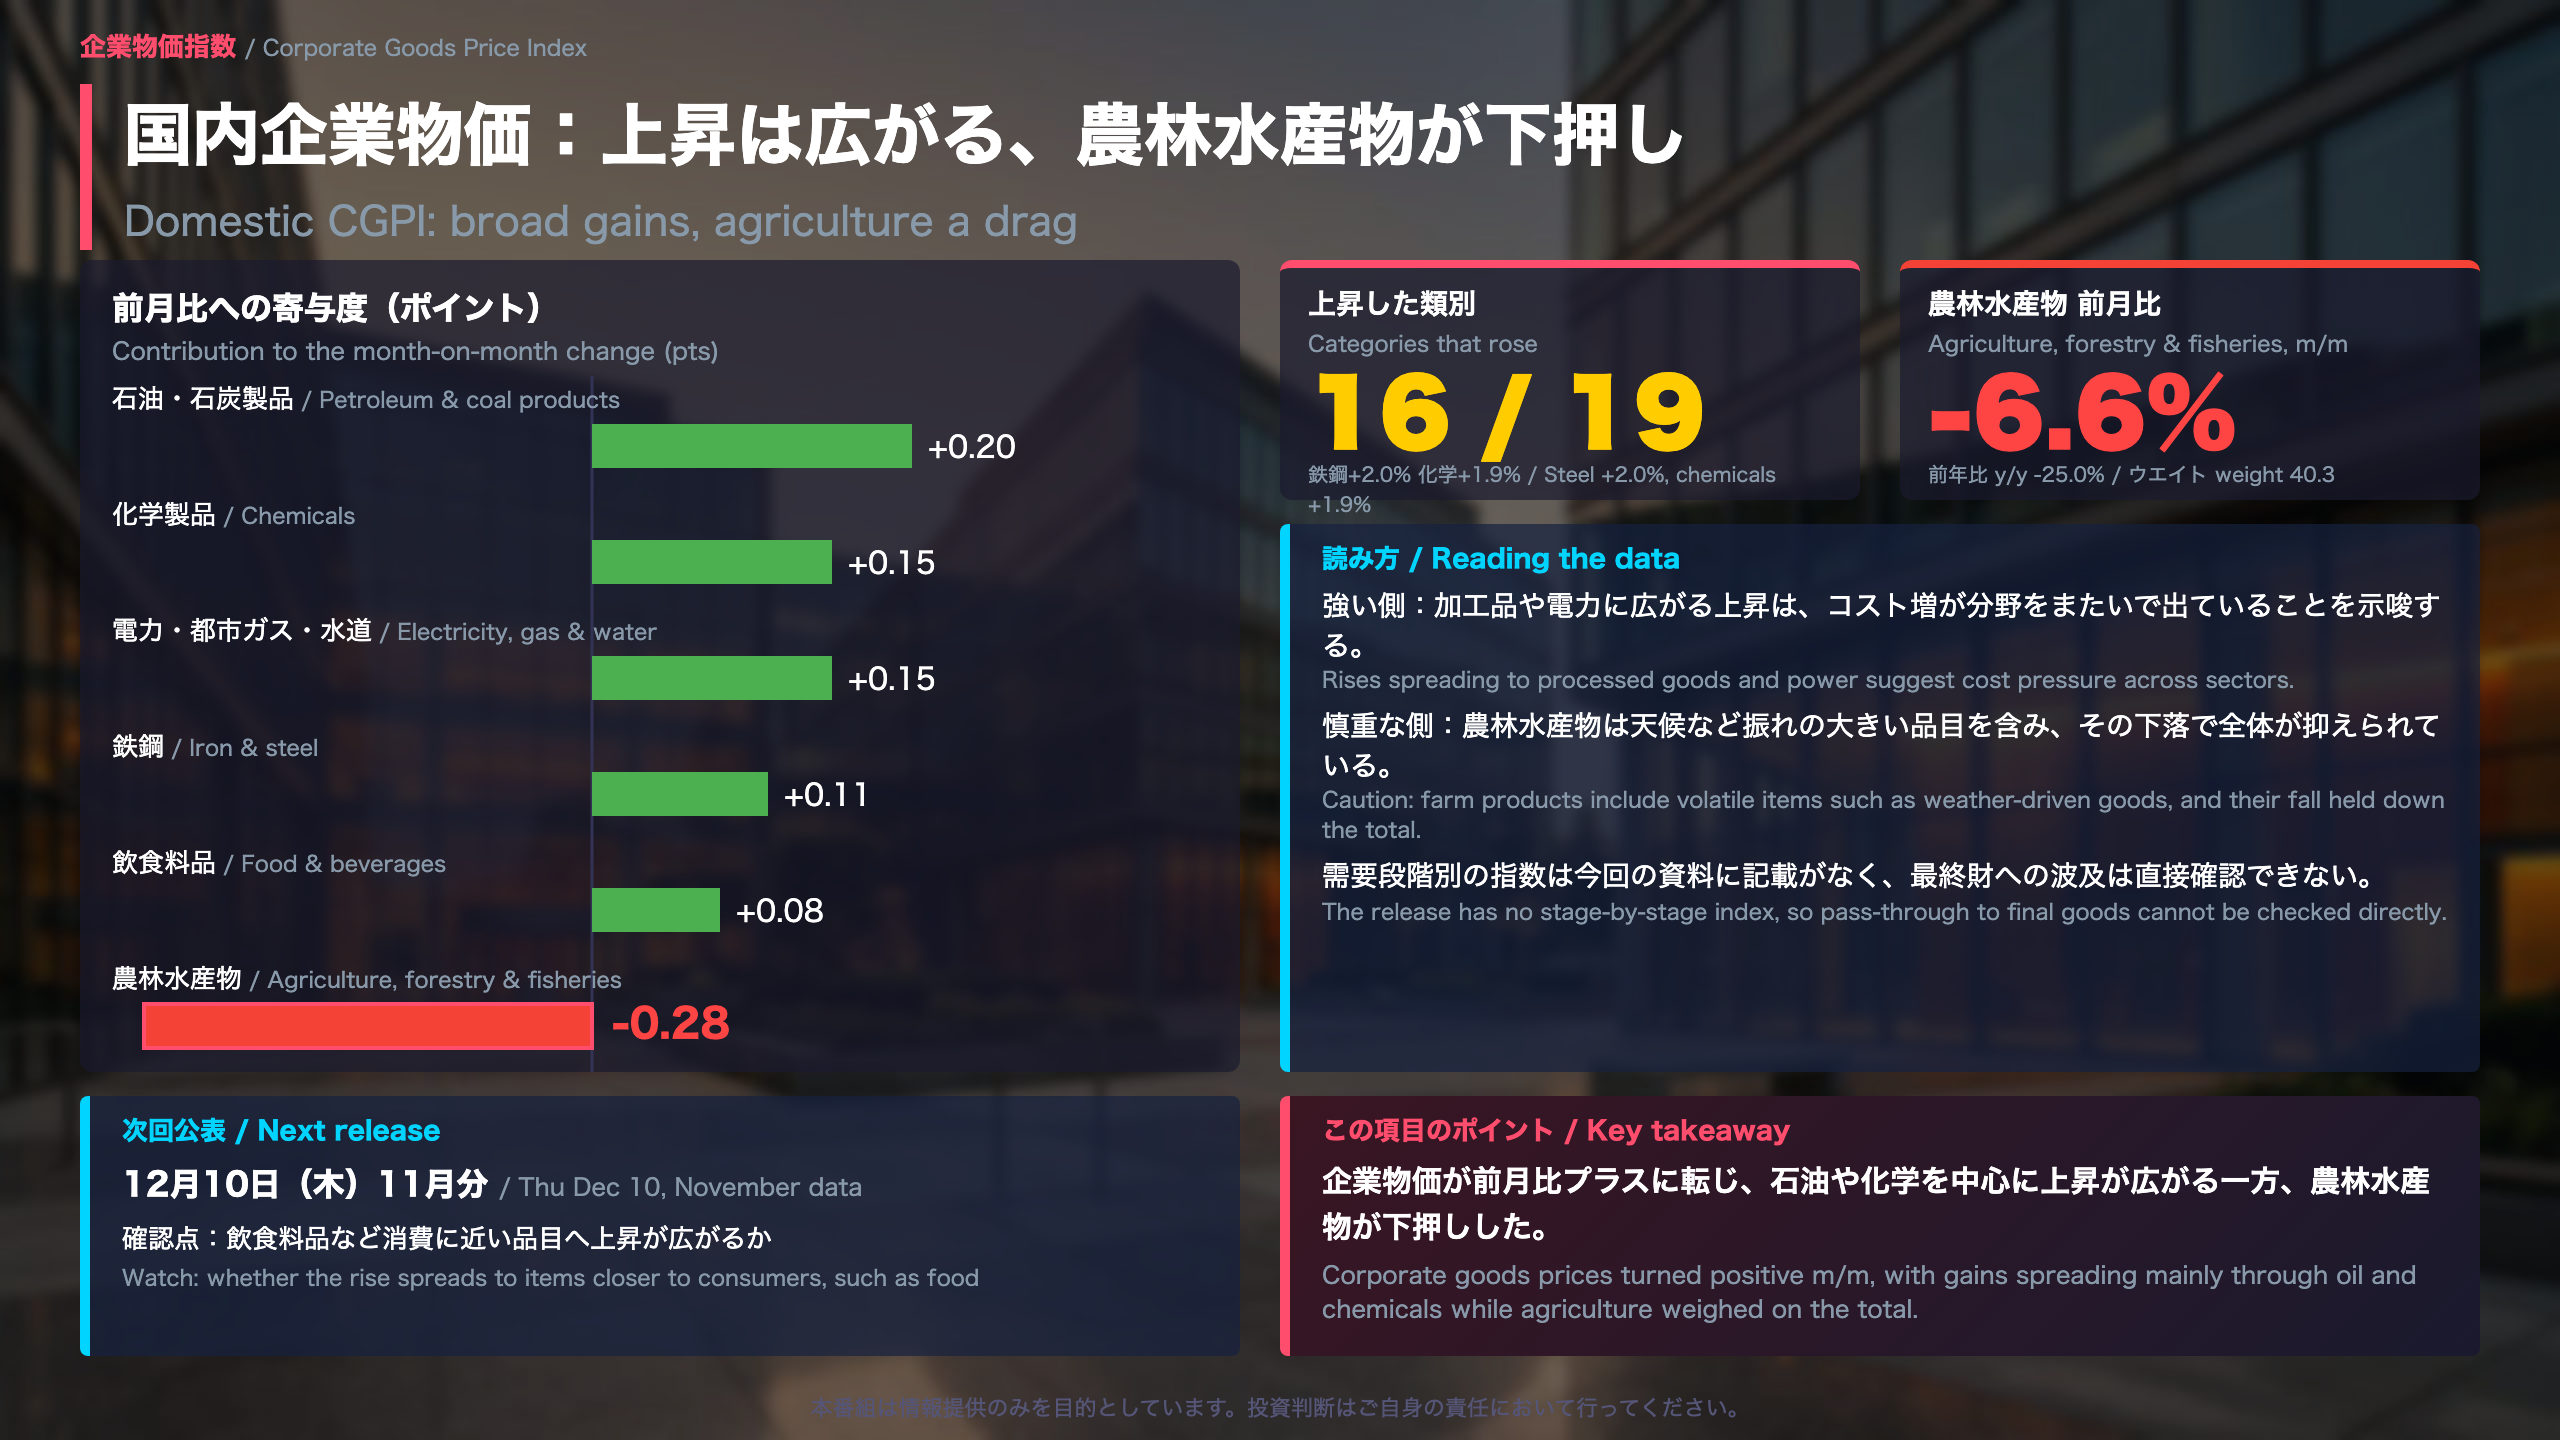
Domestic CGPI: Broad Gains, With Agriculture as the Main Drag
The domestic CGPI covers goods produced and sold within Japan, as compiled by the Bank of Japan (BOJ). The headline rise this month was spread widely across categories, but one volatile group pulled the total down.
Contributions to the month-on-month change (percentage points)
- Petroleum and coal products: +0.20 (heavy fuel oil, naphtha, jet fuel)
- Chemicals: +0.15 (xylene, ethylene, propylene)
- Electricity, city gas and water: +0.15 (city gas, business electricity)
- Iron and steel: +0.11
- Food and beverages: +0.08 (compound feed, sparkling alcohol, sweet bread)
- Agriculture, forestry and fisheries: -0.28 (rice, pork)
Breadth of the increase
16 of 19 categories rose. Steel gained 2.0%, chemicals 1.9%, plastics 1.6%, textiles 1.6% and electrical machinery 1.1%. Electricity, city gas and water rose 2.4% m/m and 15.8% y/y. Only non-ferrous metals (-0.5%), business machinery (-0.2%) and information and communication equipment (-0.6%) declined.
The agricultural drag
Agricultural products fell 6.6% m/m and 25.0% y/y, following a revised 10.5% drop the previous month. Its weight in the index is 40.3 out of 1,000, which explains the -0.28 point contribution.
Two readings
- Broad cost pressure: gains in processed goods and utilities suggest costs rising across sectors.
- Caution: farm products are affected by weather and other volatile factors, and their decline held down the total. The release gives no stage-by-stage index, so pass-through to final goods cannot be checked directly.
Reference and next steps
The chain-weighted index, shown for reference, rose 0.9% m/m and 7.1% y/y. The next release, covering November, is due December 10. Watch whether increases reach items closer to consumers, such as food and beverages.
9月の経常収支:黒字は維持も、前年から約2兆円縮小
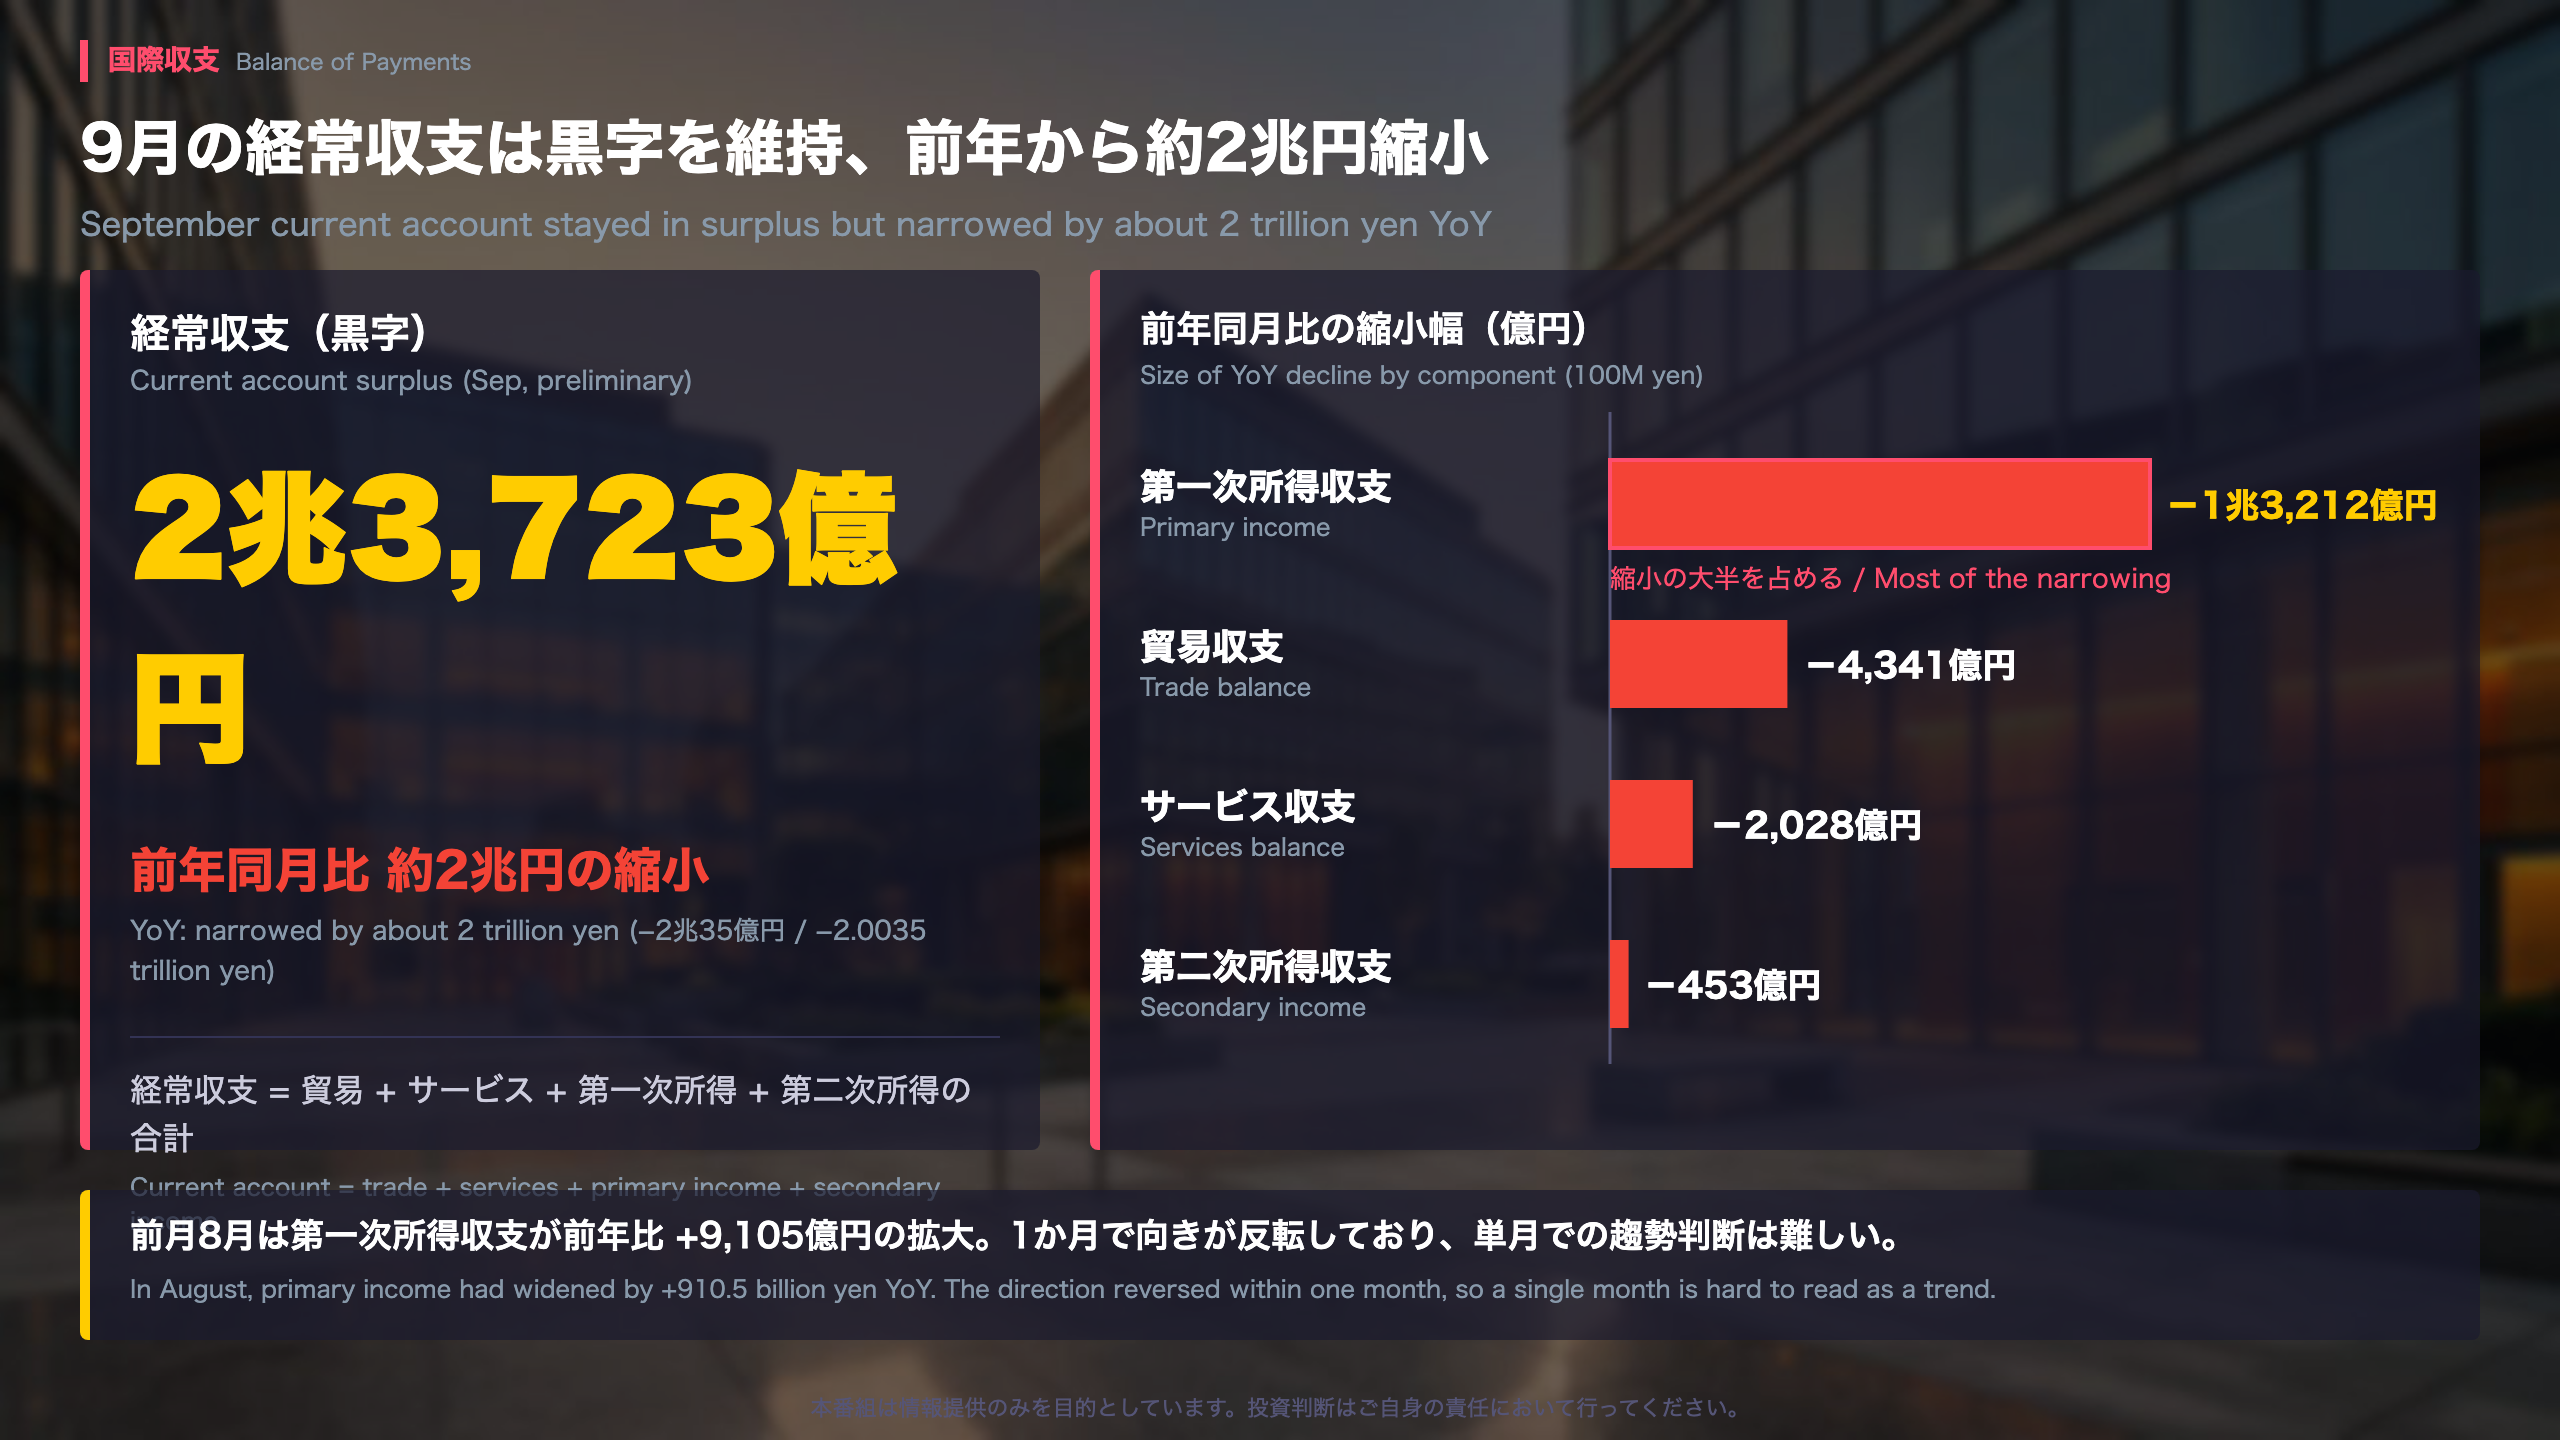
Japan’s September Balance of Payments: Why the Surplus Shrank
Context. Japan’s Ministry of Finance (MOF) publishes the balance of payments every month. The current account is the sum of four lines: trade, services, primary income (investment income such as interest and dividends received from abroad) and secondary income (other transfers). The September preliminary reading showed a surplus of ¥2.3723 trillion, which is ¥2.0035 trillion smaller than a year earlier.
Component breakdown (change vs. a year earlier)
- Primary income: surplus of ¥3.5535 trillion, down ¥1.3212 trillion
- Trade: deficit of ¥187.5 billion, worse by ¥434.1 billion (a swing into deficit)
- Services: deficit of ¥456.9 billion, worse by ¥202.8 billion
- Secondary income: deficit of ¥536.8 billion, worse by ¥45.3 billion
All four lines moved in the weaker direction, but primary income alone explains roughly two thirds of the narrowing. The MOF release says the current account narrowed “mainly because the primary income surplus shrank,” and it points to a smaller direct investment income surplus.
A volatile monthly series
The month-to-month swing is large. In August the current account surplus was ¥4.062 trillion, ¥433.9 billion wider than a year earlier, and primary income had expanded by ¥910.5 billion year on year. September reversed that direction within one month.
Two readings
- Cautious: a simultaneous deterioration across all four components is not trivial.
- Balanced: the account stayed in surplus, and primary income remained above ¥3.5 trillion. Because a single month can be noisy, the October data will show whether the decline in primary income persists.
This is a Japan-specific yardstick: the headline here is a monthly balance in yen, not a year-on-year percentage change.
貿易収支は赤字転化:輸入の増加は数量ではなく価格が主導
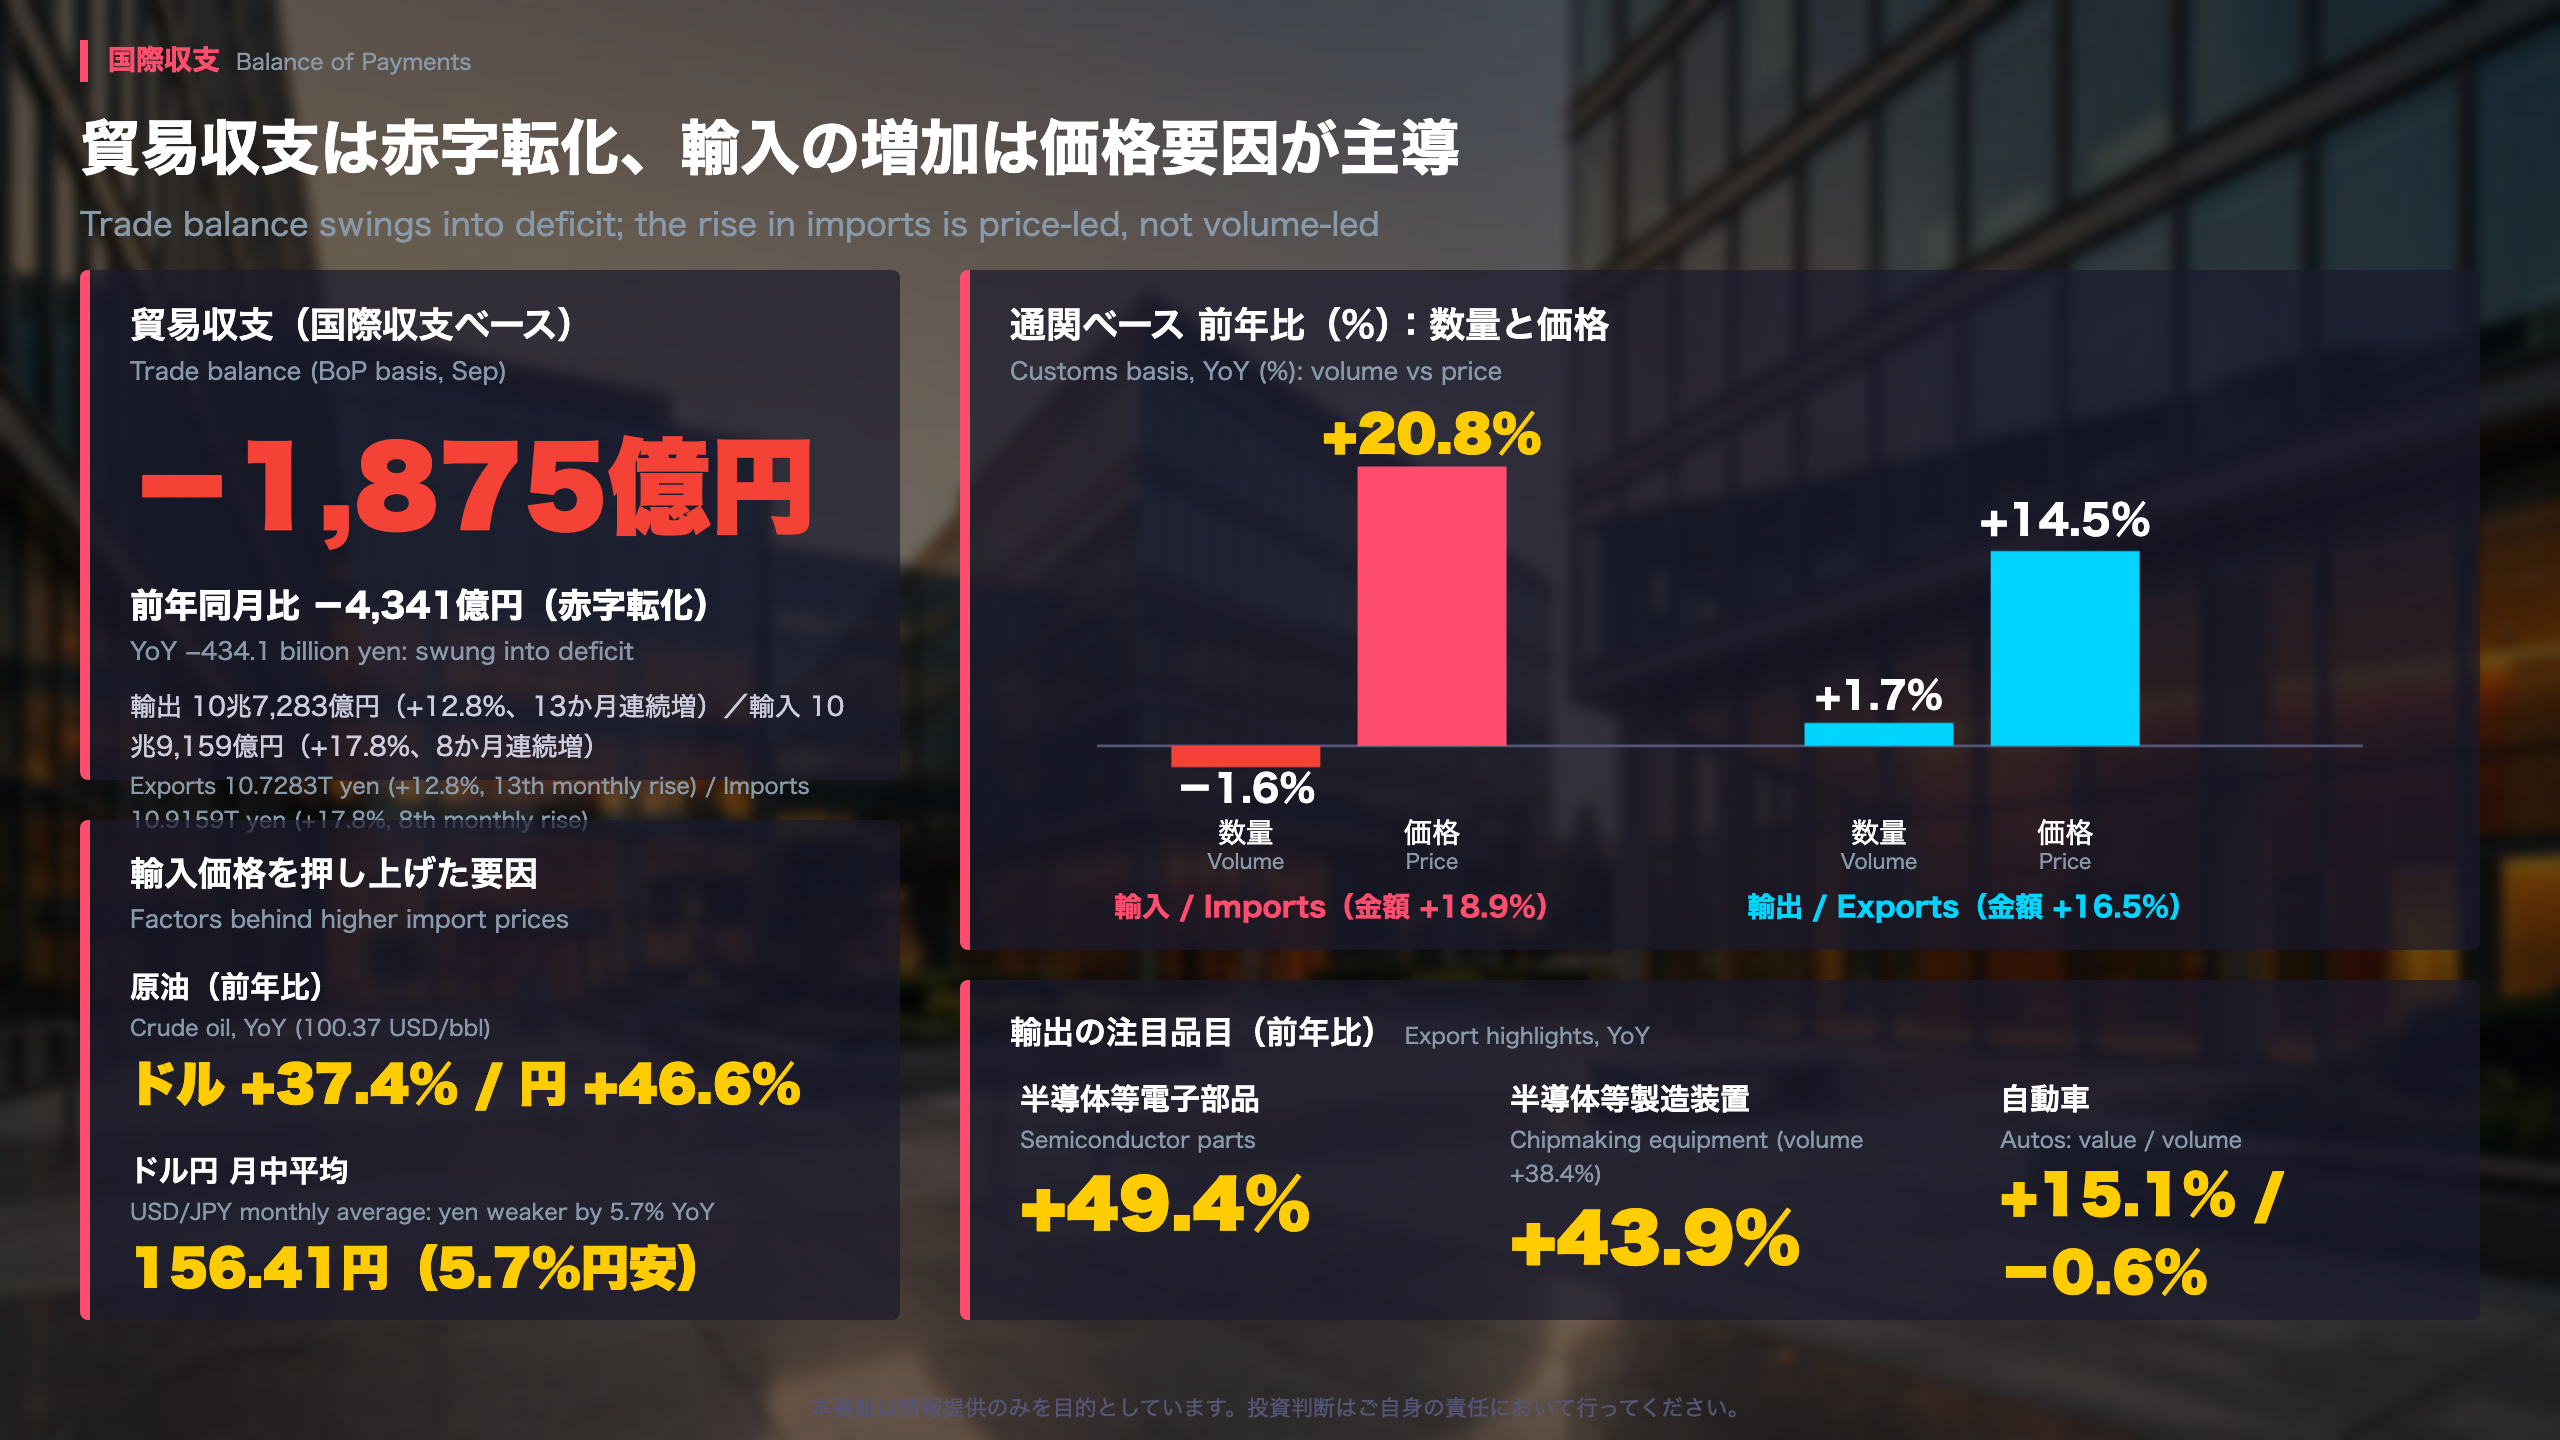
Japan’s September Trade Balance: A Price Story, Not a Volume Story
Two statistical bases. Japan reports trade in two ways. The balance-of-payments (BoP) basis, compiled by the Ministry of Finance (MOF), is the version that feeds the current account. The customs basis is the traditional trade statistic, and the release shows it as a reference. The two differ in coverage and timing, so they should not be mixed.
BoP basis
- Exports: ¥10.7283 trillion (+12.8% YoY, 13th straight monthly increase)
- Imports: ¥10.9159 trillion (+17.8% YoY, 8th straight monthly increase)
- Trade balance: −¥187.5 billion, worse by ¥434.1 billion from a year earlier (a swing into deficit)
Customs basis: volume versus price
| Value | Volume | Price | |
|---|---|---|---|
| Exports | +16.5% | +1.7% | +14.5% |
| Imports | +18.9% | −1.6% | +20.8% |
Import volume fell, so the larger import bill came from prices. Crude oil averaged $100.37 per barrel (+37.4% YoY in dollars, +46.6% in yen), and USD/JPY averaged 156.41, a 5.7% weaker yen than a year earlier. I read those two factors as compounding each other.
Export composition
Semiconductor parts rose 49.4% and chipmaking equipment 43.9%, with volume up 38.4%, which may reflect AI and semiconductor demand. Autos rose 15.1% in value while volume slipped 0.6%, pointing to higher unit prices. By destination, Asia rose 17.3% and North America 23.8%.
Takeaway
The deficit is not a sign of overheated domestic demand, given falling import volume, but it does highlight Japan’s reliance on imported energy. This is a single-month reading and not a forecast.
金融収支:海外勢は日本株を売り越し・債券を買い越し
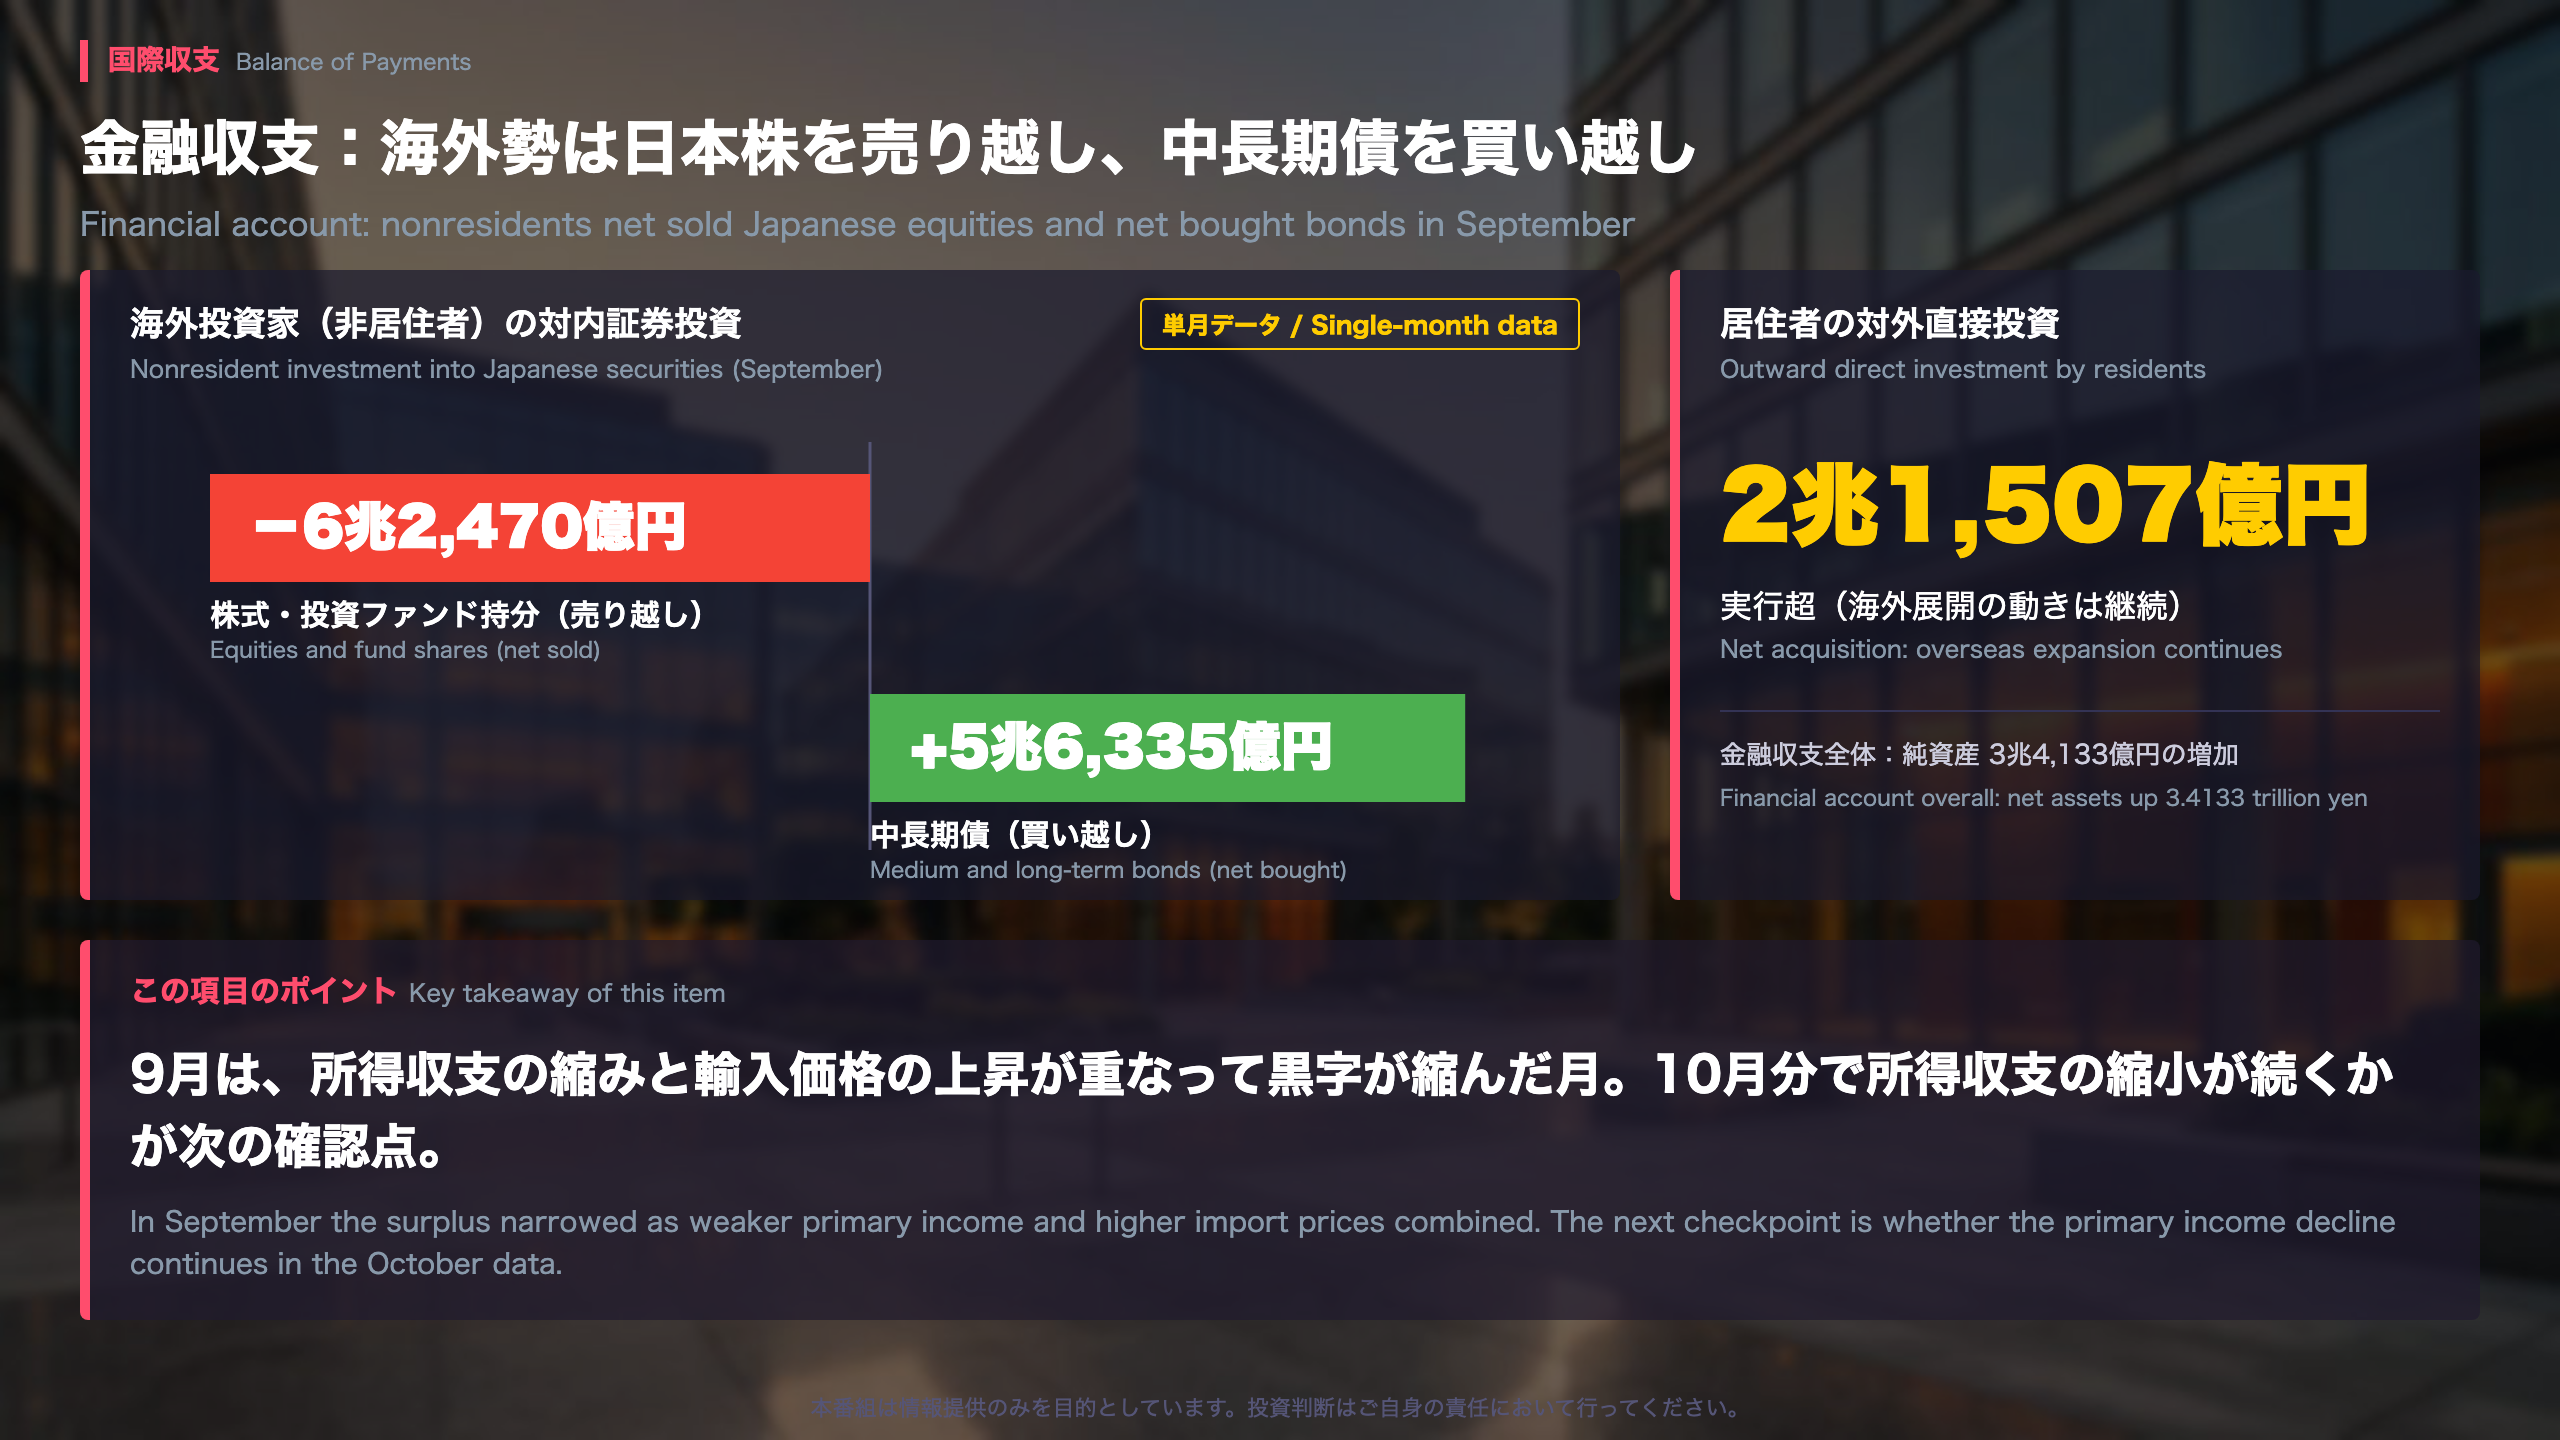
Japan’s September Financial Account: Foreign Investors Sell Stocks, Buy Bonds
What the financial account measures. While the current account tracks goods, services and income, the financial account records the cross-border investment flows that mirror them. In Japan’s BoP release, the nonresident side shows how overseas investors are positioning in Japanese assets, and the resident side shows Japanese investors’ purchases of foreign assets.
Nonresident flows in September
| Item | Flow |
|---|---|
| Equities and investment fund shares | −¥6.247 trillion (net selling, led by banks and similar institutions) |
| Medium and long-term debt | +¥5.6335 trillion (net buying, mainly government bonds) |
The equity selling and the bond buying were of roughly similar size. The overall financial account showed a net asset increase of ¥3.4133 trillion.
Resident side
Direct investment abroad was a net ¥2.1507 trillion, so Japanese companies’ overseas expansion has not slowed. I read that as a long-term source of primary income, though not necessarily within a given month.
Services and tourism
The services deficit widened by ¥202.8 billion to ¥456.9 billion, with the release citing “other services.” Inbound visitors totaled 3,103,700 (−5.0% YoY), a second straight year-on-year decline after −9.6% in August, while Japanese departures rose 6.3% to 1,481,900.
Two readings
- Rotation: one month looks like a shift from equities to bonds.
- Noise: it is a single month, and a single sector accounts for the equity selling. Persistence is unproven.
Next checkpoint: whether primary income stays weak in the October release. The release is typically published in early December. This summary reflects the data only and is not a forecast.
一致指数は2か月ぶり上昇、生産・出荷が押し上げ
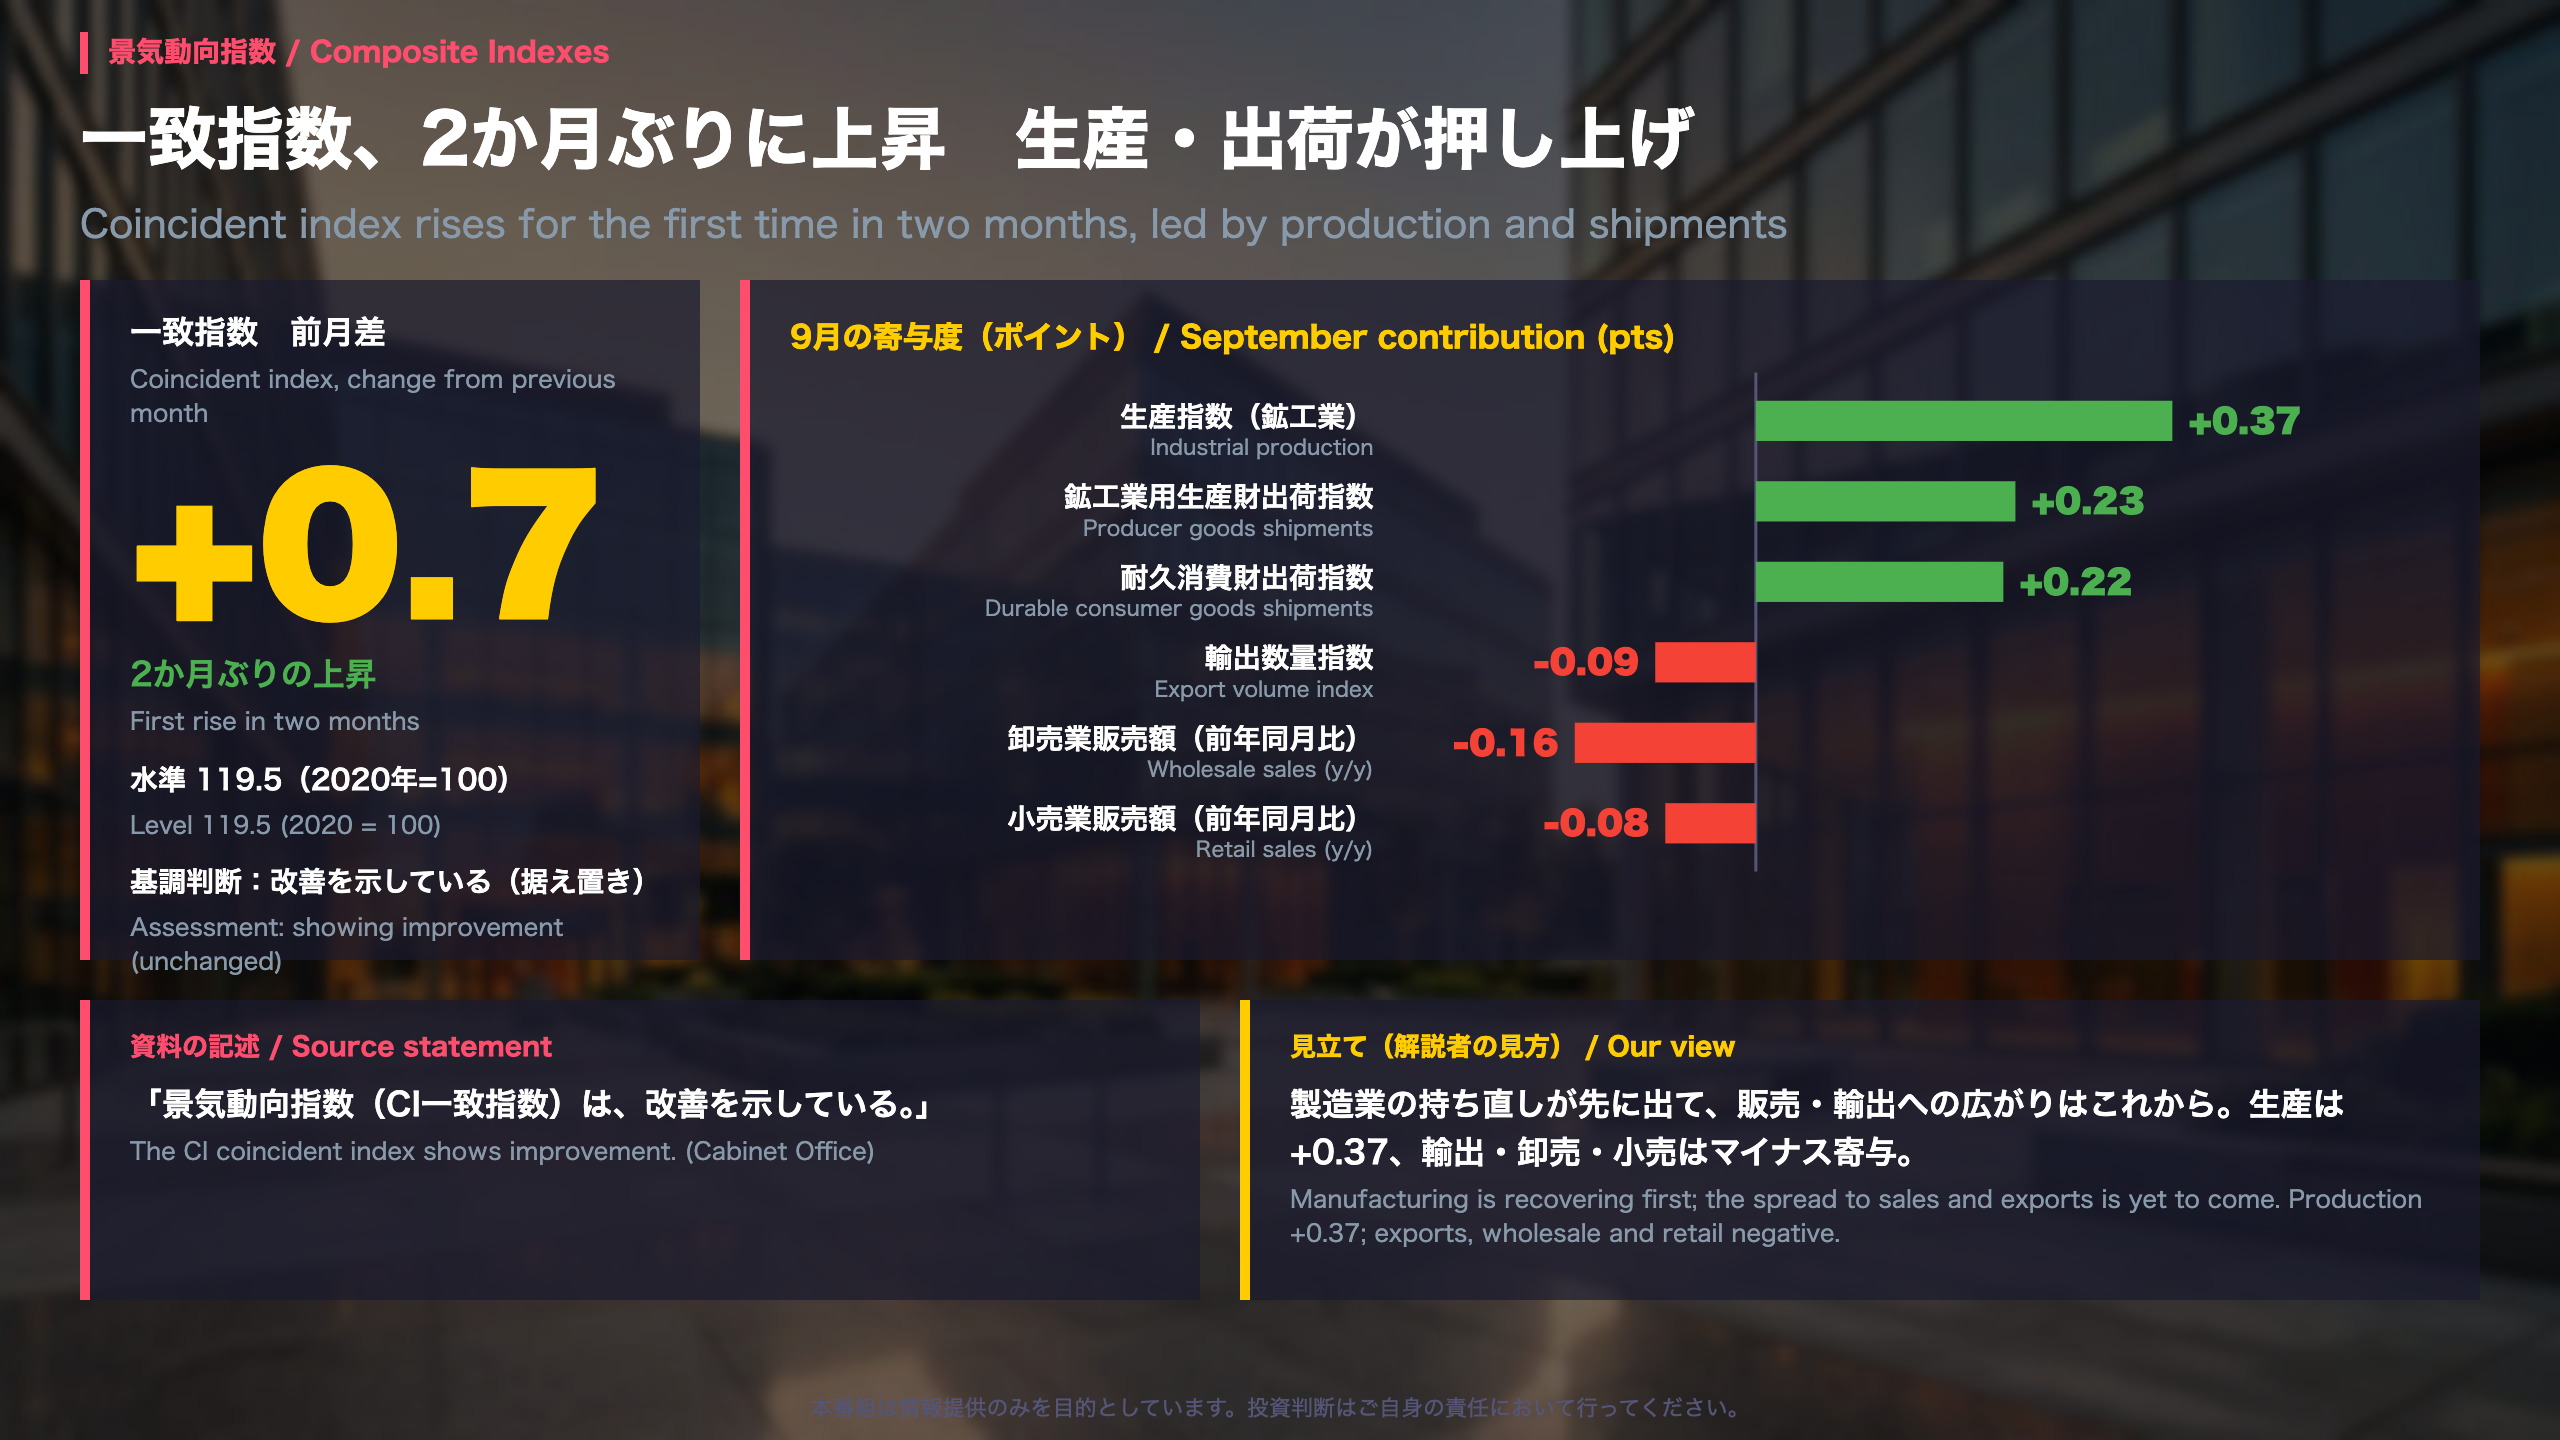
Japan’s Composite Indexes, September flash: output rebounds first
What is this report? Japan’s Cabinet Office publishes the Composite Indexes (CI) every month. They bundle many statistics into three gauges: a leading index (which tends to turn before the economy), a coincident index (which moves with it) and a lagging index (which confirms turns afterward). The closest U.S. analogue is the Conference Board’s set of leading, coincident and lagging indexes. Japan’s headline ‘basic assessment’ is built on the coincident index.
Key figures
- Coincident index: 119.5 (2020 = 100), up 0.7 points m/m. The level was 118.9 in June, 120.6 in July and 118.8 in August (revised).
- Largest positive contributions: industrial production (+0.37), producer goods shipments (+0.23), durable consumer goods shipments (+0.22).
- Negative contributions: wholesale sales (-0.16), export volume (-0.09), retail sales (-0.08).
Two readings
Constructive: Production swung from -0.39 in August to +0.37 in September, which suggests the factory slump may have run its course.
Cautious: Durable goods shipments (104.5) are still below July’s 107.5, and wholesale sales growth slowed to +6.4% y/y from +8.0%.
Caveats
Labor input and operating profit were not yet included in the September calculation. Flash figures also get revised: August industrial production was cut from 102.6 to 101.9. The Cabinet Office’s own wording is that the CI coincident index ‘shows improvement.’ Data from October onward will show whether the recovery broadens beyond manufacturing.
先行指数は17か月ぶり低下、3か月平均は上昇維持
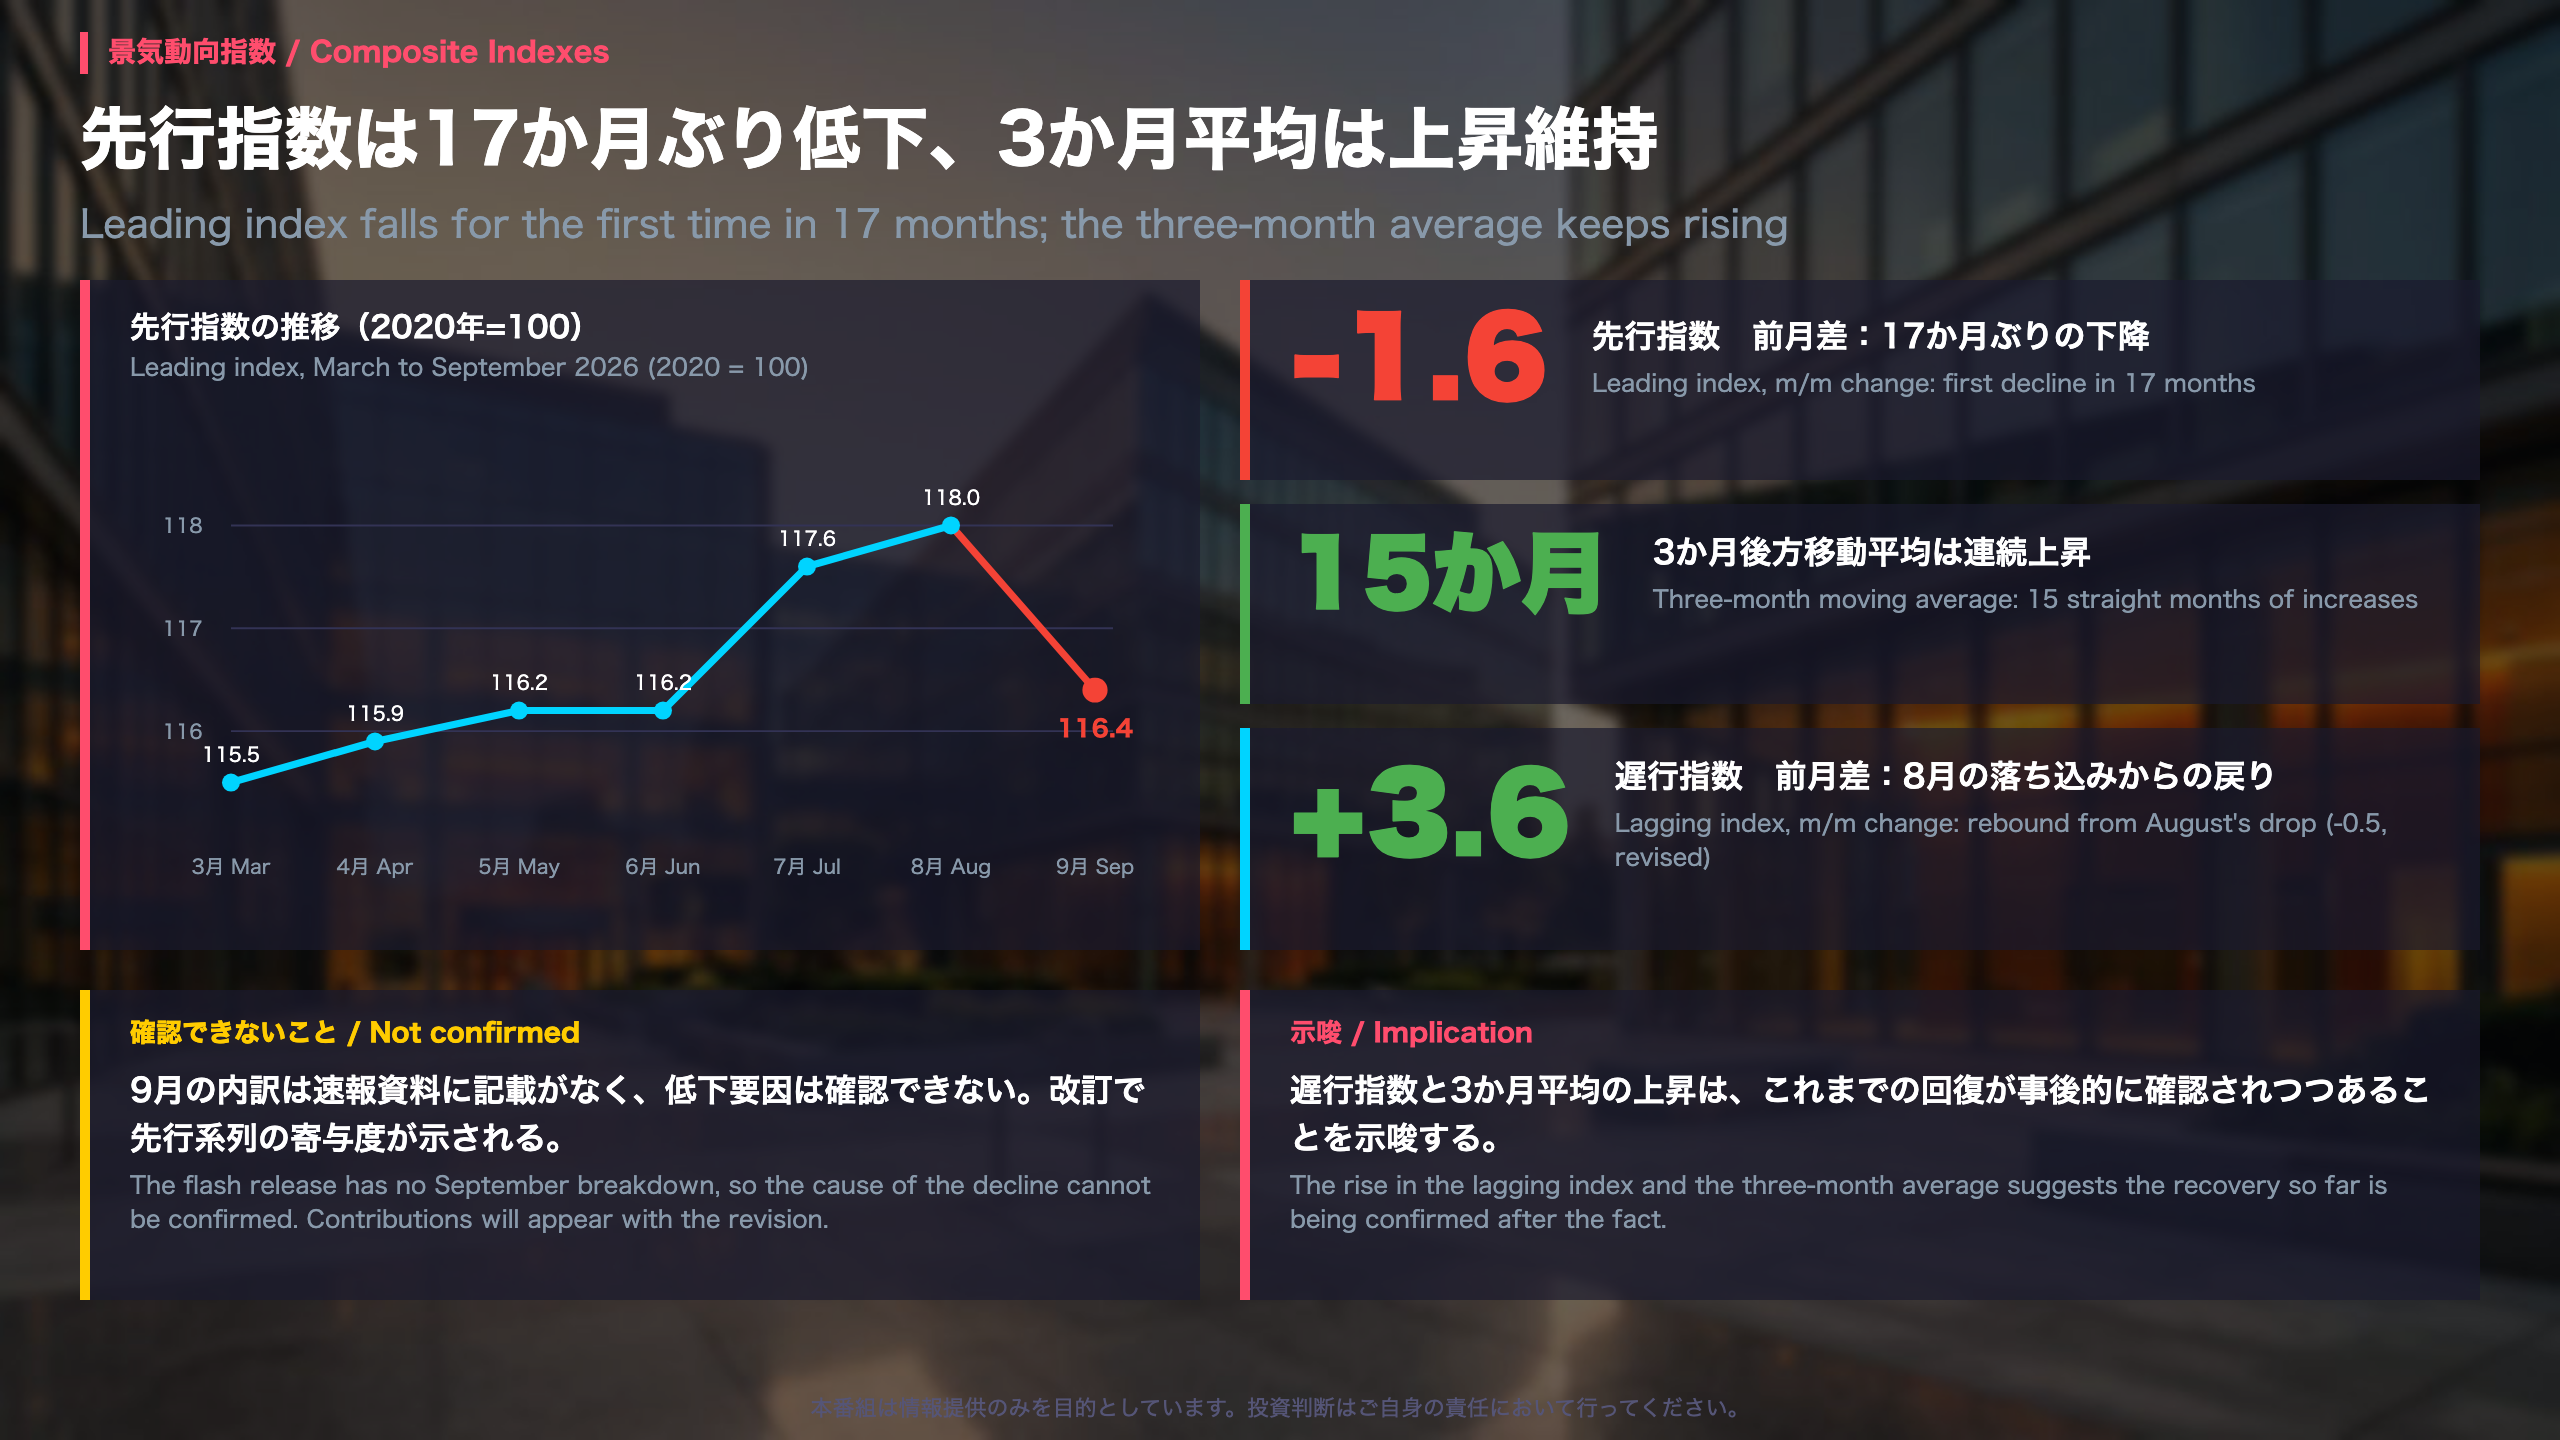
Leading vs. lagging: a single-month dip against a rising average
Context. Japan’s Cabinet Office builds the leading index from forward-looking series such as business sentiment and orders, while the lagging index uses series that follow the cycle, so it tends to confirm a recovery rather than predict one. The Conference Board in the United States publishes a comparable trio of leading, coincident and lagging indexes.
Leading index path
From March to August 2026 the leading index rose steadily: 115.5, 115.9, 116.2, 116.2, 117.6 and 118.0. September fell to 116.4. The three-month moving average change slowed from +0.60 to +0.06, and the seven-month figure from +0.78 to +0.30. So the average is still rising, but its pace has clearly cooled.
What the flash release does not say
The September flash gives no component breakdown for the leading index, so the cause of the drop cannot be identified yet. For reference, in August the largest positive contributor was the small-business sales outlook DI (+0.54).
Lagging index
The lagging index rose 3.6 points, partly a rebound from August’s revised 112.4 (-0.5 m/m). Its three-month average is up for a fourth straight month (+1.40) and its seven-month average for a third (+0.59). This is consistent with the earlier recovery being confirmed after the fact.
Two readings
- Cautious: the first single-month decline in 17 months signals that momentum has cooled.
- Constructive: averages keep rising and the lagging index is trending up.
The September revision, which should show the leading series contributions, is the next checkpoint.
基調判断は「改善」のまま、足踏みの基準とは距離
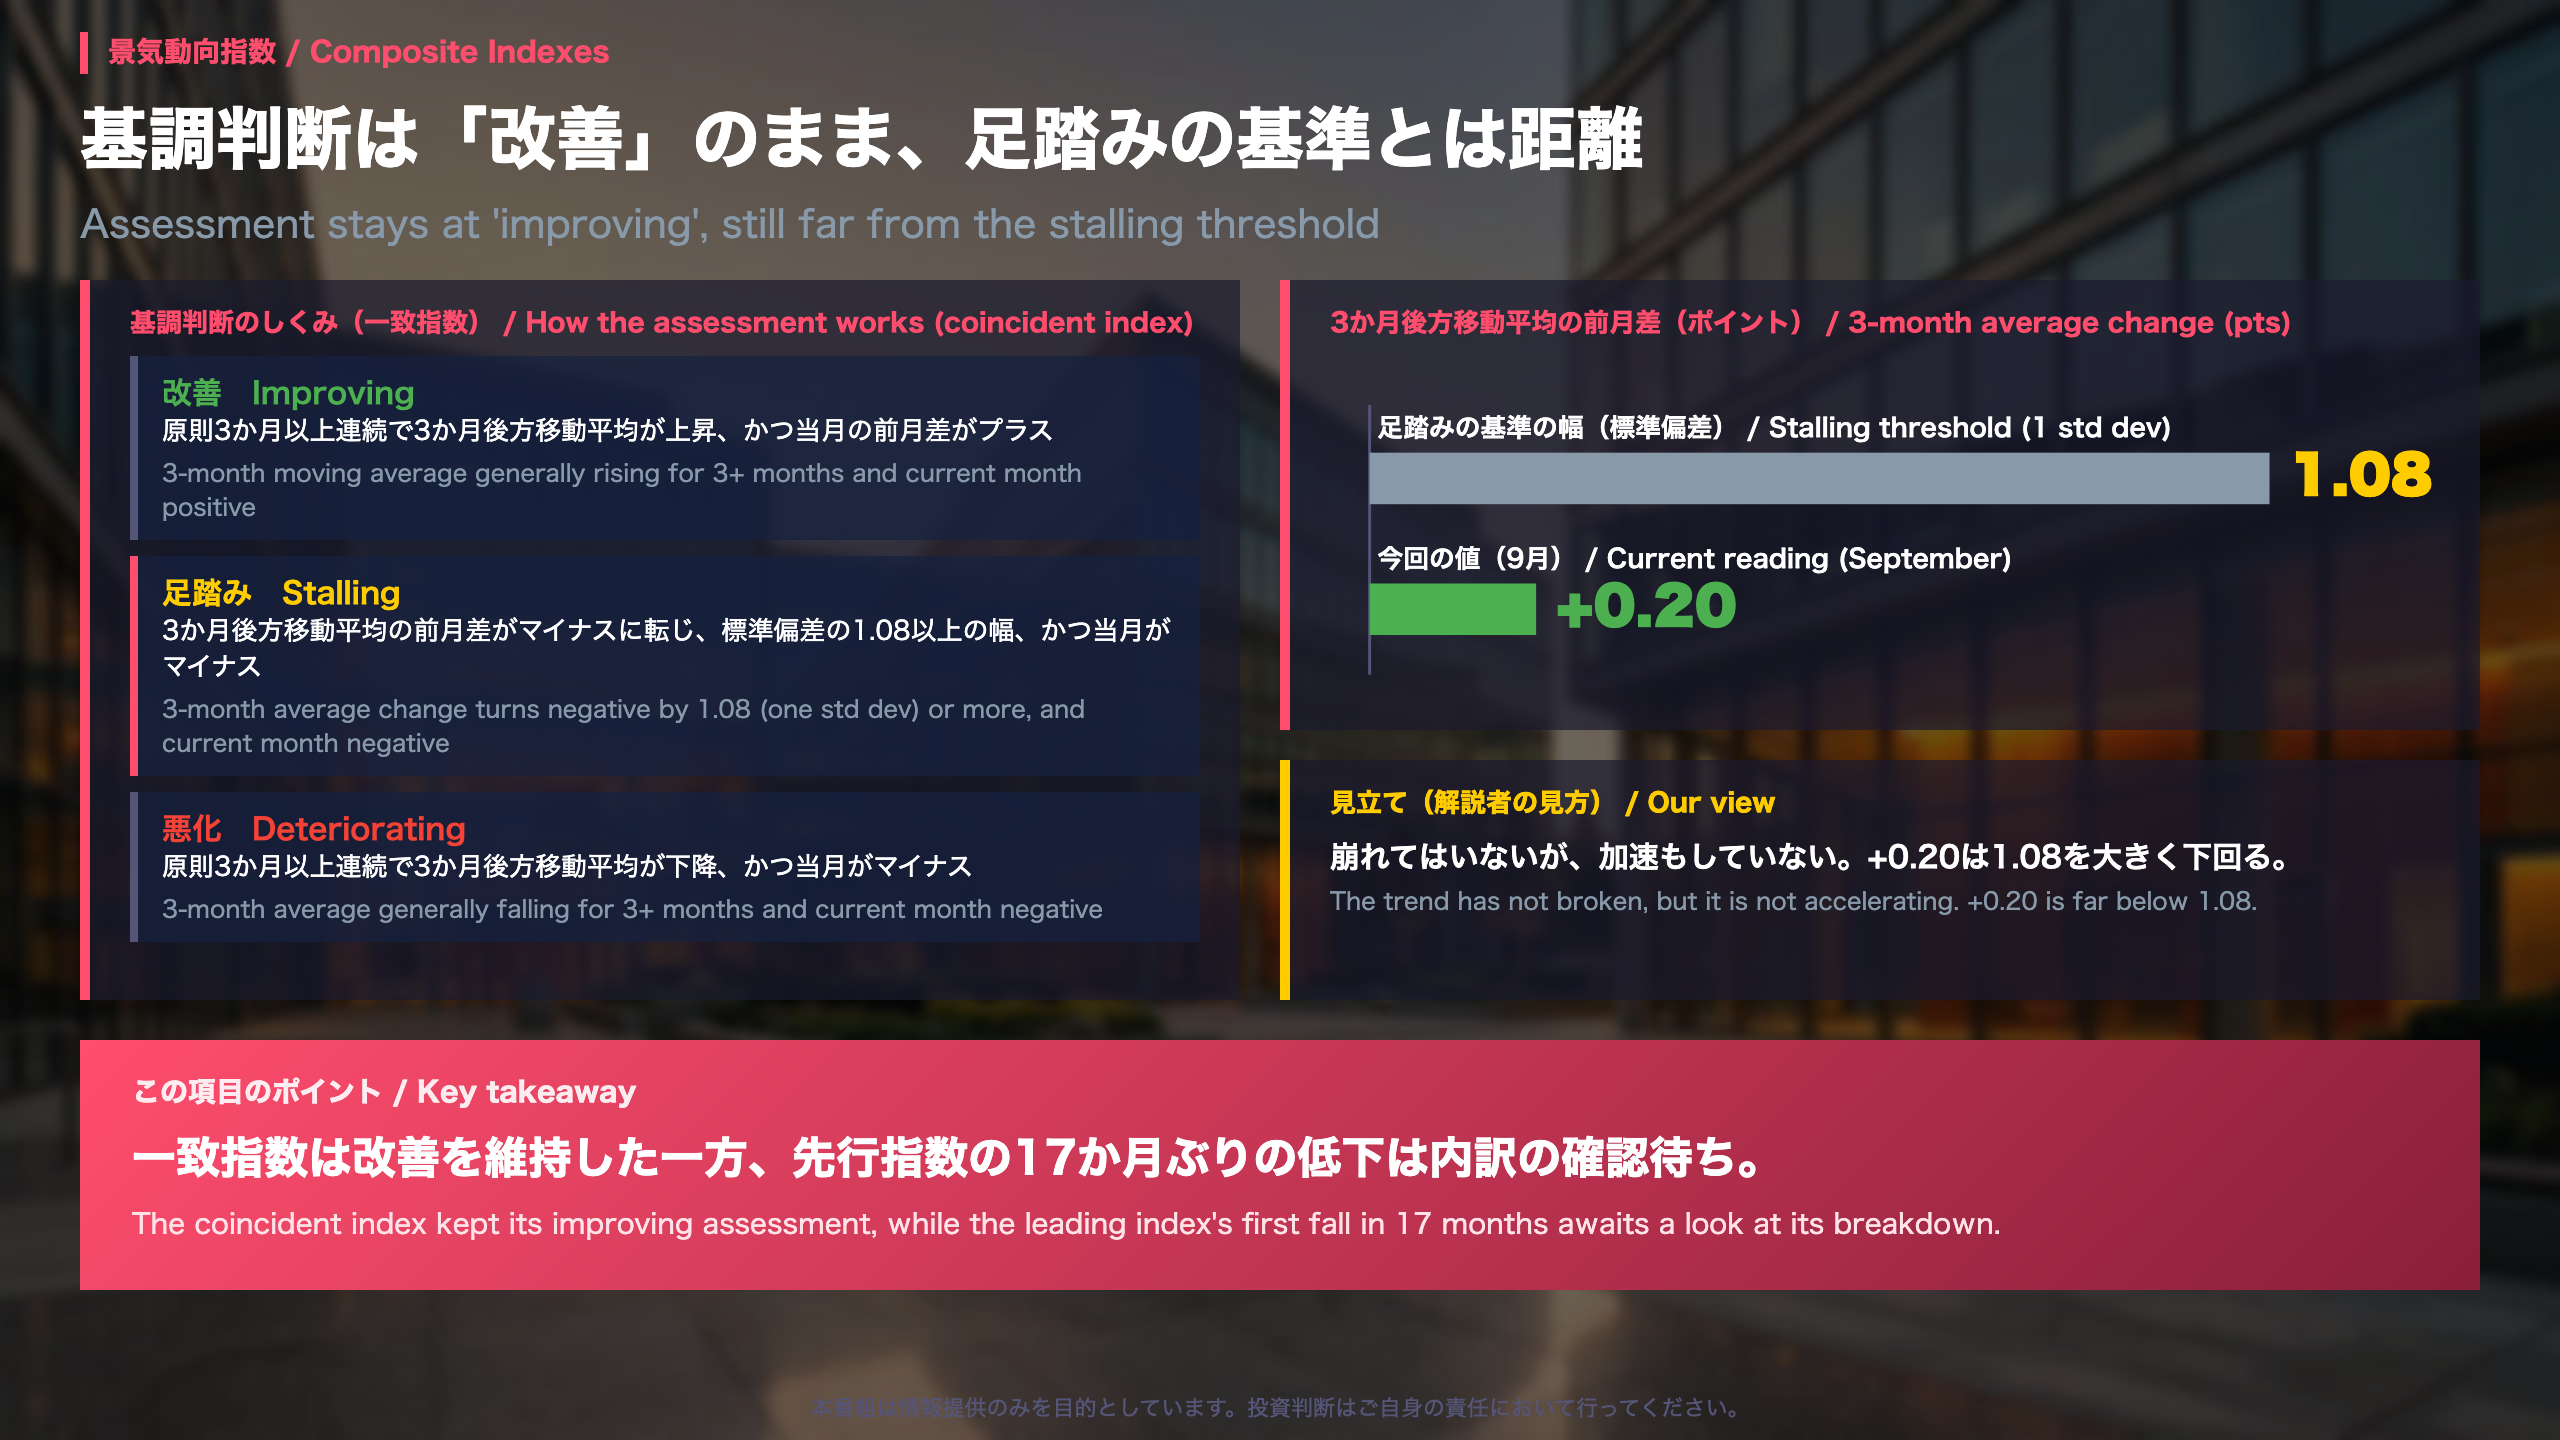
How Japan’s ‘basic assessment’ works and what to watch next
Background. The Cabinet Office does not simply label the economy from one month’s reading. Its assessment of the coincident index follows rules based on the three-month and seven-month backward moving averages, which smooths out noisy single months. This is different from a U.S.-style headline reading of a single monthly figure.
The rules in brief
- Improving: the three-month moving average has generally risen for three or more months in a row, and the current month’s change is positive.
- Stalling: the three-month moving average change turns negative by at least one standard deviation, and the current month is negative.
- Deteriorating: the three-month average has generally fallen for three or more months, and the current month is negative.
The reference standard deviations (January 1985 to December 2025) are 1.08 for the three-month average and 0.83 for the seven-month average.
Where September stands
The three-month average change is +0.20 and the seven-month is +0.41, both positive, so the ‘improving’ call is unchanged. The gap to the stalling threshold is wide, but +0.20 is also far below the 1.08 historical swing, which indicates modest momentum rather than a strong upswing.
Revisions matter
August’s flash was published October 7 and revised October 26, with the coincident index nudged from 118.7 to 118.8 and the lagging index from 112.1 to 112.4. The release does not state the date of the September revision.
What to watch
The component breakdown of the leading index and October’s production and shipments will show whether this month’s rebound holds.
海外勢の日本債:中長期債は6週連続の買い越し
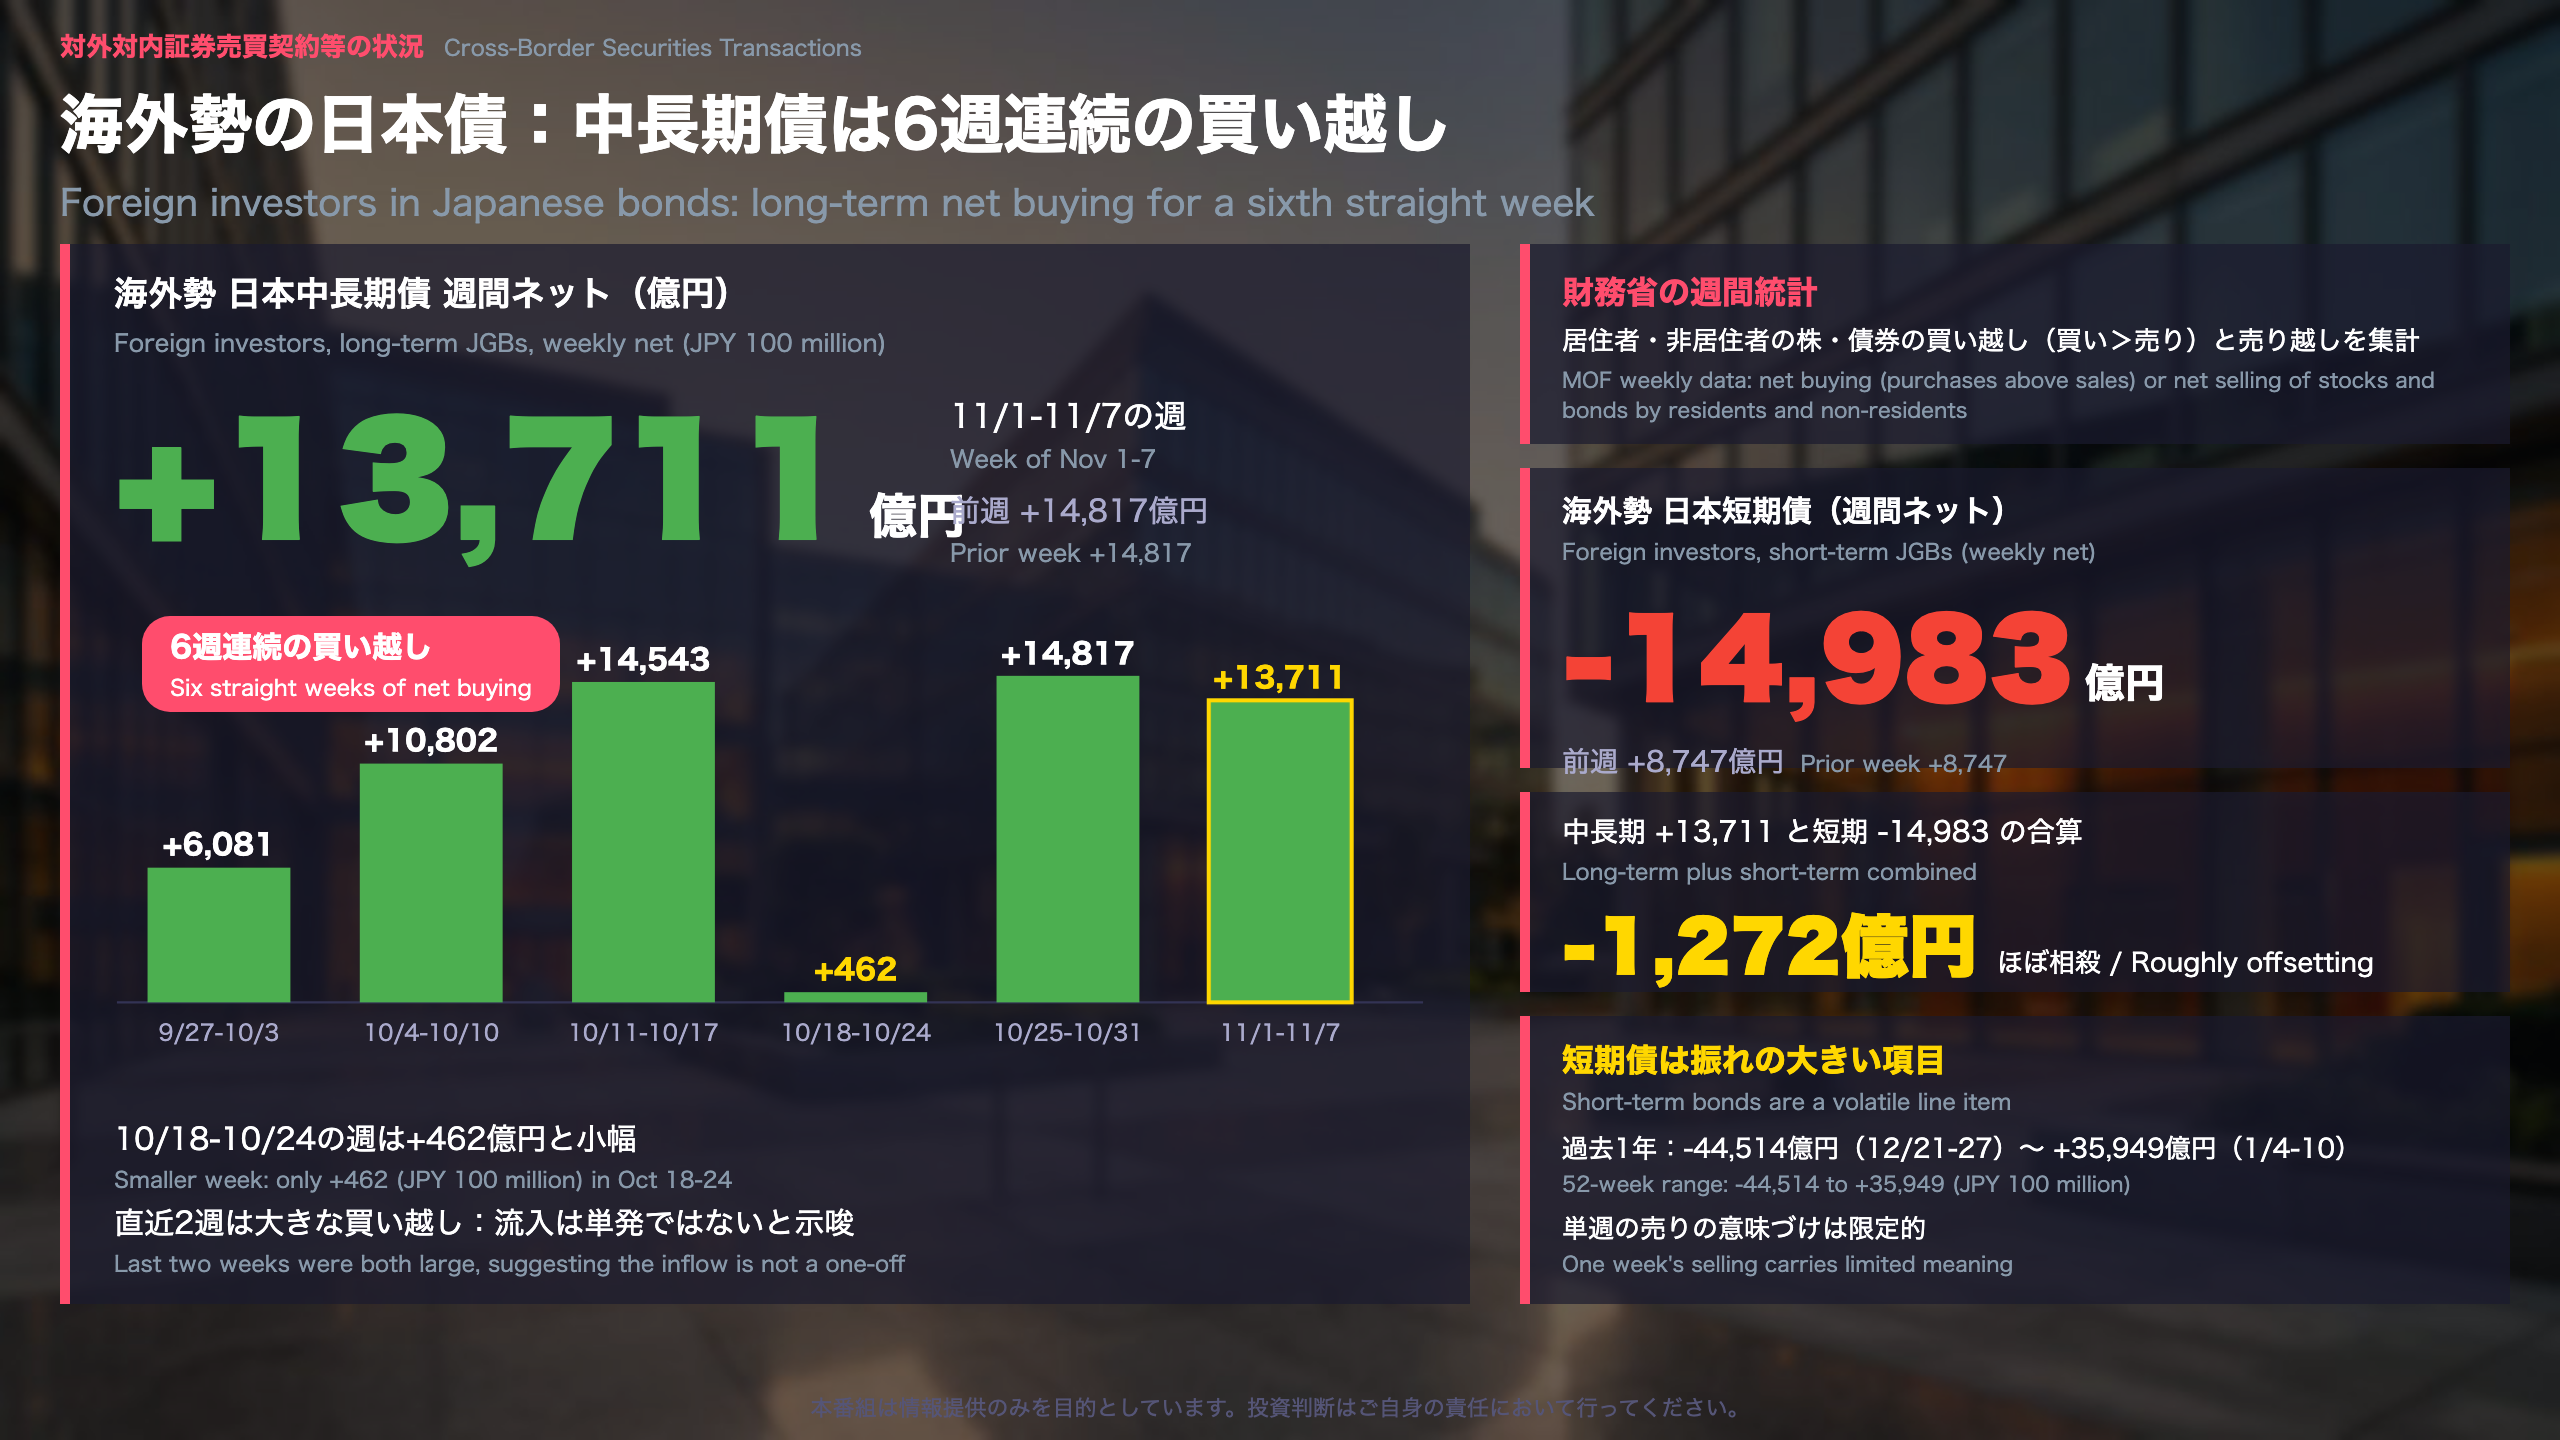
Context: What This Weekly Report Measures
Japan’s Ministry of Finance (MOF) publishes weekly figures on cross-border securities transactions: net buying or selling of Japanese and foreign stocks and bonds by non-residents (overseas investors) and residents (Japanese investors). Unlike the monthly US Treasury TIC data, the Japanese series arrives every week, so it is noisier and is best read as a multi-week trend.
The Numbers
- Foreign investors bought a net JPY 1.37 trillion of long-term Japanese bonds in the week of Nov 1-7 (prior week: JPY 1.48 trillion), the sixth consecutive week of net buying.
- The smallest week in the streak was Oct 18-24, at only JPY 46.2 billion.
- Among the 52 weeks in the source table, eight weeks were larger. The biggest was JPY 2.38 trillion (Mar 29-Apr 4); the largest net sale was JPY 2.65 trillion (Mar 22-28).
Short-Term Bonds
Short-term bonds swung to a net sale of JPY 1.50 trillion from a JPY 875 billion purchase the week before. Weekly swings of several trillion yen in both directions are common over the past year (for example, -JPY 4.45 trillion in Dec 21-27 and +JPY 3.59 trillion in Jan 4-10). Adding long and short gives roughly -JPY 127 billion, essentially a wash.
Two Readings
- Constructive: Six straight weeks of long-term buying, with a large prior week, suggests the inflow is not a one-off.
- Cautious: Netting the two maturities leaves bonds close to flat, though one week of short-term selling carries limited meaning given how volatile that line is.
What to Watch
The next report covers Nov 8-14. The checkpoints are whether long-term buying reaches a seventh week and whether short-term bonds return to net buying. The data describe the composition of flows, not price direction.
日本勢の対外投資:前週の買い越しから反転
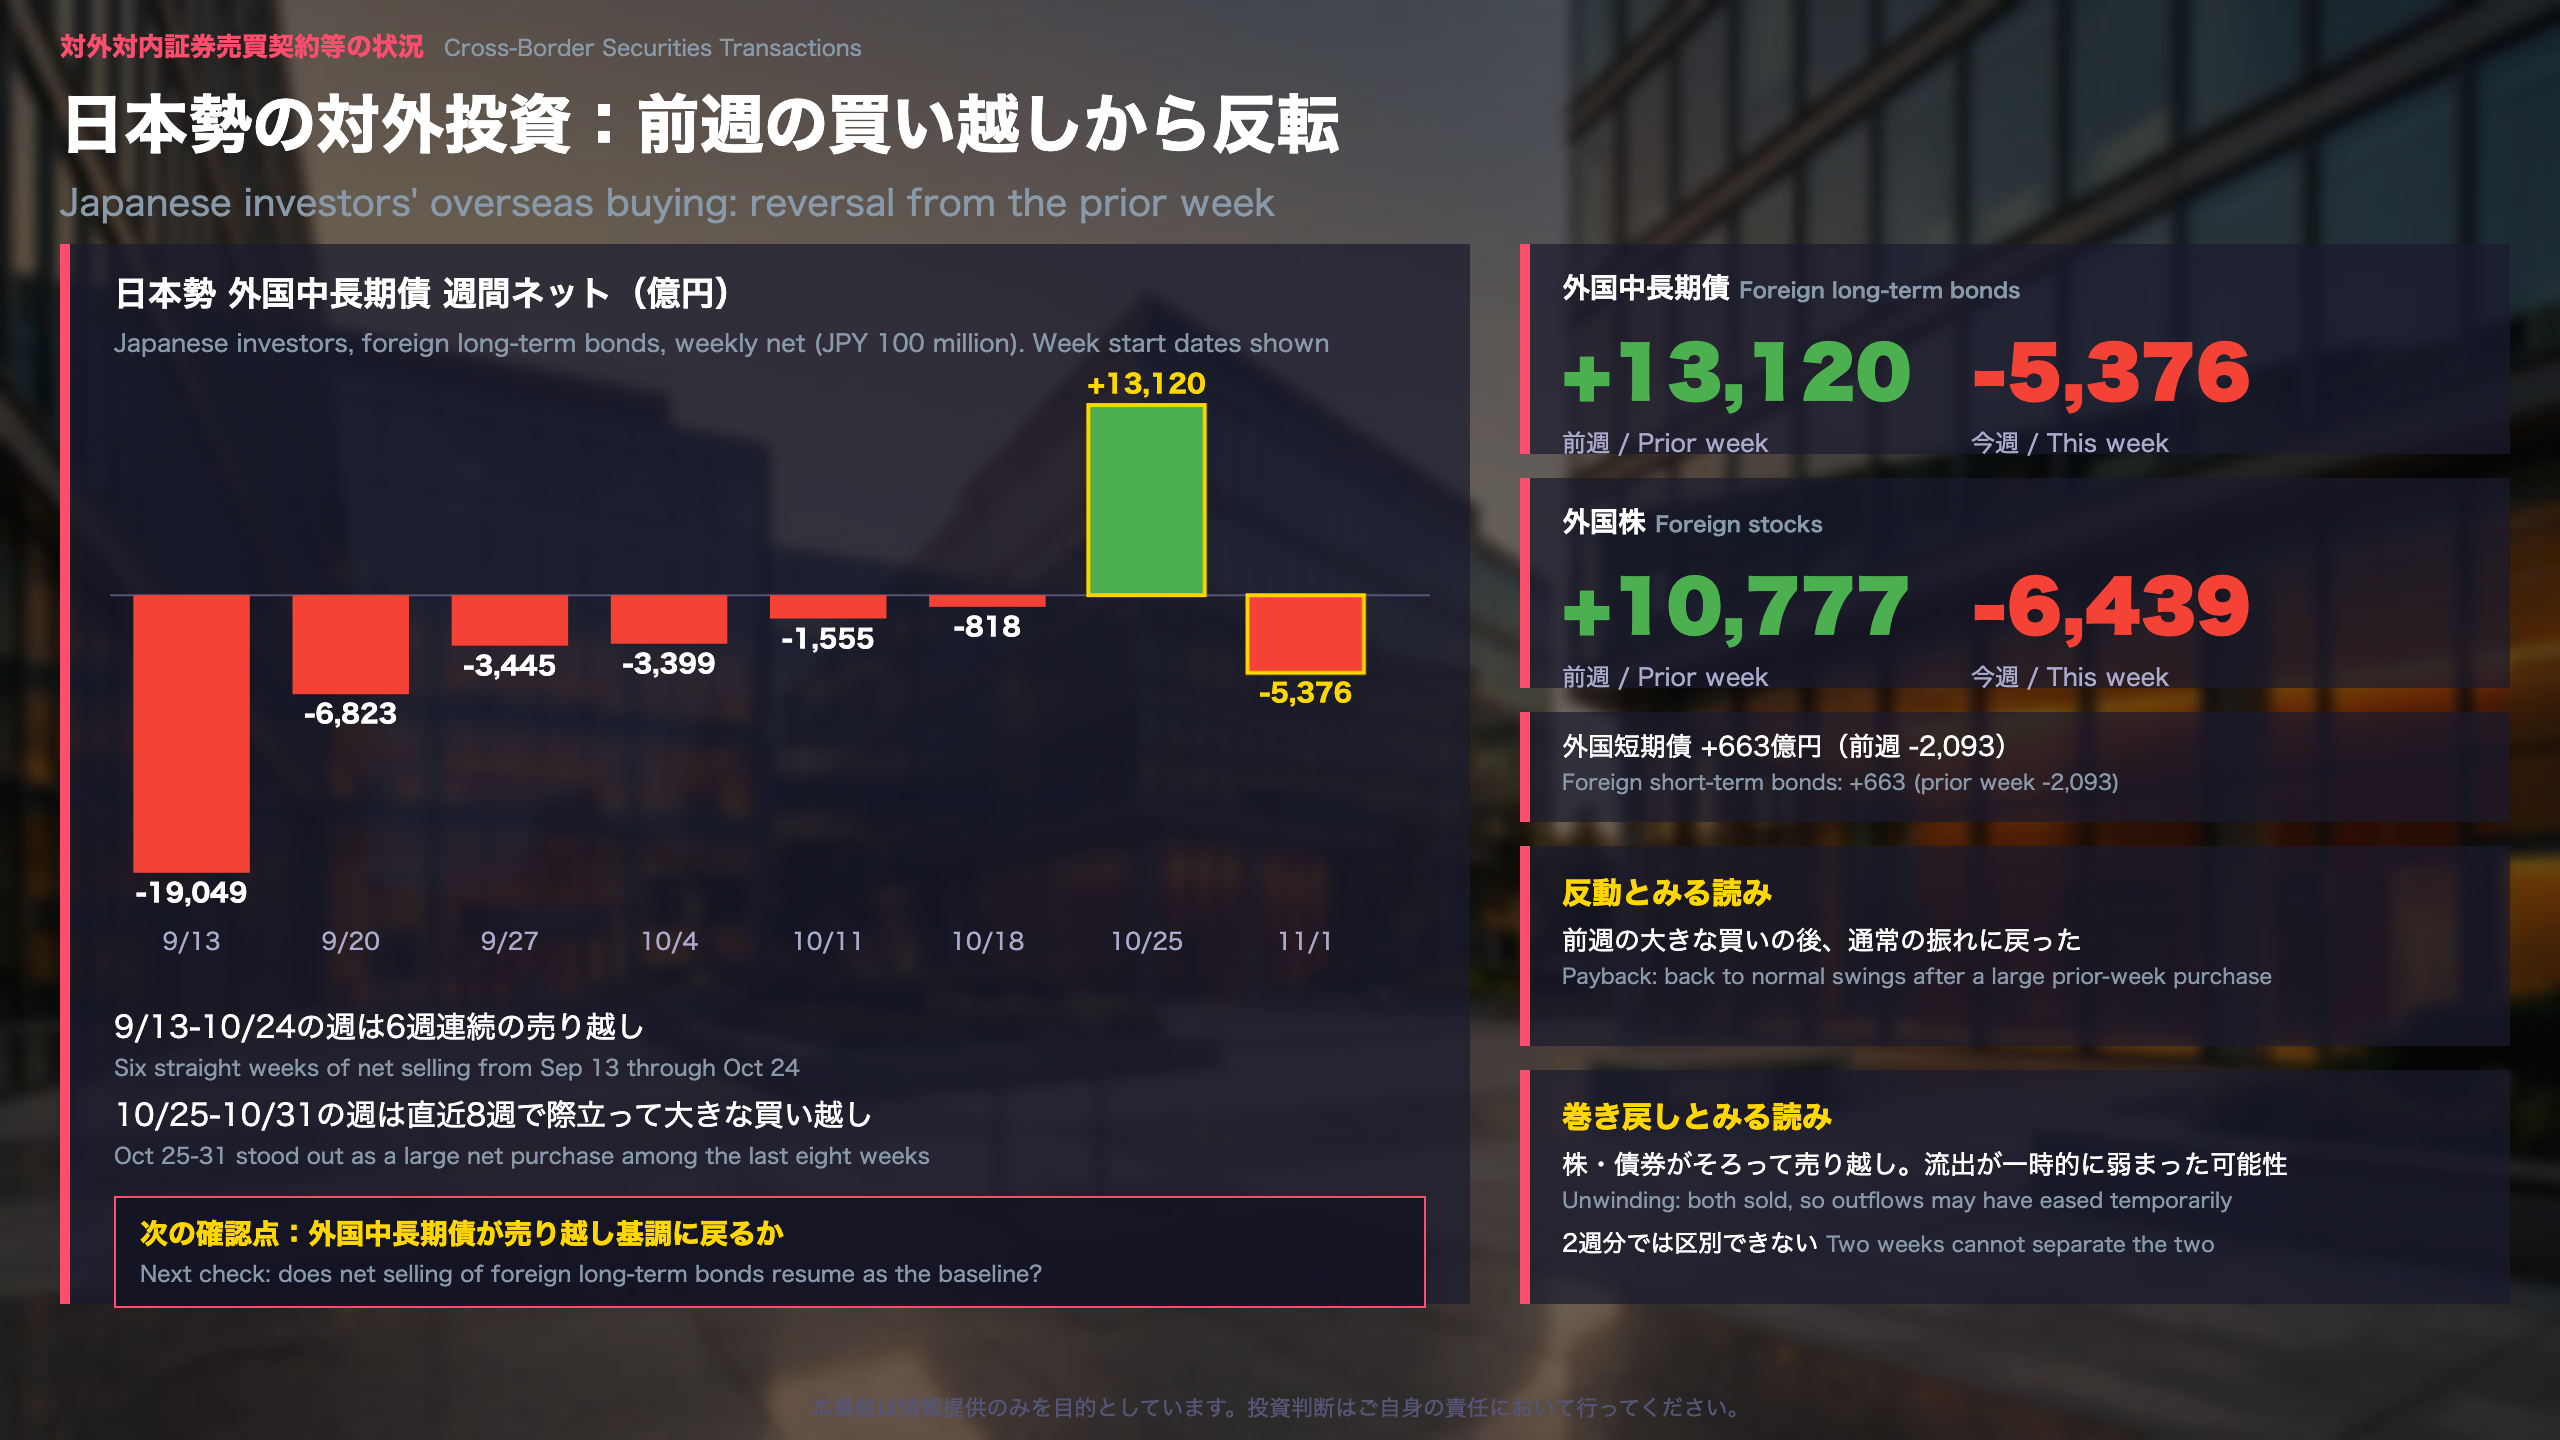
Why This Series Matters
The MOF weekly report has two sides. The earlier slide covered foreign investors buying Japanese assets; this one covers the outward side, meaning how much Japanese residents (institutions and households) buy foreign stocks and bonds. Taken together they show gross direction of capital flows each week, something monthly data such as the US TIC report can only show with a lag.
The Reversal
| Week | Foreign stocks (JPY 100M) | Foreign long-term bonds |
|---|---|---|
| Oct 25-31 | +10,777 | +13,120 |
| Nov 1-7 | -6,439 | -5,376 |
- Foreign long-term bonds had been net sold for six straight weeks (Sep 13-Oct 24) before the large Oct 25-31 purchase of JPY 1.31 trillion.
- This week they returned to net selling of JPY 538 billion; foreign stocks were net sold by JPY 644 billion.
- Foreign short-term bonds were small: +JPY 66 billion (prior week: -JPY 209 billion).
Not the Usual Stock-Bond Seesaw
Over the past year there were weeks when Japanese investors moved stocks and bonds in opposite directions: Mar 29-Apr 4 (stocks +JPY 1.43 trillion, bonds -JPY 2.48 trillion) and Apr 26-May 2 (stocks -JPY 2.43 trillion, bonds +JPY 2.41 trillion). This week both were sold, so it does not fit that pattern.
Two Interpretations
- Payback: After an unusually large prior week, selling looks like a return to normal volatility.
- Unwinding: Selling in both asset classes could mean outflows from Japan weakened temporarily. Two data points cannot separate the two.
What to Watch
The Nov 8-14 report will show whether foreign long-term bonds revert to the net-selling pattern seen before Oct 25, and whether foreign stocks return to net buying. No claim is made here about currency or price direction.
海外勢の日本株と為替の関係
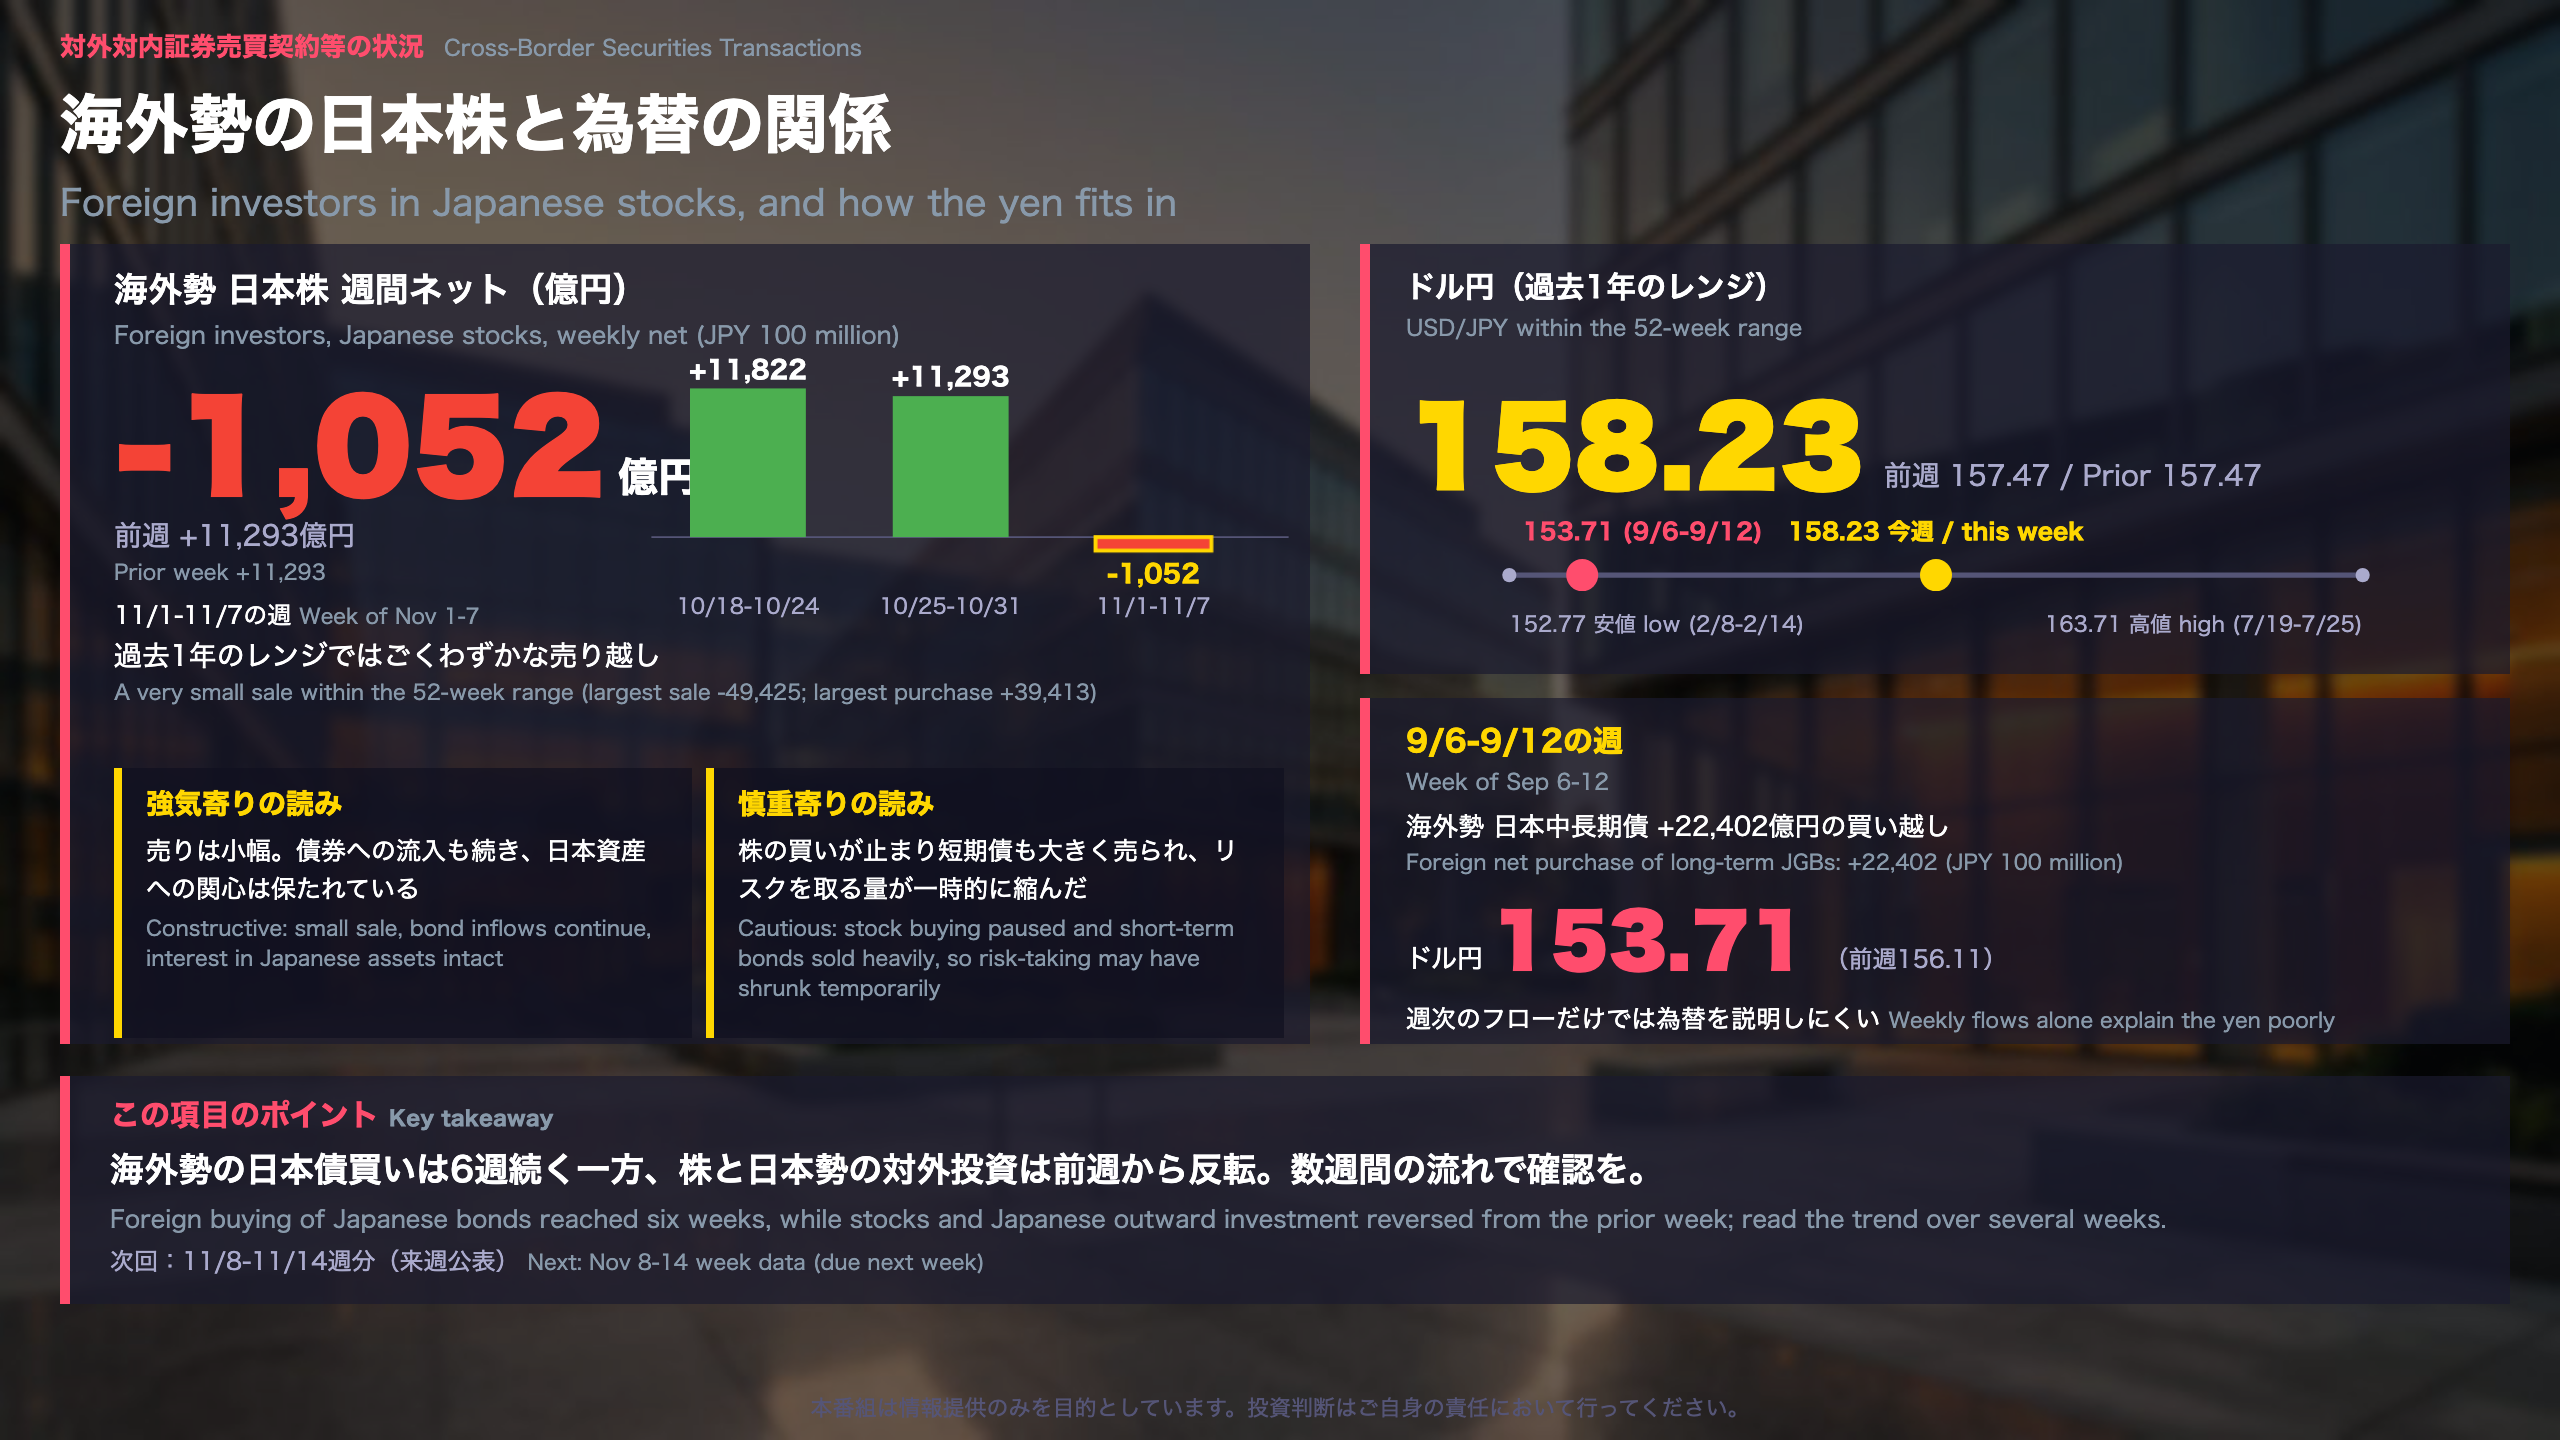
Reading Foreign Flows Into Japanese Equities
Foreign investors are the single most closely watched group in Japan’s stock market, and the MOF’s weekly report is the quickest official read on their net buying or selling. For readers used to US data: it is a weekly, net-flow counterpart to the monthly TIC report, and it is more volatile because a single large order can dominate a week.
The Equity Numbers
- This week: net sale of JPY 105.2 billion (prior week: net purchase of JPY 1.13 trillion).
- The two weeks before that were net purchases above JPY 1 trillion each (Oct 18-24: JPY 1.18 trillion; Oct 25-31: JPY 1.13 trillion).
- Four of the last six weeks were net purchases.
- The 52-week table shows a largest net sale of JPY 4.94 trillion (Sep 13-19) and a largest net purchase of JPY 3.94 trillion (Apr 5-11), so this week’s sale is tiny by comparison.
Dollar-Yen: A Loose Relationship
USD/JPY ended this week at 158.23 (prior week: 157.47), almost midway between the 52-week high of 163.71 (Jul 19-25) and low of 152.77 (Feb 8-14). The weekly table does not show a stable link between bond inflows and the yen: in Sep 6-12, a JPY 2.24 trillion foreign purchase of long-term bonds came with USD/JPY falling to 153.71 from 156.11, while this week a JPY 1.37 trillion purchase coincided with a slight rise. The source gives no explanation for either move.
Two Interpretations
- Constructive: A small equity sale alongside continued bond inflows is consistent with intact interest in Japanese assets.
- Cautious: Paused equity buying and heavy short-term bond selling could mean foreign investors temporarily trimmed risk. One week of data cannot decide between them.
What to Watch
Nov 8-14 data (due next week): (1) a seventh week of long-term bond buying? (2) equities back to net buying? (3) Japanese net selling of foreign long-term bonds continuing?
M2は5か月連続で低下、預金サイドが鈍化
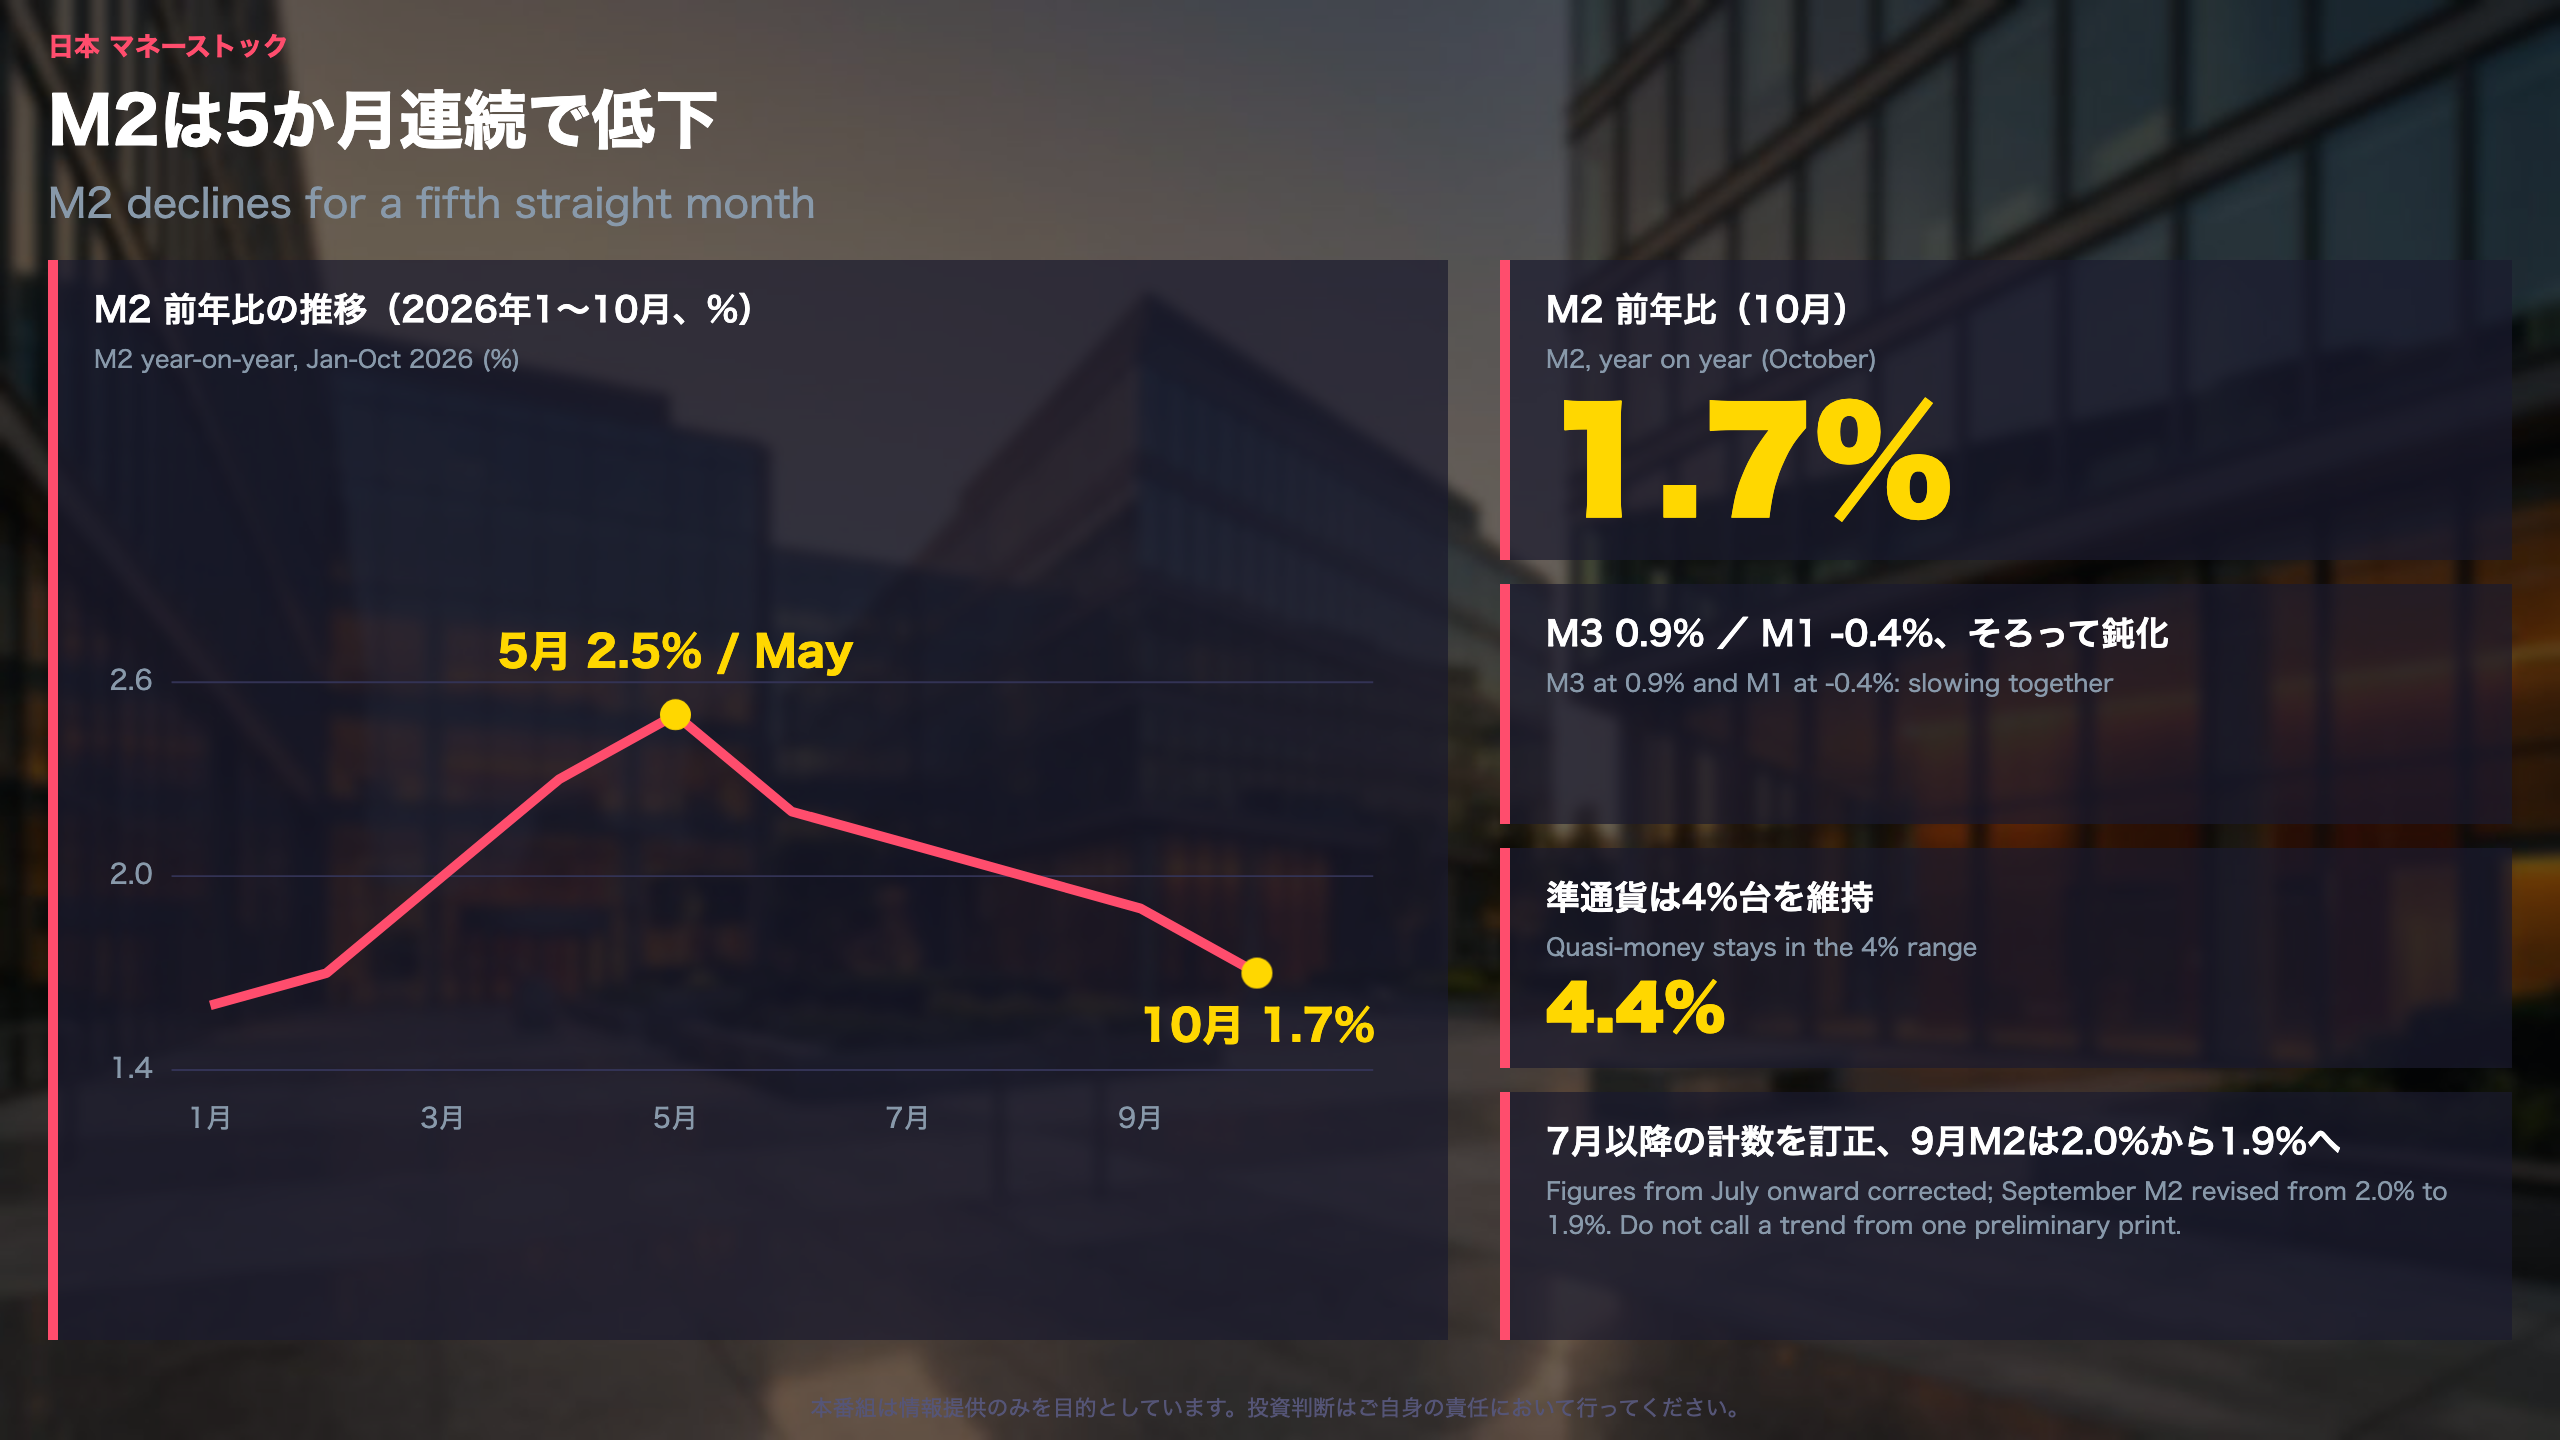
Japan’s Money Stock, October 2026: The Deposit Side Cools
What the data is
The money stock is the Bank of Japan’s gauge of how much money is circulating in the economy. M1 covers cash and demand deposits. M2 is the headline measure, centered on cash and deposits at domestic banks. M3 is a wider measure that also covers deposits at institutions such as post offices. The BOJ’s Research and Statistics Department published the preliminary October figures on November 11, 2026.
Key readings (average outstanding, year on year)
- M2: 1.7%, the same as in February and the fifth straight decline from 2.5% in May
- M3: 0.9%
- M1: -0.4%, the weakest since March 2026. Currency in circulation fell 1.5%, and deposit money fell 0.2%
- Quasi-money: 4.4%, still in the 4% range (2025 full year: 3.2%)
Context
M2 growth is still above the 2025 full-year pace of 1.2%, so this is a cooling from a higher plateau rather than a collapse. The seasonally adjusted annualized M2 reading of -0.4% looks sharp, but it swung back to 1.6% the month after a -0.9% print in June, so monthly annualized figures are noisy.
Revisions
The release notes that figures from July 2026 onward were corrected. September’s M2 was revised from 2.0% to 1.9%, and M3 from 1.2% to 1.1%.
Two readings
- Constructive: quasi-money stays solid, and M1 was positive from April to July
- Cautious: M2, M3 and M1 are slowing together, which points in one direction
Scope
The release does not break deposits down by holder, and it does not discuss BOJ policy, the yen or equities. This chapter therefore describes the data only. Unlike US M2, which markets often watch alongside the Fed’s balance sheet, Japan’s money stock is best read as one input among several. The November print is the next check.
広義流動性Lは高め、投資信託が牽引
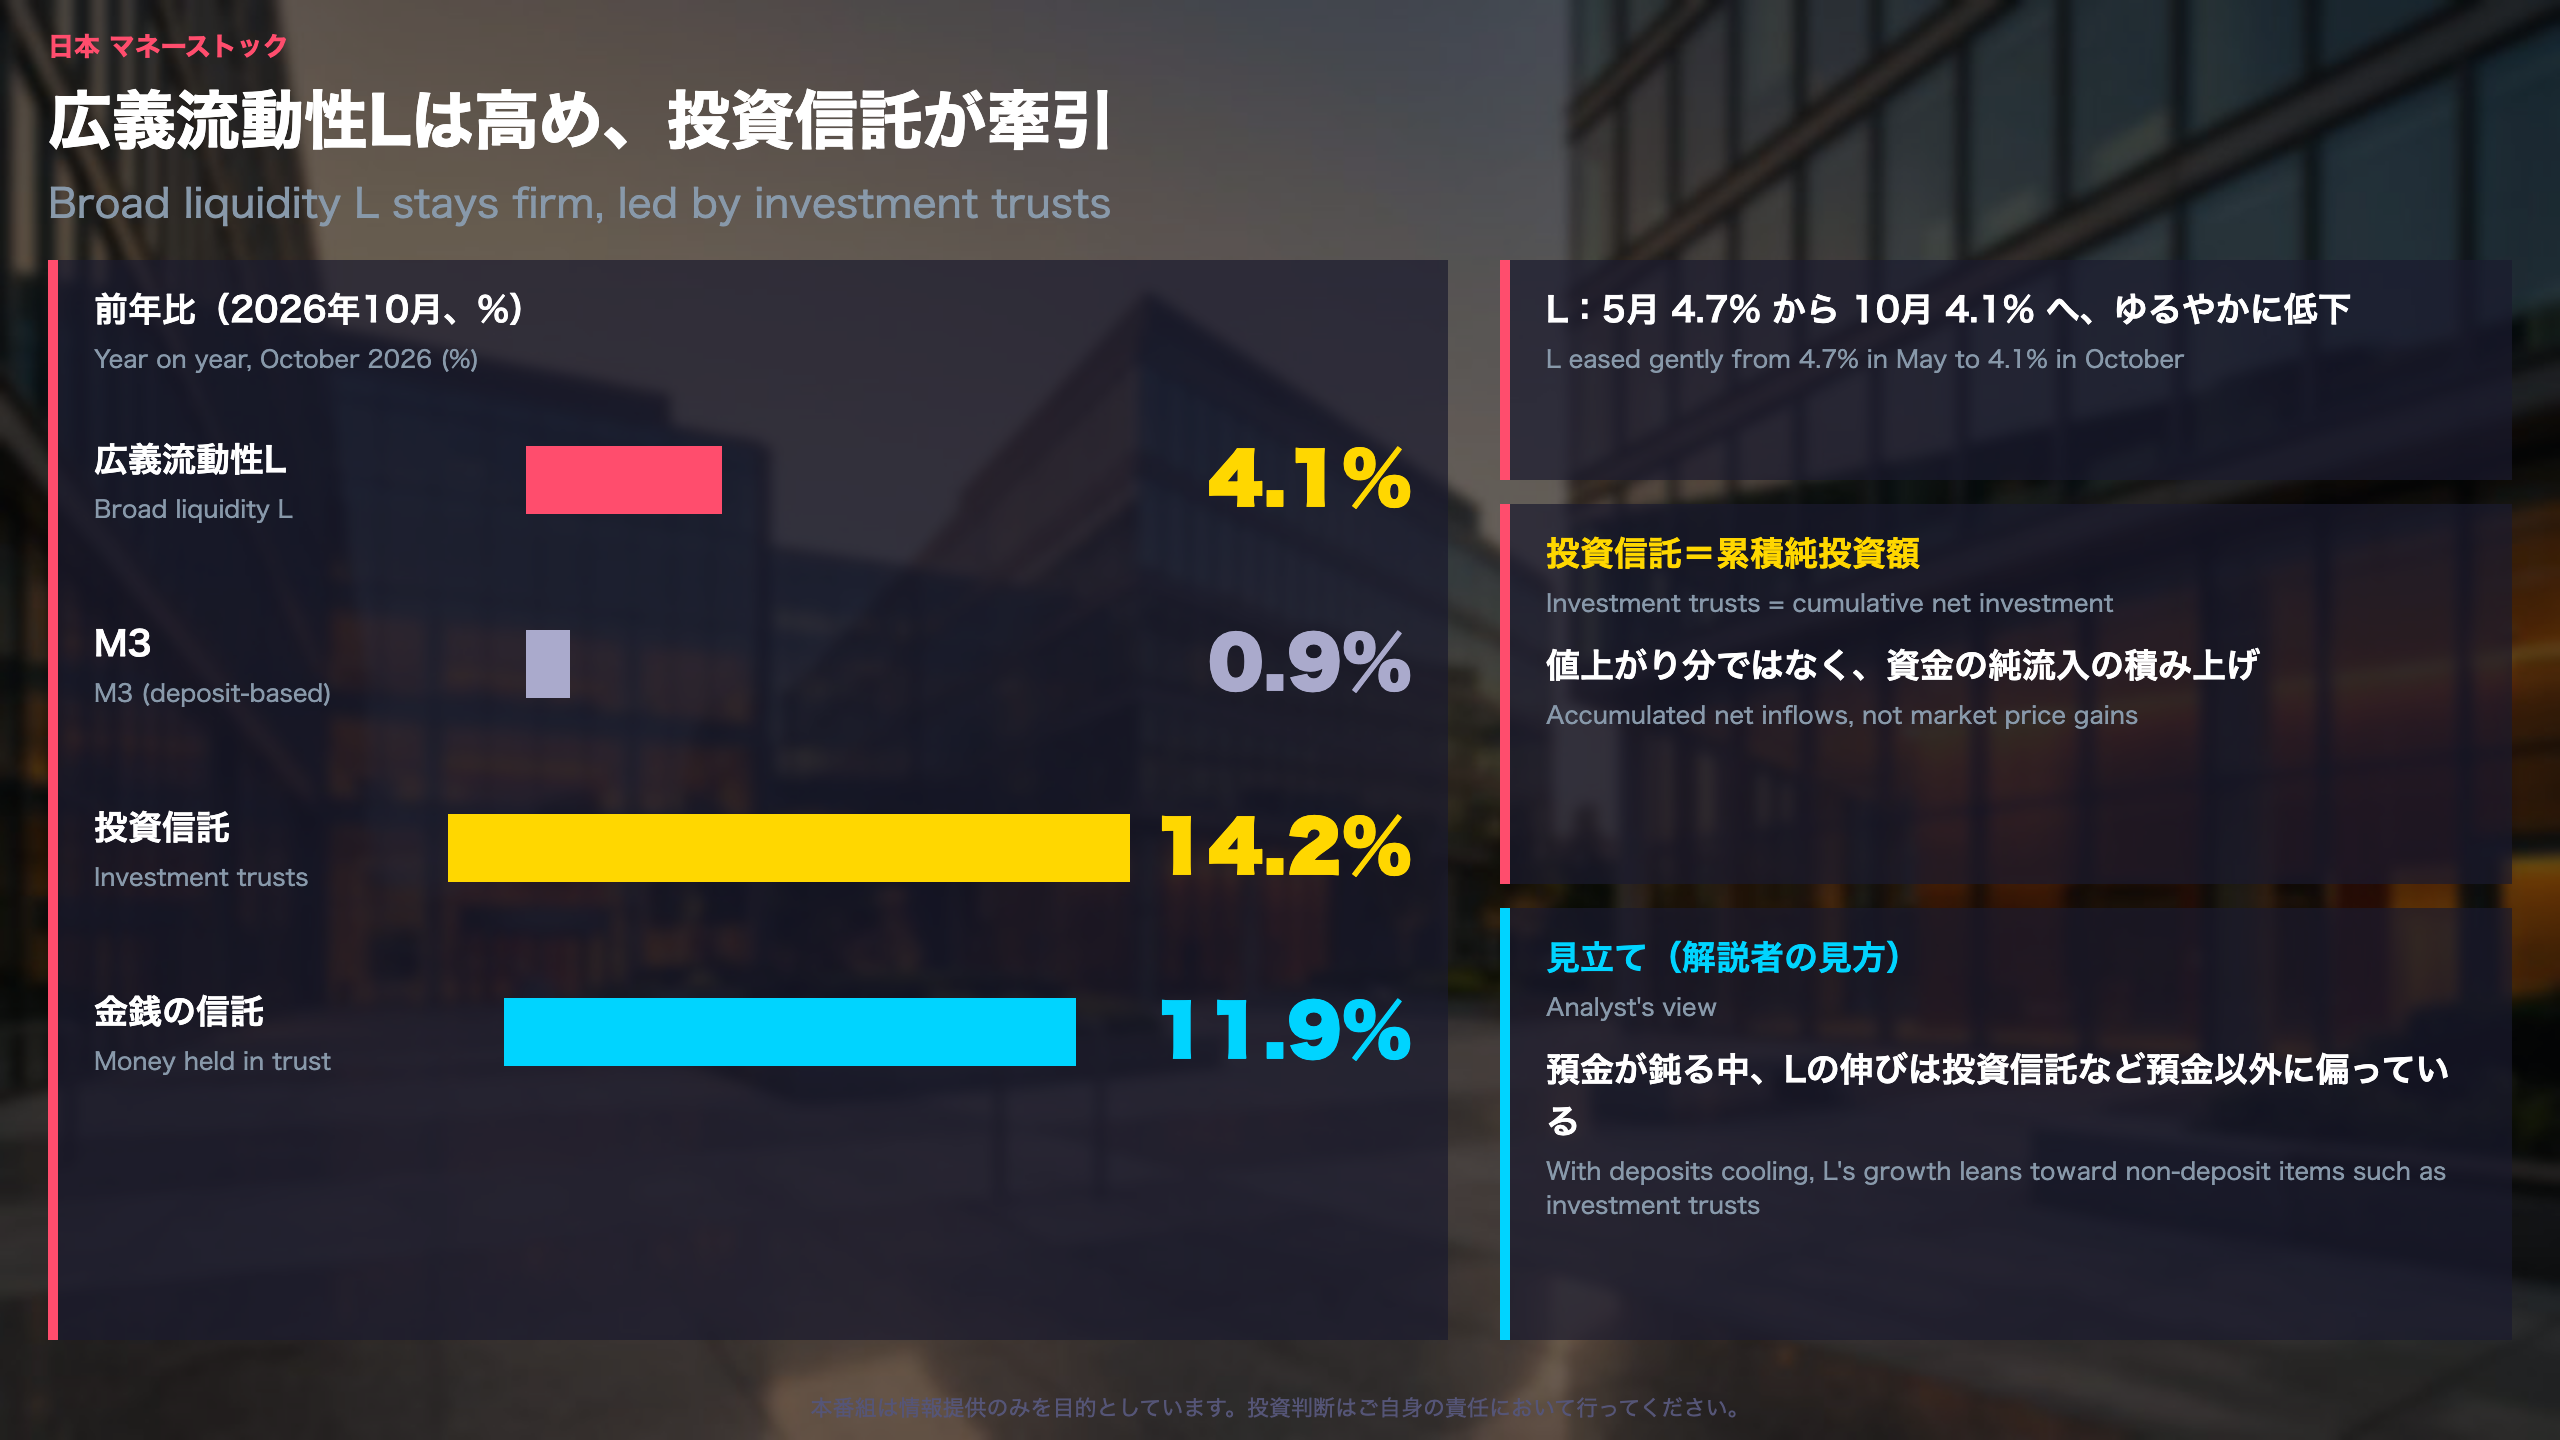
Broad Liquidity L: What Is Inside the Number
What L measures
The Bank of Japan publishes several tiers of money stock. M3 is the broad deposit-based measure, and L (broad liquidity) goes further by adding assets such as investment trusts, trust money, government bonds and foreign bonds held outside the banking system. It is the widest gauge of liquid funds in the economy, and it totaled 2,341.2 trillion yen in October 2026.
Key readings (year on year)
- L: 4.1%, easing gently from 4.7% in May
- Investment trusts: 14.2% (September: 14.0%), up every month since June from 11.3% in May
- Money held in trust: 11.9%, at a balance of 492.5 trillion yen. It jumped from 4.1% in March to 12.8% in May, and the release gives no reason
- Government bonds: 20.4%, foreign bonds: 3.1%
How to read the investment trust figure
The release’s footnote defines the investment trust line as the cumulative net investment in securities investment trusts and real estate investment trusts. It reflects net money flowing in, not market price gains. That matters for readers used to US data such as ICI fund flows or Fed balance sheet statistics: this is a flow-based series.
Small items look dramatic
Bank-issued ordinary bonds (+122.7%) and financial institution CP (+39,100.0%) have balances of only 0.3 and 0.1 trillion yen, so large percentages carry little weight against L.
Two readings
- Constructive: inflows into investment products continue and overall funds are expanding
- Cautious: M3 is slowing, so L’s growth leans toward non-deposit items, and L itself has eased from May
Scope
The release does not discuss BOJ policy, the yen or equities, so this chapter sticks to the data. The next release covers November; its date is not stated in the source.
今週の振り返り:強弱が混ざった一週間
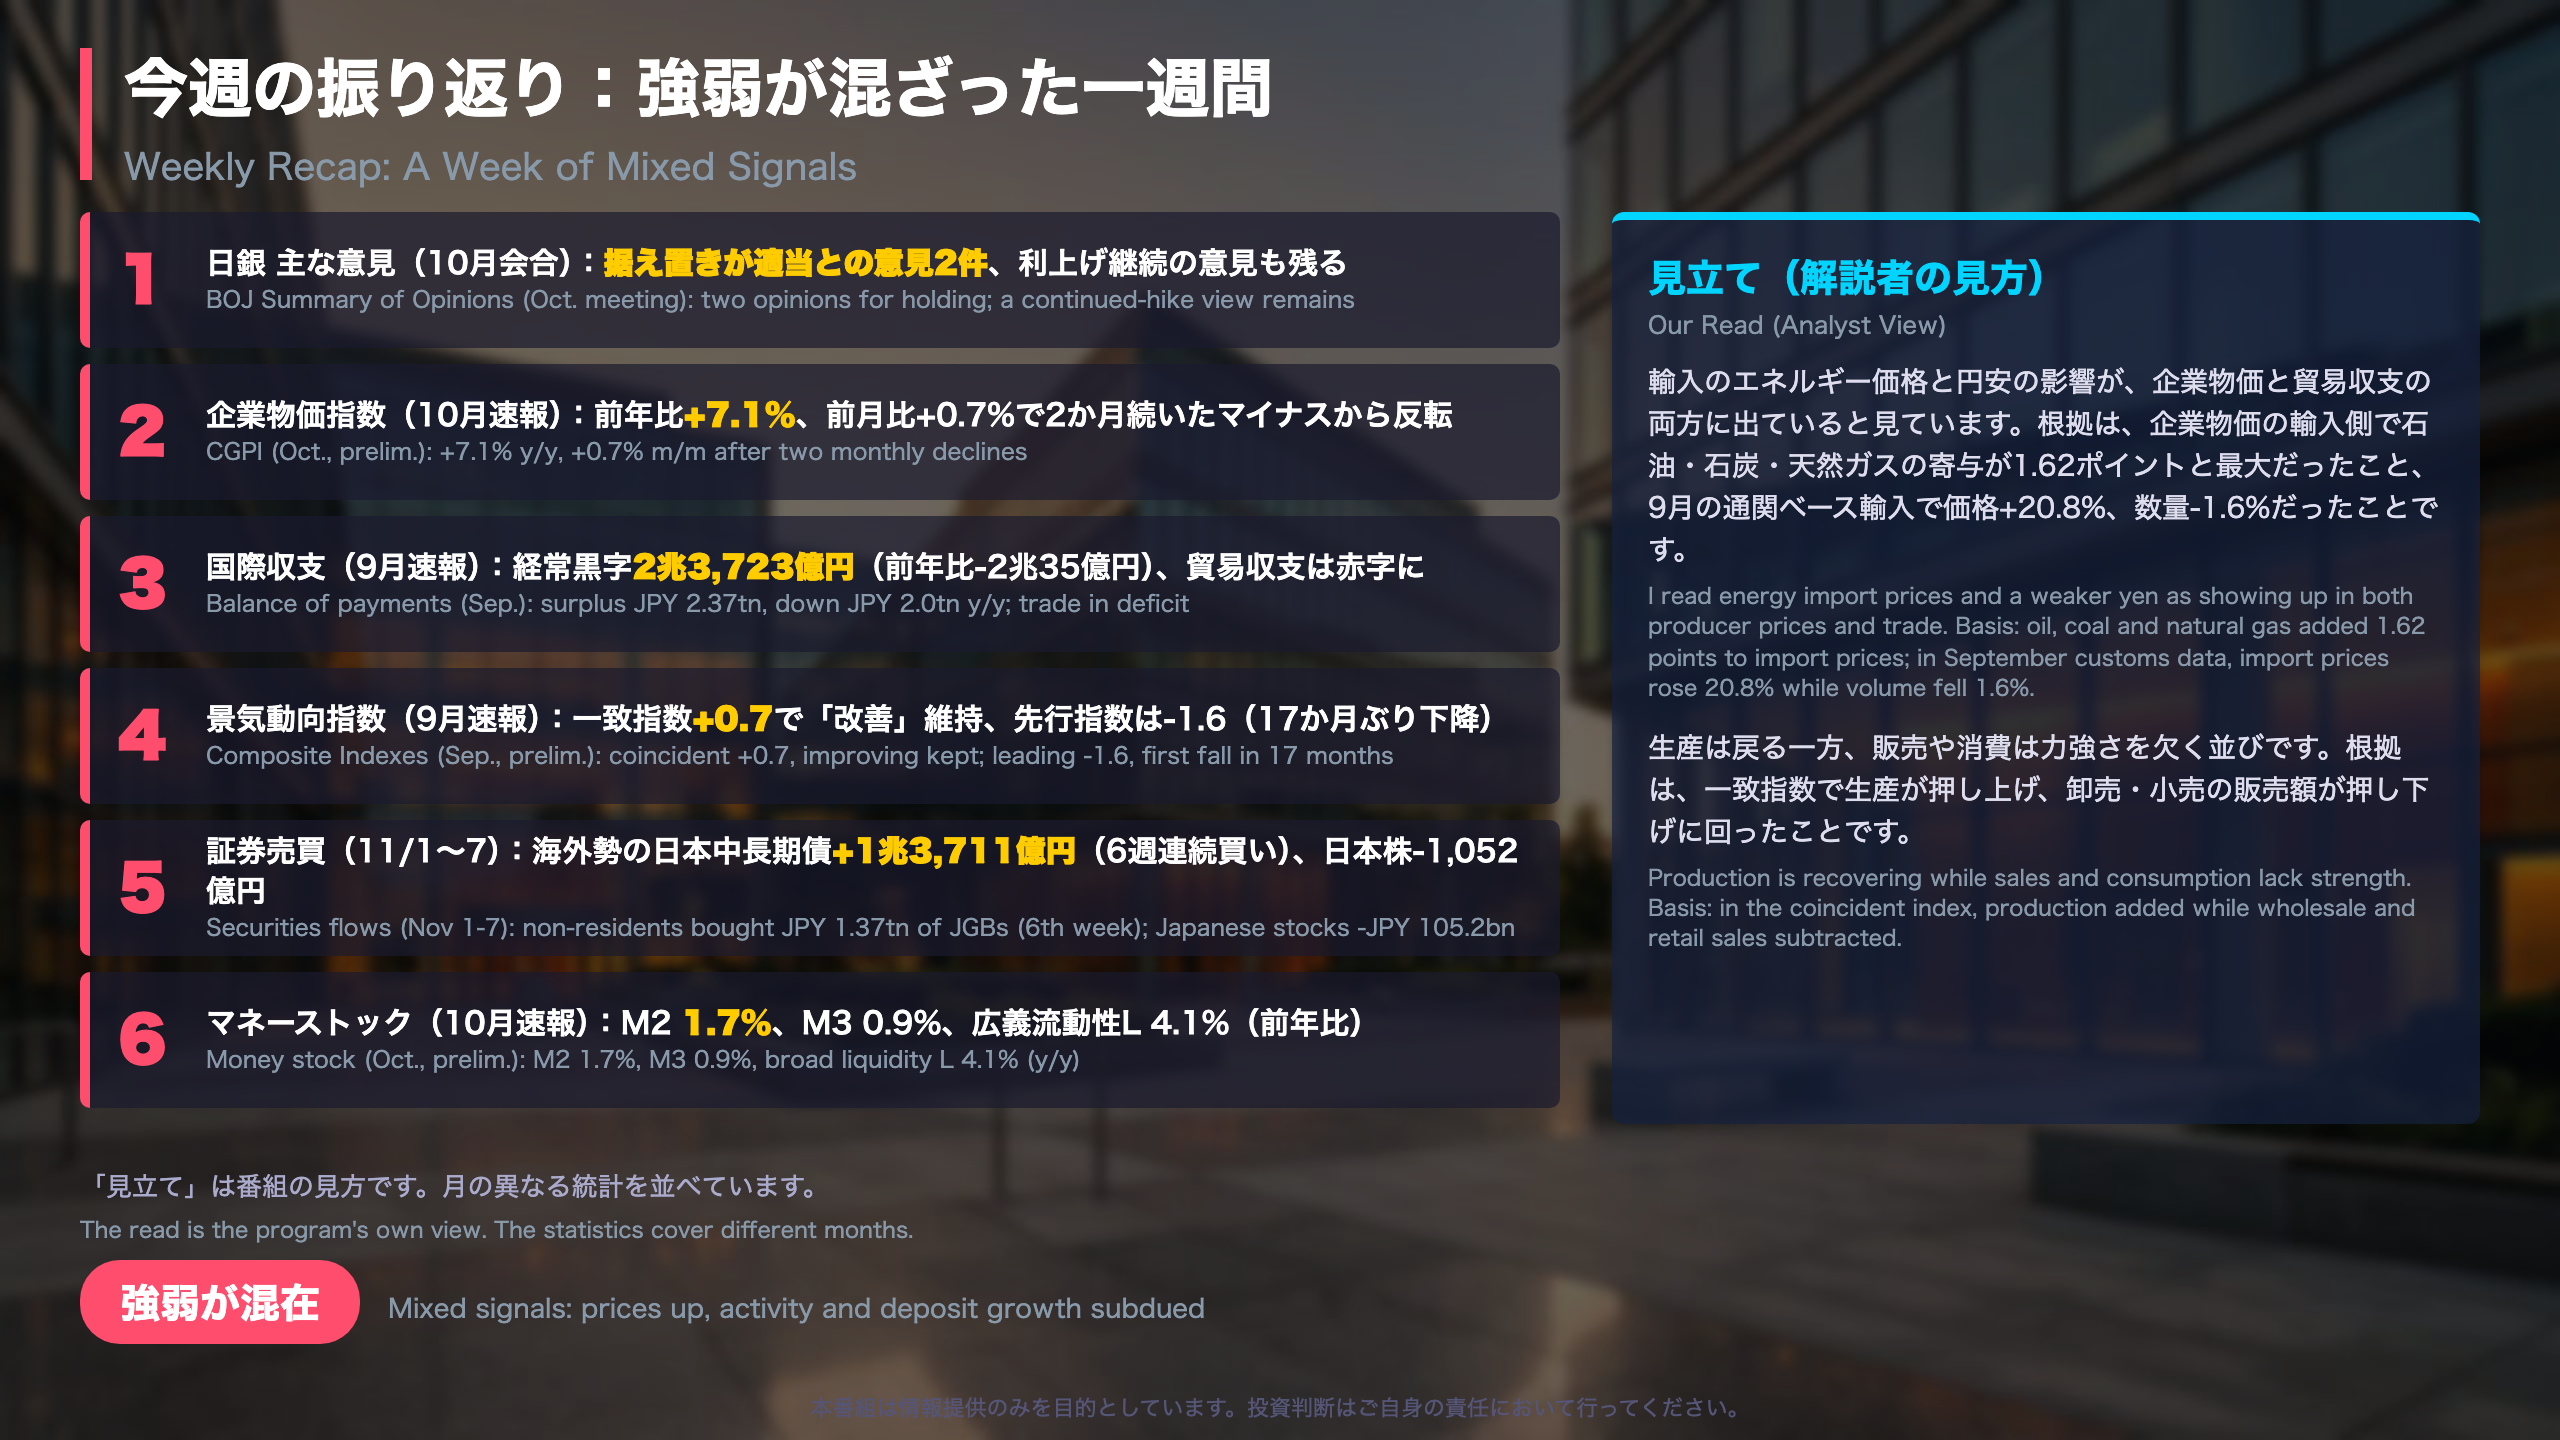
What the six releases say together
Prices and trade point the same way
In the CGPI, import prices were led by oil, coal and natural gas, which contributed 1.62 points to the import price index in October. In the balance of payments, customs data for September showed import prices up 20.8% while volumes fell 1.6%. Different months, but both point to price effects rather than demand-driven import growth. The yen was also weaker, at 158.0 per dollar in the CGPI release.
Activity is more mixed
The Cabinet Office coincident index kept its improving assessment. Production lifted it, while wholesale and retail sales pulled it down. The BOJ Summary of Opinions, an anonymous digest compiled by the Governor, said consumption lacks the strength to drive the whole economy. The leading index fell 1.6 points, its first decline in 17 months, though its three-month average is still rising.
Money and flows
- M2 growth slowed to 1.7% from a May peak of 2.5%. Broad liquidity (L) is still high at 4.1%, helped by investment trusts growing 14.2% on net inflows.
- Overseas investors bought Japanese long-term bonds for a sixth week (JPY 1.37 trillion) while selling a small amount of Japanese equities. Short-term bonds were sold, so the bond total nets out to roughly zero.
International context
Japan’s CGPI is comparable to the US PPI rather than to consumer inflation. The BOJ opinions also show a split on the pace of tightening, which is a different debate from the US one: some members see policy rates already within estimated neutral-rate ranges, while others see financial conditions as still accommodative.
Reading the data
This is a week of mixed signals, not a one-way story. Preliminary figures get revised; the September CGPI m/m change, for instance, was revised from -0.3% to -0.2%. We do not forecast markets here; we line up what the official sources published.
Disclaimer: This article is for informational purposes only. All investment decisions are made solely at your own risk.