📺 Watch the Full Video Analysis
This article was automatically generated by the NFC Market Live AI analysis system. (Updated: 2026-11-04 09:01 JST)
📄 Primary Source
日本銀行
https://www.boj.or.jp/statistics/boj/other/mb/base2609.pdf
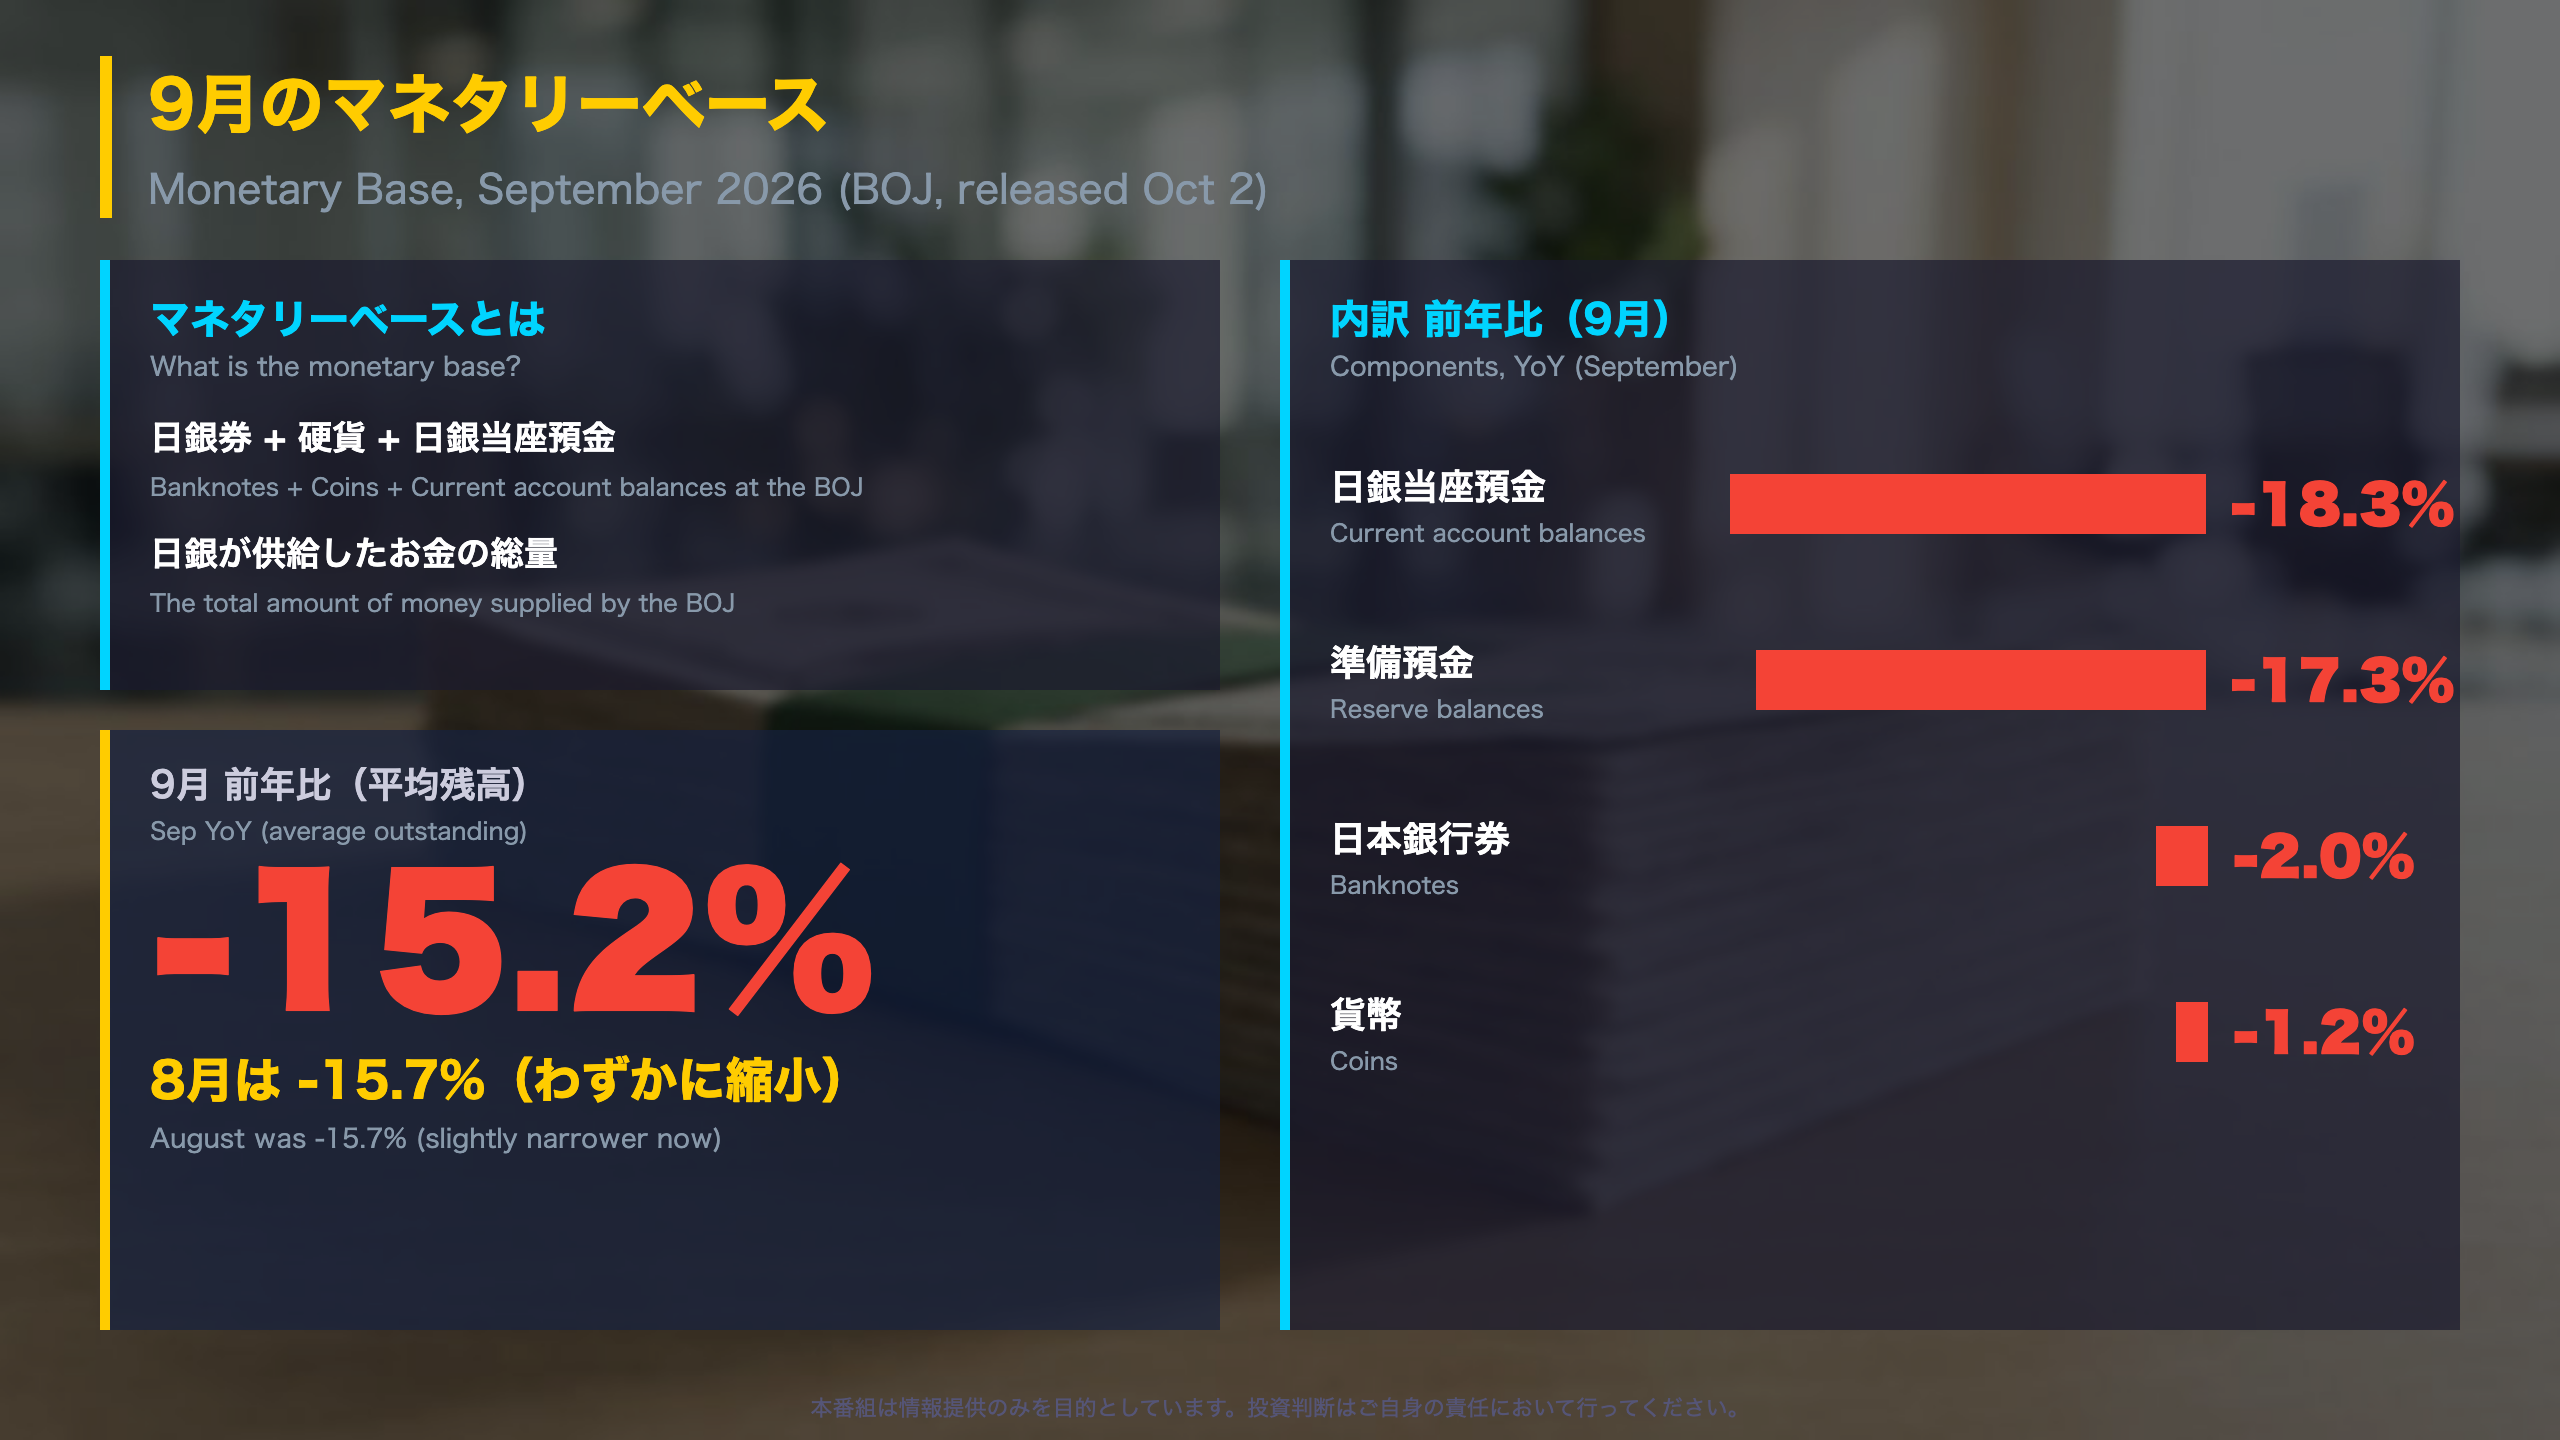
📊 The BOJ’s September monetary base (average outstanding) fell 15.2% YoY, a slightly smaller decline than August’s 15.7%.
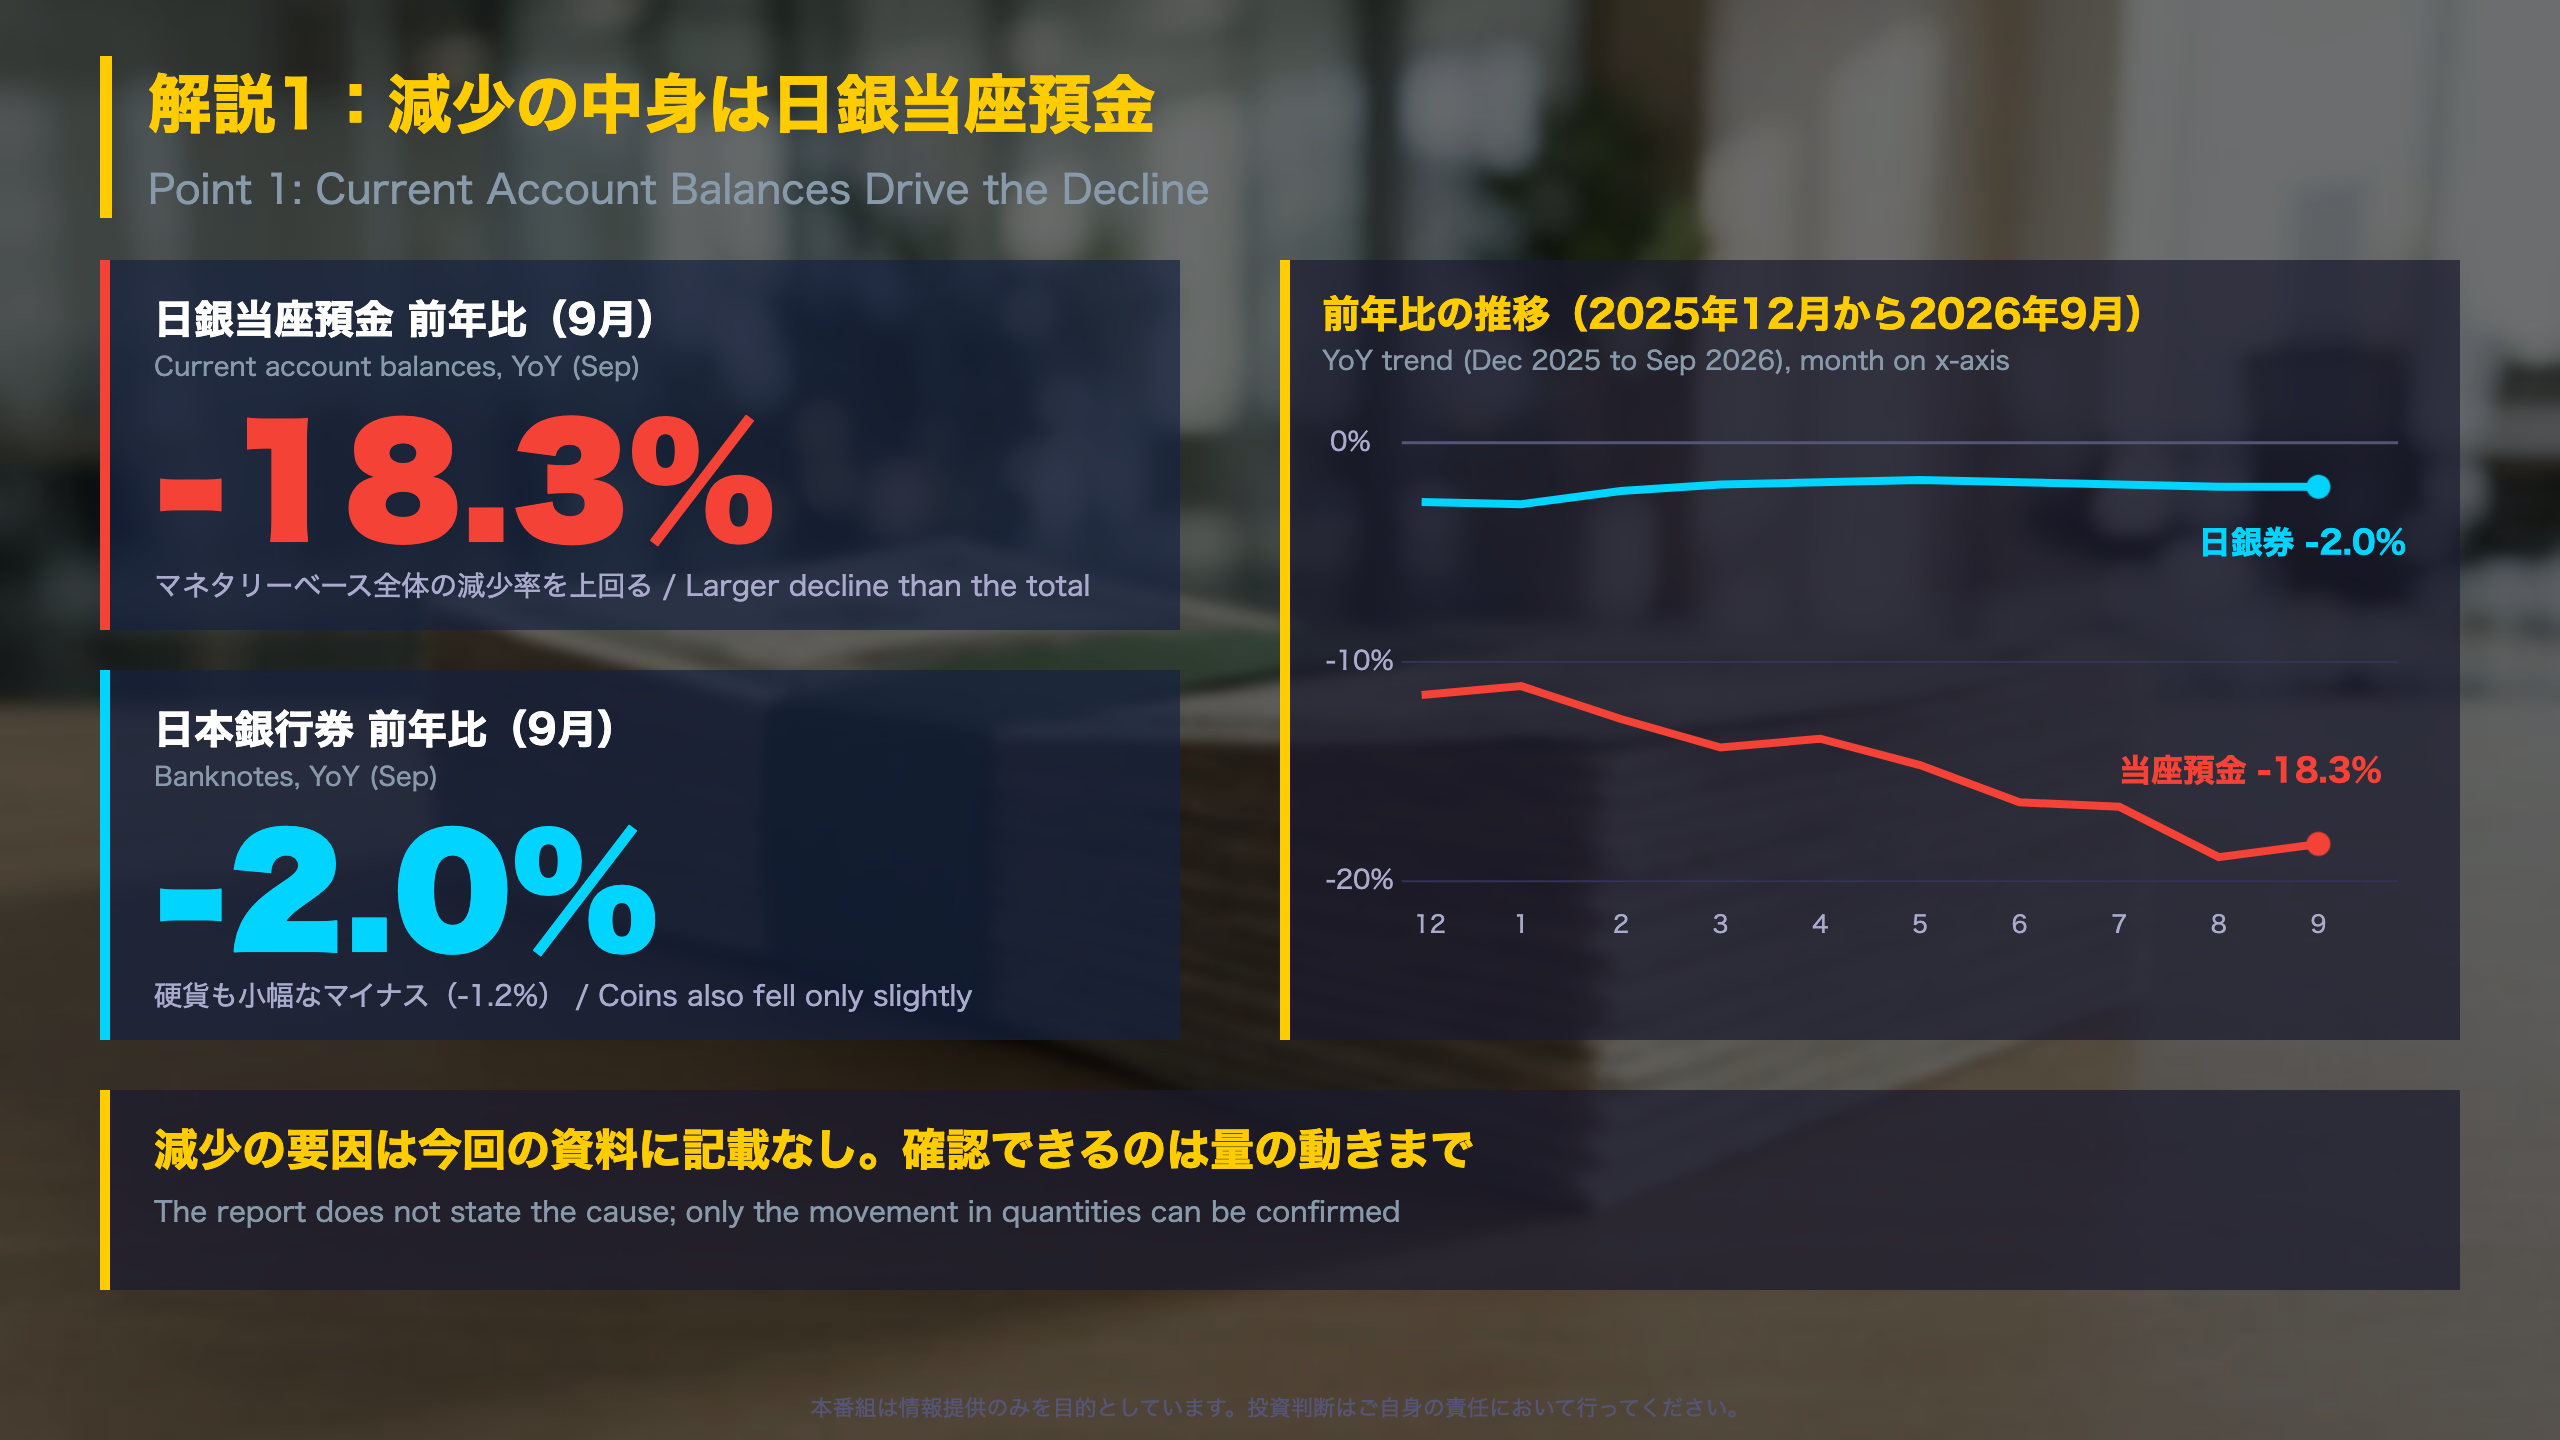
📉 Current account balances (-18.3%) drove the drop, while banknotes fell only 2.0%.
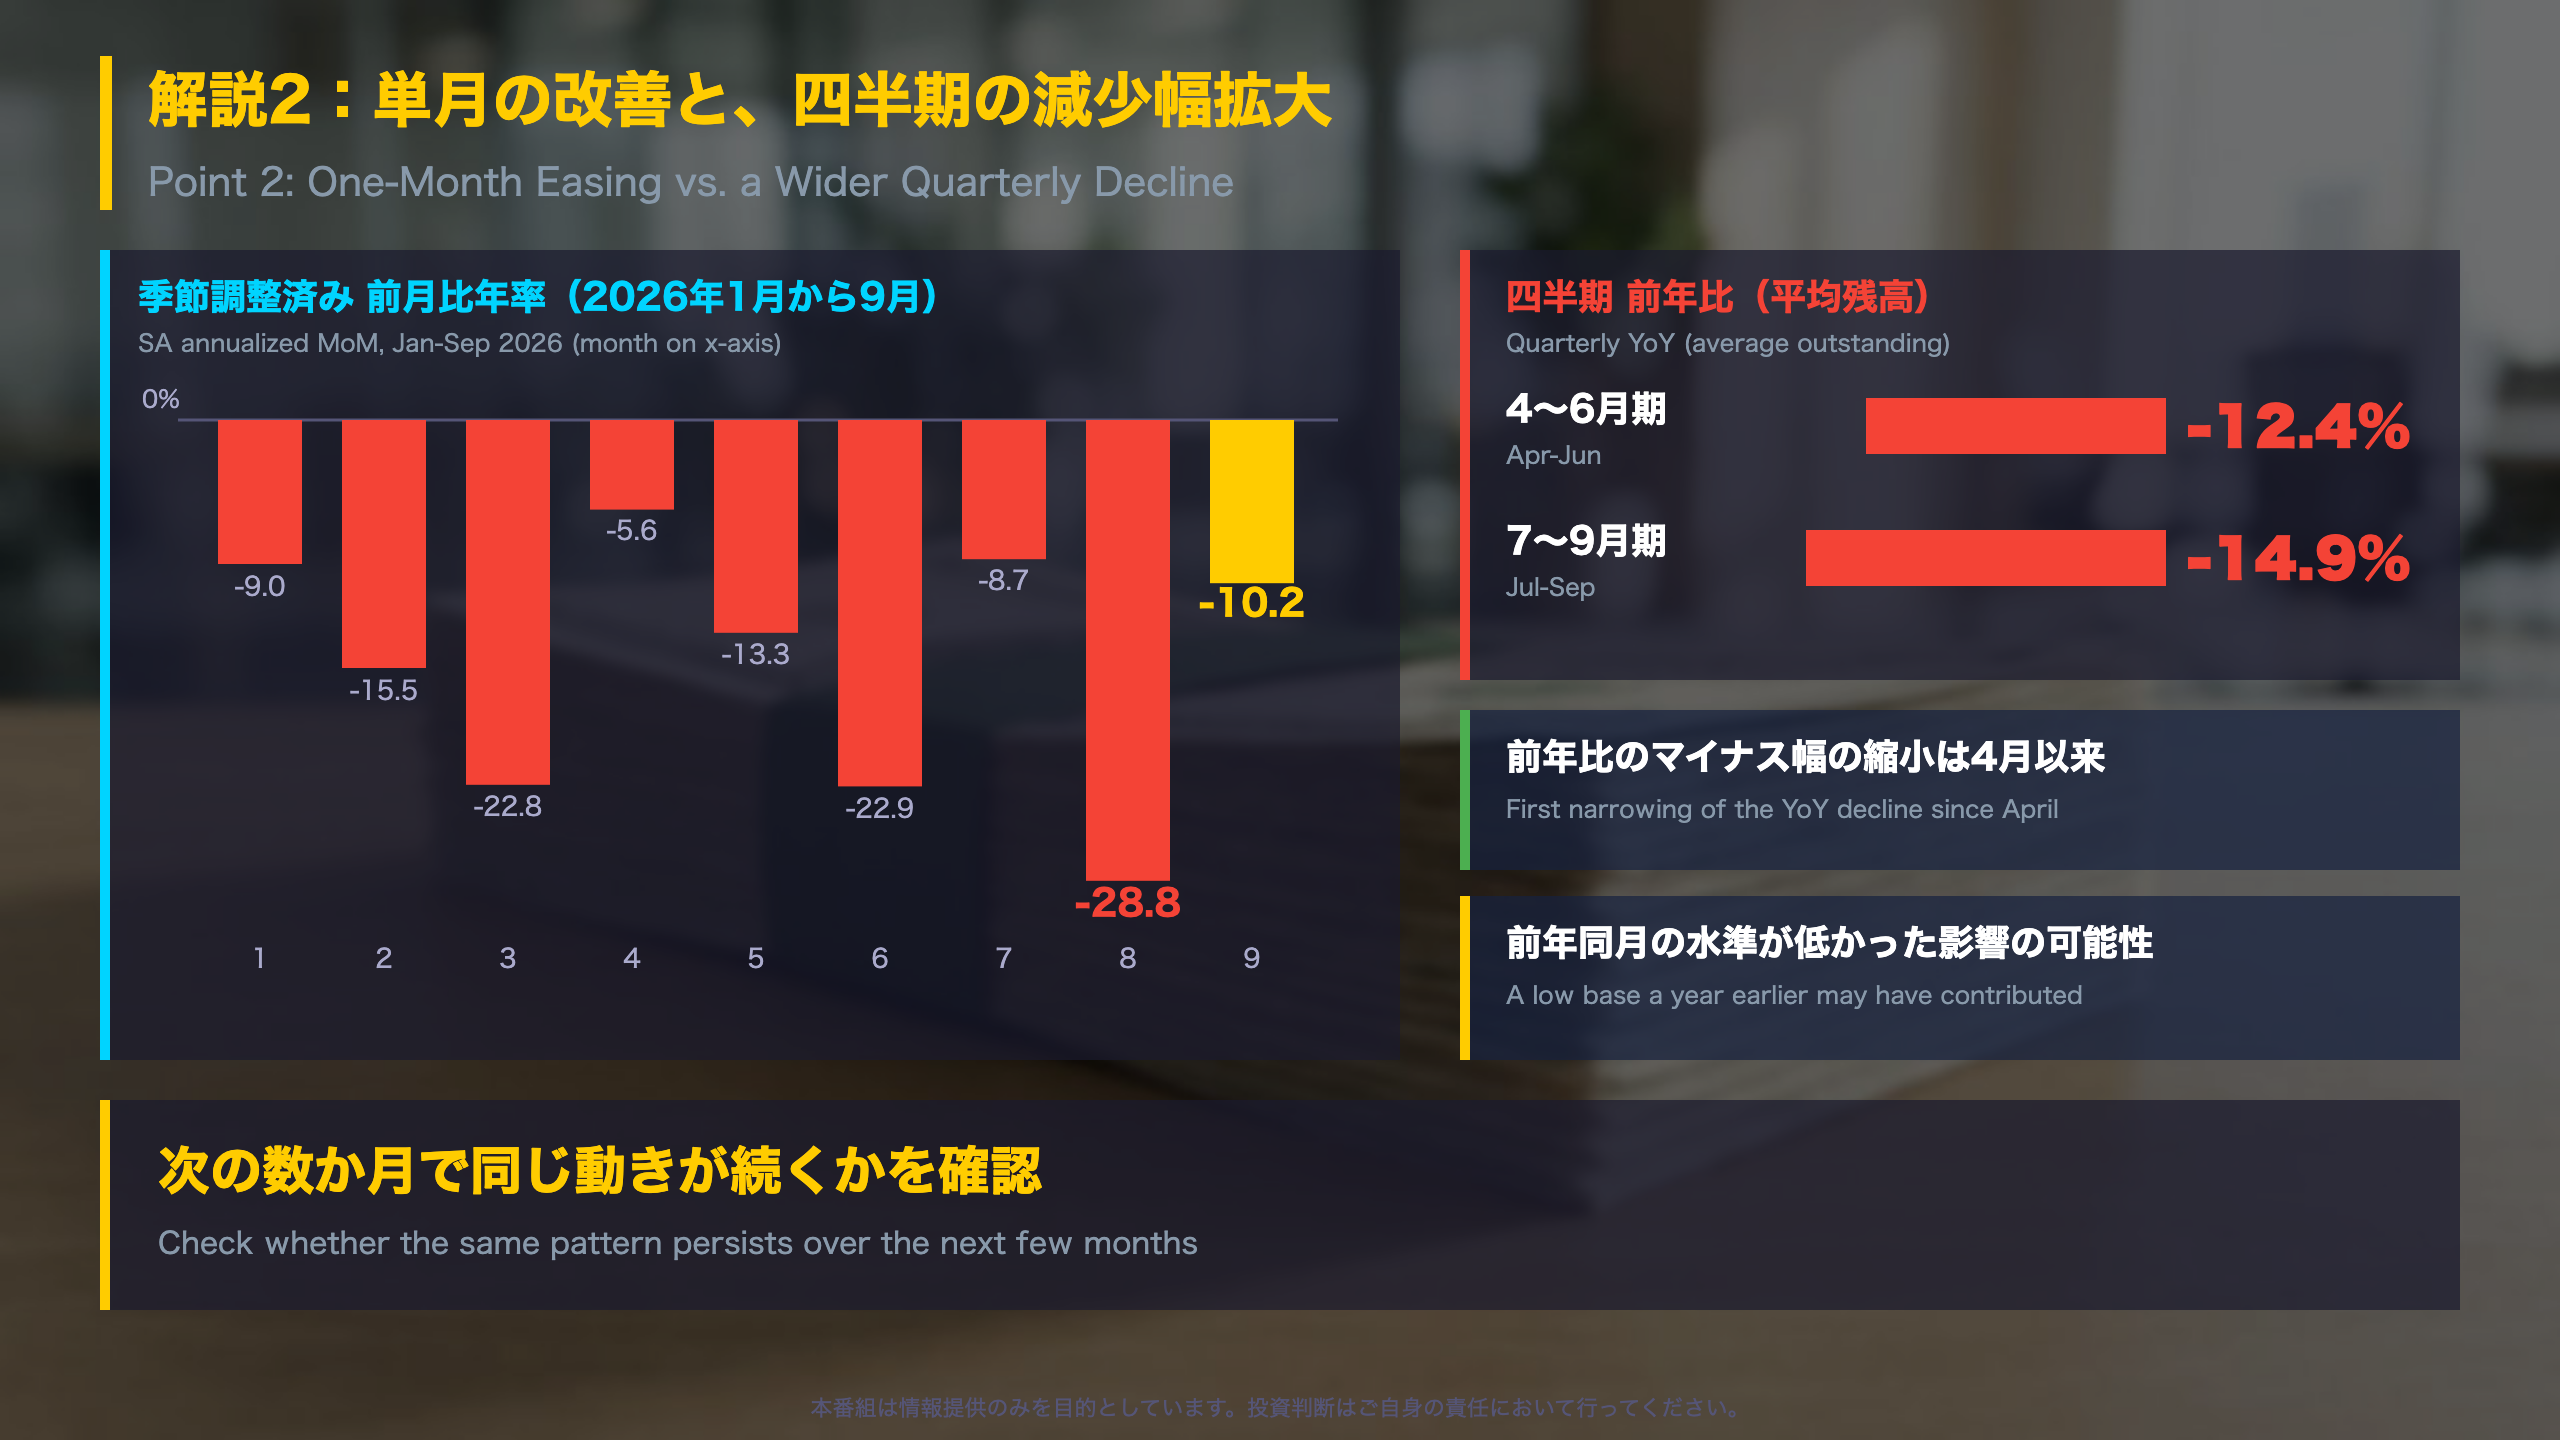
💡 Still, the Jul-Sep quarter declined 14.9% YoY, wider than Apr-Jun (-12.4%), so one month does not make a trend.
⚠️ The report shows quantities only; it gives no cause or policy judgment.
🔎 Next focus: whether the narrowing continues in October data.
サマリー:9月のマネタリーベース
What the Monetary Base Measures
The Bank of Japan (BOJ) publishes the monetary base monthly through its Research and Statistics Department. It equals banknotes in circulation + coins + current account balances that financial institutions hold at the BOJ. The closest US comparison is currency in circulation plus bank reserve balances, which the Fed reports in its weekly H.4.1 balance sheet release.
September 2026 Snapshot (released Oct 2)
- Monetary base: -15.2% YoY (average outstanding), vs -15.7% in August
- Current account balances: -18.3%; banknotes: -2.0%; coins: -1.2%
- Q3 (Jul-Sep): -14.9% YoY, vs -12.4% in Q2 and -10.6% in Q1
- Annual: +1.0% in 2024, -4.9% in 2025
How to Read It
The table shows a broad, sustained contraction since 2025, with the decline concentrated in current account balances rather than cash. September’s slightly smaller decline is the first narrowing since April, but it is a single month.
Market Context
The report has no commentary on interest rates, the yen or policy intent, so any link to JGB yields or FX lies outside what the data itself states. Investors typically cross-read this series with BOJ policy statements and money-stock data before drawing conclusions.
解説1:減少の中身は当座預金
Inside the Components
Month-on-month change in average balances (Aug to Sep)
Using the report’s average outstanding figures, the monetary base fell from 543.0 trillion yen to 532.8 trillion yen, a drop of about 10.2 trillion yen. Current account balances account for roughly 9.8 trillion yen of that (423.4 to 413.7 trillion), while banknotes fell about 0.4 trillion. These differences are our own simple arithmetic, not figures published by the BOJ.
Cash is the stable piece
Banknote growth bottomed at -2.8% YoY in January 2026, improved to -1.7% in May, and has since slipped back to -2.0%. Coins are at -1.2%. Together they move within a narrow band compared with bank deposits at the central bank.
Current account vs. reserve balances
- Current account balances: -18.9% in August, -18.3% in September
- Reserve balances (the portion subject to reserve requirements): -18.0% to -17.3%
- Month-end current account balances: 424.3 trillion yen (Aug) to 416.6 trillion yen (Sep)
Two readings
A constructive reading notes that both series narrowed from August. A cautious reading notes that the level keeps shrinking and that the structure, with deposits at the BOJ driving the total, is unchanged.
Market context
The report offers no explanation for the decline, and we do not infer one. Compared with the Fed, whose reserve balances are reported weekly, the BOJ series here is monthly, so short-term swings are smoothed in averages but remain visible in the month-end data.
解説2:勢いの変化と四半期の動き
Checking Momentum with the Numbers
What the “annualized” figure means
The BOJ’s column (a) shows seasonally adjusted percent changes at an annualized rate from the previous period. Annualizing multiplies a one-month change into a yearly pace, which exaggerates month-to-month noise. This is similar to how the US reports quarterly GDP at an annualized rate, but here it is applied to a monthly series.
2026 monthly path
Jan -9.0%, Feb -15.5%, Mar -22.8%, Apr -5.6%, May -13.3%, Jun -22.9%, Jul -8.7%, Aug -28.8%, Sep -10.2%. September’s improvement is therefore comparable to July’s, and the series has repeatedly bounced within a wide range.
Quarterly trend
YoY declines have widened for six straight quarters: -3.9% (Q2 2025), -4.7%, -8.7%, -10.6%, -12.4%, and -14.9% (Q3 2026).
Base effect
In September 2025 the YoY rate dropped from -4.1% to -6.2%. A lower level then may have made the September 2026 comparison easier. This is a possibility drawn from single-month data, not a confirmed cause.
Two readings
The optimistic reading stresses that both the YoY and annualized rates improved from August. The cautious reading stresses the wider quarterly decline and large monthly swings.
Market context
The release gives no guidance on rates or the yen. A practical threshold is whether October’s YoY decline stays narrower than September’s -15.2% or reverts beyond August’s -15.7%.
質疑で深める:量の減少をどう読むか

What This Release Can and Cannot Tell Us
| Can be confirmed | Not stated in the report |
|---|---|
| Average balances and YoY rates of banknotes, coins and current accounts | Why current account balances fell |
| Monthly and quarterly YoY paths | The BOJ’s policy stance or next steps |
| Seasonally adjusted annualized MoM rate | Effects on rates or the yen |
Why policy needs other sources
The monetary base measures the quantity of funds the BOJ has supplied. It differs from a policy rate, which is a price. In the US, analysts likewise separate the size of the Fed’s balance sheet from the federal funds rate. The BOJ’s policy direction is communicated in its post-meeting statements and outlook reports, not in this statistical release.
Observable checkpoints for the October data
- If the YoY decline is smaller than September’s -15.2%, that would be a second straight narrowing.
- If it exceeds August’s -15.7%, September may prove to have been a swing.
Two readings
The constructive view stresses that YoY and annualized rates both improved from August. The cautious view stresses the wider quarterly decline (-12.4% to -14.9%) and large monthly swings. Both rest on the data; neither is clearly superior yet.
Market context
We do not infer rate or FX direction from this release, because the report itself makes no such link. For investors, the practical step is to read it alongside BOJ statements and JGB market data.
Disclaimer: This article is for informational purposes only. All investment decisions are made solely at your own risk.